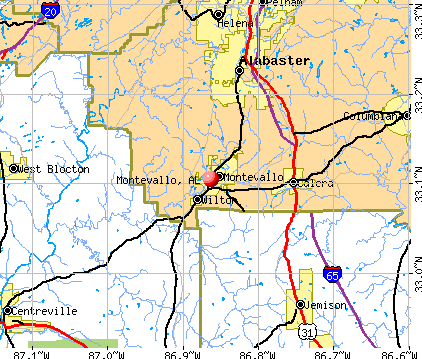
Montevallo, Alabama
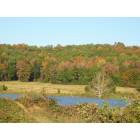
Montevallo: fall colors ballard lake
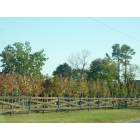
Montevallo: nursery
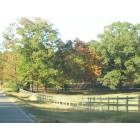
Montevallo: fall colors ballard lake
- add
your
Submit your own pictures of this city and show them to the world
- OSM Map
- General Map
- Google Map
- MSN Map
Population change since 2000: +58.3%
| Males: 3,234 | |
| Females: 4,403 |
| Median resident age: | 25.5 years |
| Alabama median age: | 39.6 years |
Zip codes: 35115.
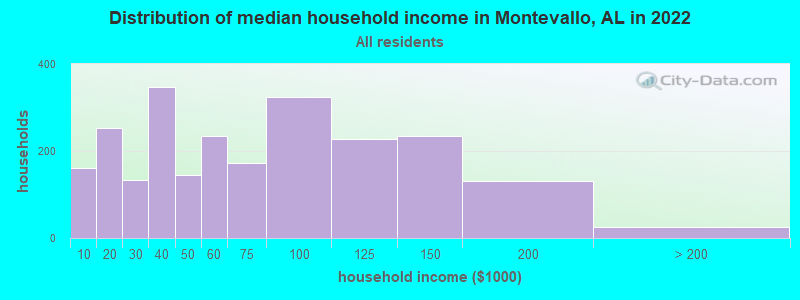
| Montevallo: | $61,235 |
| AL: | $59,674 |
Estimated per capita income in 2022: $23,604 (it was $16,468 in 2000)
Montevallo city income, earnings, and wages data
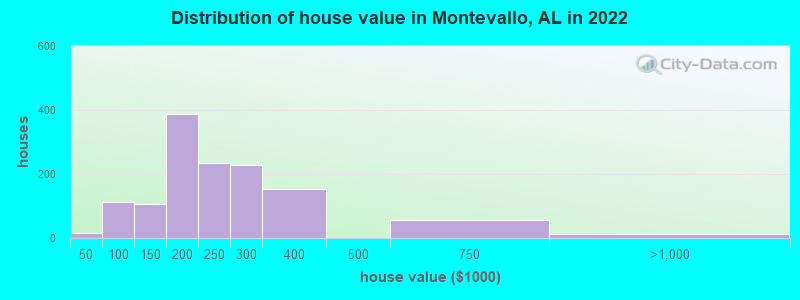
Estimated median house or condo value in 2022: $220,415 (it was $89,800 in 2000)
| Montevallo: | $220,415 |
| AL: | $200,900 |
Mean prices in 2022: all housing units: $225,899; detached houses: $234,672; mobile homes: $62,319
Median gross rent in 2022: $990.
(9.6% for White Non-Hispanic residents, 20.7% for Black residents, 19.1% for Hispanic or Latino residents, 25.0% for American Indian residents, 61.1% for two or more races residents)
Detailed information about poverty and poor residents in Montevallo, AL

Compare current foreclosures in Montevallo, AL:
| Photo | Address | Area | Beds / Baths | Price | Details |
|---|---|---|---|---|---|

|
#1
Highway 10
Montevallo, AL 35115
|
990 sq. feet
|
2 baths 3 beds |
show details | |

|
#2
Pilgrim Ln
Montevallo, AL 35115
|
- sq. feet
|
2 baths 3 beds |
show details | |

|
#3
Waterstone Drive
Montevallo, AL 35115
|
2,305 sq. feet
|
3 baths - beds |
show details | |

|
#4
Selma Rd
Montevallo, AL 35115
|
- sq. feet
|
- baths - beds |
show details | |

|
#5
Grant St # 7
Montevallo, AL 35115
|
- sq. feet
|
- baths - beds |
show details | |

|
#6
Discovery Dr
Montevallo, AL 35115
|
- sq. feet
|
- baths - beds |
show details | |

|
#7
Moores Spring Rd
Montevallo, AL 35115
|
- sq. feet
|
- baths - beds |
show details | |

|
#8
Highway 18 Lot 2
Montevallo, AL 35115
|
- sq. feet
|
- baths - beds |
show details | |

|
#9
Hidden Forest Cv
Montevallo, AL 35115
|
- sq. feet
|
- baths - beds |
show details | |

|
#10
Middle St
Montevallo, AL 35115
|
- sq. feet
|
- baths - beds |
show details |
| Photo | Address | Area | Beds / Baths | Price | Details |
|---|---|---|---|---|---|

|
#11
Skyview Dr
Montevallo, AL 35115
|
- sq. feet
|
- baths - beds |
show details | |

|
#12
County Road 727
Montevallo, AL 35115
|
825 sq. feet
|
- baths - beds |
show details | |

|
#13
Waterstone Way
Montevallo, AL 35115
|
- sq. feet
|
- baths - beds |
show details | |

|
#14
Skyview Dr
Montevallo, AL 35115
|
- sq. feet
|
- baths - beds |
show details | |

|
#15
Hillcrest Dr
Montevallo, AL 35115
|
- sq. feet
|
- baths - beds |
show details | |

|
#16
Waterstone Dr
Montevallo, AL 35115
|
- sq. feet
|
- baths - beds |
show details | |

|
#17
County Road 73
Montevallo, AL 35115
|
- sq. feet
|
- baths - beds |
show details | |

|
#18
Depot St
Montevallo, AL 35115
|
- sq. feet
|
- baths - beds |
show details | |

|
#19
Diamond Ln
Montevallo, AL 35115
|
- sq. feet
|
- baths - beds |
show details | |

|
#20
Hidden Trace Ct
Montevallo, AL 35115
|
- sq. feet
|
- baths - beds |
show details |
| Photo | Address | Area | Beds / Baths | Price | Details |
|---|---|---|---|---|---|

|
#21
Cobblestone Ln
Montevallo, AL 35115
|
- sq. feet
|
- baths - beds |
show details | |

|
#22
Skyview Dr # 311
Montevallo, AL 35115
|
- sq. feet
|
- baths - beds |
show details | |

|
#23
Cherokee St Apt G
Montevallo, AL 35115
|
- sq. feet
|
- baths - beds |
show details | |

|
#24
Montevallo Villa Ct Apt E2
Montevallo, AL 35115
|
- sq. feet
|
- baths - beds |
show details | |

|
#25
County Road 879
Montevallo, AL 35115
|
- sq. feet
|
- baths - beds |
show details | |

|
#26
County Road 866
Montevallo, AL 35115
|
- sq. feet
|
- baths - beds |
show details | |

|
#27
Waterstone Dr
Montevallo, AL 35115
|
- sq. feet
|
- baths - beds |
show details | |

|
#28
Michelle Mnr
Montevallo, AL 35115
|
- sq. feet
|
- baths - beds |
show details | |

|
#29
Spring Creek Rd
Montevallo, AL 35115
|
- sq. feet
|
- baths - beds |
show details | |

|
#30
Highway 119 # B
Montevallo, AL 35115
|
- sq. feet
|
- baths - beds |
show details |
| Photo | Address | Area | Beds / Baths | Price | Details |
|---|---|---|---|---|---|

|
#31
County Road 1012
Montevallo, AL 35115
|
- sq. feet
|
- baths - beds |
show details | |

|
#32
Island St Apt 3
Montevallo, AL 35115
|
- sq. feet
|
- baths - beds |
show details | |

|
#33
Leonards Ct
Montevallo, AL 35115
|
- sq. feet
|
- baths - beds |
show details | |

|
#34
County Road 1012
Montevallo, AL 35115
|
- sq. feet
|
- baths - beds |
show details | |

|
#35
Hidden Valley Dr
Montevallo, AL 35115
|
- sq. feet
|
- baths - beds |
show details | |

|
#36
Highway 17
Montevallo, AL 35115
|
- sq. feet
|
- baths - beds |
show details | |

|
#37
County Road 127
Montevallo, AL 35115
|
- sq. feet
|
- baths - beds |
show details | |

|
#38
Dallas Ln
Montevallo, AL 35115
|
- sq. feet
|
- baths - beds |
show details | |

|
#39
Highway 18 Lot 4
Montevallo, AL 35115
|
- sq. feet
|
- baths - beds |
show details | |

|
#40
Mullberry St
Montevallo, AL 35115
|
- sq. feet
|
- baths - beds |
show details |
| Photo | Address | Area | Beds / Baths | Price | Details |
|---|---|---|---|---|---|

|
#41
Pilgrim Ln
Montevallo, AL 35115
|
- sq. feet
|
- baths - beds |
show details | |

|
#42
Highway 155
Montevallo, AL 35115
|
- sq. feet
|
- baths - beds |
show details | |

|
#43
Monte Verde Ln
Montevallo, AL 35115
|
- sq. feet
|
- baths - beds |
show details | |

|
#44
County Road 125
Montevallo, AL 35115
|
- sq. feet
|
- baths - beds |
show details | |

|
#45
County 857, Apartment D-1
Montevallo, AL 35115
|
- sq. feet
|
- baths - beds |
show details | |

|
#46
Cobblestone Ln
Montevallo, AL 35115
|
- sq. feet
|
- baths - beds |
show details | |

|
#47
Highway 200
Montevallo, AL 35115
|
- sq. feet
|
- baths - beds |
show details | |

|
#48
Waterstone Ln
Montevallo, AL 35115
|
- sq. feet
|
- baths - beds |
show details | |

|
#49
E Boundary St
Montevallo, AL 35115
|
- sq. feet
|
- baths - beds |
show details | |

|
Check over 1 million property listings on Foreclosure.com!
|
browse all offers | |||


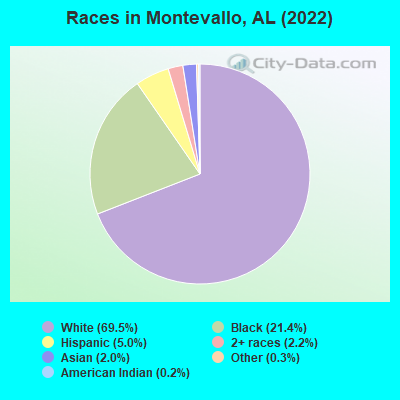
- 5,20369.5%White alone
- 1,60121.4%Black alone
- 3765.0%Hispanic
- 1652.2%Two or more races
- 1502.0%Asian alone
- 200.3%Other race alone
- 150.2%American Indian alone
According to our research of Alabama and other state lists, there were 31 registered sex offenders living in Montevallo, Alabama as of May 16, 2024.
The ratio of all residents to sex offenders in Montevallo is 215 to 1.
Type |
2009 |
2010 |
2011 |
2012 |
2013 |
2014 |
2015 |
2016 |
2017 |
2018 |
2019 |
2020 |
2021 |
2022 |
|---|---|---|---|---|---|---|---|---|---|---|---|---|---|---|
| Murders (per 100,000) | 0 (0.0) | 0 (0.0) | 1 (15.7) | 0 (0.0) | 0 (0.0) | 0 (0.0) | 0 (0.0) | 0 (0.0) | 1 (14.7) | 0 (0.0) | 0 (0.0) | 0 (0.0) | 0 (0.0) | 0 (0.0) |
| Rapes (per 100,000) | 0 (0.0) | 1 (15.8) | 2 (31.5) | 1 (15.6) | 4 (61.5) | 2 (30.1) | 2 (30.0) | 3 (44.7) | 4 (58.9) | 3 (44.9) | 3 (44.6) | 1 (14.7) | 1 (13.9) | 0 (0.0) |
| Robberies (per 100,000) | 2 (30.9) | 3 (47.4) | 11 (173.1) | 2 (31.1) | 3 (46.1) | 7 (105.4) | 4 (59.9) | 3 (44.7) | 4 (58.9) | 2 (29.9) | 2 (29.8) | 2 (29.5) | 0 (0.0) | 0 (0.0) |
| Assaults (per 100,000) | 6 (92.8) | 11 (174.0) | 13 (204.6) | 20 (311.1) | 8 (123.0) | 16 (240.9) | 19 (284.6) | 8 (119.1) | 12 (176.7) | 15 (224.5) | 8 (119.0) | 4 (59.0) | 11 (153.2) | 7 (93.1) |
| Burglaries (per 100,000) | 53 (819.3) | 19 (300.5) | 36 (566.7) | 49 (762.2) | 54 (830.4) | 40 (602.3) | 27 (404.5) | 24 (357.4) | 30 (441.6) | 26 (389.0) | 18 (267.9) | 9 (132.7) | 13 (181.1) | 14 (186.2) |
| Thefts (per 100,000) | 124 (1,917) | 187 (2,957) | 145 (2,282) | 127 (1,975) | 156 (2,399) | 106 (1,596) | 112 (1,678) | 121 (1,802) | 114 (1,678) | 75 (1,122) | 52 (773.8) | 29 (427.5) | 67 (933.3) | 57 (758.3) |
| Auto thefts (per 100,000) | 4 (61.8) | 11 (174.0) | 10 (157.4) | 10 (155.5) | 9 (138.4) | 8 (120.5) | 9 (134.8) | 4 (59.6) | 10 (147.2) | 4 (59.9) | 6 (89.3) | 6 (88.4) | 8 (111.4) | 2 (26.6) |
| Arson (per 100,000) | 0 (0.0) | 0 (0.0) | 1 (15.7) | 0 (0.0) | 1 (15.4) | 0 (0.0) | 0 (0.0) | 0 (0.0) | 0 (0.0) | 0 (0.0) | 0 (0.0) | 0 (0.0) | 0 (0.0) | 3 (39.9) |
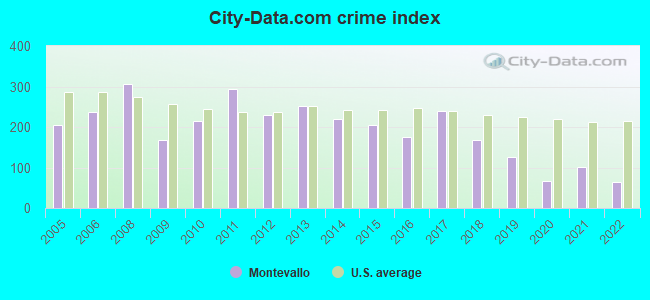
| City-Data.com crime index | 166.8 | 214.9 | 293.1 | 228.8 | 252.8 | 219.5 | 205.1 | 174.8 | 239.4 | 166.7 | 125.3 | 65.9 | 100.7 | 64.1 |
The City-Data.com crime index weighs serious crimes and violent crimes more heavily. Higher means more crime, U.S. average is 246.1. It adjusts for the number of visitors and daily workers commuting into cities.
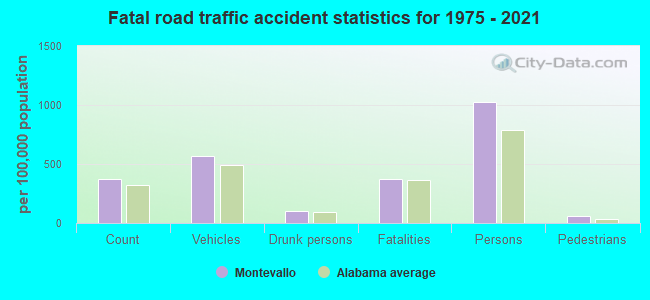
Crime rate in Montevallo detailed stats: murders, rapes, robberies, assaults, burglaries, thefts, arson
Full-time law enforcement employees in 2021, including police officers: 21 (17 officers - 17 male; 0 female).
| Officers per 1,000 residents here: | 2.37 |
| Alabama average: | 2.40 |
 Recent articles from our blog. Our writers, many of them Ph.D. graduates or candidates, create easy-to-read articles on a wide variety of topics.

 | New York Times Article comparing Birmingham and Nashville (121 replies) |
| Discussion Thread (128 replies) |
| Cool News (2566 replies) |
| UPDATED: New and Upcoming Projects. (3756 replies) |
| Restaurants in Montevallo? (1 reply) |
| Working Remotely from B’ham (27 replies) |
Latest news from Montevallo, AL collected exclusively by city-data.com from local newspapers, TV, and radio stations
Ancestries: American (26.1%), English (13.0%), British (5.9%), Irish (3.4%), German (2.2%), European (1.9%).
Current Local Time: CST time zone
Elevation: 430 feet
Land area: 7.56 square miles.
Population density: 1,011 people per square mile (low).
435 residents are foreign born (3.2% Latin America, 1.6% Asia, 0.9% Europe).
| This city: | 5.8% |
| Alabama: | 3.5% |
Median real estate property taxes paid for housing units with mortgages in 2022: $917 (0.4%)
Median real estate property taxes paid for housing units with no mortgage in 2022: $707 (0.4%)
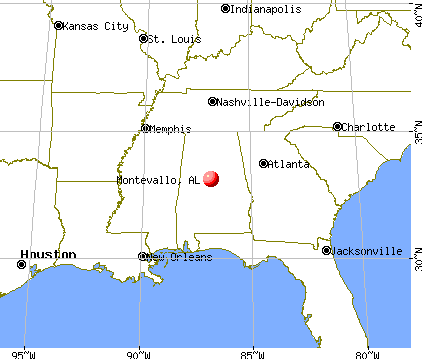
Nearest city with pop. 50,000+: Hoover, AL  (19.8 miles , pop. 62,742).
Nearest city with pop. 200,000+: Birmingham, AL (29.2 miles , pop. 242,820).
Nearest city with pop. 1,000,000+: Houston, TX (553.2 miles , pop. 1,953,631).
Nearest cities:
), ), ), Latitude: 33.10 N, Longitude: 86.86 W
Daytime population change due to commuting: -607 (-8.1%)
Workers who live and work in this city: 1,166 (32.9%)
Area code: 205
Montevallo, Alabama accommodation & food services, waste management - Economy and Business Data
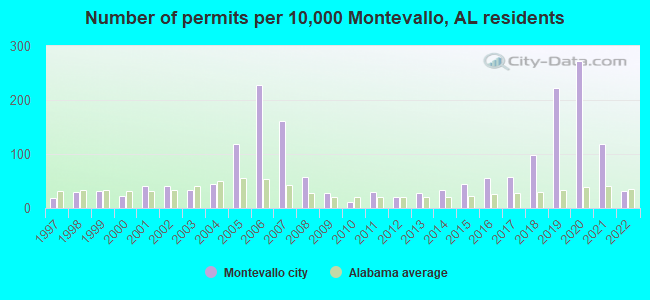
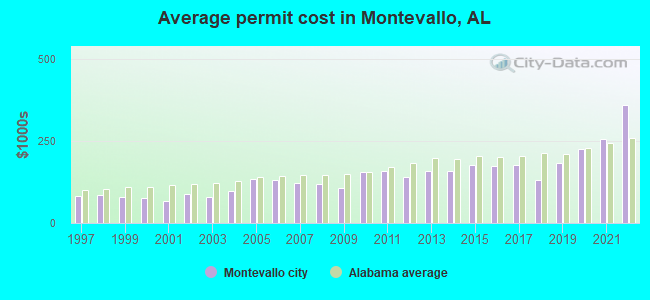
Single-family new house construction building permits:
- 2022: 15 buildings, average cost: $359,400
- 2021: 57 buildings, average cost: $254,700
- 2020: 131 buildings, average cost: $224,400
- 2019: 107 buildings, average cost: $183,300
- 2018: 48 buildings, average cost: $131,400
- 2017: 28 buildings, average cost: $176,600
- 2016: 27 buildings, average cost: $172,600
- 2015: 21 buildings, average cost: $176,100
- 2014: 16 buildings, average cost: $157,600
- 2013: 13 buildings, average cost: $157,800
- 2012: 10 buildings, average cost: $140,000
- 2011: 14 buildings, average cost: $157,600
- 2010: 6 buildings, average cost: $155,300
- 2009: 13 buildings, average cost: $105,200
- 2008: 28 buildings, average cost: $118,300
- 2007: 78 buildings, average cost: $120,900
- 2006: 110 buildings, average cost: $129,700
- 2005: 57 buildings, average cost: $135,000
- 2004: 21 buildings, average cost: $96,100
- 2003: 16 buildings, average cost: $79,300
- 2002: 20 buildings, average cost: $86,500
- 2001: 20 buildings, average cost: $67,400
- 2000: 11 buildings, average cost: $75,800
- 1999: 15 buildings, average cost: $77,500
- 1998: 14 buildings, average cost: $85,900
- 1997: 9 buildings, average cost: $80,900
| Here: | 1.9% |
| Alabama: | 2.6% |
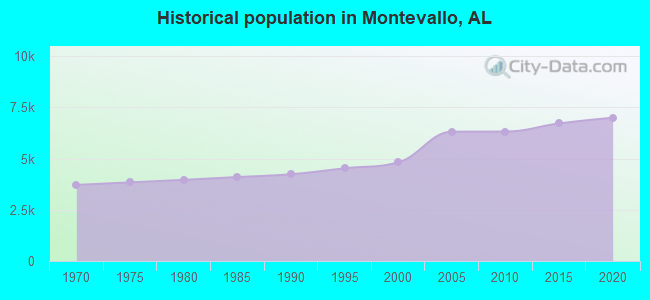
Population change in the 1990s: +595 (+14.1%).
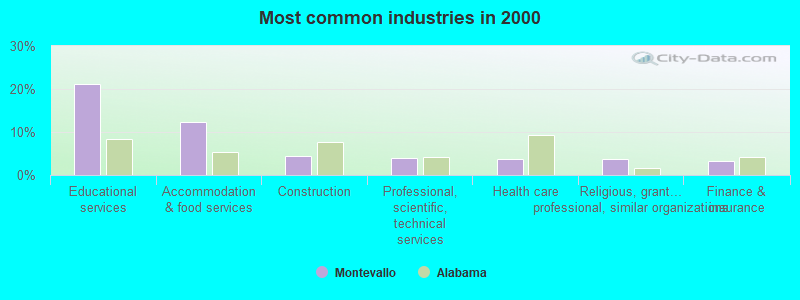
- Educational services (21.2%)
- Accommodation & food services (12.4%)
- Construction (4.4%)
- Professional, scientific, technical services (3.9%)
- Health care (3.7%)
- Religious, grantmaking, civic, professional, similar organizations (3.6%)
- Finance & insurance (3.3%)
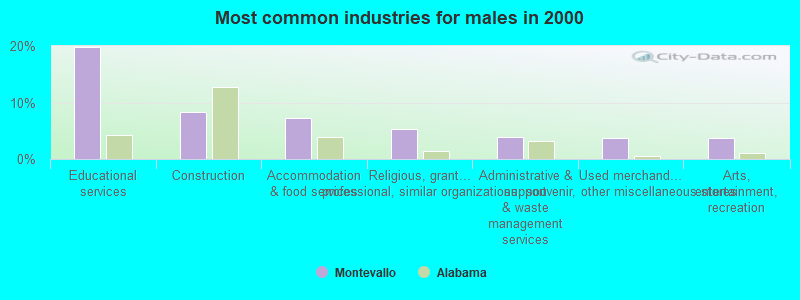
- Educational services (19.8%)
- Construction (8.3%)
- Accommodation & food services (7.2%)
- Religious, grantmaking, civic, professional, similar organizations (5.4%)
- Administrative & support & waste management services (4.0%)
- Used merchandise, gift, novelty, souvenir, other miscellaneous stores (3.8%)
- Arts, entertainment, recreation (3.7%)
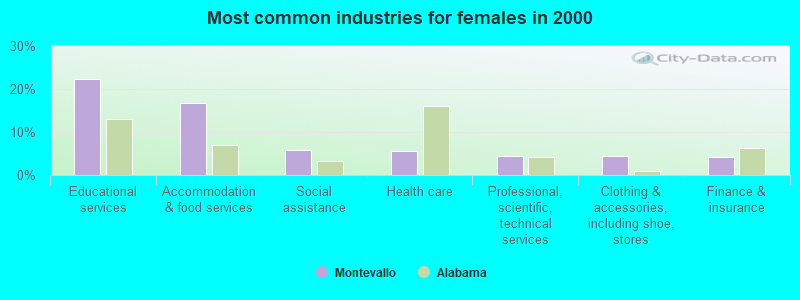
- Educational services (22.3%)
- Accommodation & food services (16.7%)
- Social assistance (5.8%)
- Health care (5.5%)
- Professional, scientific, technical services (4.5%)
- Clothing & accessories, including shoe, stores (4.3%)
- Finance & insurance (4.2%)
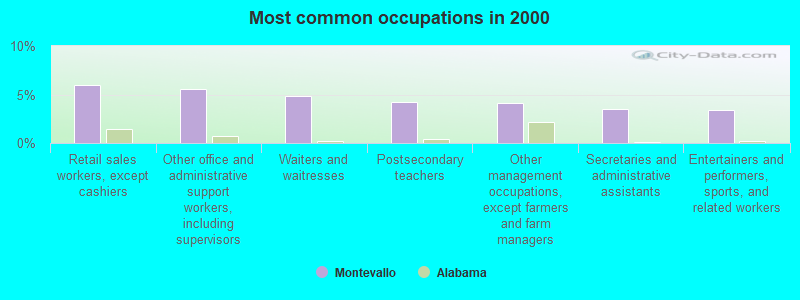
- Retail sales workers, except cashiers (5.9%)
- Other office and administrative support workers, including supervisors (5.5%)
- Waiters and waitresses (4.8%)
- Postsecondary teachers (4.2%)
- Other management occupations, except farmers and farm managers (4.1%)
- Secretaries and administrative assistants (3.5%)
- Entertainers and performers, sports, and related workers (3.4%)
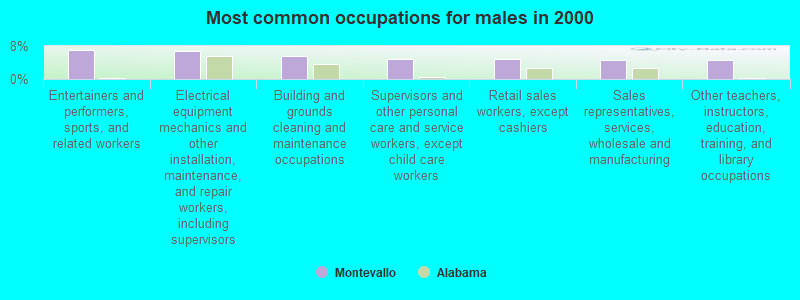
- Entertainers and performers, sports, and related workers (7.1%)
- Electrical equipment mechanics and other installation, maintenance, and repair workers, including supervisors (6.8%)
- Building and grounds cleaning and maintenance occupations (5.5%)
- Supervisors and other personal care and service workers, except child care workers (4.8%)
- Retail sales workers, except cashiers (4.8%)
- Sales representatives, services, wholesale and manufacturing (4.6%)
- Other teachers, instructors, education, training, and library occupations (4.5%)
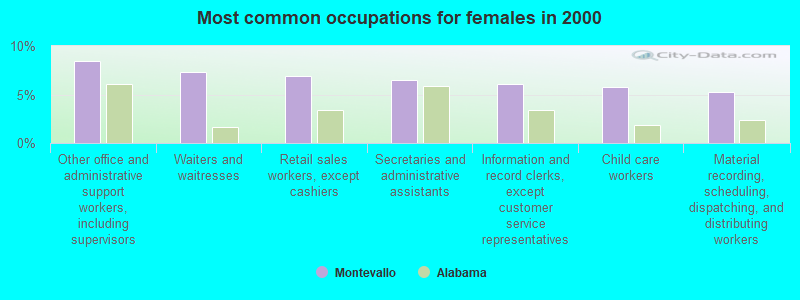
- Other office and administrative support workers, including supervisors (8.5%)
- Waiters and waitresses (7.3%)
- Retail sales workers, except cashiers (6.9%)
- Secretaries and administrative assistants (6.5%)
- Information and record clerks, except customer service representatives (6.1%)
- Child care workers (5.8%)
- Material recording, scheduling, dispatching, and distributing workers (5.3%)
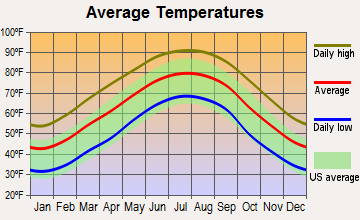
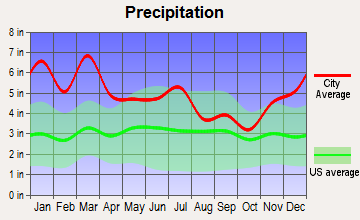
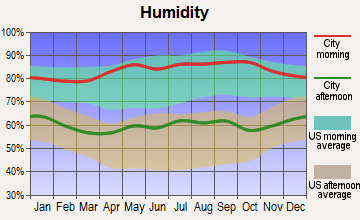
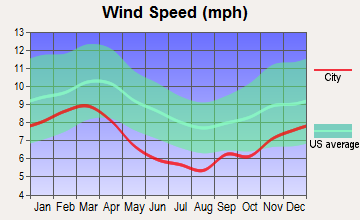
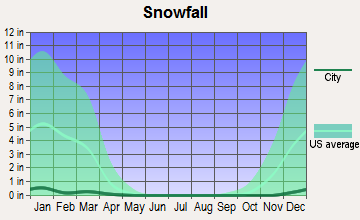
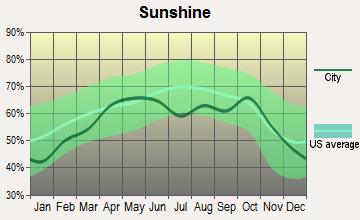
Average climate in Montevallo, Alabama
Based on data reported by over 4,000 weather stations

|
|


(lower is better)
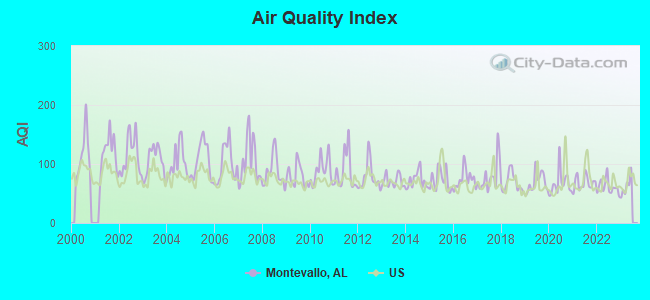
Air Quality Index (AQI) level in 2022 was 61.2. This is about average.
| City: | 61.2 |
| U.S.: | 72.6 |
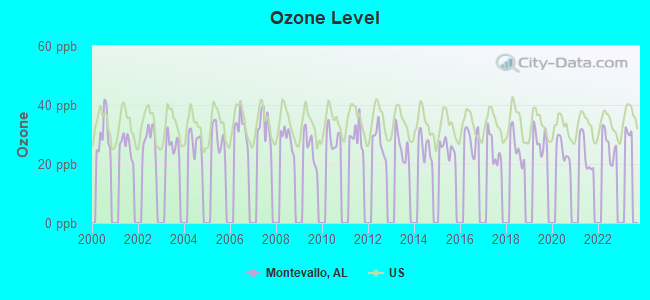
Ozone [ppb] level in 2022 was 26.4. This is better than average. Closest monitor was 14.8 miles away from the city center.
| City: | 26.4 |
| U.S.: | 33.3 |
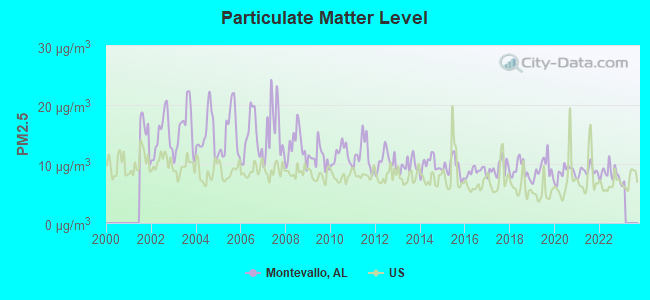
Particulate Matter (PM2.5) [µg/m3] level in 2022 was 8.44. This is about average. Closest monitor was 17.6 miles away from the city center.
| City: | 8.44 |
| U.S.: | 8.11 |
Tornado activity:
Montevallo-area historical tornado activity is near Alabama state average. It is 105% greater than the overall U.S. average.
On 4/4/1977, a category F5 (max. wind speeds 261-318 mph) tornado 29.0 miles away from the Montevallo city center killed 22 people and injured 130 people and caused between $5,000,000 and $50,000,000 in damages.
On 4/8/1998, a category F5 tornado 32.9 miles away from the city center killed 32 people and injured 259 people and caused $200 million in damages.
Earthquake activity:
Montevallo-area historical earthquake activity is significantly above Alabama state average. It is 115% greater than the overall U.S. average.On 1/18/1999 at 07:00:53, a magnitude 4.8 (4.8 MB, 4.0 LG, Depth: 0.6 mi, Class: Light, Intensity: IV - V) earthquake occurred 30.7 miles away from the city center
On 4/29/2003 at 08:59:39, a magnitude 4.9 (4.4 MB, 4.6 MW, 4.9 LG) earthquake occurred 119.4 miles away from Montevallo center
On 10/24/1997 at 08:35:17, a magnitude 4.9 (4.8 MB, 4.2 MS, 4.9 LG, Depth: 6.2 mi) earthquake occurred 139.2 miles away from Montevallo center
On 6/24/1975 at 11:11:36, a magnitude 4.5 (4.5 MB) earthquake occurred 70.6 miles away from Montevallo center
On 4/29/2003 at 08:59:39, a magnitude 4.6 (4.6 MW, Depth: 12.3 mi) earthquake occurred 119.4 miles away from Montevallo center
On 11/7/2004 at 11:20:21, a magnitude 4.3 (4.3 MW, Depth: 3.1 mi) earthquake occurred 69.7 miles away from Montevallo center
Magnitude types: regional Lg-wave magnitude (LG), body-wave magnitude (MB), surface-wave magnitude (MS), moment magnitude (MW)
Natural disasters:
The number of natural disasters in Shelby County (19) is greater than the US average (15).Major Disasters (Presidential) Declared: 11
Emergencies Declared: 6
Causes of natural disasters: Storms: 10, Floods: 8, Tornadoes: 8, Hurricanes: 4, Winds: 3, Drought: 1, Fire: 1, Snowfall: 1, Winter Storm: 1, Other: 1 (Note: some incidents may be assigned to more than one category).

Hospitals and medical centers in Montevallo:
Other hospitals and medical centers near Montevallo:
- COMFORT CARE HOME HEALTH (Home Health Center, about 10 miles away; ALABASTER, AL)
- FAMILY COMFORT HOSPICE OF ALABASTER (Hospital, about 11 miles away; ALABASTER, AL)
- SHELBY RIDGE NURSING HOME (Nursing Home, about 11 miles away; ALABASTER, AL)
- NEW BEACON OF ALABASTER (Hospital, about 11 miles away; ALABASTER, AL)
- COLUMBIANA HEALTH AND REHABILITATION, LLC (Nursing Home, about 16 miles away; COLUMBIANA, AL)
Airports located in Montevallo:
- Flying X Ranch Airport (5AL3) (Runways: 1)
College/University in Montevallo:
Other colleges/universities with over 2000 students near Montevallo:
- Lawson State Community College-Birmingham Campus (about 25 miles; Birmingham, AL; Full-time enrollment: 2,695)
- Samford University (about 26 miles; Birmingham, AL; FT enrollment: 3,829)
- Virginia College-Birmingham (about 26 miles; Birmingham, AL; FT enrollment: 8,167)
- University of Alabama at Birmingham (about 28 miles; Birmingham, AL; FT enrollment: 14,853)
- Jefferson State Community College (about 39 miles; Birmingham, AL; FT enrollment: 6,041)
- The University of Alabama (about 41 miles; Tuscaloosa, AL; FT enrollment: 30,931)
- Shelton State Community College (about 41 miles; Tuscaloosa, AL; FT enrollment: 4,106)
Public high school in Montevallo:
- MONTEVALLO HIGH SCH (Students: 361, Location: 980 OAK ST, Grades: 9-12)
Public elementary/middle schools in Montevallo:
- MONTEVALLO ELEM SCH (Students: 703, Location: 171 JETER CIR, Grades: KG-5)
- MONTEVALLO MIDDLE SCH (Students: 338, Location: 235 SAMFORD ST, Grades: 6-8)
- CALERA MIDDLE SCH (Location: 9178 HIGHWAY 22, Grades: 6-8)
Points of interest:
Notable location: Montevallo Fire and Rescue Station 1 (A). Display/hide its location on the map
Churches in Montevallo include: Aldrich Church (A), Epsibeth Church (B), Green Chapel Church (C), University Baptist Church (D), Saint Andrews Episcopal Church (E), Montevallo Church of Christ (F), Salem Church (G), Shiloh Baptist Church (H), First United Methodist Church (I). Display/hide their locations on the map
Cemeteries: Montevallo Cemetery (1), King Cemetery (2). Display/hide their locations on the map
Lake: College Lake (A). Display/hide its location on the map
Creeks: Spring Creek (A), King Creek (B), Dry Creek (C), Davis Creek (D). Display/hide their locations on the map
Parks in Montevallo include: University of Montevallo Historic District (1), Richard Gilliam Field (2). Display/hide their locations on the map
Birthplace of: Robert M. Lightfoot, Jr. - Space agency executive, Andrew Jackson Caldwell - Lawyer and politician, Jim Hayes (baseball) - Major League Baseball pitcher.
Drinking water stations with addresses in Montevallo and their reported violations in the past:
MONTEVALLO WATER WORKS & SEWER (Address: 613 VALLEY STREET , Population served: 9,399, Groundwater):Past monitoring violations:
- Follow-up Or Routine LCR Tap M/R - In OCT-11-2007, Contaminant: Lead and Copper Rule. Follow-up actions: St Compliance achieved (AUG-17-2009)
| This city: | 2.3 people |
| Alabama: | 2.5 people |
| This city: | 56.5% |
| Whole state: | 67.8% |
| This city: | 5.4% |
| Whole state: | 4.7% |
Likely homosexual households (counted as self-reported same-sex unmarried-partner households)
- Lesbian couples: 0.6% of all households
- Gay men: 0.1% of all households
11 people in nursing facilities/skilled-nursing facilities in 2010
891 people in college dormitories (includes college quarters off campus) in 2000
2 people in local jails and other confinement facilities (including police lockups) in 2000
Banks with branches in Montevallo (2011 data):
- Regions Bank: Montevallo Branch at 910 Main Street, branch established on 1981/08/06. Info updated 2011/02/24: Bank assets: $123,368.2 mil, Deposits: $98,301.3 mil, headquarters in Birmingham, AL, positive income, Commercial Lending Specialization, 1778 total offices, Holding Company: Regions Financial Corporation
- BankTrust: Montevallo Branch at 835 Main Street, branch established on 1902/01/01. Info updated 2012/01/30: Bank assets: $2,083.8 mil, Deposits: $1,812.7 mil, headquarters in Mobile, AL, positive income, Commercial Lending Specialization, 50 total offices, Holding Company: Banctrust Financial Group, Inc.
For population 15 years and over in Montevallo:
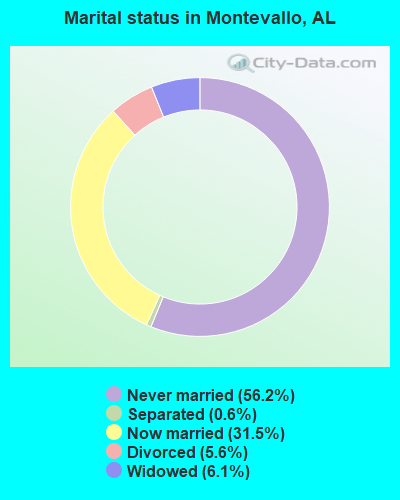
- Never married: 56.2%
- Now married: 31.5%
- Separated: 0.6%
- Widowed: 6.1%
- Divorced: 5.6%
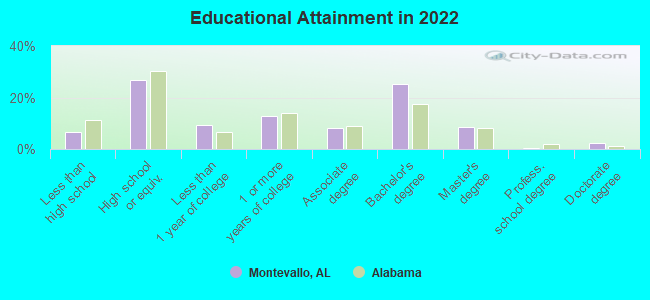
For population 25 years and over in Montevallo:
- High school or higher: 92.8%
- Bachelor's degree or higher: 32.9%
- Graduate or professional degree: 10.5%
- Unemployed: 7.8%
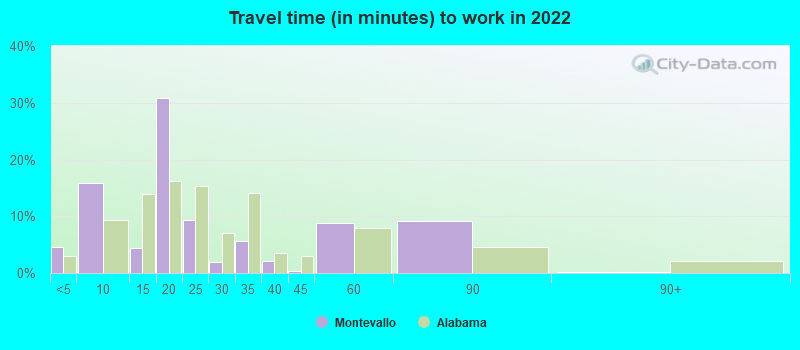
- Mean travel time to work (commute): 27.3 minutes
| Here: | 9.5 |
| Alabama average: | 11.5 |
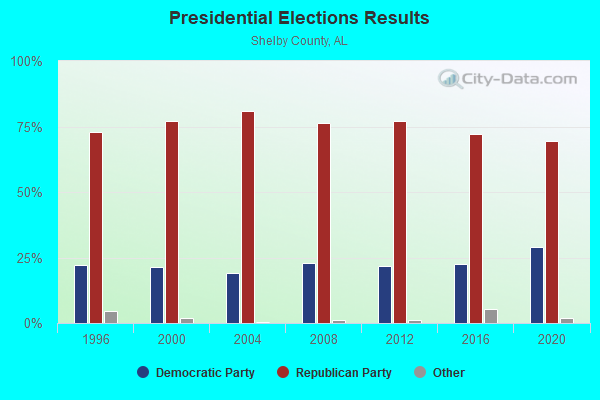
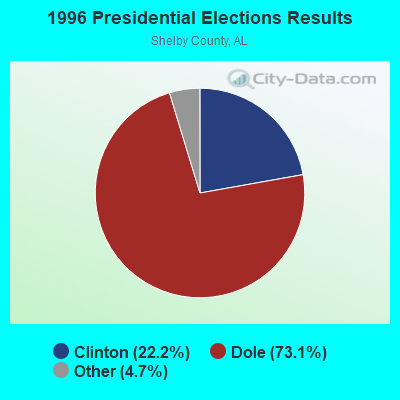
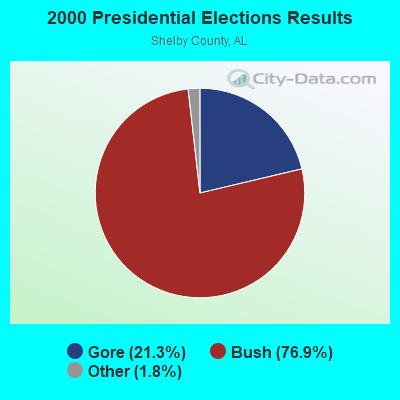
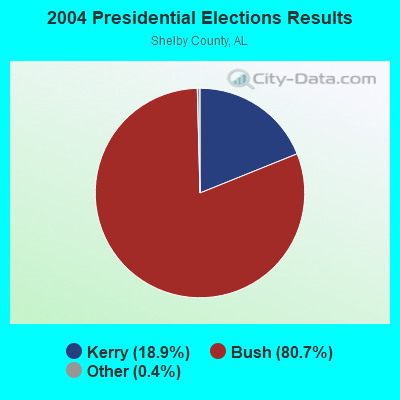
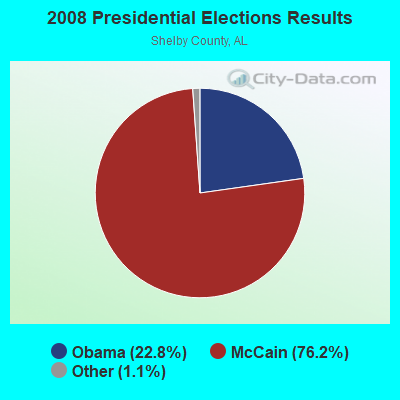
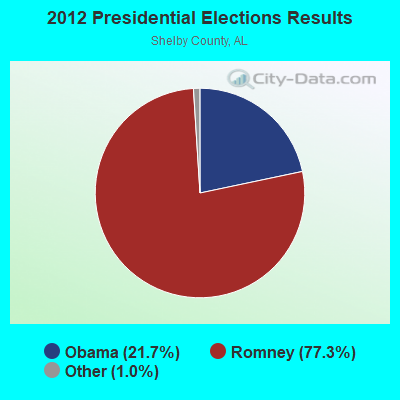
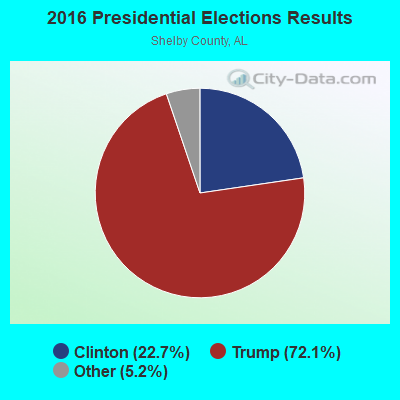
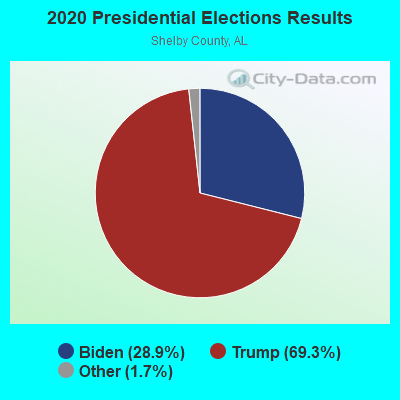
Graphs represent county-level data. Detailed 2008 Election Results
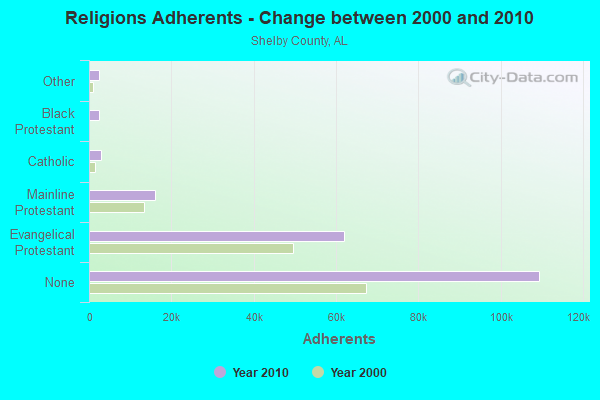
Religion statistics for Montevallo, AL (based on Shelby County data)
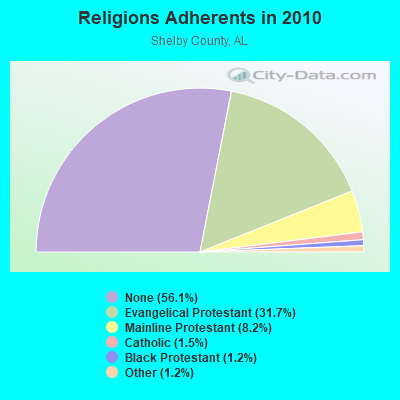
| Religion | Adherents | Congregations |
|---|---|---|
| Evangelical Protestant | 61,933 | 172 |
| Mainline Protestant | 16,076 | 38 |
| Catholic | 2,883 | 1 |
| Black Protestant | 2,421 | 12 |
| Other | 2,337 | 6 |
| Orthodox | 58 | 1 |
| None | 109,377 | - |
Food Environment Statistics:
| Shelby County: | 1.31 / 10,000 pop. |
| Alabama: | 1.89 / 10,000 pop. |
| Shelby County: | 0.16 / 10,000 pop. |
| Alabama: | 0.20 / 10,000 pop. |
| Here: | 0.27 / 10,000 pop. |
| Alabama: | 0.65 / 10,000 pop. |
| This county: | 5.14 / 10,000 pop. |
| Alabama: | 6.32 / 10,000 pop. |
| Shelby County: | 6.78 / 10,000 pop. |
| Alabama: | 5.75 / 10,000 pop. |
| Shelby County: | 7.4% |
| Alabama: | 11.8% |
| Here: | 28.1% |
| State: | 31.7% |
| Shelby County: | 17.2% |
| Alabama: | 13.5% |
Health and Nutrition:
| Montevallo: | 45.8% |
| State: | 49.0% |
| Montevallo: | 42.0% |
| Alabama: | 45.7% |
| This city: | 28.0 |
| State: | 28.9 |
| Montevallo: | 20.5% |
| State: | 20.7% |
| Here: | 13.5% |
| Alabama: | 11.0% |
| This city: | 6.8 |
| State: | 6.8 |
| This city: | 28.3% |
| State: | 34.4% |
| Montevallo: | 54.0% |
| State: | 55.2% |
| Here: | 80.8% |
| State: | 79.3% |
More about Health and Nutrition of Montevallo, AL Residents
| Local government employment and payroll (March 2022) | |||||
| Function | Full-time employees | Monthly full-time payroll | Average yearly full-time wage | Part-time employees | Monthly part-time payroll |
|---|---|---|---|---|---|
| Police Protection - Officers | 18 | $86,979 | $57,986 | 1 | $2,070 |
| Financial Administration | 11 | $32,852 | $35,839 | 1 | $3,201 |
| Streets and Highways | 9 | $34,200 | $45,600 | 2 | $2,595 |
| Local Libraries | 4 | $10,972 | $32,916 | 5 | $2,974 |
| Firefighters | 3 | $18,846 | $75,384 | 4 | $3,022 |
| Parks and Recreation | 3 | $12,680 | $50,720 | 1 | $942 |
| Other Government Administration | 1 | $5,127 | $61,524 | 6 | $4,245 |
| Solid Waste Management | 1 | $2,403 | $28,836 | 0 | $0 |
| Judicial and Legal | 0 | $0 | 4 | $3,654 | |
| Totals for Government | 50 | $204,059 | $48,974 | 24 | $22,703 |
Montevallo government finances - Expenditure in 2017 (per resident):
- Current Operations - Police Protection: $1,289,000 ($168.78)
Parks and Recreation: $574,000 ($75.16)
Central Staff Services: $480,000 ($62.85)
Judicial and Legal Services: $431,000 ($56.44)
Local Fire Protection: $296,000 ($38.76)
Solid Waste Management: $242,000 ($31.69)
Financial Administration: $230,000 ($30.12)
Libraries: $205,000 ($26.84)
Miscellaneous Commercial Activities - Other: $75,000 ($9.82)
- General - Interest on Debt: $11,000 ($1.44)
- Intergovernmental to Local - Other - General - Other: $507,000 ($66.39)
- Other Capital Outlay - Parks and Recreation: $136,000 ($17.81)
Local Fire Protection: $78,000 ($10.21)
Police Protection: $62,000 ($8.12)
Regular Highways: $29,000 ($3.80)
Financial Administration: $25,000 ($3.27)
- Total Salaries and Wages: $3,656,000 ($478.72)
Montevallo government finances - Revenue in 2017 (per resident):
- Charges - Solid Waste Management: $363,000 ($47.53)
Parks and Recreation: $315,000 ($41.25)
Miscellaneous Commercial Activities: $51,000 ($6.68)
- Federal Intergovernmental - Public Welfare: $23,000 ($3.01)
- Local Intergovernmental - Public Welfare: $49,000 ($6.42)
- Miscellaneous - Fines and Forfeits: $370,000 ($48.45)
Rents: $26,000 ($3.40)
General Revenue - Other: $16,000 ($2.10)
Donations From Private Sources: $6,000 ($0.79)
Interest Earnings: $4,000 ($0.52)
Sale of Property: $4,000 ($0.52)
- State Intergovernmental - General Local Government Support: $55,000 ($7.20)
Highways: $28,000 ($3.67)
Housing and Community Development: $5,000 ($0.65)
Public Welfare: $1,000 ($0.13)
- Tax - General Sales and Gross Receipts: $1,697,000 ($222.21)
Public Utilities Sales: $411,000 ($53.82)
Other License: $396,000 ($51.85)
Property: $334,000 ($43.73)
Motor Fuels Sales: $77,000 ($10.08)
Alcoholic Beverage Sales: $60,000 ($7.86)
Tobacco Products Sales: $55,000 ($7.20)
Public Utility License: $50,000 ($6.55)
Other Selective Sales: $9,000 ($1.18)
Motor Vehicle License: $3,000 ($0.39)
Montevallo government finances - Debt in 2017 (per resident):
- Long Term Debt - Retired Unspecified Public Purpose: $271,000 ($35.49)
Beginning Outstanding - Unspecified Public Purpose: $271,000 ($35.49)
Outstanding Unspecified Public Purpose: $238,000 ($31.16)
Issue, Unspecified Public Purpose: $238,000 ($31.16)
- Short Term Debt Outstanding - Beginning: $26,000 ($3.40)
Montevallo government finances - Cash and Securities in 2017 (per resident):
- Other Funds - Cash and Securities: $1,037,000 ($135.79)
| Businesses in Montevallo, AL | ||||
| Name | Count | Name | Count | |
|---|---|---|---|---|
| AutoZone | 1 | McDonald's | 1 | |
| CVS | 1 | Pizza Hut | 1 | |
| Domino's Pizza | 1 | U-Haul | 1 | |
| KFC | 1 | UPS | 1 | |
Strongest AM radio stations in Montevallo:
- WJOX (690 AM; 50 kW; BIRMINGHAM, AL; Owner: CITADEL BROADCASTING COMPANY)
- WAPI (1070 AM; 50 kW; BIRMINGHAM, AL; Owner: CITADEL BROADCASTING COMPANY)
- WDJC (850 AM; 50 kW; BIRMINGHAM, AL; Owner: KIMTRON, INC.)
- WBYE (1370 AM; 1 kW; CALERA, AL; Owner: PROGRESSIVE UNITED COMMUNICATIONS, INC.)
- WQCR (1500 AM; 2 kW; ALABASTER, AL; Owner: WGTT, INC.)
- WNSI (810 AM; 50 kW; JACKSONVILLE, AL; Owner: UNITED BROADCASTING NETWORK, INC.)
- WERC (960 AM; 5 kW; BIRMINGHAM, AL; Owner: CAPSTAR TX LIMITED PARTNERSHIP)
- WYDE (1260 AM; 5 kW; BIRMINGHAM, AL; Owner: KIMTRON, INC.)
- WKNG (1060 AM; daytime; 50 kW; TALLAPOOSA, GA; Owner: WKNG, INC.)
- WRJS (1320 AM; 5 kW; BIRMINGHAM, AL; Owner: CXR HOLDINGS, INC.)
- WGST (640 AM; 50 kW; ATLANTA, GA; Owner: CITICASTERS LICENSES, L.P.)
- WTSK (790 AM; 5 kW; TUSCALOOSA, AL; Owner: APEX BROADCASTING INC.)
- WMSP (740 AM; 10 kW; MONTGOMERY, AL; Owner: CUMULUS LICENSING CORP.)
Strongest FM radio stations in Montevallo:
- WQEM (101.5 FM; COLUMBIANA, AL; Owner: GLEN IRIS BAPTIST SCHOOL)
- WODL (97.3 FM; HOMEWOOD, AL; Owner: CXR HOLDINGS, INC.)
- WMJJ (96.5 FM; BIRMINGHAM, AL; Owner: CAPSTAR TX LIMITED PARTNERSHIP)
- WBHK (98.7 FM; WARRIOR, AL; Owner: CXR HOLDINGS, INC.)
- WZZK-FM (104.7 FM; BIRMINGHAM, AL; Owner: CXR HOLDINGS, INC.)
- WYSF (94.5 FM; BIRMINGHAM, AL; Owner: CITADEL BROADCASTING COMPANY)
- WBPT (106.9 FM; BIRMINGHAM, AL; Owner: CXR HOLDINGS, INC.)
- WQEN (103.7 FM; GADSDEN, AL; Owner: CAPSTAR TX LIMITED PARTNERSHIP)
- WANZ (100.7 FM; NORTHPORT, AL; Owner: APEX BRAODCASTING INC.)
- WZRR (99.5 FM; BIRMINGHAM, AL; Owner: CITADEL BROADCASTING COMPANY)
- WBHM (90.3 FM; BIRMINGHAM, AL; Owner: BD OF TRUSTEES/U OF AL AT BIRMINGHAM)
- WDXB (102.5 FM; JASPER, AL; Owner: CAPSTAR TX LIMITED PARTNERSHIP)
- WDJC-FM (93.7 FM; BIRMINGHAM, AL; Owner: KIMTRON, INC.)
- WGIB (91.9 FM; BIRMINGHAM, AL; Owner: GLEN IRIS BAPTIST SCHOOL)
- WLJR (88.5 FM; BIRMINGHAM, AL; Owner: BRIARWOOD PRESBYTERIAN CHURCH)
- WBFR (89.5 FM; BIRMINGHAM, AL; Owner: FAMILY STATIONS, INC.)
- W281AB (104.1 FM; MOUNTAIN BROOK, AL; Owner: FAMILY STATIONS, INC.)
- WRAX (107.7 FM; BIRMINGHAM, AL; Owner: CITADEL BROADCASTING COMPANY)
- WEZZ-FM (97.7 FM; CLANTON, AL; Owner: SOUTHEASTERN BROADCASTING CO., INC)
- WBHJ (95.7 FM; TUSCALOOSA, AL; Owner: CXR HOLDINGS, INC.)
TV broadcast stations around Montevallo:
- WOTM-LP (Channel 19; MONTEVALLO, AL; Owner: JAMES DONALD EARLEY)
- WABM (Channel 68; BIRMINGHAM, AL; Owner: BIRMINGHAM (WABM-TV) LICENSEE, INC.)
- WDBB (Channel 17; BESSEMER, AL; Owner: WDBB-TV, INC.)
- WIAT (Channel 42; BIRMINGHAM, AL; Owner: MEDIA GENERAL COMMUNICATIONS, INC.)
- WBIQ (Channel 10; BIRMINGHAM, AL; Owner: ALABAMA EDUCATIONAL TELEVISION COMMISSION)
- WCFT-TV (Channel 33; TUSCALOOSA, AL; Owner: TV ALABAMA, INCORPORATED)
- WTTO (Channel 21; HOMEWOOD, AL; Owner: WTTO LICENSEE, LLC)
- WBRC (Channel 6; BIRMINGHAM, AL; Owner: WBRC LICENSE, INC.)
- WBXA-CA (Channel 2; BIRMINGHAM, AL; Owner: THE BOX WORLDWIDE LLC)
- WVTM-TV (Channel 13; BIRMINGHAM, AL; Owner: BIRMINGHAM BROADCASTING (WVTM-TV), LLC)
- WBIH (Channel 29; SELMA, AL; Owner: FLINN BROADCASTING CORPORATION)
- WBMA-LP (Channel 58; BIRMINGHAM, AL; Owner: TV ALABAMA, INC.)
- W27CM (Channel 27; BIRMINGHAM, AL; Owner: EQUITY BROADCASTING CORPORATION)
- W15AZ (Channel 15; ALABASTER, AL; Owner: GLEN IRIS BAPTIST CHURCH SCHOOL)
- W46DK (Channel 46; BIRMINGHAM, AL; Owner: TRINITY BROADCASTING NETWORK)
- W34BI (Channel 34; BIRMINGHAM, AL; Owner: VENTANA TELEVISION, INC.)
- National Bridge Inventory (NBI) Statistics
- 23Number of bridges
- 210ft / 63.8mTotal length
- $25,424,000Total costs
- 65,628Total average daily traffic
- 10,785Total average daily truck traffic
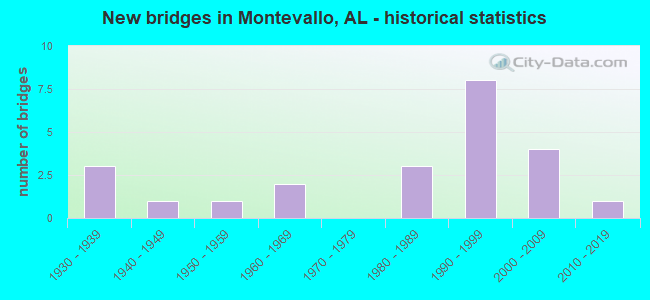
- New bridges - historical statistics
- 31930-1939
- 11940-1949
- 11950-1959
- 21960-1969
- 31980-1989
- 81990-1999
- 42000-2009
- 12010-2019
FCC Registered Cell Phone Towers:
1 (See the full list of FCC Registered Cell Phone Towers in Montevallo)FCC Registered Antenna Towers:
82 (See the full list of FCC Registered Antenna Towers)FCC Registered Private Land Mobile Towers:
4 (See the full list of FCC Registered Private Land Mobile Towers in Montevallo, AL)FCC Registered Broadcast Land Mobile Towers:
11 (See the full list of FCC Registered Broadcast Land Mobile Towers)FCC Registered Microwave Towers:
3- MONTEVALLO, 112 Glory Rd (Lat: 33.138000 Lon: -86.859333), Type: Ltower, Structure height: 76.8 m, Overall height: 78.6 m, Call Sign: WQTE728,
Assigned Frequencies: 10835.0 MHz, 6315.84 MHz, 6315.84 MHz, 6315.84 MHz, 6315.84 MHz, 6315.84 MHz, 6315.84 MHz, 10955.0 MHz, 10955.0 MHz, 10955.0 MHz... (+4 more), Grant Date: 01/12/2024, Expiration Date: 01/17/2034, Certifier: Phil Burns, Registrant: Shelby County 911, 19220 Hwy 280 Ste 201, Birmingham, AL 35242, Phone: (205) 439-6911, Email:
- MONTEVALLO, 737 Main St (Lat: 33.101194 Lon: -86.862889), Type: Ltower, Structure height: 53.3 m, Call Sign: WQWN792,
Assigned Frequencies: 11265.0 MHz, 11265.0 MHz, 11265.0 MHz, 11265.0 MHz, 11265.0 MHz, 11265.0 MHz, 11265.0 MHz, 11265.0 MHz, Grant Date: 10/14/2015, Expiration Date: 10/14/2025, Certifier: Larry F Butts, Registrant: Southern Company Services, 600 N. 18th St / Bin 5n-5409, Birmingham, AL 35203, Phone: (205) 257-7600, Fax: (205) 257-2134, Email:
- STATION, 116 N Main St (Lat: 33.100944 Lon: -86.862750), Overall height: 59.4 m, Call Sign: WAK218,
Assigned Frequencies: 1940.00 MHz, Grant Date: 08/23/1995, Expiration Date: 08/23/2000, Cancellation Date: 05/28/1997, Phone: (205) 250-2561
FCC Registered Amateur Radio Licenses:
67 (See the full list of FCC Registered Amateur Radio Licenses in Montevallo)FAA Registered Aircraft:
6- Aircraft: AERONCA 65-TAC (Category: Land, Seats: 2, Weight: Up to 12,499 Pounds, Speed: 71 mph), Engine: CONT MOTOR A&C65 SERIES (65 HP) (Reciprocating)
N-Number: 36952, N36952, N-36952, Serial Number: C2691TA, Year manufactured: 1941, Airworthiness Date: 06/25/1959, Certificate Issue Date: 09/12/2000
Registrant (Individual): Joseph V Graffo, 10574 County Road 73, Montevallo, AL 35115 - Aircraft: SKY RANGER SKY RANGER (Category: Land, Seats: 2, Weight: Up to 12,499 Pounds), Engine: JABIRU 2200 (85 HP) (4 Cycle)
N-Number: 4351M, N4351M, N-4351M, Serial Number: 2000, Year manufactured: 2007, Airworthiness Date: 10/06/2007, Certificate Issue Date: 03/16/2007
Registrant (Individual): James W Willis, 720 Morgan St, Montevallo, AL 35115 - Aircraft: CESSNA TR182 (Category: Land, Seats: 4, Weight: Up to 12,499 Pounds), Engine: LYCOMING 0-540 SERIES (250 HP) (Reciprocating)
N-Number: 736YQ, N736YQ, N-736YQ, Serial Number: R18200790, Year manufactured: 1978, Airworthiness Date: 02/03/1979, Certificate Issue Date: 05/02/2007
Registrant (Individual): Joseph A Zupanick, 213 Eddings Town Rd, Montevallo, AL 35115 - Aircraft: CESSNA 172N (Category: Land, Seats: 4, Weight: Up to 12,499 Pounds, Speed: 105 mph), Engine: LYCOMING 0-320 SERIES (180 HP) (Reciprocating)
N-Number: 738YP, N738YP, N-738YP, Serial Number: 17270344, Year manufactured: 1978, Airworthiness Date: 02/02/1978, Certificate Issue Date: 01/17/1992
Registrant (Individual): Frances P Givhan, 13177 Highway 17, Montevallo, AL 35115 - Aircraft: CESSNA 172N (Category: Land, Seats: 4, Weight: Up to 12,499 Pounds, Speed: 105 mph), Engine: LYCOMING 0-320 SERIES (180 HP) (Reciprocating)
N-Number: 739PV, N739PV, N-739PV, Serial Number: 17270705, Year manufactured: 1978, Airworthiness Date: 04/29/1978, Certificate Issue Date: 01/22/1999
Registrant (Individual): Walter Van Reid, Po Box 204, Montevallo, AL 35115 - Aircraft: CESSNA 172K (Category: Land, Seats: 4, Weight: Up to 12,499 Pounds, Speed: 105 mph), Engine: LYCOMING 0-320 SERIES (180 HP) (4 Cycle)
N-Number: 79955, N79955, N-79955, Serial Number: 17258282, Year manufactured: 1969, Airworthiness Date: 05/12/1969, Certificate Issue Date: 10/02/2015
Registrant (Individual): William E Mccowan, 68 Coeur Dalene, Montevallo, AL 35115
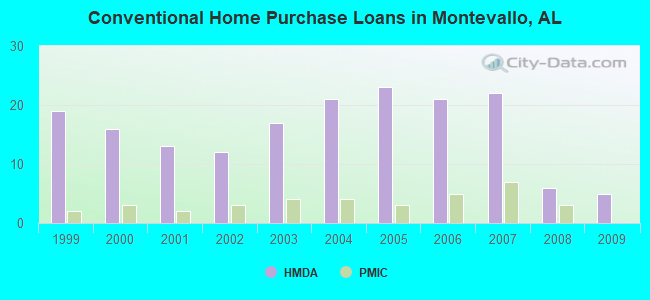
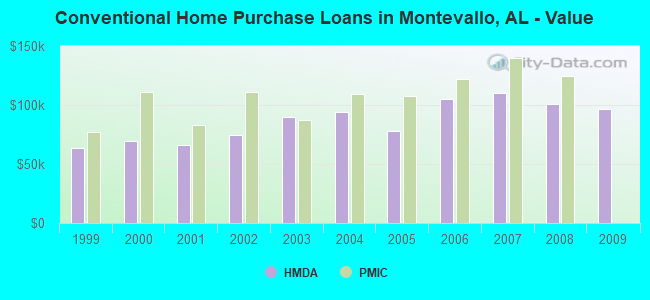
| Home Mortgage Disclosure Act Aggregated Statistics For Year 2009 (Based on 2 partial tracts) | ||||||||||||||
| A) FHA, FSA/RHS & VA Home Purchase Loans | B) Conventional Home Purchase Loans | C) Refinancings | D) Home Improvement Loans | E) Loans on Dwellings For 5+ Families | F) Non-occupant Loans on < 5 Family Dwellings (A B C & D) | G) Loans On Manufactured Home Dwelling (A B C & D) | ||||||||
|---|---|---|---|---|---|---|---|---|---|---|---|---|---|---|
| Number | Average Value | Number | Average Value | Number | Average Value | Number | Average Value | Number | Average Value | Number | Average Value | Number | Average Value | |
| LOANS ORIGINATED | 5 | $130,758 | 5 | $96,620 | 19 | $123,971 | 1 | $52,830 | 1 | $1,806,010 | 2 | $65,445 | 1 | $62,760 |
| APPLICATIONS APPROVED, NOT ACCEPTED | 1 | $115,310 | 0 | $0 | 1 | $125,790 | 0 | $0 | 0 | $0 | 0 | $0 | 0 | $0 |
| APPLICATIONS DENIED | 1 | $132,060 | 2 | $142,925 | 7 | $139,854 | 2 | $59,970 | 0 | $0 | 1 | $148,960 | 1 | $57,260 |
| APPLICATIONS WITHDRAWN | 1 | $194,480 | 1 | $65,890 | 6 | $150,985 | 0 | $0 | 0 | $0 | 0 | $0 | 0 | $0 |
| FILES CLOSED FOR INCOMPLETENESS | 0 | $0 | 0 | $0 | 2 | $139,950 | 1 | $41,620 | 0 | $0 | 0 | $0 | 0 | $0 |
Detailed HMDA statistics for the following Tracts: 0304.03 , 0304.04
| Private Mortgage Insurance Companies Aggregated Statistics For Year 2009 (Based on 2 partial tracts) | ||
| A) Conventional Home Purchase Loans | ||
|---|---|---|
| Number | Average Value | |
| LOANS ORIGINATED | 0 | $0 |
| APPLICATIONS APPROVED, NOT ACCEPTED | 1 | $96,080 |
| APPLICATIONS DENIED | 0 | $0 |
| APPLICATIONS WITHDRAWN | 0 | $0 |
| FILES CLOSED FOR INCOMPLETENESS | 0 | $0 |
Detailed PMIC statistics for the following Tracts: 0304.03 , 0304.04
2005 - 2018 National Fire Incident Reporting System (NFIRS) incidents
- Fire incident types reported to NFIRS in Montevallo, AL
- 7644.4%Structure Fires
- 7040.9%Outside Fires
- 169.4%Mobile Property/Vehicle Fires
- 95.3%Other
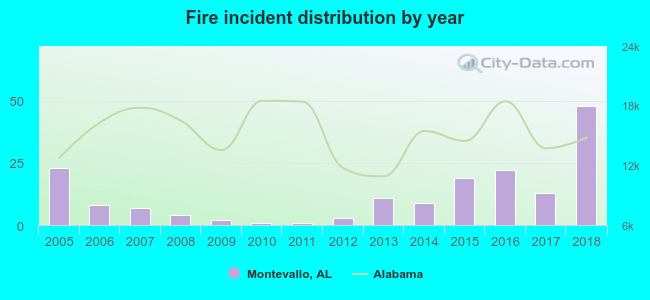 According to the data from the years 2005 - 2018 the average number of fire incidents per year is 12. The highest number of fire incidents - 48 took place in 2018, and the least - 1 in 2010. The data has a rising trend.
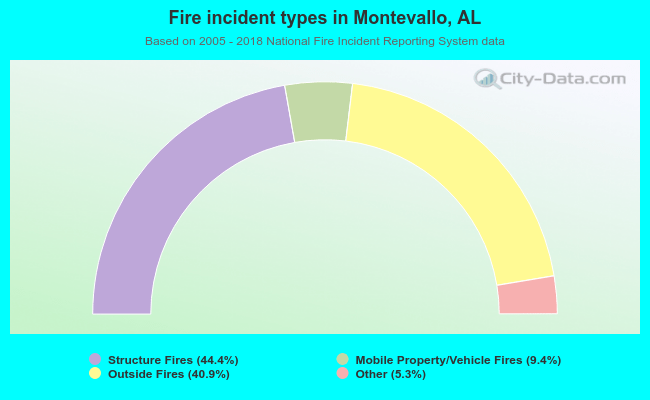 When looking into fire subcategories, the most reports belonged to: Structure Fires (44.4%), and Outside Fires (40.9%).
| Most common first names in Montevallo, AL among deceased individuals | ||
| Name | Count | Lived (average) |
|---|---|---|
| James | 89 | 69.1 years |
| Mary | 73 | 77.4 years |
| William | 67 | 73.0 years |
| John | 66 | 73.4 years |
| Robert | 46 | 73.1 years |
| Willie | 34 | 75.6 years |
| Charles | 33 | 68.7 years |
| George | 30 | 75.7 years |
| Annie | 24 | 79.8 years |
| Betty | 22 | 68.0 years |
| Most common last names in Montevallo, AL among deceased individuals | ||
| Last name | Count | Lived (average) |
|---|---|---|
| Lucas | 39 | 72.6 years |
| Allen | 38 | 74.7 years |
| Jones | 35 | 74.2 years |
| Lawley | 35 | 71.0 years |
| Smith | 33 | 70.2 years |
| Pickett | 28 | 76.3 years |
| Boothe | 22 | 77.5 years |
| Davis | 22 | 78.8 years |
| Johnson | 22 | 73.6 years |
| Harris | 21 | 71.0 years |
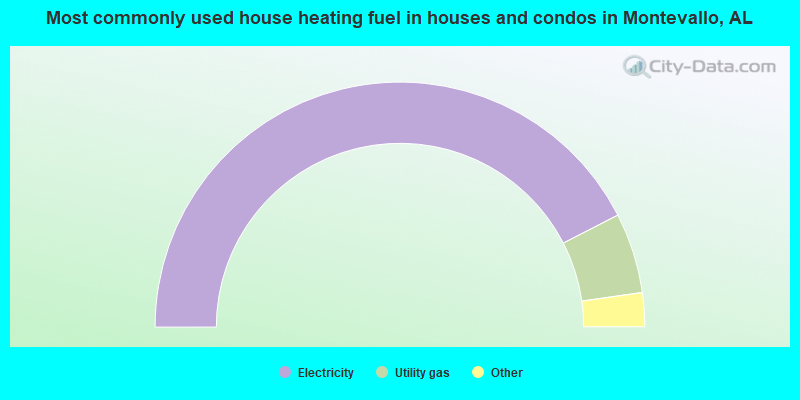
- 84.9%Electricity
- 10.6%Utility gas
- 3.9%Bottled, tank, or LP gas
- 0.7%Wood
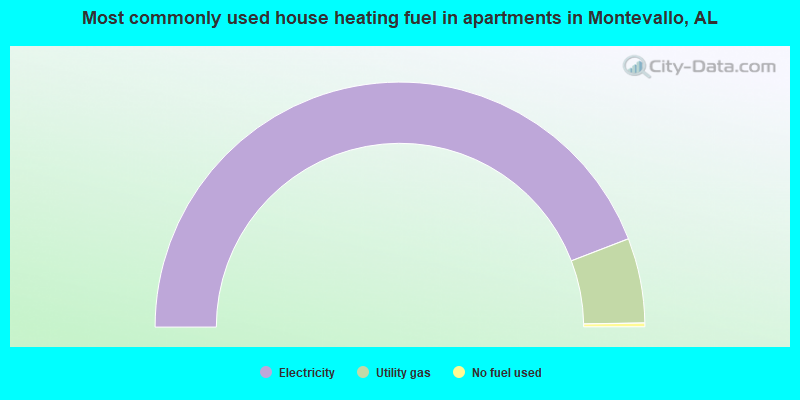
- 88.3%Electricity
- 11.2%Utility gas
- 0.5%No fuel used
Montevallo compared to Alabama state average:
- Unemployed percentage below state average.
- Median age significantly below state average.
- Foreign-born population percentage significantly above state average.
- Renting percentage above state average.
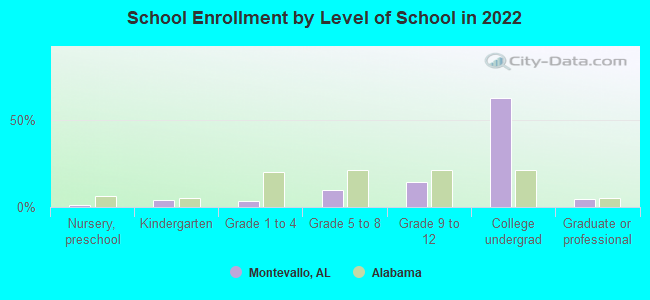
- Number of college students significantly above state average.
- Percentage of population with a bachelor's degree or higher above state average.
Montevallo on our top lists:
- #68 on the list of "Top 100 cities with highest percentage of college students (pop. 5,000+)"
- #76 on the list of "Top 101 cities with largest percentage of females in occupations: office and administrative support occupations (population 5,000+)"
- #19 on the list of "Top 101 counties with highest percentage of residents voting for Romney (Republican) in the 2012 Presidential Election (pop. 50,000+)"
- #34 on the list of "Top 101 counties with the largest decrease in the number of births per 1000 residents 2000-2006 to 2007-2013 (pop 50,000+)"
- #80 on the list of "Top 101 counties with the lowest surface withdrawal of fresh water for public supply (pop. 50,000+)"

|
Total of 6 patent applications in 2008-2024.