Middletown, Delaware Submit your own pictures of this town and show them to the world
OSM Map
General Map
Google Map
MSN Map
OSM Map
General Map
Google Map
MSN Map
OSM Map
General Map
Google Map
MSN Map
OSM Map
General Map
Google Map
MSN Map
Please wait while loading the map...
Population in 2022: 24,698 (100% urban, 0% rural). Population change since 2000: +300.9%Males: 10,965 Females: 13,733
March 2022 cost of living index in Middletown: 101.8 (near average, U.S. average is 100) Percentage of residents living in poverty in 2022: 6.8%for White Non-Hispanic residents , 15.0% for Black residents , 1.8% for Hispanic or Latino residents , 1.7% for two or more races residents )
Profiles of local businesses
Business Search - 14 Million verified businesses
Data:
Median household income ($)
Median household income (% change since 2000)
Household income diversity
Ratio of average income to average house value (%)
Ratio of average income to average rent
Median household income ($) - White
Median household income ($) - Black or African American
Median household income ($) - Asian
Median household income ($) - Hispanic or Latino
Median household income ($) - American Indian and Alaska Native
Median household income ($) - Multirace
Median household income ($) - Other Race
Median household income for houses/condos with a mortgage ($)
Median household income for apartments without a mortgage ($)
Races - White alone (%)
Races - White alone (% change since 2000)
Races - Black alone (%)
Races - Black alone (% change since 2000)
Races - American Indian alone (%)
Races - American Indian alone (% change since 2000)
Races - Asian alone (%)
Races - Asian alone (% change since 2000)
Races - Hispanic (%)
Races - Hispanic (% change since 2000)
Races - Native Hawaiian and Other Pacific Islander alone (%)
Races - Native Hawaiian and Other Pacific Islander alone (% change since 2000)
Races - Two or more races (%)
Races - Two or more races (% change since 2000)
Races - Other race alone (%)
Races - Other race alone (% change since 2000)
Racial diversity
Unemployment (%)
Unemployment (% change since 2000)
Unemployment (%) - White
Unemployment (%) - Black or African American
Unemployment (%) - Asian
Unemployment (%) - Hispanic or Latino
Unemployment (%) - American Indian and Alaska Native
Unemployment (%) - Multirace
Unemployment (%) - Other Race
Population density (people per square mile)
Population - Males (%)
Population - Females (%)
Population - Males (%) - White
Population - Males (%) - Black or African American
Population - Males (%) - Asian
Population - Males (%) - Hispanic or Latino
Population - Males (%) - American Indian and Alaska Native
Population - Males (%) - Multirace
Population - Males (%) - Other Race
Population - Females (%) - White
Population - Females (%) - Black or African American
Population - Females (%) - Asian
Population - Females (%) - Hispanic or Latino
Population - Females (%) - American Indian and Alaska Native
Population - Females (%) - Multirace
Population - Females (%) - Other Race
Coronavirus confirmed cases (Jun 03, 2024)
Deaths caused by coronavirus (Jun 03, 2024)
Coronavirus confirmed cases (per 100k population) (Jun 03, 2024)
Deaths caused by coronavirus (per 100k population) (Jun 03, 2024)
Daily increase in number of cases (Jun 03, 2024)
Weekly increase in number of cases (Jun 03, 2024)
Cases doubled (in days) (Jun 03, 2024)
Hospitalized patients (Apr 18, 2022)
Negative test results (Apr 18, 2022)
Total test results (Apr 18, 2022)
COVID Vaccine doses distributed (per 100k population) (Sep 19, 2023)
COVID Vaccine doses administered (per 100k population) (Sep 19, 2023)
COVID Vaccine doses distributed (Sep 19, 2023)
COVID Vaccine doses administered (Sep 19, 2023)
Likely homosexual households (%)
Likely homosexual households (% change since 2000)
Likely homosexual households - Lesbian couples (%)
Likely homosexual households - Lesbian couples (% change since 2000)
Likely homosexual households - Gay men (%)
Likely homosexual households - Gay men (% change since 2000)
Cost of living index
Median gross rent ($)
Median contract rent ($)
Median monthly housing costs ($)
Median house or condo value ($)
Median house or condo value ($ change since 2000)
Mean house or condo value by units in structure - 1, detached ($)
Mean house or condo value by units in structure - 1, attached ($)
Mean house or condo value by units in structure - 2 ($)
Mean house or condo value by units in structure by units in structure - 3 or 4 ($)
Mean house or condo value by units in structure - 5 or more ($)
Mean house or condo value by units in structure - Boat, RV, van, etc. ($)
Mean house or condo value by units in structure - Mobile home ($)
Median house or condo value ($) - White
Median house or condo value ($) - Black or African American
Median house or condo value ($) - Asian
Median house or condo value ($) - Hispanic or Latino
Median house or condo value ($) - American Indian and Alaska Native
Median house or condo value ($) - Multirace
Median house or condo value ($) - Other Race
Median resident age
Resident age diversity
Median resident age - Males
Median resident age - Females
Median resident age - White
Median resident age - Black or African American
Median resident age - Asian
Median resident age - Hispanic or Latino
Median resident age - American Indian and Alaska Native
Median resident age - Multirace
Median resident age - Other Race
Median resident age - Males - White
Median resident age - Males - Black or African American
Median resident age - Males - Asian
Median resident age - Males - Hispanic or Latino
Median resident age - Males - American Indian and Alaska Native
Median resident age - Males - Multirace
Median resident age - Males - Other Race
Median resident age - Females - White
Median resident age - Females - Black or African American
Median resident age - Females - Asian
Median resident age - Females - Hispanic or Latino
Median resident age - Females - American Indian and Alaska Native
Median resident age - Females - Multirace
Median resident age - Females - Other Race
Commute - mean travel time to work (minutes)
Travel time to work - Less than 5 minutes (%)
Travel time to work - Less than 5 minutes (% change since 2000)
Travel time to work - 5 to 9 minutes (%)
Travel time to work - 5 to 9 minutes (% change since 2000)
Travel time to work - 10 to 19 minutes (%)
Travel time to work - 10 to 19 minutes (% change since 2000)
Travel time to work - 20 to 29 minutes (%)
Travel time to work - 20 to 29 minutes (% change since 2000)
Travel time to work - 30 to 39 minutes (%)
Travel time to work - 30 to 39 minutes (% change since 2000)
Travel time to work - 40 to 59 minutes (%)
Travel time to work - 40 to 59 minutes (% change since 2000)
Travel time to work - 60 to 89 minutes (%)
Travel time to work - 60 to 89 minutes (% change since 2000)
Travel time to work - 90 or more minutes (%)
Travel time to work - 90 or more minutes (% change since 2000)
Marital status - Never married (%)
Marital status - Now married (%)
Marital status - Separated (%)
Marital status - Widowed (%)
Marital status - Divorced (%)
Median family income ($)
Median family income (% change since 2000)
Median non-family income ($)
Median non-family income (% change since 2000)
Median per capita income ($)
Median per capita income (% change since 2000)
Median family income ($) - White
Median family income ($) - Black or African American
Median family income ($) - Asian
Median family income ($) - Hispanic or Latino
Median family income ($) - American Indian and Alaska Native
Median family income ($) - Multirace
Median family income ($) - Other Race
Median year house/condo built
Median year apartment built
Year house built - Built 2005 or later (%)
Year house built - Built 2000 to 2004 (%)
Year house built - Built 1990 to 1999 (%)
Year house built - Built 1980 to 1989 (%)
Year house built - Built 1970 to 1979 (%)
Year house built - Built 1960 to 1969 (%)
Year house built - Built 1950 to 1959 (%)
Year house built - Built 1940 to 1949 (%)
Year house built - Built 1939 or earlier (%)
Average household size
Household density (households per square mile)
Average household size - White
Average household size - Black or African American
Average household size - Asian
Average household size - Hispanic or Latino
Average household size - American Indian and Alaska Native
Average household size - Multirace
Average household size - Other Race
Occupied housing units (%)
Vacant housing units (%)
Owner occupied housing units (%)
Renter occupied housing units (%)
Vacancy status - For rent (%)
Vacancy status - For sale only (%)
Vacancy status - Rented or sold, not occupied (%)
Vacancy status - For seasonal, recreational, or occasional use (%)
Vacancy status - For migrant workers (%)
Vacancy status - Other vacant (%)
Residents with income below the poverty level (%)
Residents with income below 50% of the poverty level (%)
Children below poverty level (%)
Poor families by family type - Married-couple family (%)
Poor families by family type - Male, no wife present (%)
Poor families by family type - Female, no husband present (%)
Poverty status for native-born residents (%)
Poverty status for foreign-born residents (%)
Poverty among high school graduates not in families (%)
Poverty among people who did not graduate high school not in families (%)
Residents with income below the poverty level (%) - White
Residents with income below the poverty level (%) - Black or African American
Residents with income below the poverty level (%) - Asian
Residents with income below the poverty level (%) - Hispanic or Latino
Residents with income below the poverty level (%) - American Indian and Alaska Native
Residents with income below the poverty level (%) - Multirace
Residents with income below the poverty level (%) - Other Race
Air pollution - Air Quality Index (AQI)
Air pollution - CO
Air pollution - NO2
Air pollution - SO2
Air pollution - Ozone
Air pollution - PM10
Air pollution - PM25
Air pollution - Pb
Crime - Murders per 100,000 population
Crime - Rapes per 100,000 population
Crime - Robberies per 100,000 population
Crime - Assaults per 100,000 population
Crime - Burglaries per 100,000 population
Crime - Thefts per 100,000 population
Crime - Auto thefts per 100,000 population
Crime - Arson per 100,000 population
Crime - City-data.com crime index
Crime - Violent crime index
Crime - Property crime index
Crime - Murders per 100,000 population (5 year average)
Crime - Rapes per 100,000 population (5 year average)
Crime - Robberies per 100,000 population (5 year average)
Crime - Assaults per 100,000 population (5 year average)
Crime - Burglaries per 100,000 population (5 year average)
Crime - Thefts per 100,000 population (5 year average)
Crime - Auto thefts per 100,000 population (5 year average)
Crime - Arson per 100,000 population (5 year average)
Crime - City-data.com crime index (5 year average)
Crime - Violent crime index (5 year average)
Crime - Property crime index (5 year average)
1996 Presidential Elections Results (%) - Democratic Party (Clinton)
1996 Presidential Elections Results (%) - Republican Party (Dole)
1996 Presidential Elections Results (%) - Other
2000 Presidential Elections Results (%) - Democratic Party (Gore)
2000 Presidential Elections Results (%) - Republican Party (Bush)
2000 Presidential Elections Results (%) - Other
2004 Presidential Elections Results (%) - Democratic Party (Kerry)
2004 Presidential Elections Results (%) - Republican Party (Bush)
2004 Presidential Elections Results (%) - Other
2008 Presidential Elections Results (%) - Democratic Party (Obama)
2008 Presidential Elections Results (%) - Republican Party (McCain)
2008 Presidential Elections Results (%) - Other
2012 Presidential Elections Results (%) - Democratic Party (Obama)
2012 Presidential Elections Results (%) - Republican Party (Romney)
2012 Presidential Elections Results (%) - Other
2016 Presidential Elections Results (%) - Democratic Party (Clinton)
2016 Presidential Elections Results (%) - Republican Party (Trump)
2016 Presidential Elections Results (%) - Other
2020 Presidential Elections Results (%) - Democratic Party (Biden)
2020 Presidential Elections Results (%) - Republican Party (Trump)
2020 Presidential Elections Results (%) - Other
Ancestries Reported - Arab (%)
Ancestries Reported - Czech (%)
Ancestries Reported - Danish (%)
Ancestries Reported - Dutch (%)
Ancestries Reported - English (%)
Ancestries Reported - French (%)
Ancestries Reported - French Canadian (%)
Ancestries Reported - German (%)
Ancestries Reported - Greek (%)
Ancestries Reported - Hungarian (%)
Ancestries Reported - Irish (%)
Ancestries Reported - Italian (%)
Ancestries Reported - Lithuanian (%)
Ancestries Reported - Norwegian (%)
Ancestries Reported - Polish (%)
Ancestries Reported - Portuguese (%)
Ancestries Reported - Russian (%)
Ancestries Reported - Scotch-Irish (%)
Ancestries Reported - Scottish (%)
Ancestries Reported - Slovak (%)
Ancestries Reported - Subsaharan African (%)
Ancestries Reported - Swedish (%)
Ancestries Reported - Swiss (%)
Ancestries Reported - Ukrainian (%)
Ancestries Reported - United States (%)
Ancestries Reported - Welsh (%)
Ancestries Reported - West Indian (%)
Ancestries Reported - Other (%)
Educational Attainment - No schooling completed (%)
Educational Attainment - Less than high school (%)
Educational Attainment - High school or equivalent (%)
Educational Attainment - Less than 1 year of college (%)
Educational Attainment - 1 or more years of college (%)
Educational Attainment - Associate degree (%)
Educational Attainment - Bachelor's degree (%)
Educational Attainment - Master's degree (%)
Educational Attainment - Professional school degree (%)
Educational Attainment - Doctorate degree (%)
School Enrollment - Nursery, preschool (%)
School Enrollment - Kindergarten (%)
School Enrollment - Grade 1 to 4 (%)
School Enrollment - Grade 5 to 8 (%)
School Enrollment - Grade 9 to 12 (%)
School Enrollment - College undergrad (%)
School Enrollment - Graduate or professional (%)
School Enrollment - Not enrolled in school (%)
School enrollment - Public schools (%)
School enrollment - Private schools (%)
School enrollment - Not enrolled (%)
Median number of rooms in houses and condos
Median number of rooms in apartments
Housing units lacking complete plumbing facilities (%)
Housing units lacking complete kitchen facilities (%)
Density of houses
Urban houses (%)
Rural houses (%)
Households with people 60 years and over (%)
Households with people 65 years and over (%)
Households with people 75 years and over (%)
Households with one or more nonrelatives (%)
Households with no nonrelatives (%)
Population in households (%)
Family households (%)
Nonfamily households (%)
Population in families (%)
Family households with own children (%)
Median number of bedrooms in owner occupied houses
Mean number of bedrooms in owner occupied houses
Median number of bedrooms in renter occupied houses
Mean number of bedrooms in renter occupied houses
Median number of vehichles in owner occupied houses
Mean number of vehichles in owner occupied houses
Median number of vehichles in renter occupied houses
Mean number of vehichles in renter occupied houses
Mortgage status - with mortgage (%)
Mortgage status - with second mortgage (%)
Mortgage status - with home equity loan (%)
Mortgage status - with both second mortgage and home equity loan (%)
Mortgage status - without a mortgage (%)
Average family size
Average family size - White
Average family size - Black or African American
Average family size - Asian
Average family size - Hispanic or Latino
Average family size - American Indian and Alaska Native
Average family size - Multirace
Average family size - Other Race
Geographical mobility - Same house 1 year ago (%)
Geographical mobility - Moved within same county (%)
Geographical mobility - Moved from different county within same state (%)
Geographical mobility - Moved from different state (%)
Geographical mobility - Moved from abroad (%)
Place of birth - Born in state of residence (%)
Place of birth - Born in other state (%)
Place of birth - Native, outside of US (%)
Place of birth - Foreign born (%)
Housing units in structures - 1, detached (%)
Housing units in structures - 1, attached (%)
Housing units in structures - 2 (%)
Housing units in structures - 3 or 4 (%)
Housing units in structures - 5 to 9 (%)
Housing units in structures - 10 to 19 (%)
Housing units in structures - 20 to 49 (%)
Housing units in structures - 50 or more (%)
Housing units in structures - Mobile home (%)
Housing units in structures - Boat, RV, van, etc. (%)
House/condo owner moved in on average (years ago)
Renter moved in on average (years ago)
Year householder moved into unit - Moved in 1999 to March 2000 (%)
Year householder moved into unit - Moved in 1995 to 1998 (%)
Year householder moved into unit - Moved in 1990 to 1994 (%)
Year householder moved into unit - Moved in 1980 to 1989 (%)
Year householder moved into unit - Moved in 1970 to 1979 (%)
Year householder moved into unit - Moved in 1969 or earlier (%)
Means of transportation to work - Drove car alone (%)
Means of transportation to work - Carpooled (%)
Means of transportation to work - Public transportation (%)
Means of transportation to work - Bus or trolley bus (%)
Means of transportation to work - Streetcar or trolley car (%)
Means of transportation to work - Subway or elevated (%)
Means of transportation to work - Railroad (%)
Means of transportation to work - Ferryboat (%)
Means of transportation to work - Taxicab (%)
Means of transportation to work - Motorcycle (%)
Means of transportation to work - Bicycle (%)
Means of transportation to work - Walked (%)
Means of transportation to work - Other means (%)
Working at home (%)
Industry diversity
Most Common Industries - Agriculture, forestry, fishing and hunting, and mining (%)
Most Common Industries - Agriculture, forestry, fishing and hunting (%)
Most Common Industries - Mining, quarrying, and oil and gas extraction (%)
Most Common Industries - Construction (%)
Most Common Industries - Manufacturing (%)
Most Common Industries - Wholesale trade (%)
Most Common Industries - Retail trade (%)
Most Common Industries - Transportation and warehousing, and utilities (%)
Most Common Industries - Transportation and warehousing (%)
Most Common Industries - Utilities (%)
Most Common Industries - Information (%)
Most Common Industries - Finance and insurance, and real estate and rental and leasing (%)
Most Common Industries - Finance and insurance (%)
Most Common Industries - Real estate and rental and leasing (%)
Most Common Industries - Professional, scientific, and management, and administrative and waste management services (%)
Most Common Industries - Professional, scientific, and technical services (%)
Most Common Industries - Management of companies and enterprises (%)
Most Common Industries - Administrative and support and waste management services (%)
Most Common Industries - Educational services, and health care and social assistance (%)
Most Common Industries - Educational services (%)
Most Common Industries - Health care and social assistance (%)
Most Common Industries - Arts, entertainment, and recreation, and accommodation and food services (%)
Most Common Industries - Arts, entertainment, and recreation (%)
Most Common Industries - Accommodation and food services (%)
Most Common Industries - Other services, except public administration (%)
Most Common Industries - Public administration (%)
Occupation diversity
Most Common Occupations - Management, business, science, and arts occupations (%)
Most Common Occupations - Management, business, and financial occupations (%)
Most Common Occupations - Management occupations (%)
Most Common Occupations - Business and financial operations occupations (%)
Most Common Occupations - Computer, engineering, and science occupations (%)
Most Common Occupations - Computer and mathematical occupations (%)
Most Common Occupations - Architecture and engineering occupations (%)
Most Common Occupations - Life, physical, and social science occupations (%)
Most Common Occupations - Education, legal, community service, arts, and media occupations (%)
Most Common Occupations - Community and social service occupations (%)
Most Common Occupations - Legal occupations (%)
Most Common Occupations - Education, training, and library occupations (%)
Most Common Occupations - Arts, design, entertainment, sports, and media occupations (%)
Most Common Occupations - Healthcare practitioners and technical occupations (%)
Most Common Occupations - Health diagnosing and treating practitioners and other technical occupations (%)
Most Common Occupations - Health technologists and technicians (%)
Most Common Occupations - Service occupations (%)
Most Common Occupations - Healthcare support occupations (%)
Most Common Occupations - Protective service occupations (%)
Most Common Occupations - Fire fighting and prevention, and other protective service workers including supervisors (%)
Most Common Occupations - Law enforcement workers including supervisors (%)
Most Common Occupations - Food preparation and serving related occupations (%)
Most Common Occupations - Building and grounds cleaning and maintenance occupations (%)
Most Common Occupations - Personal care and service occupations (%)
Most Common Occupations - Sales and office occupations (%)
Most Common Occupations - Sales and related occupations (%)
Most Common Occupations - Office and administrative support occupations (%)
Most Common Occupations - Natural resources, construction, and maintenance occupations (%)
Most Common Occupations - Farming, fishing, and forestry occupations (%)
Most Common Occupations - Construction and extraction occupations (%)
Most Common Occupations - Installation, maintenance, and repair occupations (%)
Most Common Occupations - Production, transportation, and material moving occupations (%)
Most Common Occupations - Production occupations (%)
Most Common Occupations - Transportation occupations (%)
Most Common Occupations - Material moving occupations (%)
People in Group quarters - Institutionalized population (%)
People in Group quarters - Correctional institutions (%)
People in Group quarters - Federal prisons and detention centers (%)
People in Group quarters - Halfway houses (%)
People in Group quarters - Local jails and other confinement facilities (including police lockups) (%)
People in Group quarters - Military disciplinary barracks (%)
People in Group quarters - State prisons (%)
People in Group quarters - Other types of correctional institutions (%)
People in Group quarters - Nursing homes (%)
People in Group quarters - Hospitals/wards, hospices, and schools for the handicapped (%)
People in Group quarters - Hospitals/wards and hospices for chronically ill (%)
People in Group quarters - Hospices or homes for chronically ill (%)
People in Group quarters - Military hospitals or wards for chronically ill (%)
People in Group quarters - Other hospitals or wards for chronically ill (%)
People in Group quarters - Hospitals or wards for drug/alcohol abuse (%)
People in Group quarters - Mental (Psychiatric) hospitals or wards (%)
People in Group quarters - Schools, hospitals, or wards for the mentally retarded (%)
People in Group quarters - Schools, hospitals, or wards for the physically handicapped (%)
People in Group quarters - Institutions for the deaf (%)
People in Group quarters - Institutions for the blind (%)
People in Group quarters - Orthopedic wards and institutions for the physically handicapped (%)
People in Group quarters - Wards in general hospitals for patients who have no usual home elsewhere (%)
People in Group quarters - Wards in military hospitals for patients who have no usual home elsewhere (%)
People in Group quarters - Juvenile institutions (%)
People in Group quarters - Long-term care (%)
People in Group quarters - Homes for abused, dependent, and neglected children (%)
People in Group quarters - Residential treatment centers for emotionally disturbed children (%)
People in Group quarters - Training schools for juvenile delinquents (%)
People in Group quarters - Short-term care, detention or diagnostic centers for delinquent children (%)
People in Group quarters - Type of juvenile institution unknown (%)
People in Group quarters - Noninstitutionalized population (%)
People in Group quarters - College dormitories (includes college quarters off campus) (%)
People in Group quarters - Military quarters (%)
People in Group quarters - On base (%)
People in Group quarters - Barracks, unaccompanied personnel housing (UPH), (Enlisted/Officer), ;and similar group living quarters for military personnel (%)
People in Group quarters - Transient quarters for temporary residents (%)
People in Group quarters - Military ships (%)
People in Group quarters - Group homes (%)
People in Group quarters - Homes or halfway houses for drug/alcohol abuse (%)
People in Group quarters - Homes for the mentally ill (%)
People in Group quarters - Homes for the mentally retarded (%)
People in Group quarters - Homes for the physically handicapped (%)
People in Group quarters - Other group homes (%)
People in Group quarters - Religious group quarters (%)
People in Group quarters - Dormitories (%)
People in Group quarters - Agriculture workers' dormitories on farms (%)
People in Group quarters - Job Corps and vocational training facilities (%)
People in Group quarters - Other workers' dormitories (%)
People in Group quarters - Crews of maritime vessels (%)
People in Group quarters - Other nonhousehold living situations (%)
People in Group quarters - Other noninstitutional group quarters (%)
Residents speaking English at home (%)
Residents speaking English at home - Born in the United States (%)
Residents speaking English at home - Native, born elsewhere (%)
Residents speaking English at home - Foreign born (%)
Residents speaking Spanish at home (%)
Residents speaking Spanish at home - Born in the United States (%)
Residents speaking Spanish at home - Native, born elsewhere (%)
Residents speaking Spanish at home - Foreign born (%)
Residents speaking other language at home (%)
Residents speaking other language at home - Born in the United States (%)
Residents speaking other language at home - Native, born elsewhere (%)
Residents speaking other language at home - Foreign born (%)
Class of Workers - Employee of private company (%)
Class of Workers - Self-employed in own incorporated business (%)
Class of Workers - Private not-for-profit wage and salary workers (%)
Class of Workers - Local government workers (%)
Class of Workers - State government workers (%)
Class of Workers - Federal government workers (%)
Class of Workers - Self-employed workers in own not incorporated business and Unpaid family workers (%)
House heating fuel used in houses and condos - Utility gas (%)
House heating fuel used in houses and condos - Bottled, tank, or LP gas (%)
House heating fuel used in houses and condos - Electricity (%)
House heating fuel used in houses and condos - Fuel oil, kerosene, etc. (%)
House heating fuel used in houses and condos - Coal or coke (%)
House heating fuel used in houses and condos - Wood (%)
House heating fuel used in houses and condos - Solar energy (%)
House heating fuel used in houses and condos - Other fuel (%)
House heating fuel used in houses and condos - No fuel used (%)
House heating fuel used in apartments - Utility gas (%)
House heating fuel used in apartments - Bottled, tank, or LP gas (%)
House heating fuel used in apartments - Electricity (%)
House heating fuel used in apartments - Fuel oil, kerosene, etc. (%)
House heating fuel used in apartments - Coal or coke (%)
House heating fuel used in apartments - Wood (%)
House heating fuel used in apartments - Solar energy (%)
House heating fuel used in apartments - Other fuel (%)
House heating fuel used in apartments - No fuel used (%)
Armed forces status - In Armed Forces (%)
Armed forces status - Civilian (%)
Armed forces status - Civilian - Veteran (%)
Armed forces status - Civilian - Nonveteran (%)
Fatal accidents locations in years 2005-2021
Fatal accidents locations in 2005
Fatal accidents locations in 2006
Fatal accidents locations in 2007
Fatal accidents locations in 2008
Fatal accidents locations in 2009
Fatal accidents locations in 2010
Fatal accidents locations in 2011
Fatal accidents locations in 2012
Fatal accidents locations in 2013
Fatal accidents locations in 2014
Fatal accidents locations in 2015
Fatal accidents locations in 2016
Fatal accidents locations in 2017
Fatal accidents locations in 2018
Fatal accidents locations in 2019
Fatal accidents locations in 2020
Fatal accidents locations in 2021
Alcohol use - People drinking some alcohol every month (%)
Alcohol use - People not drinking at all (%)
Alcohol use - Average days/month drinking alcohol
Alcohol use - Average drinks/week
Alcohol use - Average days/year people drink much
Audiometry - Average condition of hearing (%)
Audiometry - People that can hear a whisper from across a quiet room (%)
Audiometry - People that can hear normal voice from across a quiet room (%)
Audiometry - Ears ringing, roaring, buzzing (%)
Audiometry - Had a job exposure to loud noise (%)
Audiometry - Had off-work exposure to loud noise (%)
Blood Pressure & Cholesterol - Has high blood pressure (%)
Blood Pressure & Cholesterol - Checking blood pressure at home (%)
Blood Pressure & Cholesterol - Frequently checking blood cholesterol (%)
Blood Pressure & Cholesterol - Has high cholesterol level (%)
Consumer Behavior - Money monthly spent on food at supermarket/grocery store
Consumer Behavior - Money monthly spent on food at other stores
Consumer Behavior - Money monthly spent on eating out
Consumer Behavior - Money monthly spent on carryout/delivered foods
Consumer Behavior - Income spent on food at supermarket/grocery store (%)
Consumer Behavior - Income spent on food at other stores (%)
Consumer Behavior - Income spent on eating out (%)
Consumer Behavior - Income spent on carryout/delivered foods (%)
Current Health Status - General health condition (%)
Current Health Status - Blood donors (%)
Current Health Status - Has blood ever tested for HIV virus (%)
Current Health Status - Left-handed people (%)
Dermatology - People using sunscreen (%)
Diabetes - Diabetics (%)
Diabetes - Had a blood test for high blood sugar (%)
Diabetes - People taking insulin (%)
Diet Behavior & Nutrition - Diet health (%)
Diet Behavior & Nutrition - Milk product consumption (# of products/month)
Diet Behavior & Nutrition - Meals not home prepared (#/week)
Diet Behavior & Nutrition - Meals from fast food or pizza place (#/week)
Diet Behavior & Nutrition - Ready-to-eat foods (#/month)
Diet Behavior & Nutrition - Frozen meals/pizza (#/month)
Drug Use - People that ever used marijuana or hashish (%)
Drug Use - Ever used hard drugs (%)
Drug Use - Ever used any form of cocaine (%)
Drug Use - Ever used heroin (%)
Drug Use - Ever used methamphetamine (%)
Health Insurance - People covered by health insurance (%)
Kidney Conditions-Urology - Avg. # of times urinating at night
Medical Conditions - People with asthma (%)
Medical Conditions - People with anemia (%)
Medical Conditions - People with psoriasis (%)
Medical Conditions - People with overweight (%)
Medical Conditions - Elderly people having difficulties in thinking or remembering (%)
Medical Conditions - People who ever received blood transfusion (%)
Medical Conditions - People having trouble seeing even with glass/contacts (%)
Medical Conditions - People with arthritis (%)
Medical Conditions - People with gout (%)
Medical Conditions - People with congestive heart failure (%)
Medical Conditions - People with coronary heart disease (%)
Medical Conditions - People with angina pectoris (%)
Medical Conditions - People who ever had heart attack (%)
Medical Conditions - People who ever had stroke (%)
Medical Conditions - People with emphysema (%)
Medical Conditions - People with thyroid problem (%)
Medical Conditions - People with chronic bronchitis (%)
Medical Conditions - People with any liver condition (%)
Medical Conditions - People who ever had cancer or malignancy (%)
Mental Health - People who have little interest in doing things (%)
Mental Health - People feeling down, depressed, or hopeless (%)
Mental Health - People who have trouble sleeping or sleeping too much (%)
Mental Health - People feeling tired or having little energy (%)
Mental Health - People with poor appetite or overeating (%)
Mental Health - People feeling bad about themself (%)
Mental Health - People who have trouble concentrating on things (%)
Mental Health - People moving or speaking slowly or too fast (%)
Mental Health - People having thoughts they would be better off dead (%)
Oral Health - Average years since last visit a dentist
Oral Health - People embarrassed because of mouth (%)
Oral Health - People with gum disease (%)
Oral Health - General health of teeth and gums (%)
Oral Health - Average days a week using dental floss/device
Oral Health - Average days a week using mouthwash for dental problem
Oral Health - Average number of teeth
Pesticide Use - Households using pesticides to control insects (%)
Pesticide Use - Households using pesticides to kill weeds (%)
Physical Activity - People doing vigorous-intensity work activities (%)
Physical Activity - People doing moderate-intensity work activities (%)
Physical Activity - People walking or bicycling (%)
Physical Activity - People doing vigorous-intensity recreational activities (%)
Physical Activity - People doing moderate-intensity recreational activities (%)
Physical Activity - Average hours a day doing sedentary activities
Physical Activity - Average hours a day watching TV or videos
Physical Activity - Average hours a day using computer
Physical Functioning - People having limitations keeping them from working (%)
Physical Functioning - People limited in amount of work they can do (%)
Physical Functioning - People that need special equipment to walk (%)
Physical Functioning - People experiencing confusion/memory problems (%)
Physical Functioning - People requiring special healthcare equipment (%)
Prescription Medications - Average number of prescription medicines taking
Preventive Aspirin Use - Adults 40+ taking low-dose aspirin (%)
Reproductive Health - Vaginal deliveries (%)
Reproductive Health - Cesarean deliveries (%)
Reproductive Health - Deliveries resulted in a live birth (%)
Reproductive Health - Pregnancies resulted in a delivery (%)
Reproductive Health - Women breastfeeding newborns (%)
Reproductive Health - Women that had a hysterectomy (%)
Reproductive Health - Women that had both ovaries removed (%)
Reproductive Health - Women that have ever taken birth control pills (%)
Reproductive Health - Women taking birth control pills (%)
Reproductive Health - Women that have ever used Depo-Provera or injectables (%)
Reproductive Health - Women that have ever used female hormones (%)
Sexual Behavior - People 18+ that ever had sex (vaginal, anal, or oral) (%)
Sexual Behavior - Males 18+ that ever had vaginal sex with a woman (%)
Sexual Behavior - Males 18+ that ever performed oral sex on a woman (%)
Sexual Behavior - Males 18+ that ever had anal sex with a woman (%)
Sexual Behavior - Males 18+ that ever had any sex with a man (%)
Sexual Behavior - Females 18+ that ever had vaginal sex with a man (%)
Sexual Behavior - Females 18+ that ever performed oral sex on a man (%)
Sexual Behavior - Females 18+ that ever had anal sex with a man (%)
Sexual Behavior - Females 18+ that ever had any kind of sex with a woman (%)
Sexual Behavior - Average age people first had sex
Sexual Behavior - Average number of female sex partners in lifetime (males 18+)
Sexual Behavior - Average number of female vaginal sex partners in lifetime (males 18+)
Sexual Behavior - Average age people first performed oral sex on a woman (18+)
Sexual Behavior - Average number of woman performed oral sex on in lifetime (18+)
Sexual Behavior - Average number of male sex partners in lifetime (males 18+)
Sexual Behavior - Average number of male anal sex partners in lifetime (males 18+)
Sexual Behavior - Average age people first performed oral sex on a man (18+)
Sexual Behavior - Average number of male oral sex partners in lifetime (18+)
Sexual Behavior - People using protection when performing oral sex (%)
Sexual Behavior - Average number of times people have vaginal or anal sex a year
Sexual Behavior - People having sex without condom (%)
Sexual Behavior - Average number of male sex partners in lifetime (females 18+)
Sexual Behavior - Average number of male vaginal sex partners in lifetime (females 18+)
Sexual Behavior - Average number of female sex partners in lifetime (females 18+)
Sexual Behavior - Circumcised males 18+ (%)
Sleep Disorders - Average hours sleeping at night
Sleep Disorders - People that has trouble sleeping (%)
Smoking-Cigarette Use - People smoking cigarettes (%)
Taste & Smell - People 40+ having problems with smell (%)
Taste & Smell - People 40+ having problems with taste (%)
Taste & Smell - People 40+ that ever had wisdom teeth removed (%)
Taste & Smell - People 40+ that ever had tonsils teeth removed (%)
Taste & Smell - People 40+ that ever had a loss of consciousness because of a head injury (%)
Taste & Smell - People 40+ that ever had a broken nose or other serious injury to face or skull (%)
Taste & Smell - People 40+ that ever had two or more sinus infections (%)
Weight - Average height (inches)
Weight - Average weight (pounds)
Weight - Average BMI
Weight - People that are obese (%)
Weight - People that ever were obese (%)
Weight - People trying to lose weight (%)
According to our research of Delaware and other state lists, there were 24 registered sex offenders living in Middletown, Delaware as of June 03, 2024 . The ratio of all residents to sex offenders in Middletown is 843 to 1.The ratio of registered sex offenders to all residents in this city is lower than the state average.
Officers per 1,000 residents here:
1.52Delaware average:
2.33
Latest news from Middletown, DE collected exclusively by city-data.com from local newspapers, TV, and radio stations
Ancestries: Irish (7.4%), English (5.6%), Italian (5.0%), Dutch (4.2%), American (4.0%), Polish (3.8%).
Current Local Time:
Land area: 6.40 square miles.
Population density: 3,858 people per square mile (average).
3,013 residents are foreign born (4.7% Asia , 4.1% Latin America , 3.4% Africa ).
This town:
12.7%Delaware:
9.8%
Median real estate property taxes paid for housing units with mortgages in 2022: $2,561 (0.7%)Median real estate property taxes paid for housing units with no mortgage in 2022: $2,183 (0.6%)
Nearest city with pop. 50,000+: Greater Newark, DE (15.6 miles
Nearest city with pop. 200,000+: Philadelphia, PA
Nearest cities:
Latitude: 39.45 N, Longitude: 75.71 W
Daytime population change due to commuting: +1,255 (+5.3%)Workers who live and work in this town: 3,626 (31.9%)
Single-family new house construction building permits:
2022: 95 buildings , average cost: $74,0002021: 170 buildings , average cost: $77,6002020: 259 buildings , average cost: $86,4002019: 149 buildings , average cost: $95,2002018: 188 buildings , average cost: $83,1002017: 158 buildings , average cost: $89,4002016: 112 buildings , average cost: $98,2002015: 128 buildings , average cost: $83,1002014: 180 buildings , average cost: $77,1002013: 111 buildings , average cost: $83,6002012: 62 buildings , average cost: $86,1002011: 47 buildings , average cost: $90,4002010: 106 buildings , average cost: $65,1002009: 149 buildings , average cost: $77,8002008: 179 buildings , average cost: $75,5002007: 296 buildings , average cost: $86,3002006: 285 buildings , average cost: $92,7002005: 407 buildings , average cost: $85,7002004: 636 buildings , average cost: $84,0002003: 433 buildings , average cost: $64,7002002: 63 buildings , average cost: $65,800Unemployment in December 2023:
Population change in the 1990s: +2,407 (+64.1%).
Most common occupations in Middletown, DE (%)
Both Males Females
Other sales and related occupations, including supervisors (5.2%)
Material recording, scheduling, dispatching, and distributing workers (5.1%)
Other office and administrative support workers, including supervisors (4.0%)
Building and grounds cleaning and maintenance occupations (4.0%)
Other management occupations, except farmers and farm managers (3.8%)
Other production occupations, including supervisors (3.4%)
Information and record clerks, except customer service representatives (2.9%)
Material recording, scheduling, dispatching, and distributing workers (6.8%)
Other sales and related occupations, including supervisors (6.4%)
Construction traders workers except carpenters, electricians, painters, plumbers, and construction laborers (4.3%)
Electrical equipment mechanics and other installation, maintenance, and repair workers, including supervisors (4.3%)
Driver/sales workers and truck drivers (3.9%)
Other production occupations, including supervisors (3.8%)
Metal workers and plastic workers (3.6%)
Other office and administrative support workers, including supervisors (7.1%)
Secretaries and administrative assistants (5.4%)
Building and grounds cleaning and maintenance occupations (5.2%)
Cashiers (4.9%)
Information and record clerks, except customer service representatives (4.9%)
Customer service representatives (4.6%)
Other management occupations, except farmers and farm managers (4.3%)
Tornado activity:
Middletown-area historical tornado activity is slightly above Delaware state average. It is 2% greater than the overall U.S. average.
On 4/28/1961, a category F3 (max. wind speeds 158-206 mph) tornado 16.8 miles away from the Middletown town center caused between $5000 and $50,000 in damages.
On 7/27/1994, a category F3 tornado 19.4 miles away from the town center injured 11 people and caused between $500,000 and $5,000,000 in damages.
Earthquake activity:
Middletown-area historical earthquake activity is significantly above Delaware state average. It is 64% smaller than the overall U.S. average. On 8/23/2011 at 17:51:04, a magnitude 5.8 (5.8 MW, Depth: 3.7 mi, Class: Moderate, Intensity: VI - VII) earthquake occurred 160.7 miles away from Middletown center On 1/16/1994 at 01:49:16, a magnitude 4.6 (4.6 MB, 4.6 LG, Depth: 3.1 mi, Class: Light, Intensity: IV - V) earthquake occurred 62.9 miles away from the city center On 11/30/2017 at 21:47:31, a magnitude 4.1 (4.1 MW, Depth: 6.1 mi) earthquake occurred 23.3 miles away from Middletown center On 1/16/1994 at 00:42:43, a magnitude 4.2 (4.2 MB, 4.0 LG, Depth: 3.1 mi) earthquake occurred 62.3 miles away from the city center On 9/25/1998 at 19:52:52, a magnitude 5.2 (4.8 MB, 4.3 MS, 5.2 LG, 4.5 MW, Depth: 3.1 mi) earthquake occurred 283.7 miles away from the city center On 8/25/2011 at 05:07:52, a magnitude 4.5 (4.5 ML, Depth: 4.2 mi) earthquake occurred 160.2 miles away from the city center Magnitude types: regional Lg-wave magnitude (LG), body-wave magnitude (MB), local magnitude (ML), surface-wave magnitude (MS), moment magnitude (MW) Natural disasters: The number of natural disasters in New Castle County (15) is near the US average (15).Major Disasters (Presidential) Declared: 9Emergencies Declared: 5Hurricanes: 7, Snowstorms: 2, Tropical Storms: 2, Winter Storms: 2, Blizzard: 1, Flood: 1, Snowfall: 1, Storm: 1, Tornado: 1, Water Shortage: 1, Other: 1 (Note: some incidents may be assigned to more than one category). Hospitals and medical centers in Middletown: CADIA REHABILITATION BROADMEADOW (500 SOUTH BROAD STREET)
FRESENIUS MEDICAL CARE MIDDLETOWN (104 SLEEPY HOLLOW DRIVE)
Other hospitals and medical centers near Middletown: PINNACLE REHABILITATION AND HEALTH CENTER (Nursing Home, about 11 miles away; SMYRNA, DE)
FRESENIUS MEDICAL CARE FOX RUN (Dialysis Facility, about 11 miles away; BEAR, DE)
AMEDISYS HOME HEALTH OF ELKTON (Home Health Center, about 12 miles away; ELKTON, MD)
FMC - ELKTON (Dialysis Facility, about 13 miles away; ELKTON, MD)
DEVINE HAVEN CONV HOME (Nursing Home, about 13 miles away; ELKTON, MD)
UNION HOSPITAL OF CECIL COUNTY (about 13 miles away; ELKTON, MD)
DELAWARE HOSPITAL F/T CHRONICALLY ILL (DHCI) (Nursing Home, about 13 miles away; SMYRNA, DE)
Amtrak station near Middletown: 16 miles: NEWARK (429 S. COLLEGE AVE.) Services: public payphones, free short-term parking, call for car rental service, call for taxi service, public transit connection.
Operable nuclear power plants near Middletown:
16 miles: Salem 2 in Salem, NJ.16 miles: Hope Creek in Salem, NJ.16 miles: Salem 1 in Salem, NJ.
Colleges/universities with over 2000 students nearest to Middletown:
University of Delaware (about 16 miles; Newark, DE ; Full-time enrollment: 20,078)
Wilmington University (about 18 miles; New Castle, DE ; FT enrollment: 10,072)
Delaware Technical Community College-Terry (about 20 miles; Dover, DE ; FT enrollment: 2,239)
Delaware State University (about 21 miles; Dover, DE ; FT enrollment: 4,087)
Delaware Technical Community College-Stanton/Wilmington (about 22 miles; Wilmington, DE ; FT enrollment: 4,972)
Lincoln University of Pennsylvania (about 27 miles; Lincoln University, PA ; FT enrollment: 2,042)
Harford Community College (about 32 miles; Bel Air, MD ; FT enrollment: 4,530)
Public high schools in Middletown: MIDDLETOWN HIGH SCHOOL Students: 2,115, Location: 120 SILVER LAKE ROAD, Grades: 9-12)MOT CHARTER SCHOOL Students: 675, Location: 1156 LEVELS ROAD, Grades: KG-9, Charter school )APPOQUINIMINK HIGH SCHOOL Location: 1080 BUNKER HILL ROAD, Grades: 9-12)
ST. GEORGES TECHNICAL HIGH SCHOOL Location: 555 HYETTS CORNER RD., Grades: 9-12)
Private high school in Middletown: ST ANDREW'S SCHOOL Students: 295, Location: 350 NOXONTOWN RD, Grades: 9-12)
Public elementary/middle schools in Middletown: MEREDITH (EVERETT) MIDDLE SCHOOL Students: 1,097, Location: 504 SOUTH BROAD STREET, Grades: 6-8)REDDING (LOUIS L.) MIDDLE SCHOOL Students: 790, Location: 201 NEW STREET, Grades: 6-8)BRICK MILL ELEMENTARY SCHOOL Students: 762, Location: 378 BRICK MILL ROAD, Grades: 1-5)CEDAR LANE ELEMENTARY SCHOOL Students: 655, Location: 1259 CEDAR LANE ROAD, Grades: 1-5)SILVER LAKE ELEMENTARY SCHOOL Students: 622, Location: 200 EAST COCHRAN STREET, Grades: 1-5)WATERS (ALFRED G.) MIDDLE SCHOOL Location: 1235 CEDAR LANE ROAD, Grades: 6-8)
BUNKER HILL ELEMENTARY SCHOOL Location: 1070 BUNKER HILL ROAD, Grades: 1-5)
Private elementary/middle school in Middletown: ST ANNES EPISCOPAL SCHOOL Students: 306, Location: 211 SILVER LAKE RD, Grades: PK-8)
See full list of schools located in Middletown
Notable locations in Middletown: (A) , Middletown Town Hall (B) , Appoquinimink Library (C) , New Castle County Emergency Medical Services Paramedic Station 5 (D) , Volunteer Hose Company of Middletown Station 27 (E) . Display/hide their locations on the map
Churches in Middletown include: (A) , Mission Fellowship Church (B) , Mid-Town Tabernacle (C) , Connection Community Church (D) , Bethesda United Methodist Church (E) , Saint Josephs Catholic Church (F) , Trinity African Methodist Episcopal Church (G) , Saint Anns Church (H) , Forest United Presbyterian Church (I) . Display/hide their locations on the map
Cemeteries: (1) , Forest Cemetery (2) . Display/hide their locations on the map
Creek: (A) . Display/hide its location on the map
Park in Middletown: (1) . Display/hide its location on the map
Tourist attractions:
Courts:
Birthplace of: Bryheem Hancock - Footballer, John P. Cochran - Farmer, Dan DiNozzi - College basketball player (Delaware Fightin Blue Hens), Leonard Chadwick - Navy Medal of Honor recipient, Mike Potts (American football) - Football player.
New Castle County has a predicted average indoor radon screening level between 2 and 4 pCi/L (pico curies per liter) - Moderate Potential Drinking water stations with addresses in Middletown and their reported violations in the past:
MIDDLETOWN WATER DEPARTMENT (Population served: 16,000, Groundwater):
Past health violations:
MCL, Monthly (TCR) - In AUG-2010, Contaminant: Coliform. Follow-up actions: St Formal NOV issued (AUG-19-2010), St Public Notif requested (AUG-19-2010), St Compliance achieved (SEP-08-2010)
MCL, Monthly (TCR) - In FEB-2009, Contaminant: Coliform. Follow-up actions: St Public Notif requested (FEB-16-2009), St Formal NOV issued (FEB-16-2009), St Compliance achieved (MAR-24-2009), St Public Notif received (APR-16-2009)
MCL, Monthly (TCR) - In SEP-2008, Contaminant: Coliform. Follow-up actions: St Formal NOV issued (SEP-29-2008), St Public Notif issued (SEP-29-2008), St Public Notif received (DEC-02-2008), St Compliance achieved (MAR-24-2009)
MCL, Monthly (TCR) - Between JAN-2007 and MAR-2007, Contaminant: Coliform. Follow-up actions: St Formal NOV issued (MAR-08-2007), St Public Notif issued (MAR-08-2007), St Compliance achieved (MAR-31-2007)
Past monitoring violations:
2 minor monitoring violations
Population served: 300, Groundwater):
Past health violations:
MCL, Monthly (TCR) - Between JAN-2006 and MAR-2006, Contaminant: Coliform. Follow-up actions: St Formal NOV issued (JAN-26-2006), St Public Notif issued (JAN-26-2006), St Compliance achieved (FEB-24-2006)
Population served: 200, Groundwater):
Past monitoring violations:
Initial Tap Sampling for Pb and Cu - In OCT-01-2006, Contaminant: Lead and Copper Rule. Follow-up actions: St Public Notif issued (JAN-10-2007), St Formal NOV issued (2 times from JAN-10-2007 to AUG-02-2007), St Public Notif issued (AUG-02-2007), St Compliance achieved (JUN-03-2008)
5 minor monitoring violations
Population served: 140, Groundwater):
Past health violations:
MCL, Monthly (TCR) - Between JAN-2009 and MAR-2009, Contaminant: Coliform. Follow-up actions: St Public Notif requested (JAN-16-2009), St Formal NOV issued (JAN-16-2009), St Public Notif received (FEB-05-2009), St Compliance achieved (MAR-06-2009)
MCL, Monthly (TCR) - In DEC-2008, Contaminant: Coliform. Follow-up actions: St Formal NOV issued (DEC-17-2008), St Public Notif requested (DEC-17-2008), St Public Notif received (JAN-09-2009), St Compliance achieved (MAR-06-2009)
MCL, Monthly (TCR) - In FEB-2008, Contaminant: Coliform. Follow-up actions: St Formal NOV issued (FEB-29-2008), St Public Notif issued (FEB-29-2008), St Compliance achieved (APR-09-2008)
MCL, Monthly (TCR) - Between JAN-2008 and MAR-2008, Contaminant: Coliform. Follow-up actions: St Public Notif issued (JAN-07-2008), St Formal NOV issued (JAN-07-2008), St Compliance achieved (APR-09-2008)
MCL, Monthly (TCR) - Between OCT-2007 and DEC-2007, Contaminant: Coliform. Follow-up actions: St Formal NOV issued (NOV-08-2007), St Public Notif issued (NOV-08-2007), St Compliance achieved (NOV-27-2007)
Past monitoring violations:
5 minor monitoring violations
Population served: 98, Groundwater):
Past monitoring violations:
Non-Acute MRDL - Between OCT-2008 and DEC-2008, Contaminant: Chlorine. Follow-up actions: St Formal NOV issued (DEC-12-2008), St Public Notif requested (DEC-12-2008), St Public Notif received (JAN-20-2009), St Compliance achieved (SEP-08-2010)
Initial Tap Sampling for Pb and Cu - In JAN-01-2007, Contaminant: Lead and Copper Rule. Follow-up actions: St Formal NOV issued (JAN-10-2007), St Public Notif issued (JAN-10-2007), St Compliance achieved (DEC-13-2007)
Population served: 50, Groundwater):
Past monitoring violations:
Follow-up Or Routine LCR Tap M/R - In OCT-01-2012, Contaminant: Lead and Copper Rule. Follow-up actions: St Public Notif requested (OCT-15-2012), St Formal NOV issued (OCT-15-2012), St Compliance achieved (OCT-24-2012)
Drinking water stations with addresses in Middletown that have no violations reported:
SUMMIT VILLAGE SHOPPING CENTER (Address: SUIT ONE , 2ND FLOOR Population served: 250, Primary Water Source Type: Groundwater)
DANIELS TRAILER PARK (Address: 1018 PORT PENN ROAD Population served: 54, Primary Water Source Type: Groundwater)
SUMMIT CENTER (Population served: 25, Primary Water Source Type: Groundwater)
Average household size: This town:
2.9 peopleDelaware:
2.5 people
Percentage of family households: This town:
77.1%Whole state:
67.4%
Percentage of households with unmarried partners: This town:
7.9%Whole state:
7.3%
Likely homosexual households (counted as self-reported same-sex unmarried-partner households)
Lesbian couples: 0.7% of all households Gay men: 0.2% of all households
114 people in nursing facilities/skilled-nursing facilities in 2010people in other noninstitutional group quarters in 2000
Banks with branches in Middletown (2011 data):
PNC Bank, National Association: Middletown Commons Branch, Middletown @ Super G Branch, Middletown Branch. Info updated 2012/03/20: Bank assets: $263,309.6 mil, Deposits: $197,343.0 mil, headquarters in Wilmington, DE, positive income , Commercial Lending Specialization, 3085 total offices , Holding Company: Pnc Financial Services Group, Inc., The
Manufacturers and Traders Trust Company: Middletown Branch at 399 East Main Street, branch established on 1975/05/01; 405 West Main Street at 405 West Main Street, branch established on 2005/11/21. Info updated 2011/08/08: Bank assets: $76,887.1 mil, Deposits: $60,064.2 mil, headquarters in Buffalo, NY, positive income , Commercial Lending Specialization, 808 total offices , Holding Company: M&T Bank Corporation
Fulton Bank, National Association: Middletown Branch at 468 W Main Street, branch established on 2003/06/23. Info updated 2010/12/30: Bank assets: $9,041.7 mil, Deposits: $6,700.3 mil, headquarters in Lancaster, PA, positive income , Commercial Lending Specialization, 122 total offices , Holding Company: Fulton Financial Corporation
Wells Fargo Bank, National Association: Middletown Branch at 310 Dove Run Center Boulevard, branch established on 1918/01/15. Info updated 2011/04/05: Bank assets: $1,161,490.0 mil, Deposits: $905,653.0 mil, headquarters in Sioux Falls, SD, positive income , 6395 total offices , Holding Company: Wells Fargo & Company
Wilmington Savings Fund Society, FSB: Middletown Branch at 400 East Main Street, branch established on 1995/06/10. Info updated 2011/07/21: Bank assets: $4,281.1 mil, Deposits: $3,150.2 mil, headquarters in Wilmington, DE, positive income , Commercial Lending Specialization, 43 total offices
RBS Citizens, National Association: Middletown Acme Branch at 460 East Main St., branch established on 2003/05/06. Info updated 2007/09/19: Bank assets: $106,940.6 mil, Deposits: $75,690.2 mil, headquarters in Providence, RI, positive income , 1135 total offices , Holding Company: Uk Financial Investments Limited
For population 15 years and over in Middletown:
Never married: 30.3%Now married: 49.9%Separated: 2.0%Widowed: 6.0%Divorced: 11.7% For population 25 years and over in Middletown:
High school or higher: 94.1%Bachelor's degree or higher: 41.9%Graduate or professional degree: 17.8%Unemployed: 4.5%Mean travel time to work (commute): 23.7 minutes
Education Gini index (Inequality in education) Here:
10.9Delaware average:
11.5
Religion statistics for Middletown, DE (based on New Castle County data)
Religion Adherents Congregations Catholic 138,172 33 Mainline Protestant 48,124 125 Evangelical Protestant 32,993 169 Other 22,672 45 Black Protestant 7,212 36 Orthodox 1,166 5 None 288,140 -
Source: Clifford Grammich, Kirk Hadaway, Richard Houseal, Dale E.Jones, Alexei Krindatch, Richie Stanley and Richard H.Taylor. 2012. 2010 U.S.Religion Census: Religious Congregations & Membership Study. Association of Statisticians of American Religious Bodies. Jones, Dale E., et al. 2002. Congregations and Membership in the United States 2000. Nashville, TN: Glenmary Research Center. Graphs represent county-level data
Food Environment Statistics: Number of grocery stores : 82New Castle County :
1.56 / 10,000 pop.Delaware :
1.74 / 10,000 pop.
Number of supercenters and club stores : 3New Castle County :
0.06 / 10,000 pop.Delaware :
0.09 / 10,000 pop.
Number of convenience stores (no gas) : 71New Castle County :
1.35 / 10,000 pop.Delaware :
1.25 / 10,000 pop.
Number of convenience stores (with gas) : 112This county :
2.13 / 10,000 pop.Delaware :
2.84 / 10,000 pop.
Number of full-service restaurants : 337This county :
6.40 / 10,000 pop.Delaware :
7.43 / 10,000 pop.
Adult diabetes rate : New Castle County :
8.0%Delaware :
9.0%
Adult obesity rate : New Castle County :
26.7%Delaware :
27.9%
Health and Nutrition: Healthy diet rate : This city:
48.8%Delaware:
49.1%
Average overall health of teeth and gums : Middletown:
46.4%Delaware:
45.9%
Average BMI : Middletown:
28.9Delaware:
28.8
People feeling badly about themselves : This city:
20.2%State:
20.8%
People not drinking alcohol at all : Middletown:
11.1%Delaware:
11.0%
Average hours sleeping at night : Middletown:
6.7Delaware:
6.8
Overweight people : This city:
33.5%Delaware:
33.9%
General health condition : Average condition of hearing : Middletown:
81.0%Delaware:
79.1%
More about Health and Nutrition of Middletown, DE Residents
Local government employment and payroll (March 2022)
Function
Full-time employees
Monthly full-time payroll
Average yearly full-time wage
Part-time employees
Monthly part-time payroll
Police Protection - Officers
40 $290,138 $87,041 0 $0 Other and Unallocable
24 $120,187 $60,094 1 $2,055 Streets and Highways
18 $65,729 $43,819 0 $0 Other Government Administration
16 $71,578 $53,684 1 $369 Financial Administration
16 $85,299 $63,974 1 $1,949 Electric Power
15 $102,734 $82,187 0 $0 Sewerage
6 $30,398 $60,796 0 $0 Police - Other
6 $27,001 $54,002 0 $0 Water Supply
5 $32,373 $77,695 0 $0 Solid Waste Management
2 $7,768 $46,608 0 $0
Totals for Government
148 $833,203 $67,557 3 $4,372
Middletown government finances - Expenditure in 2021 (per resident):
Construction - General - Other: $405,000 ($16.40)
Current Operations - Electric Utilities: $20,649,000 ($836.06)
Police Protection: $6,772,000 ($274.19)Central Staff Services: $3,647,000 ($147.66)Sewerage: $2,275,000 ($92.11)Water Utilities: $1,900,000 ($76.93)General - Other: $1,744,000 ($70.61)Solid Waste Management: $1,598,000 ($64.70)Financial Administration: $1,285,000 ($52.03)Protective Inspection and Regulation - Other: $1,249,000 ($50.57)Regular Highways: $898,000 ($36.36)Parks and Recreation: $851,000 ($34.46)Electric Utilities - Interest on Debt: $1,000 ($0.04)
General - Interest on Debt: $1,317,000 ($53.32)
Intergovernmental to Local - Other - Sewerage: $28,000 ($1.13)
Other Capital Outlay - Police Protection: $128,000 ($5.18)
Regular Highways: $87,000 ($3.52)Parks and Recreation: $87,000 ($3.52)General - Other: $75,000 ($3.04)Protective Inspection and Regulation - Other: $48,000 ($1.94)Central Staff Services: $47,000 ($1.90)Sewerage: $33,000 ($1.34)Water Utilities: $26,000 ($1.05)Electric Utilities: $26,000 ($1.05)Financial Administration: $5,000 ($0.20)Total Salaries and Wages: $11,624,000 ($470.65)
Water Utilities - Interest on Debt: $34,000 ($1.38)
Middletown government finances - Revenue in 2021 (per resident):
Charges - Sewerage: $3,941,000 ($159.57)
Solid Waste Management: $2,041,000 ($82.64)Other: $495,000 ($20.04)Parks and Recreation: $8,000 ($0.32)Local Intergovernmental - Other: $1,251,000 ($50.65)
Miscellaneous - General Revenue - Other: $2,171,000 ($87.90)
Interest Earnings: $658,000 ($26.64)Rents: $97,000 ($3.93)Fines and Forfeits: $29,000 ($1.17)Sale of Property: $29,000 ($1.17)Revenue - Electric Utilities: $31,510,000 ($1275.81)
Water Utilities: $2,883,000 ($116.73)State Intergovernmental - Highways: $492,000 ($19.92)
Other: $172,000 ($6.96)Tax - Other License: $9,296,000 ($376.39)
Property: $6,048,000 ($244.88)Other Selective Sales: $155,000 ($6.28)
Middletown government finances - Debt in 2021 (per resident):
Long Term Debt - Beginning Outstanding - Unspecified Public Purpose: $30,628,000 ($1240.10)
Outstanding Unspecified Public Purpose: $28,193,000 ($1141.51)Retired Unspecified Public Purpose: $18,275,000 ($739.94)Issue, Unspecified Public Purpose: $15,840,000 ($641.35)Short Term Debt Outstanding - End of Fiscal Year: $524,000 ($21.22)
Beginning: $506,000 ($20.49)
Middletown government finances - Cash and Securities in 2021 (per resident):
Other Funds - Cash and Securities: $38,630,000 ($1564.09)
5.39% of this county's 2021 resident taxpayers lived in other counties in 2020 ($73,141 average adjusted gross income )
Here:
5.39%Delaware average:
6.79%
0.01% of residents moved from foreign countries ($80 average AGI )New Castle County:
0.01%Delaware average:
0.03%
Top counties from which taxpayers relocated into this county between 2020 and 2021:
5.25% of this county's 2020 resident taxpayers moved to other counties in 2021 ($94,385 average adjusted gross income )
Here:
5.25%Delaware average:
5.45%
0.01% of residents moved to foreign countries ($149 average AGI )New Castle County:
0.01%Delaware average:
0.03%
Top counties to which taxpayers relocated from this county between 2020 and 2021:
Businesses in Middletown, DE
Name Count Name Count
AT&T 1 Kohl's 1 Applebee's 1 Lowe's 1 Arby's 1 MasterBrand Cabinets 6 AutoZone 1 McDonald's 2 Blockbuster 1 Papa John's Pizza 1 Buffalo Wild Wings 1 RadioShack 1 Burger King 1 Rite Aid 1 Dairy Queen 1 Ruby Tuesday 1 Domino's Pizza 1 Sears 1 Dunkin Donuts 3 Starbucks 1 FedEx 2 Subway 2 GNC 1 T-Mobile 2 Giant 1 Taco Bell 1 Goodwill 1 The Room Place 1 H&R Block 1 U-Haul 3 Hardee's 1 UPS 3 Hilton 1 Verizon Wireless 1 Home Depot 1 Waffle House 1 Jones New York 1 Walgreens 4 KFC 1 Walmart 1
Strongest AM radio stations in Middletown:
WVCH (740 AM; 50 kW; CHESTER, PA; Owner: WVCH COMMUNICATIONS, INC.)
WPEN (950 AM; 50 kW; PHILADELPHIA, PA; Owner: GREATER PHILADELPHIA RADIO, INC.)
WZZD (990 AM; 50 kW; PHILADELPHIA, PA; Owner: PENNSYLVANIA MEDIA ASSOCIATES, INC.)
WWLG (1370 AM; 50 kW; BALTIMORE, MD; Owner: M-10 BROADCASTING, INC.)
WCBM (680 AM; 50 kW; BALTIMORE, MD; Owner: WCBM MARYLAND, INC.)
KYW (1060 AM; 50 kW; PHILADELPHIA, PA; Owner: INFINITY BROADCASTING OPERATIONS, INC.)
WWJZ (640 AM; 50 kW; MOUNT HOLLY, NJ; Owner: ABC, INC.)
WPHT (1210 AM; 50 kW; PHILADELPHIA, PA; Owner: INFINITY BROADCASTING OPERATIONS, INC.)
WNWR (1540 AM; 50 kW; PHILADELPHIA, PA)
WBIS (1190 AM; 50 kW; ANNAPOLIS, MD; Owner: NATIONS RADIO, LLC)
WBAL (1090 AM; 50 kW; BALTIMORE, MD; Owner: HEARST RADIO, INC.)
WDOV (1410 AM; 5 kW; DOVER, DE; Owner: CAPSTAR TX LIMITED PARTNERSHIP)
WGOP (700 AM; daytime; 25 kW; WALKERSVILLE, MD; Owner: BIRACH BROADCASTING CORPORATION)
Strongest FM radio stations in Middletown:
WDSD (92.9 FM; SMYRNA, DE; Owner: CAPSTAR TX LIMITED PARTNERSHIP)
WOEL-FM (89.9 FM; ELKTON, MD; Owner: MARANATHA BIBLE INSTITUTE, INC.)
WPLY (100.3 FM; MEDIA, PA; Owner: RADIO ONE LICENSES, LLC)
WXCY (103.7 FM; HAVRE DE GRACE, MD; Owner: DELMARVA BROADCASTING COMPANY)
WRDX (94.7 FM; DOVER, DE; Owner: CAPSTAR TX LIMITED PARTNERSHIP)
WMGK (102.9 FM; PHILADELPHIA, PA; Owner: GREATER PHILADELPHIA RADIO, INC.)
WMWX (95.7 FM; PHILADELPHIA, PA; Owner: GREATER PHILADELPHIA RADIO, INC.)
WSNJ-FM (107.7 FM; BRIDGETON, NJ; Owner: COHANZICK BROADCASTING CORPORATION)
WSTW (93.7 FM; WILMINGTON, DE; Owner: DELMARVA BROADCASTING COMPANY)
WRTX (91.7 FM; DOVER, DE; Owner: TEMPLE UNIV OF THE C/WEALTH SYSTEM)
WJBR-FM (99.5 FM; WILMINGTON, DE; Owner: NM LICENSING, LLC)
WJKS (101.7 FM; CANTON, NJ; Owner: QC COMMUNICATIONS, INC)
TV broadcast stations around Middletown:
WTSD-CA (Channel 14; WILMINGTON, DE; Owner: PRIORITY COMMUNICATIONS MINISTRIES, INC.)
KYW-TV (Channel 3; PHILADELPHIA, PA; Owner: CBS BROADCASTING INC.)
WPHL-TV (Channel 17; PHILADELPHIA, PA; Owner: TRIBUNE TELEVISION COMPANY)
WMCN-TV (Channel 53; ATLANTIC CITY, NJ; Owner: LENFEST BROADCASTING, LLC)
WPPX (Channel 61; WILMINGTON, DE; Owner: PAXSON PHILADELPHIA LICENSE, INC.)
WPVI-TV (Channel 6; PHILADELPHIA, PA; Owner: ABC, INC.)
WPSG (Channel 57; PHILADELPHIA, PA; Owner: VIACOM STATIONS GROUP OF PHILADELPHIA INC.)
WCAU (Channel 10; PHILADELPHIA, PA; Owner: NBC SUBSIDIARY (WCAU-TV), L.P.)
WEVD-LP (Channel 27; DOVER, DE; Owner: DELMARVA BROADCAST SERVICE)
Medal of Honor Recipients
Medal of Honor Recipient born in Middletown: Leonard Chadwick.
National Bridge Inventory (NBI) Statistics 49 Number of bridges574ft / 175m Total length $1,122,000 Total costs395,486 Total average daily traffic36,432 Total average daily truck traffic
New bridges - historical statistics
2 1930-1939 1 1960-1969 1 1970-1979 1 1980-1989 3 1990-1999 6 2000-2009 35 2010-2019
See full National Bridge Inventory statistics for Middletown, DE
Home Mortgage Disclosure Act Aggregated Statistics For Year 2009(Based on 2 partial tracts) A) FHA, FSA/RHS & VA B) Conventional C) Refinancings D) Home Improvement Loans F) Non-occupant Loans on G) Loans On Manufactured Number Average Value Number Average Value Number Average Value Number Average Value Number Average Value Number Average Value
LOANS ORIGINATED 65 $241,975 25 $231,754 155 $236,369 10 $41,104 6 $223,295 2 $22,975 APPLICATIONS APPROVED, NOT ACCEPTED 2 $148,380 2 $166,140 14 $223,769 1 $53,570 1 $23,880 0 $0 APPLICATIONS DENIED 8 $229,380 6 $148,367 77 $245,617 12 $59,073 3 $100,587 3 $46,587 APPLICATIONS WITHDRAWN 12 $281,814 3 $235,040 37 $289,155 2 $95,785 2 $192,300 0 $0 FILES CLOSED FOR INCOMPLETENESS 2 $166,735 0 $0 9 $245,748 2 $180,170 0 $0 0 $0
Aggregated Statistics For Year 2008(Based on 2 partial tracts) A) FHA, FSA/RHS & VA B) Conventional C) Refinancings D) Home Improvement Loans E) Loans on Dwellings For 5+ Families F) Non-occupant Loans on G) Loans On Manufactured Number Average Value Number Average Value Number Average Value Number Average Value Number Average Value Number Average Value Number Average Value
LOANS ORIGINATED 38 $254,689 55 $230,783 102 $220,832 17 $63,375 1 $719,040 12 $165,005 3 $25,317 APPLICATIONS APPROVED, NOT ACCEPTED 2 $285,250 8 $179,565 21 $263,815 8 $86,644 0 $0 1 $123,420 1 $68,760 APPLICATIONS DENIED 8 $303,299 17 $200,076 94 $225,336 24 $78,642 0 $0 7 $155,879 3 $42,543 APPLICATIONS WITHDRAWN 3 $335,713 12 $237,938 32 $255,222 4 $93,985 0 $0 3 $156,690 0 $0 FILES CLOSED FOR INCOMPLETENESS 2 $207,400 0 $0 10 $260,589 1 $29,830 0 $0 2 $109,955 0 $0
Aggregated Statistics For Year 2007(Based on 2 partial tracts) A) FHA, FSA/RHS & VA B) Conventional C) Refinancings D) Home Improvement Loans F) Non-occupant Loans on G) Loans On Manufactured Number Average Value Number Average Value Number Average Value Number Average Value Number Average Value Number Average Value
LOANS ORIGINATED 15 $246,599 167 $205,578 131 $210,350 37 $55,966 25 $185,495 6 $39,028 APPLICATIONS APPROVED, NOT ACCEPTED 0 $0 20 $210,033 34 $201,051 8 $41,915 3 $290,270 1 $35,500 APPLICATIONS DENIED 1 $204,750 28 $187,177 117 $225,696 42 $89,312 10 $159,158 4 $22,028 APPLICATIONS WITHDRAWN 0 $0 25 $219,641 56 $222,338 5 $214,306 5 $158,114 0 $0 FILES CLOSED FOR INCOMPLETENESS 0 $0 6 $222,863 19 $260,100 1 $230,280 2 $115,610 0 $0
Aggregated Statistics For Year 2006(Based on 2 partial tracts) A) FHA, FSA/RHS & VA B) Conventional C) Refinancings D) Home Improvement Loans F) Non-occupant Loans on G) Loans On Manufactured Number Average Value Number Average Value Number Average Value Number Average Value Number Average Value Number Average Value
LOANS ORIGINATED 11 $209,428 174 $174,796 186 $193,289 49 $59,491 43 $134,487 5 $36,928 APPLICATIONS APPROVED, NOT ACCEPTED 0 $0 23 $205,657 39 $189,239 9 $36,613 5 $182,402 2 $62,555 APPLICATIONS DENIED 2 $166,610 43 $164,241 129 $222,093 49 $61,971 21 $113,438 4 $27,495 APPLICATIONS WITHDRAWN 1 $74,620 24 $184,122 88 $227,901 7 $124,891 8 $113,144 0 $0 FILES CLOSED FOR INCOMPLETENESS 1 $245,600 6 $199,167 22 $247,478 1 $152,060 1 $168,100 0 $0
Aggregated Statistics For Year 2005(Based on 2 partial tracts) A) FHA, FSA/RHS & VA B) Conventional C) Refinancings D) Home Improvement Loans F) Non-occupant Loans on G) Loans On Manufactured Number Average Value Number Average Value Number Average Value Number Average Value Number Average Value Number Average Value
LOANS ORIGINATED 22 $188,414 320 $206,198 211 $189,645 46 $63,838 39 $137,293 6 $28,680 APPLICATIONS APPROVED, NOT ACCEPTED 1 $212,300 27 $190,889 28 $187,588 12 $36,933 2 $122,095 4 $58,738 APPLICATIONS DENIED 1 $116,020 41 $160,248 107 $171,700 38 $42,603 14 $98,612 7 $41,969 APPLICATIONS WITHDRAWN 0 $0 27 $203,812 76 $179,369 12 $117,614 3 $154,000 0 $0 FILES CLOSED FOR INCOMPLETENESS 0 $0 9 $193,883 34 $227,430 4 $87,212 1 $141,960 0 $0
Aggregated Statistics For Year 2004(Based on 2 partial tracts) A) FHA, FSA/RHS & VA B) Conventional C) Refinancings D) Home Improvement Loans F) Non-occupant Loans on G) Loans On Manufactured Number Average Value Number Average Value Number Average Value Number Average Value Number Average Value Number Average Value
LOANS ORIGINATED 22 $164,322 200 $189,308 166 $170,363 34 $51,877 27 $119,823 3 $16,903 APPLICATIONS APPROVED, NOT ACCEPTED 1 $181,730 16 $187,391 28 $160,608 6 $37,527 2 $79,910 0 $0 APPLICATIONS DENIED 2 $125,450 26 $143,283 88 $158,943 31 $31,375 11 $80,004 8 $27,162 APPLICATIONS WITHDRAWN 1 $257,360 22 $182,088 49 $164,846 4 $82,010 2 $128,150 0 $0 FILES CLOSED FOR INCOMPLETENESS 0 $0 4 $208,472 32 $178,756 2 $62,990 2 $114,370 0 $0
Aggregated Statistics For Year 2003(Based on 2 partial tracts) A) FHA, FSA/RHS & VA B) Conventional C) Refinancings D) Home Improvement Loans F) Non-occupant Loans on Number Average Value Number Average Value Number Average Value Number Average Value Number Average Value
LOANS ORIGINATED 24 $137,275 103 $146,873 259 $168,850 20 $29,682 15 $92,369 APPLICATIONS APPROVED, NOT ACCEPTED 3 $108,087 11 $140,638 46 $135,344 6 $25,512 1 $119,900 APPLICATIONS DENIED 2 $108,030 17 $96,389 102 $143,187 21 $33,486 5 $52,274 APPLICATIONS WITHDRAWN 2 $158,495 13 $136,981 56 $163,202 4 $36,832 2 $65,350 FILES CLOSED FOR INCOMPLETENESS 2 $134,435 2 $101,885 13 $204,397 2 $59,245 1 $30,830
Aggregated Statistics For Year 1999(Based on 1 partial tract) A) FHA, FSA/RHS & VA B) Conventional C) Refinancings D) Home Improvement Loans F) Non-occupant Loans on Number Average Value Number Average Value Number Average Value Number Average Value Number Average Value
LOANS ORIGINATED 47 $108,456 75 $100,032 47 $68,323 16 $17,922 3 $43,573 APPLICATIONS APPROVED, NOT ACCEPTED 1 $199,160 20 $80,383 14 $100,754 3 $14,830 1 $455,130 APPLICATIONS DENIED 5 $92,668 23 $50,021 36 $73,364 11 $11,945 2 $48,590 APPLICATIONS WITHDRAWN 2 $105,740 8 $67,926 17 $80,840 1 $8,210 1 $8,210 FILES CLOSED FOR INCOMPLETENESS 0 $0 1 $57,490 3 $108,590 0 $0 0 $0
Detailed HMDA statistics for the following Tracts:
0166.01
, 0166.04
Private Mortgage Insurance Companies Aggregated Statistics For Year 2009(Based on 2 partial tracts) A) Conventional B) Refinancings Number Average Value Number Average Value
LOANS ORIGINATED 5 $286,746 6 $318,940 APPLICATIONS APPROVED, NOT ACCEPTED 1 $262,900 3 $285,793 APPLICATIONS DENIED 0 $0 1 $250,590 APPLICATIONS WITHDRAWN 0 $0 0 $0 FILES CLOSED FOR INCOMPLETENESS 1 $356,370 0 $0
Aggregated Statistics For Year 2008(Based on 2 partial tracts) A) Conventional B) Refinancings C) Non-occupant Loans on Number Average Value Number Average Value Number Average Value
LOANS ORIGINATED 26 $260,921 13 $296,244 1 $135,880 APPLICATIONS APPROVED, NOT ACCEPTED 11 $287,102 4 $295,042 0 $0 APPLICATIONS DENIED 3 $205,797 2 $340,900 1 $265,150 APPLICATIONS WITHDRAWN 1 $476,520 1 $426,480 0 $0 FILES CLOSED FOR INCOMPLETENESS 3 $335,403 0 $0 2 $295,030
Aggregated Statistics For Year 2007(Based on 2 partial tracts) A) Conventional B) Refinancings C) Non-occupant Loans on Number Average Value Number Average Value Number Average Value
LOANS ORIGINATED 86 $263,997 13 $307,863 5 $213,336 APPLICATIONS APPROVED, NOT ACCEPTED 6 $242,062 3 $277,197 0 $0 APPLICATIONS DENIED 1 $343,790 0 $0 1 $251,210 APPLICATIONS WITHDRAWN 5 $320,344 1 $155,020 0 $0 FILES CLOSED FOR INCOMPLETENESS 0 $0 0 $0 0 $0
Aggregated Statistics For Year 2006(Based on 2 partial tracts) A) Conventional B) Refinancings C) Non-occupant Loans on Number Average Value Number Average Value Number Average Value
LOANS ORIGINATED 37 $227,429 7 $292,610 5 $157,372 APPLICATIONS APPROVED, NOT ACCEPTED 6 $316,913 4 $241,102 0 $0 APPLICATIONS DENIED 0 $0 0 $0 0 $0 APPLICATIONS WITHDRAWN 3 $316,553 1 $344,690 0 $0 FILES CLOSED FOR INCOMPLETENESS 0 $0 0 $0 0 $0
Aggregated Statistics For Year 2005(Based on 2 partial tracts) A) Conventional B) Refinancings C) Non-occupant Loans on Number Average Value Number Average Value Number Average Value
LOANS ORIGINATED 56 $262,434 13 $219,090 5 $216,590 APPLICATIONS APPROVED, NOT ACCEPTED 9 $279,256 1 $156,170 1 $63,020 APPLICATIONS DENIED 0 $0 1 $154,140 0 $0 APPLICATIONS WITHDRAWN 2 $220,860 1 $336,390 0 $0 FILES CLOSED FOR INCOMPLETENESS 0 $0 0 $0 0 $0
Aggregated Statistics For Year 2004(Based on 2 partial tracts) A) Conventional B) Refinancings C) Non-occupant Loans on Number Average Value Number Average Value Number Average Value
LOANS ORIGINATED 52 $210,344 12 $194,899 5 $122,646 APPLICATIONS APPROVED, NOT ACCEPTED 11 $220,469 4 $163,848 1 $110,500 APPLICATIONS DENIED 0 $0 0 $0 0 $0 APPLICATIONS WITHDRAWN 4 $224,378 1 $51,210 1 $208,070 FILES CLOSED FOR INCOMPLETENESS 0 $0 0 $0 0 $0
Aggregated Statistics For Year 2003(Based on 2 partial tracts) A) Conventional B) Refinancings C) Non-occupant Loans on Number Average Value Number Average Value Number Average Value
LOANS ORIGINATED 34 $149,187 25 $181,162 7 $98,546 APPLICATIONS APPROVED, NOT ACCEPTED 6 $175,968 6 $153,305 0 $0 APPLICATIONS DENIED 1 $134,500 0 $0 1 $71,580 APPLICATIONS WITHDRAWN 2 $167,050 4 $191,698 0 $0 FILES CLOSED FOR INCOMPLETENESS 0 $0 0 $0 0 $0
Aggregated Statistics For Year 1999(Based on 1 partial tract) A) Conventional B) Refinancings Number Average Value Number Average Value
LOANS ORIGINATED 20 $124,047 5 $102,386 APPLICATIONS APPROVED, NOT ACCEPTED 1 $180,000 0 $0 APPLICATIONS DENIED 1 $85,550 0 $0 APPLICATIONS WITHDRAWN 1 $85,550 1 $86,230 FILES CLOSED FOR INCOMPLETENESS 0 $0 0 $0
Detailed PMIC statistics for the following Tracts:
0166.01
, 0166.04 Fire-safe hotels and motels in Middletown, Delaware:
Hampton Inn Middletown, 117 Sandhill Dr, Middletown, Delaware 19709 Phone: (302) 378-5656
Holiday Inn Express & Suites, 315 Auto Park Dr, Middletown, Delaware 19709 Phone: (800) 465-4329
All 2 fire-safe hotels and motels in Middletown, Delaware
Most common first names in Middletown, DE among deceased individuals Name Count Lived (average)
John 86 73.2 years William 80 70.4 years James 61 69.9 years Mary 50 78.6 years Charles 42 73.0 years Robert 41 69.1 years George 38 73.2 years Elizabeth 35 76.8 years Helen 35 81.9 years Joseph 32 72.6 years
Most common last names in Middletown, DE among deceased individuals Last name Count Lived (average)
Williams 23 72.1 years Brown 19 75.4 years Smith 14 75.0 years Wilson 14 73.3 years Davis 13 75.1 years Thomas 13 75.8 years Johnson 12 65.3 years Jones 10 77.4 years Reynolds 10 79.9 years Coleman 10 75.2 years
Middletown compared to Delaware state average:
Unemployed percentage significantly below state average. Black race population percentage significantly above state average. Hispanic race population percentage above state average. Median age significantly below state average. Foreign-born population percentage significantly above state average. House age significantly below state average. Number of college students above state average. Percentage of population with a bachelor's degree or higher above state average. Middletown on our top lists :
#19 on the list of "Top 101 cities with the largest percentage population increase from 2000 (population 5,000+)"
#28 on the list of "Top 101 cities with the most residents born in United Kingdom (population 500+)"
#28 on the list of "Top 101 cities with the most residents born in Yugoslavia (population 500+)"
#28 on the list of "Top 101 cities with the most residents born in Asia, n.e.c. (population 500+)"
#28 on the list of "Top 101 cities with the most residents born in Melanesia (population 500+)"
#28 on the list of "Top 101 cities with the most residents born in Micronesia (population 500+)"
#28 on the list of "Top 101 cities with the most residents born in Polynesia (population 500+)"
#50 on the list of "Top 101 cities with the most residents born in Other South Eastern Asia (population 500+)"
#56 on the list of "Top 101 cities with largest percentage of females in industries: finance and insurance (population 5,000+)"
#56 on the list of "Top 101 cities with the most residents born in Born at sea (population 500+)"
#66 on the list of "Top 101 cities with the most residents born in Armenia (population 500+)"
#17 on the list of "Top 101 counties with the highest number of infant deaths per 1000 residents 2007-2013 (pop. 50,000+)"
#35 on the list of "Top 101 counties with the highest percentage of residents that visited a dentist within the past year"
#51 on the list of "Top 101 counties with the highest carbon monoxide air pollution readings in 2012 (ppm)"
#53 on the list of "Top 101 counties with the highest average weight of females"
#55 on the list of "Top 101 counties with the highest Nitrogen Dioxide air pollution readings in 2012 (ppm)"
Top Patent Applicants
James Narvel (43)
David R. Wooten, Jr. (36)
Marty W. Degroot (29)
Xiaoming Jin (23)
Keith Edgett (16)
Mark L. Robin (15)
Keith H. Burlew (14)
Brian Michael Roesch (13)
Paula Louise Sharpe (11)
Robert Jorgensen (10)
Total of 494 patent applications in 2008-2024.
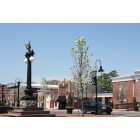
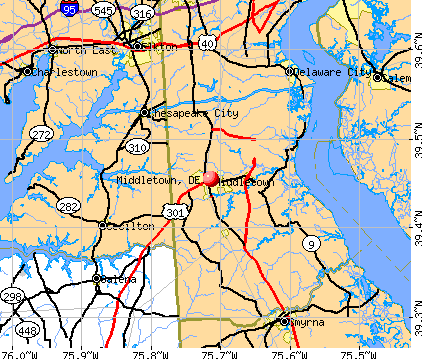


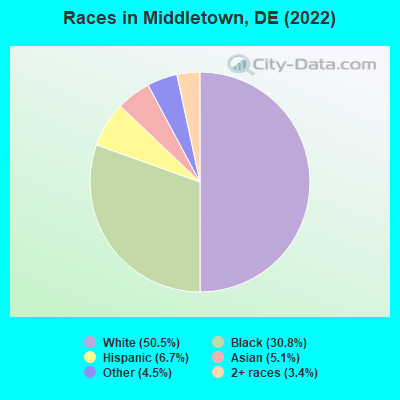
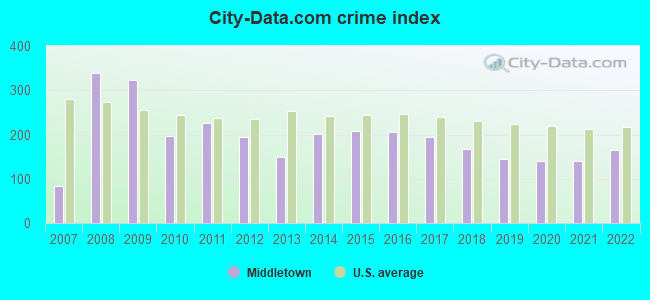
 Recent articles from our blog. Our writers, many of them Ph.D. graduates or candidates, create easy-to-read articles on a wide variety of topics.

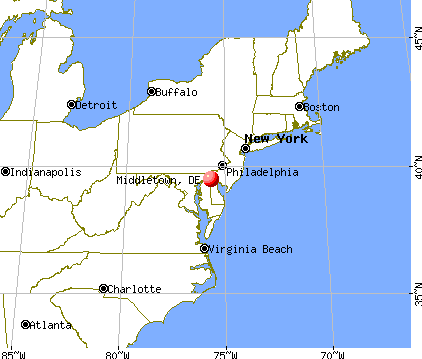
 , pop. 67,114).
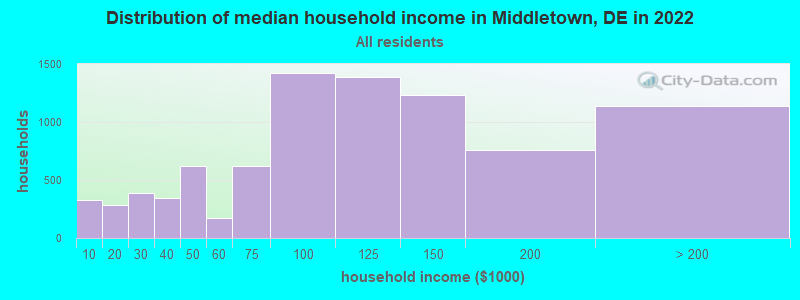
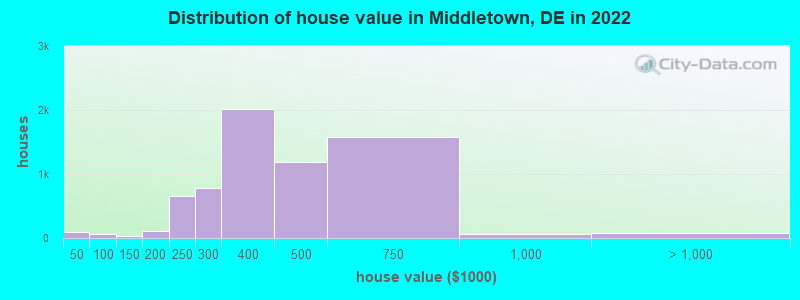

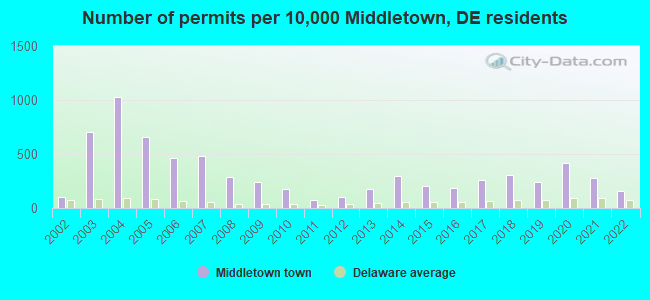
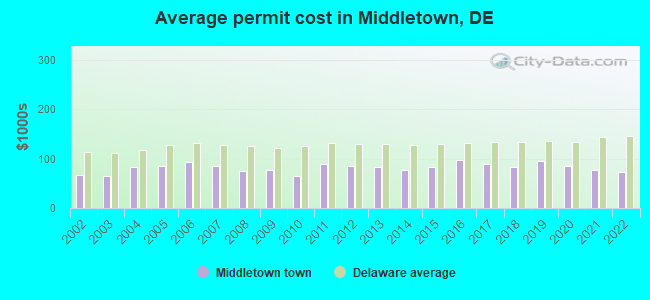
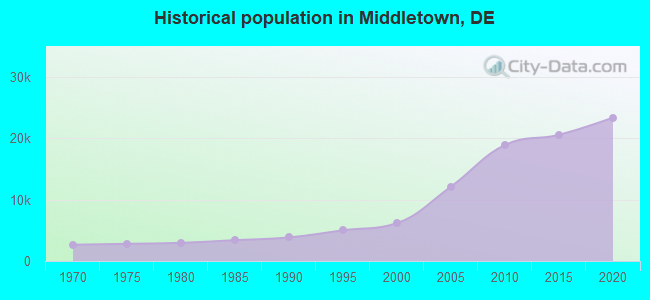
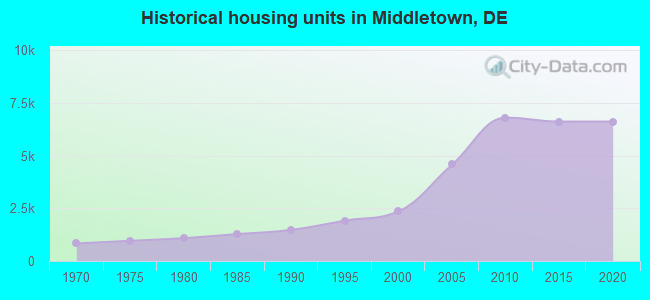
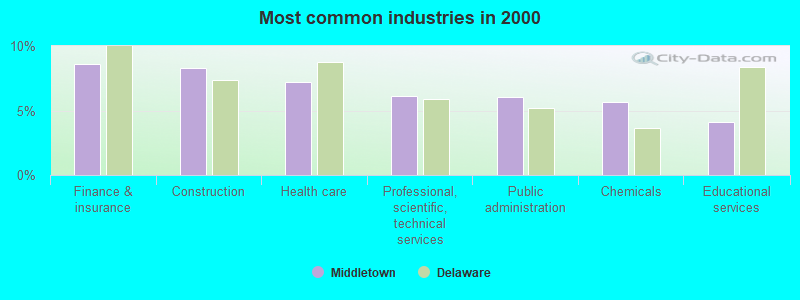
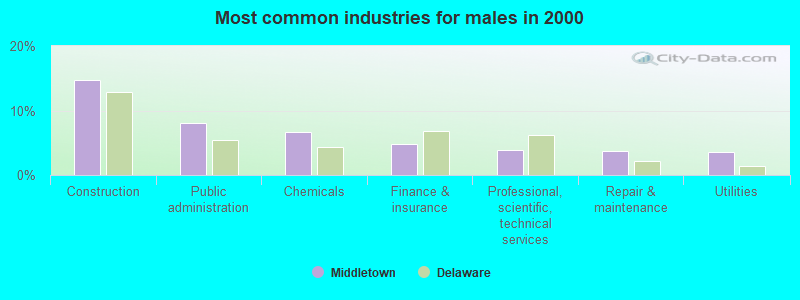
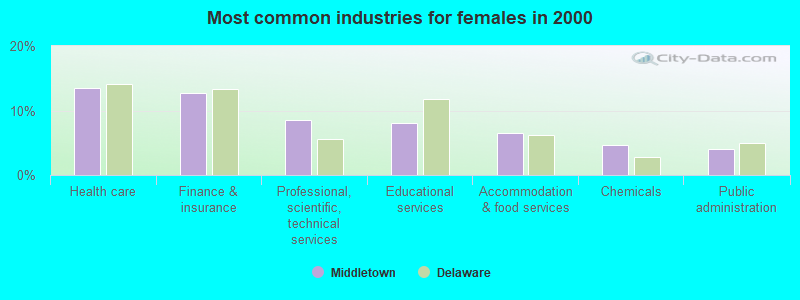
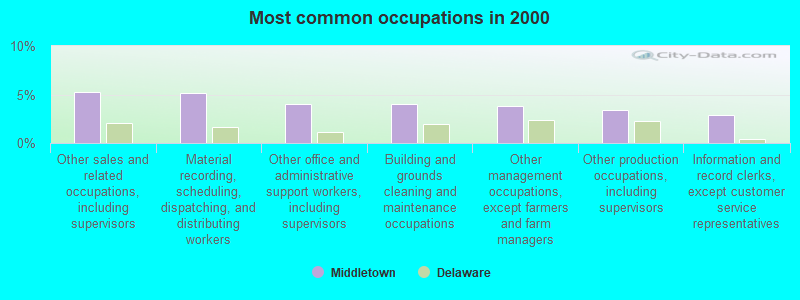
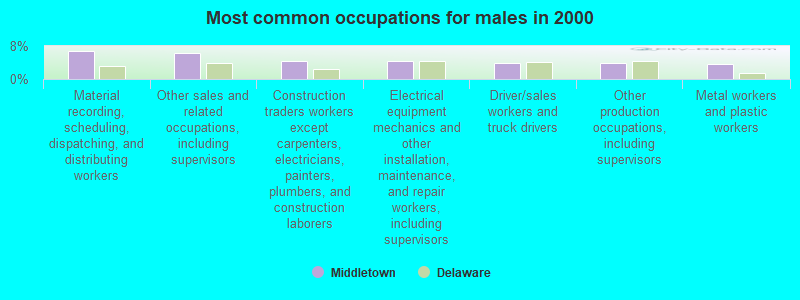
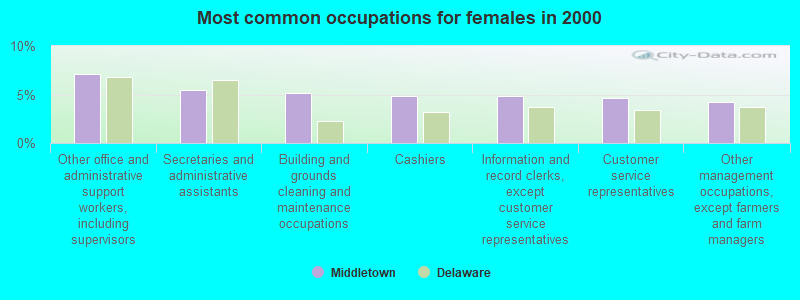


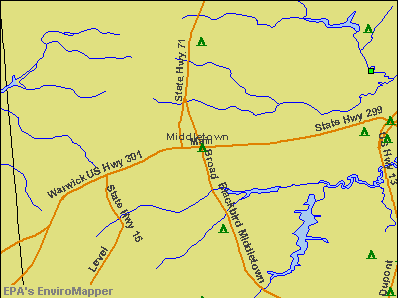

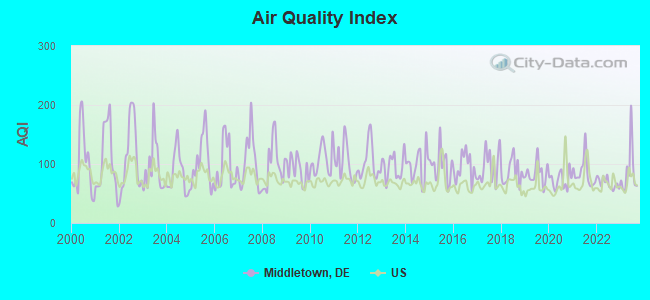
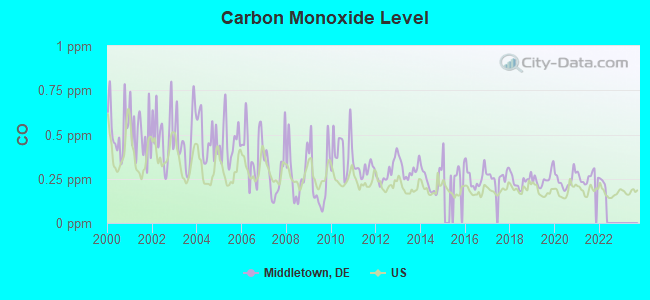
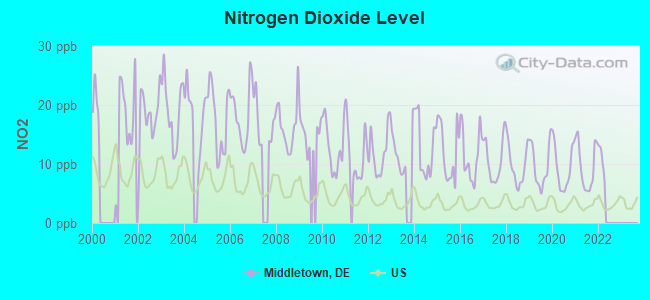
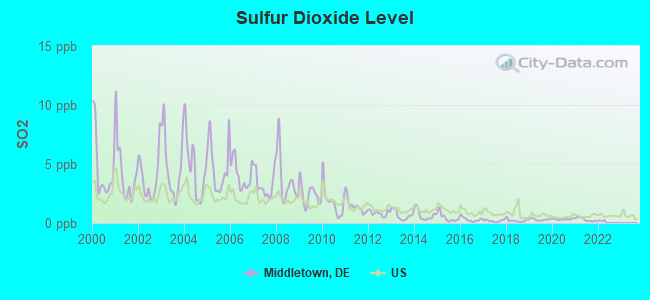
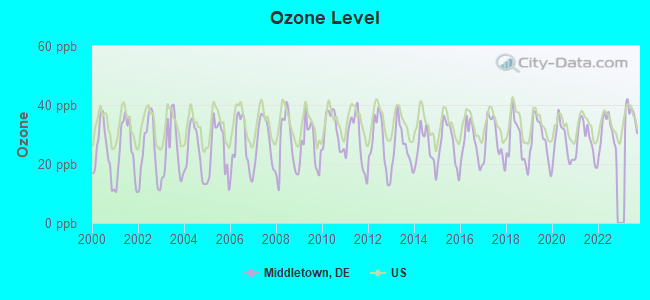
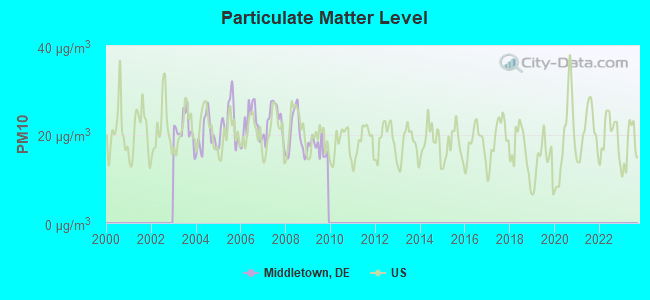

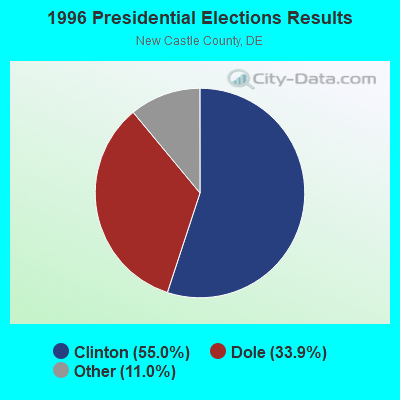
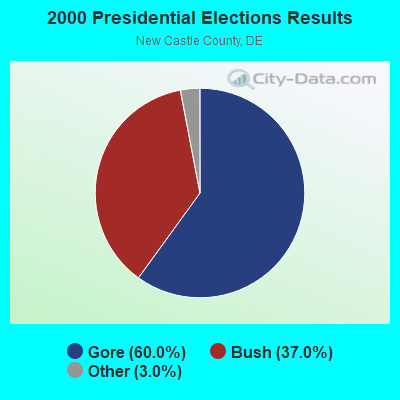
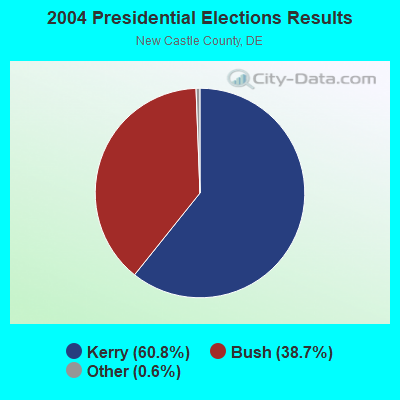
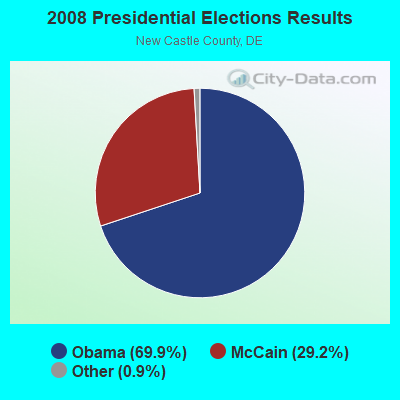
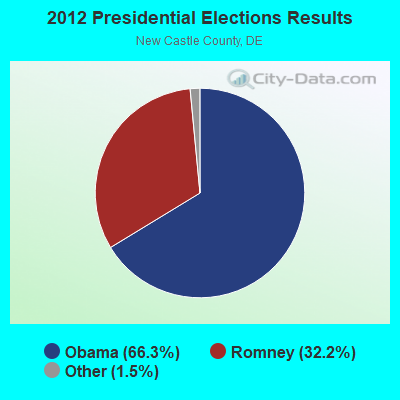
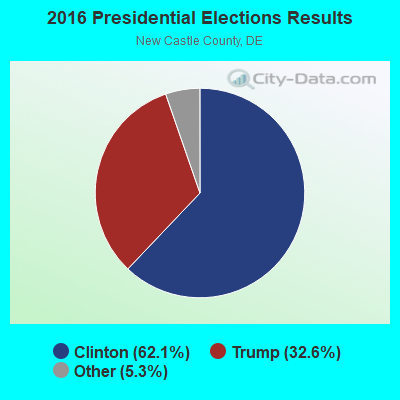
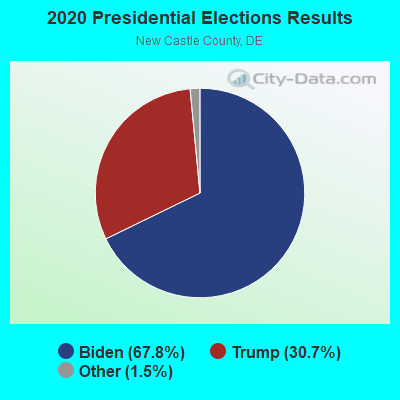
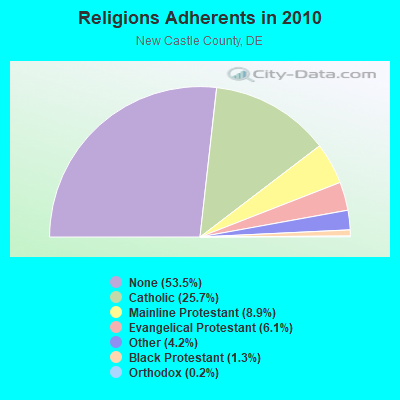
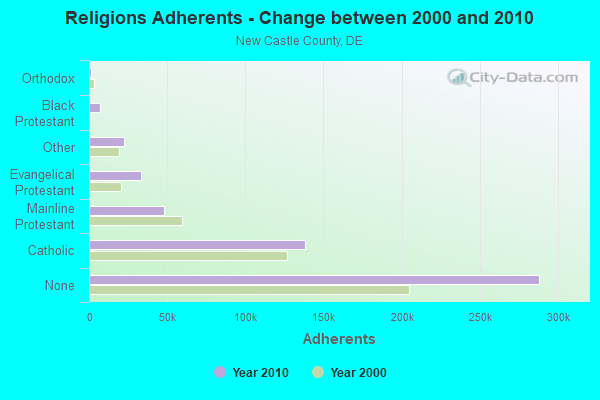
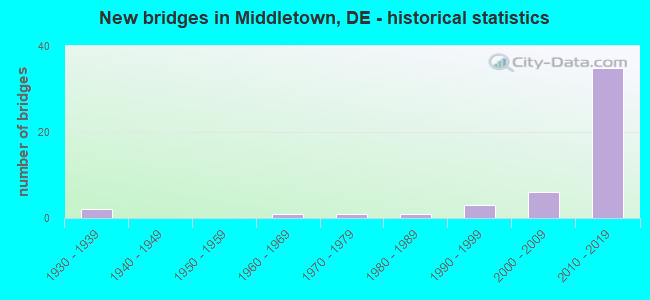
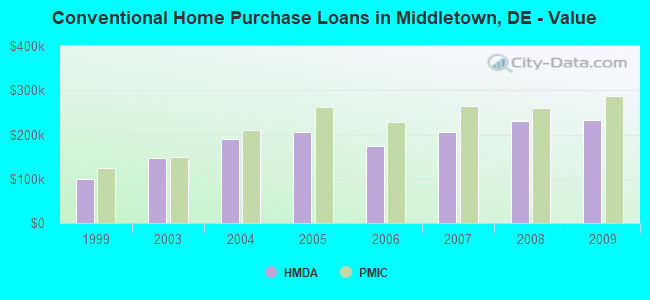
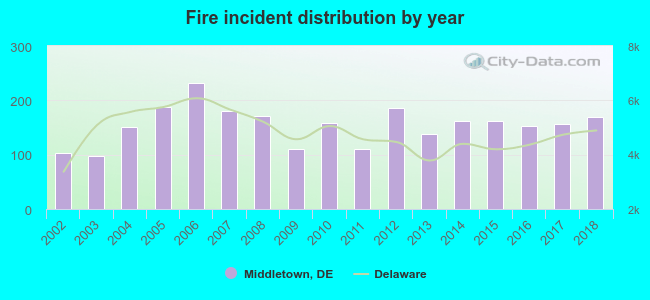 Based on the data from the years 2002 - 2018 the average number of fire incidents per year is 154. The highest number of reported fires - 231 took place in 2006, and the least - 97 in 2003. The data has a rising trend.
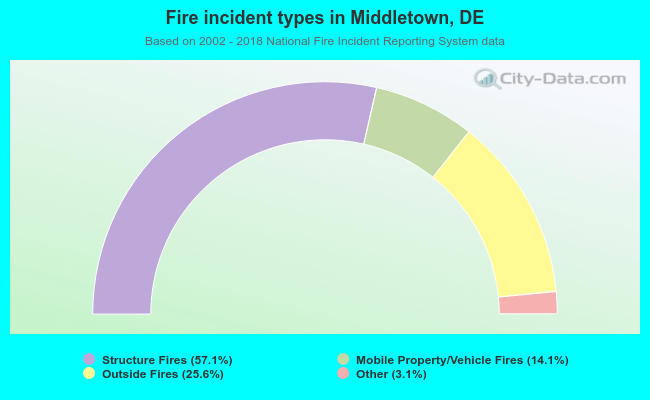 When looking into fire subcategories, the most reports belonged to: Structure Fires (57.1%), and Outside Fires (25.6%).