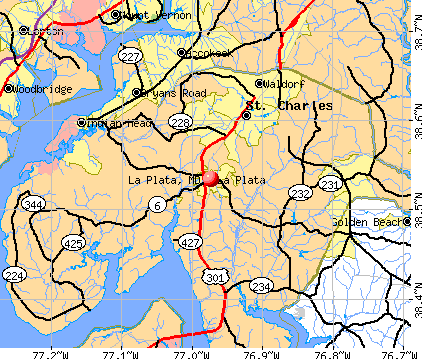
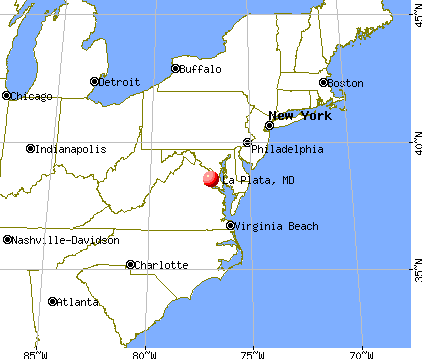
La Plata, Maryland
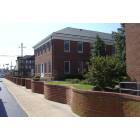
La Plata: SW corner of the Bolton Building

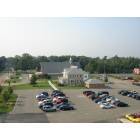
La Plata: The Baldus Centre at Rt. 301 and Rt. 6

La Plata: La Plata Town Hall during Fall celebration
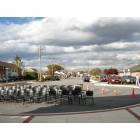
La Plata: La Grange Avenue during Fall celebration

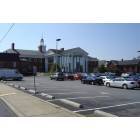
La Plata: Rt. 301 and Rt. 6, looking North
La Plata: Sacred Heart Church

La Plata: Centennial Street and St. Mary's Avenue
La Plata: North side of the Charles County Courthouse
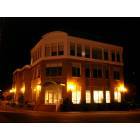
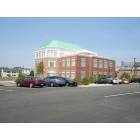
La Plata: The Bolton Building at night
La Plata: Serpentine brick wall surrounding the Charles County Courthouse

La Plata: The Carrico Building
- see
23
more - add
your
Submit your own pictures of this town and show them to the world
- OSM Map
- General Map
- Google Map
- MSN Map
Population change since 2000: +63.0%
| Males: 5,421 | |
| Females: 5,255 |
| Median resident age: | 41.5 years |
| Maryland median age: | 39.7 years |
Zip codes: 20646.
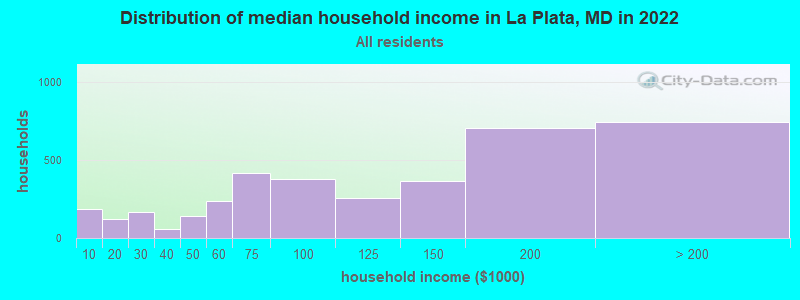
| La Plata: | $116,061 |
| MD: | $94,991 |
Estimated per capita income in 2022: $46,981 (it was $24,669 in 2000)
La Plata town income, earnings, and wages data
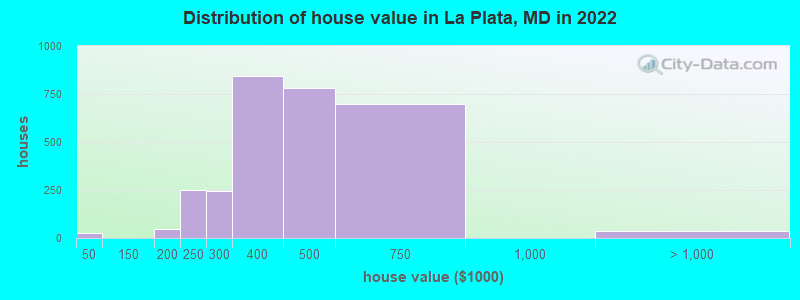
Estimated median house or condo value in 2022: $413,589 (it was $175,400 in 2000)
| La Plata: | $413,589 |
| MD: | $398,100 |
Mean prices in 2022: all housing units: $420,996; detached houses: $445,024; townhouses or other attached units: $369,622; in 5-or-more-unit structures: $336,955
Median gross rent in 2022: $1,492.
(4.3% for White Non-Hispanic residents, 4.0% for Black residents)
Detailed information about poverty and poor residents in La Plata, MD


- 5,01147.9%White alone
- 3,90837.3%Black alone
- 6476.2%Hispanic
- 4674.5%Two or more races
- 2402.3%Asian alone
- 40.04%American Indian alone
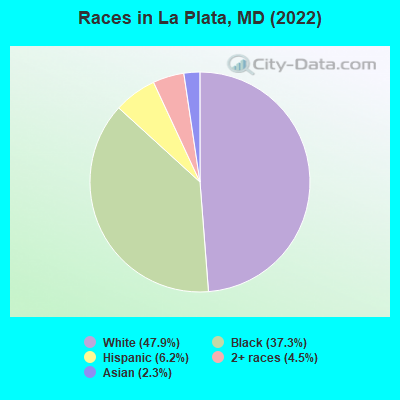
Races in La Plata detailed stats: ancestries, foreign born residents, place of birth
According to our research of Maryland and other state lists, there were 27 registered sex offenders living in La Plata, Maryland as of May 16, 2024.
The ratio of all residents to sex offenders in La Plata is 339 to 1.
Type |
2009 |
2010 |
2011 |
2012 |
2013 |
2014 |
2015 |
2016 |
2017 |
2018 |
2019 |
2020 |
2022 |
|---|---|---|---|---|---|---|---|---|---|---|---|---|---|
| Murders (per 100,000) | 0 (0.0) | 0 (0.0) | 0 (0.0) | 0 (0.0) | 0 (0.0) | 0 (0.0) | 0 (0.0) | 0 (0.0) | 0 (0.0) | 0 (0.0) | 0 (0.0) | 0 (0.0) | 0 (0.0) |
| Rapes (per 100,000) | 0 (0.0) | 0 (0.0) | 0 (0.0) | 0 (0.0) | 0 (0.0) | 1 (11.0) | 0 (0.0) | 0 (0.0) | 1 (10.7) | 0 (0.0) | 0 (0.0) | 0 (0.0) | 0 (0.0) |
| Robberies (per 100,000) | 6 (65.4) | 15 (171.4) | 6 (67.9) | 9 (100.2) | 6 (66.4) | 9 (98.9) | 6 (66.3) | 13 (141.3) | 17 (182.3) | 10 (105.8) | 9 (94.4) | 13 (133.6) | 4 (37.5) |
| Assaults (per 100,000) | 28 (305.3) | 36 (411.3) | 41 (464.0) | 28 (311.7) | 39 (431.8) | 37 (406.6) | 29 (320.5) | 19 (206.5) | 22 (236.0) | 31 (328.1) | 38 (398.4) | 31 (318.7) | 17 (159.3) |
| Burglaries (per 100,000) | 30 (327.2) | 44 (502.7) | 35 (396.1) | 33 (367.4) | 47 (520.4) | 24 (263.7) | 27 (298.4) | 52 (565.2) | 43 (461.2) | 21 (222.2) | 20 (209.7) | 13 (133.6) | 16 (149.9) |
| Thefts (per 100,000) | 279 (3,043) | 287 (3,279) | 285 (3,225) | 216 (2,405) | 227 (2,513) | 297 (3,264) | 269 (2,973) | 210 (2,282) | 250 (2,681) | 278 (2,942) | 285 (2,988) | 252 (2,590) | 64 (599.7) |
| Auto thefts (per 100,000) | 17 (185.4) | 10 (114.2) | 15 (169.8) | 5 (55.7) | 5 (55.4) | 8 (87.9) | 11 (121.6) | 9 (97.8) | 29 (311.0) | 13 (137.6) | 11 (115.3) | 15 (154.2) | 1 (9.4) |
| Arson (per 100,000) | 0 (0.0) | 0 (0.0) | 0 (0.0) | 1 (11.1) | 3 (33.2) | 2 (22.0) | 7 (77.4) | 9 (97.8) | 1 (10.7) | 4 (42.3) | 2 (21.0) | 0 (0.0) | 0 (0.0) |
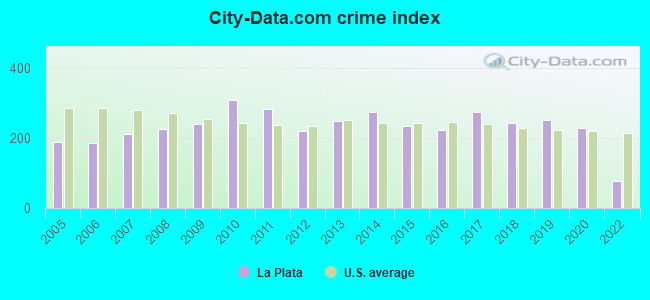
| City-Data.com crime index | 240.1 | 309.2 | 283.5 | 218.8 | 247.7 | 275.8 | 233.5 | 222.4 | 274.9 | 241.6 | 251.4 | 229.1 | 78.3 |
The City-Data.com crime index weighs serious crimes and violent crimes more heavily. Higher means more crime, U.S. average is 246.1. It adjusts for the number of visitors and daily workers commuting into cities.
Crime rate in La Plata detailed stats: murders, rapes, robberies, assaults, burglaries, thefts, arson
Full-time law enforcement employees in 2021, including police officers: 21 (20 officers - 20 male; 0 female).
| Officers per 1,000 residents here: | 2.02 |
| Maryland average: | 2.47 |
 Recent articles from our blog. Our writers, many of them Ph.D. graduates or candidates, create easy-to-read articles on a wide variety of topics.

 | Wealthiest Black Majority County is Charles County (68 replies) |
| Main St. Upper Marlboro (29 replies) |
| La Plata, MD v. King George, VA (17 replies) |
| La Plata commute to downtown DC? (18 replies) |
| Looking for insight on La Plata/Waldorf! (22 replies) |
| St. Charles, MD - A Place for Millennial Families? (50 replies) |
Latest news from La Plata, MD collected exclusively by city-data.com from local newspapers, TV, and radio stations
Ancestries: English (16.7%), Irish (7.0%), German (4.5%), Italian (3.5%), American (3.3%), Nigerian (2.6%).
Current Local Time: EST time zone
Incorporated in 1888
Elevation: 193 feet
Land area: 6.95 square miles.
Population density: 1,536 people per square mile (low).
875 residents are foreign born (3.6% Latin America, 1.9% Asia, 1.6% Europe, 0.8% Africa).
| This town: | 8.4% |
| Maryland: | 15.7% |
Median real estate property taxes paid for housing units with mortgages in 2022: $4,882 (1.1%)
Median real estate property taxes paid for housing units with no mortgage in 2022: $3,575 (1.0%)
Nearest city with pop. 50,000+: Alexandria, VA  (20.2 miles , pop. 128,283).
Nearest city with pop. 200,000+: Washington, DC (26.3 miles , pop. 572,059).
Nearest city with pop. 1,000,000+: Philadelphia, PA (140.8 miles , pop. 1,517,550).
Nearest cities:
), ), ), ), ), ), Latitude: 38.53 N, Longitude: 76.97 W
Daytime population change due to commuting: +3,190 (+30.5%)
Workers who live and work in this town: 1,575 (30.8%)
Area codes: 240, 301
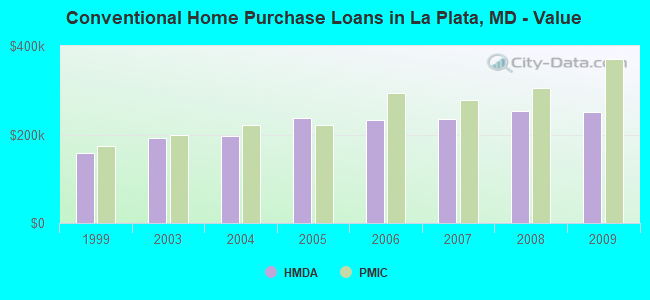
Property values in La Plata, MD

La Plata, Maryland accommodation & food services, waste management - Economy and Business Data
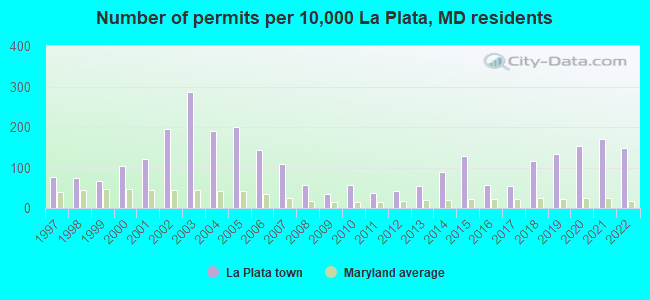
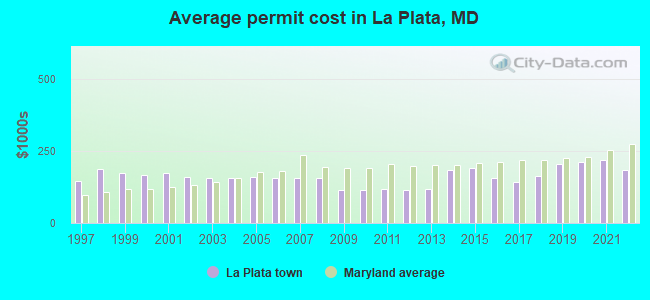
Single-family new house construction building permits:
- 2022: 97 buildings, average cost: $182,500
- 2021: 112 buildings, average cost: $219,800
- 2020: 101 buildings, average cost: $212,900
- 2019: 88 buildings, average cost: $206,400
- 2018: 76 buildings, average cost: $162,800
- 2017: 36 buildings, average cost: $143,700
- 2016: 38 buildings, average cost: $156,100
- 2015: 84 buildings, average cost: $191,500
- 2014: 59 buildings, average cost: $184,200
- 2013: 36 buildings, average cost: $118,500
- 2012: 28 buildings, average cost: $115,100
- 2011: 25 buildings, average cost: $120,000
- 2010: 37 buildings, average cost: $116,200
- 2009: 22 buildings, average cost: $113,700
- 2008: 38 buildings, average cost: $155,700
- 2007: 71 buildings, average cost: $154,800
- 2006: 94 buildings, average cost: $157,800
- 2005: 132 buildings, average cost: $161,100
- 2004: 124 buildings, average cost: $156,600
- 2003: 188 buildings, average cost: $154,600
- 2002: 127 buildings, average cost: $160,600
- 2001: 79 buildings, average cost: $173,900
- 2000: 68 buildings, average cost: $168,100
- 1999: 43 buildings, average cost: $173,900
- 1998: 48 buildings, average cost: $189,400
- 1997: 50 buildings, average cost: $148,200
| Here: | 2.1% |
| Maryland: | 2.0% |
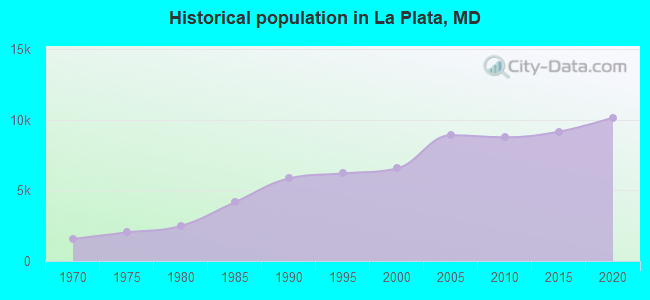
Population change in the 1990s: +522 (+8.7%).
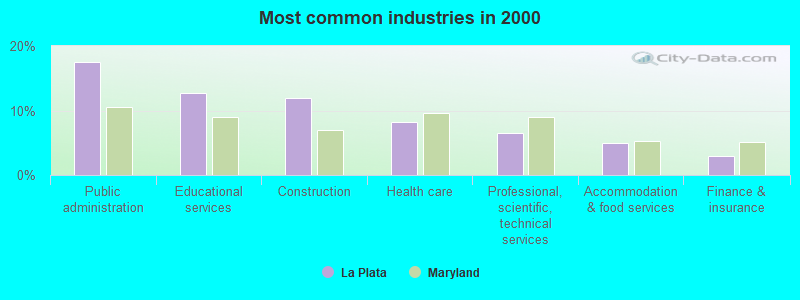
- Public administration (17.5%)
- Educational services (12.7%)
- Construction (11.9%)
- Health care (8.2%)
- Professional, scientific, technical services (6.4%)
- Accommodation & food services (4.9%)
- Finance & insurance (3.0%)
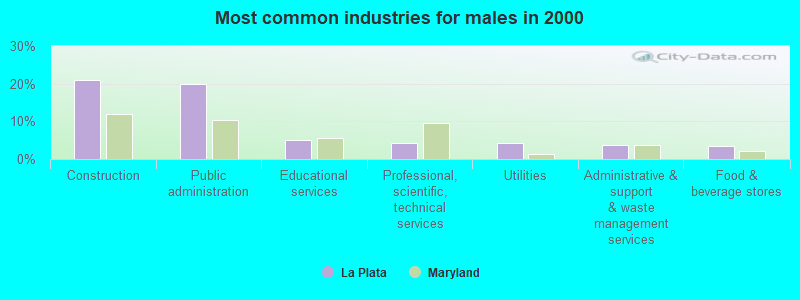
- Construction (20.9%)
- Public administration (20.0%)
- Educational services (5.0%)
- Professional, scientific, technical services (4.2%)
- Utilities (4.2%)
- Administrative & support & waste management services (3.8%)
- Food & beverage stores (3.4%)
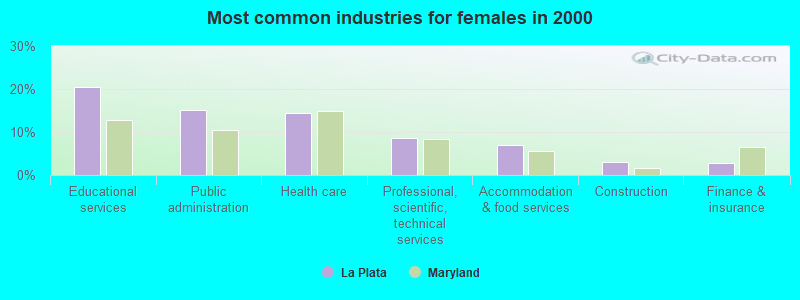
- Educational services (20.3%)
- Public administration (15.1%)
- Health care (14.5%)
- Professional, scientific, technical services (8.6%)
- Accommodation & food services (7.0%)
- Construction (2.9%)
- Finance & insurance (2.9%)
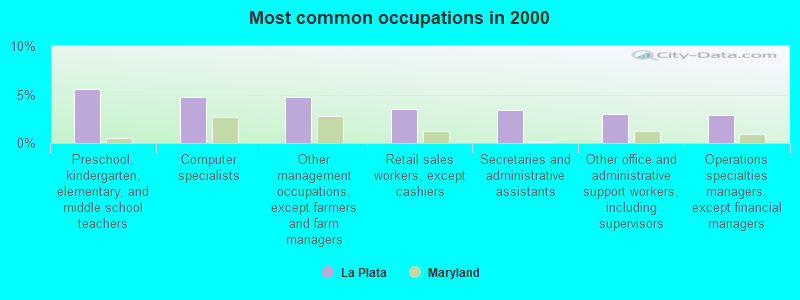
- Preschool, kindergarten, elementary, and middle school teachers (5.6%)
- Computer specialists (4.8%)
- Other management occupations, except farmers and farm managers (4.7%)
- Retail sales workers, except cashiers (3.5%)
- Secretaries and administrative assistants (3.4%)
- Other office and administrative support workers, including supervisors (3.0%)
- Operations specialties managers, except financial managers (2.9%)
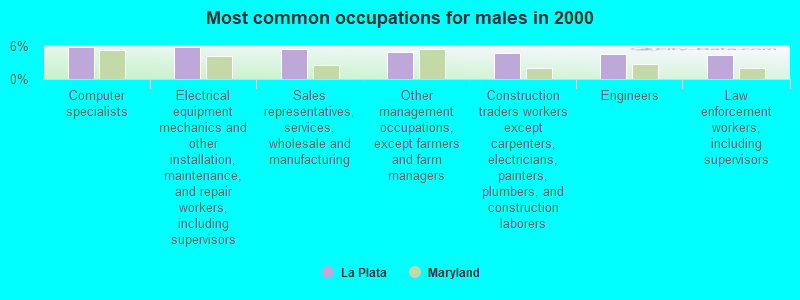
- Computer specialists (5.9%)
- Electrical equipment mechanics and other installation, maintenance, and repair workers, including supervisors (5.8%)
- Sales representatives, services, wholesale and manufacturing (5.5%)
- Other management occupations, except farmers and farm managers (4.9%)
- Construction traders workers except carpenters, electricians, painters, plumbers, and construction laborers (4.8%)
- Engineers (4.6%)
- Law enforcement workers, including supervisors (4.4%)

- Preschool, kindergarten, elementary, and middle school teachers (9.2%)
- Secretaries and administrative assistants (6.8%)
- Registered nurses (5.2%)
- Other office and administrative support workers, including supervisors (4.9%)
- Other management occupations, except farmers and farm managers (4.6%)
- Information and record clerks, except customer service representatives (4.3%)
- Retail sales workers, except cashiers (3.9%)
Average climate in La Plata, Maryland
Based on data reported by over 4,000 weather stations


(lower is better)
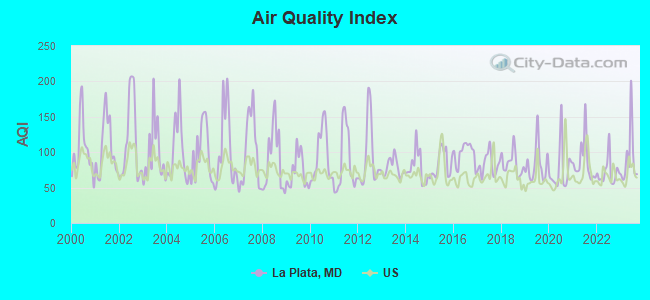
Air Quality Index (AQI) level in 2023 was 90.8. This is worse than average.
| City: | 90.8 |
| U.S.: | 72.6 |
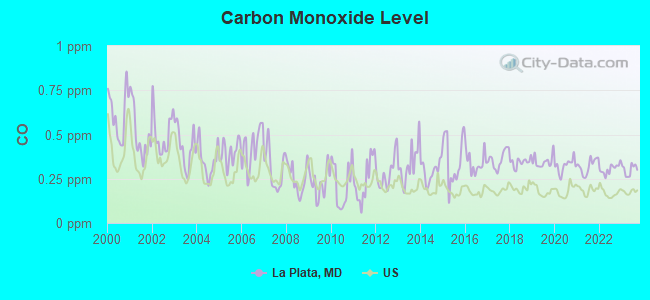
Carbon Monoxide (CO) [ppm] level in 2023 was 0.301. This is about average. Closest monitor was 15.4 miles away from the city center.
| City: | 0.301 |
| U.S.: | 0.251 |
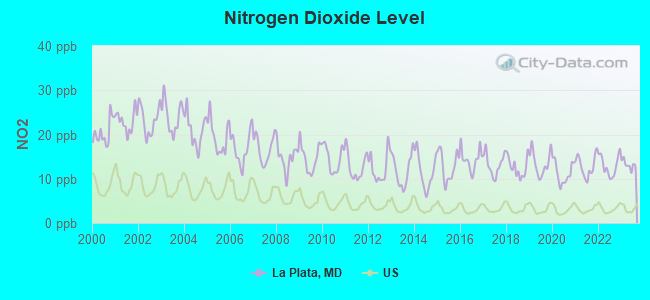
Nitrogen Dioxide (NO2) [ppb] level in 2023 was 13.2. This is significantly worse than average. Closest monitor was 2.6 miles away from the city center.
| City: | 13.2 |
| U.S.: | 5.1 |
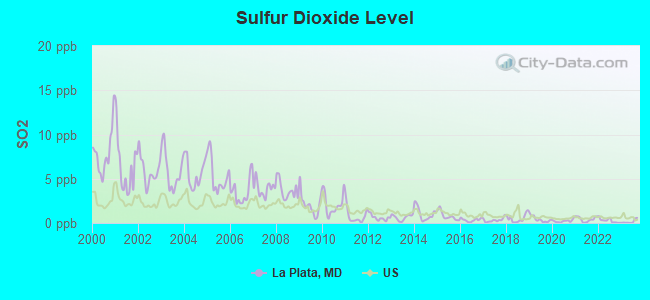
Sulfur Dioxide (SO2) [ppb] level in 2023 was 0.154. This is significantly better than average. Closest monitor was 2.6 miles away from the city center.
| City: | 0.154 |
| U.S.: | 1.515 |
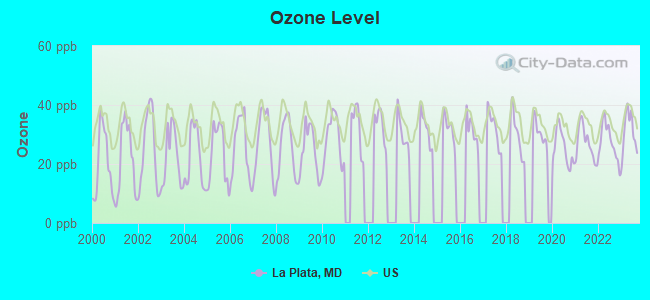
Ozone [ppb] level in 2023 was 30.9. This is about average. Closest monitor was 8.7 miles away from the city center.
| City: | 30.9 |
| U.S.: | 33.3 |
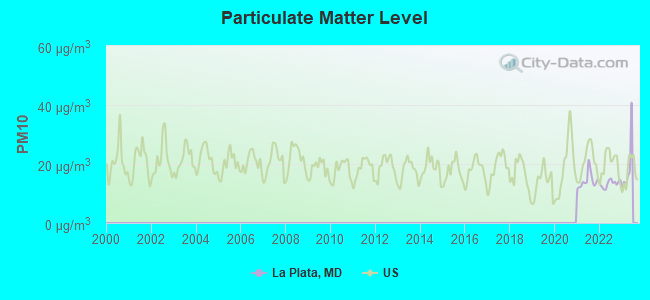
Particulate Matter (PM10) [µg/m3] level in 2022 was 13.4. This is significantly better than average. Closest monitor was 15.5 miles away from the city center.
| City: | 13.4 |
| U.S.: | 19.2 |
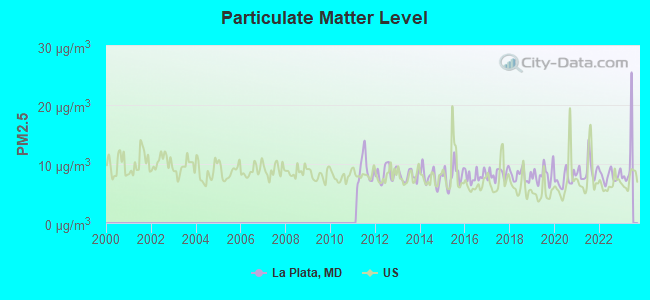
Particulate Matter (PM2.5) [µg/m3] level in 2022 was 7.97. This is about average. Closest monitor was 18.0 miles away from the city center.
| City: | 7.97 |
| U.S.: | 8.11 |
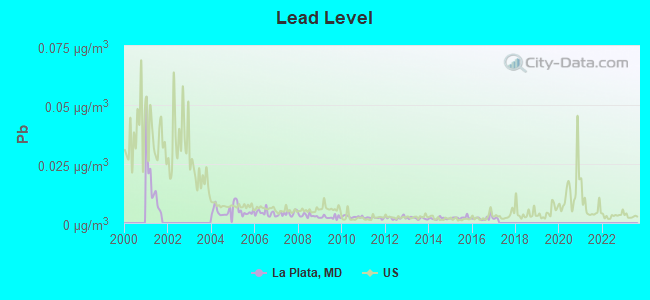
Lead (Pb) [µg/m3] level in 2016 was 0.00212. This is significantly better than average. Closest monitor was 2.6 miles away from the city center.
| City: | 0.00212 |
| U.S.: | 0.00931 |
Tornado activity:
La Plata-area historical tornado activity is near Maryland state average. It is 2% greater than the overall U.S. average.
On 4/28/2002, a category F4 (max. wind speeds 207-260 mph) tornado 11.2 miles away from the La Plata town center killed 3 people and injured 122 people and caused $124 million in damages.
On 1/26/1978, a category F3 (max. wind speeds 158-206 mph) tornado 17.8 miles away from the town center killed one person and injured 10 people and caused between $50,000 and $500,000 in damages.
Earthquake activity:
La Plata-area historical earthquake activity is significantly above Maryland state average. It is 57% smaller than the overall U.S. average.On 8/23/2011 at 17:51:04, a magnitude 5.8 (5.8 MW, Depth: 3.7 mi, Class: Moderate, Intensity: VI - VII) earthquake occurred 67.9 miles away from the city center
On 8/25/2011 at 05:07:52, a magnitude 4.5 (4.5 ML, Depth: 4.2 mi, Class: Light, Intensity: IV - V) earthquake occurred 67.6 miles away from La Plata center
On 12/9/2003 at 20:59:18, a magnitude 4.5 (4.5 ML, Depth: 6.2 mi) earthquake occurred 80.7 miles away from La Plata center
On 12/9/2003 at 20:59:14, a magnitude 4.5 (4.5 MB, 4.5 LG) earthquake occurred 82.8 miles away from the city center
On 1/16/1994 at 01:49:16, a magnitude 4.6 (4.6 MB, 4.6 LG, Depth: 3.1 mi) earthquake occurred 133.9 miles away from the city center
On 8/24/2011 at 00:04:36, a magnitude 4.2 (4.2 ML) earthquake occurred 68.4 miles away from La Plata center
Magnitude types: regional Lg-wave magnitude (LG), body-wave magnitude (MB), local magnitude (ML), moment magnitude (MW)
Natural disasters:
The number of natural disasters in Charles County (21) is greater than the US average (15).Major Disasters (Presidential) Declared: 16
Emergencies Declared: 5
Causes of natural disasters: Hurricanes: 7, Winter Storms: 6, Snowstorms: 4, Storms: 2, Tropical Storms: 2, Blizzard: 1, Flood: 1, Heavy Rain: 1, Ice Storm: 1, Snowfall: 1, Tornado: 1, Wind: 1, Other: 1 (Note: some incidents may be assigned to more than one category).
Hospitals and medical centers in La Plata:
Airports and heliports located in La Plata:
- Edelen Field Airport (5MD8) (Runways: 1)
- Lanseair Farms Airport (MD97) (Runways: 1)
- Ty-Ti-To Airport (MD83) (Runways: 1)
- Um Charles Regional Medical Center Heliport (6MD6)
Amtrak stations near La Plata:
- 18 miles: WOODBRIDGE (1040 EXPRESS WAY) . Services: partially wheelchair accessible, public payphones, vending machines, paid short-term parking, call for taxi service, public transit connection.
- 18 miles: QUANTICO (QUNATICO, RAILROAD AVE.) . Services: public payphones, free short-term parking, free long-term parking, call for taxi service, public transit connection.
- 18 miles: LORTON (AUTO-TRAIN) (LORTON, 8006 LORTON RD.) . Services: ticket office, fully wheelchair accessible, enclosed waiting area, public restrooms, public payphones, vending machines, free short-term parking, call for taxi service.
College/University in La Plata:
Other colleges/universities with over 2000 students near La Plata:
- Strayer University-Maryland (about 21 miles; Suitland, MD; Full-time enrollment: 2,748)
- Northern Virginia Community College (about 26 miles; Annandale, VA; FT enrollment: 35,721)
- Strayer University-Virginia (about 26 miles; Arlington, VA; FT enrollment: 7,005)
- George Washington University (about 26 miles; Washington, DC; FT enrollment: 18,928)
- Medtech Institute (about 26 miles; Falls Church, VA; FT enrollment: 2,900)
- Prince George's Community College (about 26 miles; Largo, MD; FT enrollment: 8,537)
- Strayer University-Global Region (about 26 miles; Washington, DC; FT enrollment: 2,613)
Public high school in La Plata:
- LA PLATA HIGH SCHOOL (Location: 6035 RADIO STATION RD, Grades: 9-12)
Private high school in La Plata:
Public elementary/middle schools in La Plata:
- MARY MATULA ELEMENTARY SCHOOL (Location: 6025 RADIO STATION RD, Grades: PK-5)
- MILTON M. SOMERS MIDDLE SCHOOL (Location: 300 WILLOW LANE, Grades: 6-8)
- WALTER J. MITCHELL ELEMENTARY (Location: 400 WILLOW LN, Grades: PK-5)
Private elementary/middle school in La Plata:
Library in La Plata:
User-submitted facts and corrections:
- The Web site address for the College of Southern Maryland has changed. It is now: www.csmd.edu.
Points of interest:
Notable locations in La Plata: Southern Maryland Trade Center (A), Richard Clark Senior Center (B), University of Maryland Fire and Rescue Institute (C), Abbey Manor II Assisted Living Center (D), LaPlata Center Nursing Home (E), La Plata Town Hall (F), La Plata Community Building (G), Charles County Public Library - La Plata Branch (H), Charles County Government Building (I), Charles County Rescue Squad (J), Charles County Detention Center (K), Charles County Courthouse (L), La Plata Volunteer Fire Department (M), Charles County Sheriff's Office (N). Display/hide their locations on the map
Shopping Centers: Hawthorne Shopping Center (1), Potomac Square Shopping Center (2), La Plata Shopping Center (3). Display/hide their locations on the map
Churches in La Plata include: Christ Episcopal Church (A), La Plata United Methodist Church (B), Sacred Heart Catholic Church (C). Display/hide their locations on the map
Cemeteries: Sacred Heart Cemetery (1), Mount Rest Cemetery (2). Display/hide their locations on the map
Reservoirs and swamps: McAllister Pond Number One (A), Redwood Lake (B), Kerrick Swamp (C). Display/hide their locations on the map
Parks in La Plata include: Tilghman Park (1), Silver Linden Park (2), Tilghman Park (3), Wills Memorial Park (4), Clark Run Nature Area (5). Display/hide their locations on the map
Tourist attractions: Port Tobacco Community Of (Museums; Court House), Historical Society Of Charles County (Museums; 101 Kent Av), African American Heritage Society of Charles Conty (Museums; 7485 Crain Highway).
Hotels: Super 8 Motel (9400 Chesapeake Street), Bel Alton Motel (9295 Crain Highway), Best Western Laplata Inn (6900 Crain Highway), Patuxent Inn (9400 Chesapeake Street), Best Western Of La Plata (6900 Crain Hwy), Deluxe Inn (Us Route 301).
Court: Charles County - Orphans Court (200 E Charles St.).
Birthplace of: Daryl Thompson - Baseball player, Ryan Hackett - Racing driver, William Daniel Mayer - Politician, Matt Dyson - Football player and coach, Sean T. Buffington - University president, Shane Halter - Baseball player, Steve Farr - Baseball player, Thomas M. Middleton - Politician, Tim Drummond (baseball) - Baseball player.
Drinking water stations with addresses in La Plata and their reported violations in the past:
WALDORF (Address: 5310 HAWTHORNE ROAD , Population served: 70,640, Purch surface water):Past monitoring violations:TOWN OF LA PLATA (Population served: 9,500, Groundwater):
- Follow-up Or Routine LCR Tap M/R - In OCT-01-2008, Contaminant: Lead and Copper Rule. Follow-up actions: St Compliance achieved (DEC-01-2008)
Past health violations:BRYANS ROAD (Address: 5310 HAWTHORNE ROAD , Population served: 5,000, Groundwater):Past monitoring violations:
- MCL, Monthly (TCR) - In SEP-2009, Contaminant: Coliform. Follow-up actions: St Violation/Reminder Notice (SEP-09-2009), St Public Notif requested (NOV-06-2009), St Compliance achieved (NOV-20-2009), St Public Notif received (NOV-20-2009)
- One routine major monitoring violation
Past monitoring violations:COLLEGE OF SOUTHERN MD - MAIN CAMPUS (Address: 8730 MITCHELL ROAD , Population served: 1,220, Groundwater):
- Follow-up Or Routine LCR Tap M/R - In OCT-01-2008, Contaminant: Lead and Copper Rule. Follow-up actions: St Compliance achieved (DEC-01-2008)
- One regular monitoring violation
Past monitoring violations:SWAN POINT (Address: 5310 HAWTHORNE ROAD , Population served: 945, Groundwater):
- Follow-up Or Routine LCR Tap M/R - In OCT-01-2004, Contaminant: Lead and Copper Rule. Follow-up actions: St Violation/Reminder Notice (JUN-15-2005), St Compliance achieved (JUN-21-2005)
- 12 regular monitoring violations
Past monitoring violations:CLIFTON ON THE POTOMAC (Address: 5310 HAWTHORNE ROAD , Population served: 744, Groundwater):
- Follow-up Or Routine LCR Tap M/R - In OCT-01-2011, Contaminant: Lead and Copper Rule. Follow-up actions: St Compliance achieved (DEC-13-2011)
- Follow-up Or Routine LCR Tap M/R - In OCT-01-2008, Contaminant: Lead and Copper Rule. Follow-up actions: St Compliance achieved (DEC-01-2008)
Past health violations:BENEDICT (Address: 5310 HAWTHORNE ROAD , Population served: 376, Groundwater):Past monitoring violations:
- MCL, Average - Between JAN-2006 and DEC-2006, Contaminant: Gross Alpha, Excl. Radon and U. Follow-up actions: St Public Notif requested (SEP-21-2007), St Violation/Reminder Notice (2 times from SEP-21-2007 to OCT-03-2007), St Public Notif received (OCT-24-2007), St Compliance achieved (OCT-26-2007)
- Follow-up Or Routine LCR Tap M/R - In OCT-01-2011, Contaminant: Lead and Copper Rule. Follow-up actions: St Compliance achieved (DEC-13-2011)
- Follow-up Or Routine LCR Tap M/R - In OCT-01-2008, Contaminant: Lead and Copper Rule. Follow-up actions: St Compliance achieved (DEC-10-2008)
Past monitoring violations:BEL ALTON (Address: 5310 HAWTHORNE ROAD , Population served: 311, Groundwater):
- Follow-up Or Routine LCR Tap M/R - In OCT-01-2008, Contaminant: Lead and Copper Rule. Follow-up actions: St Compliance achieved (DEC-01-2008)
Past monitoring violations:
- Follow-up Or Routine LCR Tap M/R - In OCT-01-2011, Contaminant: Lead and Copper Rule. Follow-up actions: St Compliance achieved (DEC-13-2011)
- Follow-up Or Routine LCR Tap M/R - In OCT-01-2008, Contaminant: Lead and Copper Rule. Follow-up actions: St Compliance achieved (DEC-01-2008)
Drinking water stations with addresses in La Plata that have no violations reported:
- HENRY E. LACKEY HIGH SCHOOL (Population served: 1,445, Primary Water Source Type: Groundwater)
- MAURICE J. MCDONOUGH HIGH SCHOOL (Population served: 1,376, Primary Water Source Type: Groundwater)
- STETHEM ED CNTR & JAMES CRAIK ELEMENTARY (Population served: 1,028, Primary Water Source Type: Groundwater)
- J.C. PARKS ELEMENTARY (Population served: 717, Primary Water Source Type: Groundwater)
- MATTHEW HENSON MIDDLE SCHOOL (Population served: 637, Primary Water Source Type: Groundwater)
- HUNTERS BROOKE/FALCON RIDGE SUBD (Address: 5310 HAWTHORNE ROAD , Population served: 614, Primary Water Source Type: Groundwater)
- T.C. MARTIN ELEMENTARY SCHOOL (Population served: 609, Primary Water Source Type: Groundwater)
- MALCOLM ELEMENTARY SCHOOL (Population served: 558, Primary Water Source Type: Groundwater)
- PICCOWAXEN MIDDLE SCHOOL (Population served: 539, Primary Water Source Type: Groundwater)
- GALE-BAILEY ELEMENTARY (Population served: 497, Primary Water Source Type: Groundwater)
| This town: | 2.6 people |
| Maryland: | 2.6 people |
| This town: | 68.3% |
| Whole state: | 67.1% |
| This town: | 5.8% |
| Whole state: | 6.4% |
Likely homosexual households (counted as self-reported same-sex unmarried-partner households)
- Lesbian couples: 0.2% of all households
- Gay men: 0.1% of all households
People in group quarters in La Plata in 2010:
- 418 people in local jails and other municipal confinement facilities
- 249 people in nursing facilities/skilled-nursing facilities
- 24 people in group homes intended for adults
- 22 people in emergency and transitional shelters (with sleeping facilities) for people experiencing homelessness
- 7 people in other noninstitutional facilities
- 4 people in residential treatment centers for adults
People in group quarters in La Plata in 2000:
- 397 people in local jails and other confinement facilities (including police lockups)
- 296 people in nursing homes
- 10 people in other group homes
- 6 people in religious group quarters
- 4 people in homes for the mentally retarded
Banks with most branches in La Plata (2011 data):
- PNC Bank, National Association: Hawthorne Road Branch, Laplata @ Giant Branch, La Plata Branch. Info updated 2012/03/20: Bank assets: $263,309.6 mil, Deposits: $197,343.0 mil, headquarters in Wilmington, DE, positive income, Commercial Lending Specialization, 3085 total offices, Holding Company: Pnc Financial Services Group, Inc., The
- County First Bank: at 202 Centennial Street, branch established on 1990/03/28; Operations Center at #6 St Mary's Avenue, branch established on 1998/11/30. Info updated 2006/11/03: Bank assets: $184.3 mil, Deposits: $159.7 mil, local headquarters, positive income, Commercial Lending Specialization, 7 total offices
- SunTrust Bank: La Plata Safeway Branch at 40 Shining Willow Way, branch established on 2004/07/14. Info updated 2010/05/27: Bank assets: $171,291.7 mil, Deposits: $129,833.2 mil, headquarters in Atlanta, GA, positive income, Commercial Lending Specialization, 1716 total offices, Holding Company: Suntrust Banks, Inc.
- Wells Fargo Bank, National Association: Rosewick Crossing Branch at 100 Rosewick Rd, branch established on 2008/08/04. Info updated 2011/04/05: Bank assets: $1,161,490.0 mil, Deposits: $905,653.0 mil, headquarters in Sioux Falls, SD, positive income, 6395 total offices, Holding Company: Wells Fargo & Company
- Branch Banking and Trust Company: La Plata Branch at 6640 Crain Highway, branch established on 1887/01/01. Info updated 2010/03/29: Bank assets: $168,867.6 mil, Deposits: $127,549.5 mil, headquarters in Winston Salem, NC, positive income, Commercial Lending Specialization, 1793 total offices, Holding Company: Bb&T Corporation
- Old Line Bank: East Charles Street Branch at 6680 Crain Highway, branch established on 1974/03/19. Info updated 2011/04/12: Bank assets: $803.6 mil, Deposits: $691.2 mil, headquarters in Bowie, MD, positive income, Commercial Lending Specialization, 19 total offices, Holding Company: Old Line Bancshares, Inc.
- Community Bank of Tri-County: La Plata Branch at 101 Drury Drive, branch established on 1992/03/01. Info updated 2008/07/16: Bank assets: $980.4 mil, Deposits: $826.4 mil, headquarters in Waldorf, MD, positive income, Commercial Lending Specialization, 10 total offices, Holding Company: Tri-County Financial Corporation
- Capital One, National Association: 20 Shining Willow Way Branch at 20 Shining Willow Way, branch established on 2004/05/20. Info updated 2011/07/01: Bank assets: $133,477.8 mil, Deposits: $97,063.7 mil, headquarters in Mclean, VA, positive income, 984 total offices, Holding Company: Capital One Financial Corporation
- Bank of America, National Association: La Plata Branch at 705 East Charles Street, branch established on 1908/01/02. Info updated 2009/11/18: Bank assets: $1,451,969.3 mil, Deposits: $1,077,176.8 mil, headquarters in Charlotte, NC, positive income, 5782 total offices, Holding Company: Bank Of America Corporation
For population 15 years and over in La Plata:
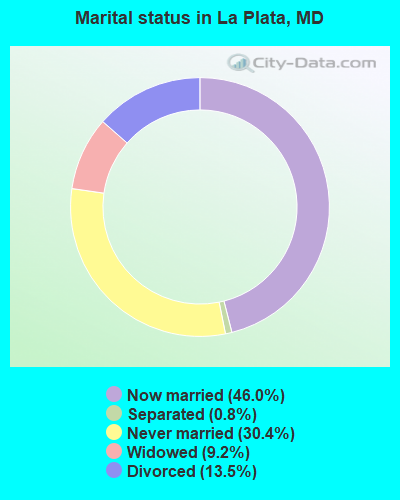
- Never married: 30.4%
- Now married: 46.0%
- Separated: 0.8%
- Widowed: 9.2%
- Divorced: 13.5%
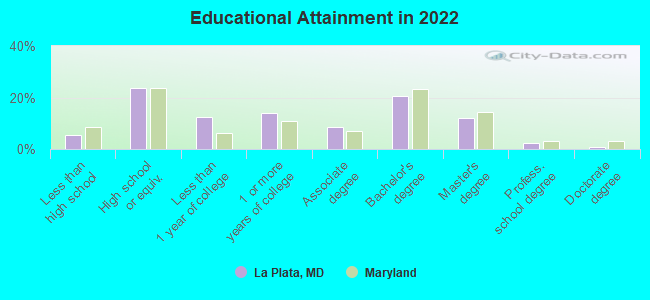
For population 25 years and over in La Plata:
- High school or higher: 93.1%
- Bachelor's degree or higher: 34.4%
- Graduate or professional degree: 13.5%
- Unemployed: 4.9%
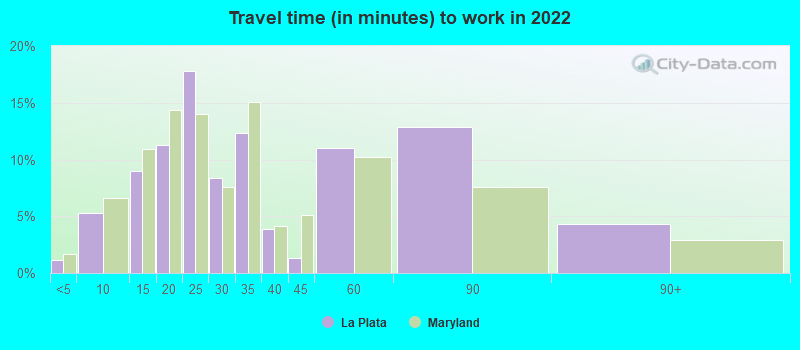
- Mean travel time to work (commute): 32.0 minutes
| Here: | 10.9 |
| Maryland average: | 12.7 |
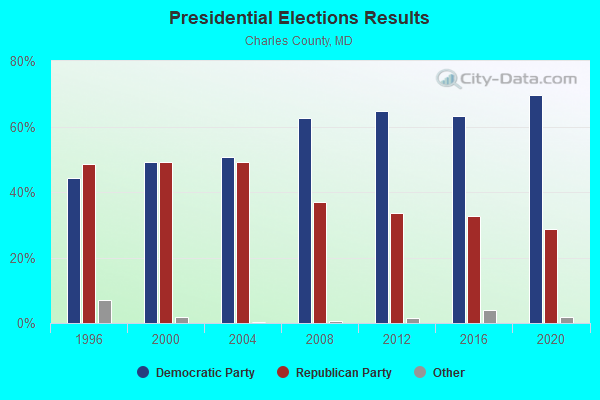
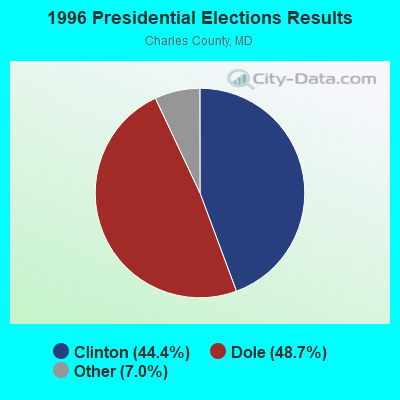
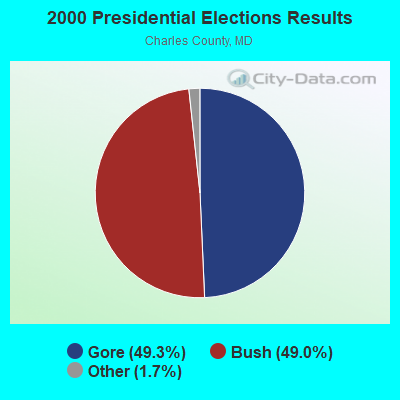
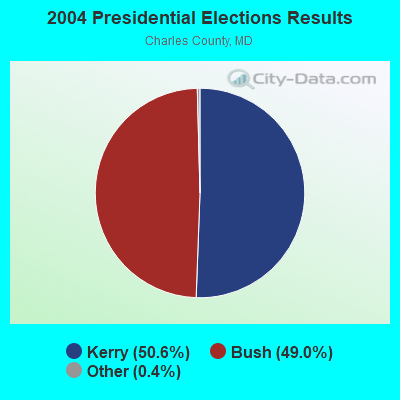
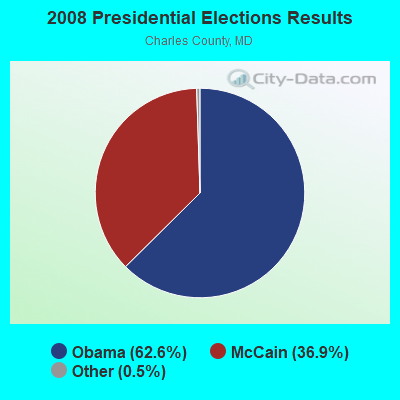
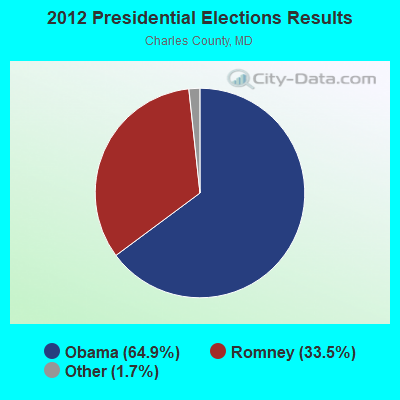
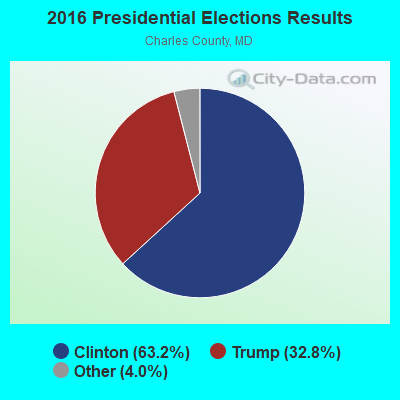
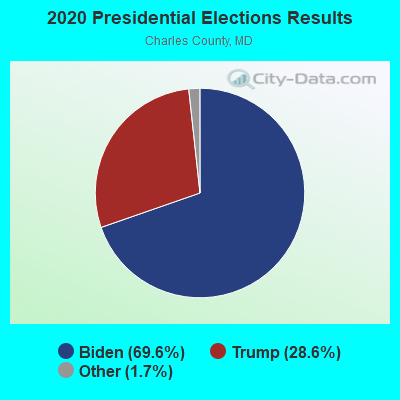
Graphs represent county-level data. Detailed 2008 Election Results
Religion statistics for La Plata, MD (based on Charles County data)
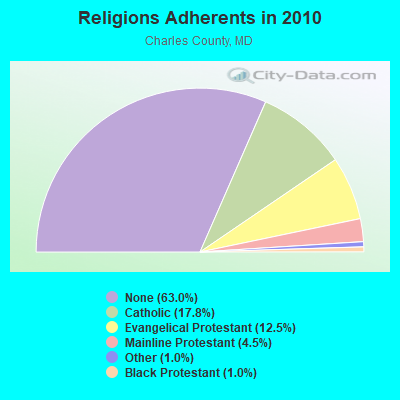
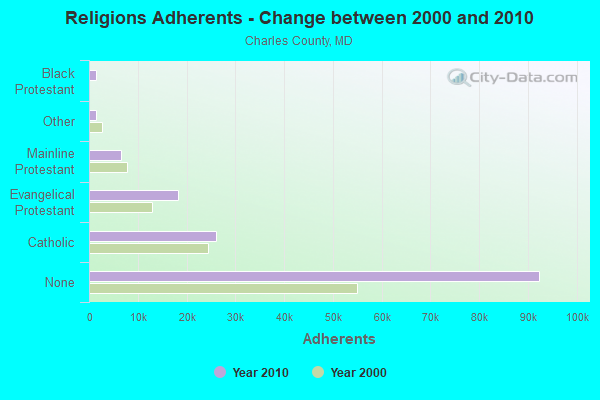
| Religion | Adherents | Congregations |
|---|---|---|
| Catholic | 26,146 | 12 |
| Evangelical Protestant | 18,323 | 72 |
| Mainline Protestant | 6,593 | 28 |
| Other | 1,512 | 7 |
| Black Protestant | 1,489 | 9 |
| Orthodox | 100 | 1 |
| None | 92,388 | - |
Food Environment Statistics:
| Here: | 1.57 / 10,000 pop. |
| Maryland: | 1.96 / 10,000 pop. |
| Here: | 0.14 / 10,000 pop. |
| Maryland: | 0.07 / 10,000 pop. |
| This county: | 1.14 / 10,000 pop. |
| Maryland: | 1.22 / 10,000 pop. |
| Charles County: | 2.21 / 10,000 pop. |
| Maryland: | 2.05 / 10,000 pop. |
| Here: | 4.78 / 10,000 pop. |
| Maryland: | 5.40 / 10,000 pop. |
| Charles County: | 9.2% |
| Maryland: | 9.1% |
| Charles County: | 31.9% |
| State: | 26.7% |
| Here: | 13.0% |
| Maryland: | 15.5% |
Health and Nutrition:
| La Plata: | 54.6% |
| Maryland: | 50.1% |
| La Plata: | 54.7% |
| Maryland: | 47.6% |
| La Plata: | 28.4 |
| Maryland: | 28.8 |
| La Plata: | 18.3% |
| State: | 20.0% |
| Here: | 9.0% |
| Maryland: | 11.3% |
| Here: | 6.9 |
| Maryland: | 6.8 |
| This city: | 34.2% |
| Maryland: | 34.1% |
| La Plata: | 61.1% |
| State: | 56.5% |
| La Plata: | 82.2% |
| Maryland: | 80.5% |
More about Health and Nutrition of La Plata, MD Residents
La Plata government finances - Expenditure in 2021 (per resident):
- Current Operations - Sewerage: $3,151,000 ($295.15)
Police Protection: $2,327,000 ($217.97)
Solid Waste Management: $1,881,000 ($176.19)
General - Other: $1,749,000 ($163.83)
Water Utilities: $1,244,000 ($116.52)
Central Staff Services: $635,000 ($59.48)
Financial Administration: $550,000 ($51.52)
Regular Highways: $391,000 ($36.62)
Parks and Recreation: $344,000 ($32.22)
Protective Inspection and Regulation - Other: $228,000 ($21.36)
General Public Buildings: $107,000 ($10.02)
Judicial and Legal Services: $4,000 ($0.37)
- General - Interest on Debt: $185,000 ($17.33)
- Other Capital Outlay - General Public Building: $1,618,000 ($151.55)
Regular Highways: $343,000 ($32.13)
Police Protection: $117,000 ($10.96)
Financial Administration: $44,000 ($4.12)
Central Staff Services: $5,000 ($0.47)
Parks and Recreation: $4,000 ($0.37)
- Total Salaries and Wages: $5,061,000 ($474.05)
La Plata government finances - Revenue in 2021 (per resident):
- Charges - Sewerage: $3,948,000 ($369.80)
Solid Waste Management: $1,153,000 ($108.00)
Other: $902,000 ($84.49)
- Federal Intergovernmental - Other: $207,000 ($19.39)
Sewerage: $17,000 ($1.59)
Water Utilities: $5,000 ($0.47)
- Local Intergovernmental - Other: $4,000 ($0.37)
- Miscellaneous - General Revenue - Other: $239,000 ($22.39)
Rents: $94,000 ($8.80)
Interest Earnings: $91,000 ($8.52)
Donations From Private Sources: $10,000 ($0.94)
Sale of Property: $2,000 ($0.19)
Fines and Forfeits: $2,000 ($0.19)
- Revenue - Water Utilities: $1,019,000 ($95.45)
- State Intergovernmental - Highways: $450,000 ($42.15)
Other: $103,000 ($9.65)
Sewerage: $45,000 ($4.22)
Housing and Community Development: $30,000 ($2.81)
- Tax - Property: $4,924,000 ($461.22)
Individual Income: $2,067,000 ($193.61)
Other Selective Sales: $343,000 ($32.13)
Public Utility License: $173,000 ($16.20)
Other License: $160,000 ($14.99)
Occupation and Business License - Other: $25,000 ($2.34)
La Plata government finances - Debt in 2021 (per resident):
- Long Term Debt - Beginning Outstanding - Unspecified Public Purpose: $4,612,000 ($432.00)
Outstanding Unspecified Public Purpose: $3,866,000 ($362.12)
Retired Unspecified Public Purpose: $746,000 ($69.88)
La Plata government finances - Cash and Securities in 2021 (per resident):
- Other Funds - Cash and Securities: $23,051,000 ($2159.14)
8.84% of this county's 2021 resident taxpayers lived in other counties in 2020 ($64,163 average adjusted gross income)
| Here: | 8.84% |
| Maryland average: | 7.42% |
0.09% of residents moved from foreign countries ($733 average AGI)
Charles County: 0.09% Maryland average: 0.05%
Top counties from which taxpayers relocated into this county between 2020 and 2021:
| from Prince George's County, MD | |
| from District of Columbia, DC | |
| from St. Mary's County, MD |
8.30% of this county's 2020 resident taxpayers moved to other counties in 2021 ($68,972 average adjusted gross income)
| Here: | 8.30% |
| Maryland average: | 7.91% |
0.07% of residents moved to foreign countries ($634 average AGI)
Charles County: 0.07% Maryland average: 0.04%
Top counties to which taxpayers relocated from this county between 2020 and 2021:
| to Prince George's County, MD | |
| to St. Mary's County, MD | |
| to Calvert County, MD |
| Businesses in La Plata, MD | ||||
| Name | Count | Name | Count | |
|---|---|---|---|---|
| 7-Eleven | 2 | Outback | 1 | |
| Applebee's | 1 | Outback Steakhouse | 1 | |
| Arby's | 1 | Panera Bread | 1 | |
| AutoZone | 1 | Papa John's Pizza | 1 | |
| Best Western | 1 | Pizza Hut | 1 | |
| Blockbuster | 1 | RadioShack | 1 | |
| Burger King | 1 | Rite Aid | 1 | |
| CVS | 1 | Safeway | 1 | |
| Chick-Fil-A | 1 | Sleep Inn | 1 | |
| Dairy Queen | 1 | Starbucks | 3 | |
| Domino's Pizza | 1 | Subway | 1 | |
| Famous Footwear | 1 | T-Mobile | 1 | |
| FedEx | 2 | Taco Bell | 1 | |
| Ford | 1 | Target | 1 | |
| GNC | 1 | True Value | 1 | |
| GameStop | 1 | U-Haul | 1 | |
| H&R Block | 1 | UPS | 3 | |
| IHOP | 1 | Vons | 1 | |
| KFC | 1 | Walgreens | 1 | |
| Lowe's | 1 | Walmart | 1 | |
| MasterBrand Cabinets | 1 | Wendy's | 1 | |
| McDonald's | 1 | World Gym | 1 | |
Strongest AM radio stations in La Plata:
- WWGB (1030 AM; daytime; 50 kW; INDIAN HEAD, MD; Owner: GOOD BODY MEDIA, LLC)
- WKIK (1560 AM; daytime; 1 kW; LA PLATA, MD)
- WPGC (1580 AM; 50 kW; MORNINGSIDE, MD; Owner: INFINITY WPGC(AM), INC.)
- WTEM (980 AM; 50 kW; WASHINGTON, DC; Owner: AMFM RADIO LICENSES, L.L.C.)
- WKDL (730 AM; 8 kW; ALEXANDRIA, VA; Owner: MEGA COMMUNICATIONS OF ALEXANDRIA LICENSEE, LLC)
- WBIS (1190 AM; 50 kW; ANNAPOLIS, MD; Owner: NATIONS RADIO, LLC)
- WTOP (1500 AM; 50 kW; WASHINGTON, DC; Owner: BONNEVILLE HOLDING COMPANY)
- WUST (1120 AM; daytime; 20 kW; WASHINGTON, DC)
- WCBM (680 AM; 50 kW; BALTIMORE, MD; Owner: WCBM MARYLAND, INC.)
- WMET (1150 AM; 50 kW; GAITHERSBURG, MD; Owner: BELTWAY ACQUISITION CORPORATION)
- WKCW (1420 AM; 50 kW; WARRENTON, VA; Owner: WAY BROADCASTING, INC.)
- WBAL (1090 AM; 50 kW; BALTIMORE, MD; Owner: HEARST RADIO, INC.)
- WWLG (1370 AM; 50 kW; BALTIMORE, MD; Owner: M-10 BROADCASTING, INC.)
Strongest FM radio stations in La Plata:
- WWZZ (104.1 FM; WALDORF, MD; Owner: BONNEVILLE HOLDING COMPANY)
- WSMD-FM (98.3 FM; MECHANICSVILLE, MD; Owner: SOMAR COMMUNICATIONS, INC.)
- WGRQ (95.9 FM; COLONIAL BEACH, VA; Owner: TELEMEDIA BROADCASTING, INC.)
- WJFK-FM (106.7 FM; MANASSAS, VA; Owner: INFINITY BROADCASTING CORP. OF WASHINGTON, DC)
- WRQX (107.3 FM; WASHINGTON, DC; Owner: WMAL, INC.)
- WBZS-FM (92.7 FM; PRINCE FREDERICK, MD; Owner: MEGA COMMUNICATIONS OF PRINCE FREDERICK LICENSEE, LLC)
- WHUR-FM (96.3 FM; WASHINGTON, DC; Owner: THE HOWARD UNIVERSITY)
- WASH (97.1 FM; WASHINGTON, DC; Owner: AMFM RADIO LICENSES, L.L.C.)
- WPGC-FM (95.5 FM; MORNINGSIDE, MD; Owner: INFINITY BROADCASTING CORPORATION OF MARYLAND)
- WARW (94.7 FM; BETHESDA, MD; Owner: INFINITY BROADCASTING OPERATIONS, INC.)
- WKYS (93.9 FM; WASHINGTON, DC; Owner: RADIO ONE LICENSES, LLC)
- WJZW (105.9 FM; WOODBRIDGE, VA; Owner: WMAL, INC.)
- WIHT (99.5 FM; WASHINGTON, DC; Owner: AMFM RADIO LICENSES, L.L.C.)
- WETA (90.9 FM; WASHINGTON, DC; Owner: GREATER WASHINGTON EDUCATIONAL TELECOMMUNICATIONS ASSN.)
- WGTS (91.9 FM; TAKOMA PARK, MD; Owner: COLUMBIA UNION COLLEGE BROADCASTING, INC.)
- WHFS (99.1 FM; ANNAPOLIS, MD; Owner: INFINITY BROADCASTING OPERATIONS, INC.)
- WWDC-FM (101.1 FM; WASHINGTON, DC; Owner: AMFM RADIO LICENSES, L.L.C.)
- WMZQ-FM (98.7 FM; WASHINGTON, DC; Owner: AMFM RADIO LICENSES, L.L.C.)
- WAVA (105.1 FM; ARLINGTON, VA; Owner: SALEM MEDIA OF VIRGINIA, INC.)
- WBIG-FM (100.3 FM; WASHINGTON, DC; Owner: AMFM RADIO LICENSES, L.L.C.)
TV broadcast stations around La Plata:
- WIAV-LP (Channel 58; WASHINGTON, DC; Owner: ASIAVISION, INC.)
- WJLA-TV (Channel 7; WASHINGTON, DC; Owner: ACC LICENSEE, INC.)
- WUSA (Channel 9; WASHINGTON, DC; Owner: THE DETROIT NEWS, INC.)
- WTTG (Channel 5; WASHINGTON, DC; Owner: FOX TELEVISION STATIONS, INC.)
- WETA-TV (Channel 26; WASHINGTON, DC; Owner: THE GREATER WASHINGTON ED TELECOMM. ASSOC)
- WBDC-TV (Channel 50; WASHINGTON, DC; Owner: WBDC BROADCASTING, INC.)
- WHUT-TV (Channel 32; WASHINGTON, DC; Owner: HOWARD UNIVERSITY)
- WNVT (Channel 53; GOLDVEIN, VA; Owner: COMMONWEALTH PUBLIC BROADCASTING CORPORATION)
- WNVC (Channel 56; FAIRFAX, VA; Owner: COMMONWEALTH PUBLIC BROADCASTING CORPORATION)
- WDCA (Channel 20; WASHINGTON, DC; Owner: FOX TELEVISION STATIONS, INC.)
- WRC-TV (Channel 4; WASHINGTON, DC; Owner: NBC SUBSIDIARY (WRC-TV), INC.)
- WMPT (Channel 22; ANNAPOLIS, MD; Owner: MARYLAND PUBLIC BROADCASTING COMMISSION)
- WPXW (Channel 66; MANASSAS, VA; Owner: PAXSON WASHINGTON LICENSE, INC.)
- W28BY (Channel 63; BALTIMORE, MD; Owner: INFORMATION SUPER STATION, L.L.C.)
- National Bridge Inventory (NBI) Statistics
- 3Number of bridges
- 26ft / 8.1mTotal length
- 23,426Total average daily traffic
- 1,729Total average daily truck traffic
- 35,795Total future (year 2029) average daily traffic
FCC Registered Antenna Towers:
108 (See the full list of FCC Registered Antenna Towers in La Plata)FCC Registered Private Land Mobile Towers:
3 (See the full list of FCC Registered Private Land Mobile Towers in La Plata, MD)FCC Registered Broadcast Land Mobile Towers:
17 (See the full list of FCC Registered Broadcast Land Mobile Towers)FCC Registered Microwave Towers:
16 (See the full list of FCC Registered Microwave Towers in this town)FCC Registered Paging Towers:
6 (See the full list of FCC Registered Paging Towers)FCC Registered Maritime Coast & Aviation Ground Towers:
3 (See the full list of FCC Registered Maritime Coast & Aviation Ground Towers)FCC Registered Amateur Radio Licenses:
90 (See the full list of FCC Registered Amateur Radio Licenses in La Plata)FAA Registered Aircraft:
3- Aircraft: PIPER PA-32RT-300T (Category: Land, Seats: 7, Weight: Up to 12,499 Pounds, Speed: 124 mph), Engine: LYCOMING TI0-540 SER (310 HP) (Reciprocating)
N-Number: 2182V, N2182V, N-2182V, Serial Number: 32R-7987117, Airworthiness Date: 03/27/1979, Certificate Issue Date: 01/02/2018
Registrant (Co-Owned): Daniel Ii Javorsek, 7401 Woodhaven Dr, La Plata, MD 20646, Other Owners: Eleanor Javorsek
Deregistered: Cancel Date: 09/16/2014 - Aircraft: CESSNA 172G (Category: Land, Seats: 4, Weight: Up to 12,499 Pounds, Speed: 105 mph), Engine: CONT MOTOR 0-300 SER (145 HP) (Reciprocating)
N-Number: 4291L, N4291L, N-4291L, Serial Number: 17254360, Year manufactured: 1966, Airworthiness Date: 03/25/1966, Certificate Issue Date: 03/09/1989
Registrant (Co-Owned): James R Reed, 6655 Ashland Road, La Plata, MD 20646, Other Owners: Betty M Reed - Aircraft: PIPER PA-28-181 (Category: Land, Seats: 4, Weight: Up to 12,499 Pounds, Speed: 105 mph), Engine: LYCOMING O&VO-360 SER (180 HP) (Reciprocating)
N-Number: 6811J, N6811J, N-6811J, Serial Number: 28-7690419, Year manufactured: 1976, Airworthiness Date: 07/02/1976, Certificate Issue Date: 03/18/1992
Registrant (Individual): Wesley E Jr Hughes, 625 Clarks Run Rd, La Plata, MD 20646
| Home Mortgage Disclosure Act Aggregated Statistics For Year 2009 (Based on 2 partial tracts) | ||||||||||||||
| A) FHA, FSA/RHS & VA Home Purchase Loans | B) Conventional Home Purchase Loans | C) Refinancings | D) Home Improvement Loans | E) Loans on Dwellings For 5+ Families | F) Non-occupant Loans on < 5 Family Dwellings (A B C & D) | G) Loans On Manufactured Home Dwelling (A B C & D) | ||||||||
|---|---|---|---|---|---|---|---|---|---|---|---|---|---|---|
| Number | Average Value | Number | Average Value | Number | Average Value | Number | Average Value | Number | Average Value | Number | Average Value | Number | Average Value | |
| LOANS ORIGINATED | 25 | $298,981 | 12 | $250,401 | 120 | $258,938 | 6 | $157,310 | 1 | $2,243,500 | 4 | $211,838 | 0 | $0 |
| APPLICATIONS APPROVED, NOT ACCEPTED | 1 | $183,480 | 1 | $131,320 | 8 | $253,752 | 1 | $79,030 | 0 | $0 | 1 | $146,790 | 0 | $0 |
| APPLICATIONS DENIED | 3 | $273,813 | 1 | $261,100 | 34 | $291,889 | 4 | $59,488 | 0 | $0 | 1 | $150,960 | 1 | $16,090 |
| APPLICATIONS WITHDRAWN | 3 | $369,263 | 1 | $282,680 | 29 | $276,993 | 1 | $133,320 | 0 | $0 | 1 | $215,060 | 0 | $0 |
| FILES CLOSED FOR INCOMPLETENESS | 0 | $0 | 0 | $0 | 6 | $280,987 | 0 | $0 | 0 | $0 | 0 | $0 | 0 | $0 |
Detailed HMDA statistics for the following Tracts: 8510.01 , 8510.02
| Private Mortgage Insurance Companies Aggregated Statistics For Year 2009 (Based on 2 partial tracts) | ||||
| A) Conventional Home Purchase Loans | B) Refinancings | |||
|---|---|---|---|---|
| Number | Average Value | Number | Average Value | |
| LOANS ORIGINATED | 1 | $370,640 | 1 | $460,880 |
| APPLICATIONS APPROVED, NOT ACCEPTED | 1 | $217,300 | 2 | $359,280 |
| APPLICATIONS DENIED | 0 | $0 | 0 | $0 |
| APPLICATIONS WITHDRAWN | 0 | $0 | 0 | $0 |
| FILES CLOSED FOR INCOMPLETENESS | 0 | $0 | 0 | $0 |
Detailed PMIC statistics for the following Tracts: 8510.01 , 8510.02

2002 - 2018 National Fire Incident Reporting System (NFIRS) incidents
- Fire incident types reported to NFIRS in La Plata, MD
- 2,59062.4%Structure Fires
- 93522.5%Outside Fires
- 3378.1%Mobile Property/Vehicle Fires
- 2886.9%Other
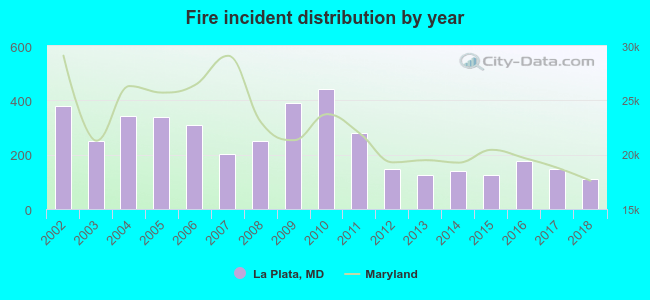 Based on the data from the years 2002 - 2018 the average number of fires per year is 244. The highest number of fire incidents - 443 took place in 2010, and the least - 110 in 2018. The data has a declining trend.
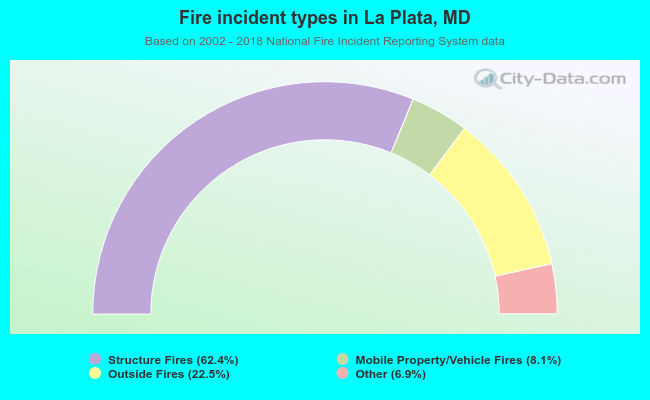 When looking into fire subcategories, the most reports belonged to: Structure Fires (62.4%), and Outside Fires (22.5%).
Fire-safe hotels and motels in La Plata, Maryland:
- Best Western La Plata Inn, 6900 Crain ,Hwy Rt 301, La Plata, Maryland 20646 , Phone: (301) 934-4900, Fax: (301) 934-5389
- Holiday Inn Express La Plata, 6860 Crain Hwy, La Plata, Maryland 20646 , Phone: (301) 392-0065, Fax: (301) 392-9798
| Most common first names in La Plata, MD among deceased individuals | ||
| Name | Count | Lived (average) |
|---|---|---|
| Mary | 133 | 79.6 years |
| John | 98 | 73.0 years |
| James | 93 | 70.7 years |
| William | 90 | 72.6 years |
| Robert | 57 | 70.9 years |
| Joseph | 53 | 72.0 years |
| Margaret | 48 | 77.4 years |
| Thomas | 48 | 72.2 years |
| Dorothy | 46 | 79.2 years |
| George | 43 | 73.3 years |
| Most common last names in La Plata, MD among deceased individuals | ||
| Last name | Count | Lived (average) |
|---|---|---|
| Cooksey | 35 | 75.3 years |
| Johnson | 33 | 68.8 years |
| Brown | 32 | 73.7 years |
| Thompson | 29 | 73.1 years |
| Bowling | 23 | 76.5 years |
| Swann | 22 | 75.9 years |
| Jones | 21 | 73.5 years |
| Thomas | 21 | 75.5 years |
| Garner | 20 | 71.9 years |
| Proctor | 19 | 70.8 years |
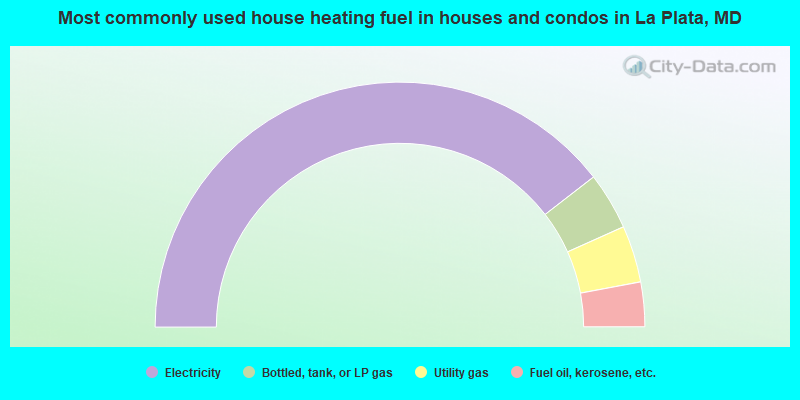
- 79.1%Electricity
- 7.6%Bottled, tank, or LP gas
- 7.5%Utility gas
- 5.9%Fuel oil, kerosene, etc.

- 90.0%Electricity
- 8.5%Utility gas
- 1.5%No fuel used
La Plata compared to Maryland state average:
- Unemployed percentage significantly below state average.
- Black race population percentage above state average.
- Length of stay since moving in below state average.
- House age significantly below state average.
- Institutionalized population percentage significantly above state average.
La Plata on our top lists:
- #83 on the list of "Top 101 cities with the smallest percentage of likely homosexual households (counted as self-reported same-sex unmarried-partner households) (population 5,000+)"
- #84 on the list of "Top 101 cities with the largest percentage of people in local jails and other confinement facilities (including police lockups) (population 1,000+)"
- #97 on the list of "Top 101 cities with largest percentage of males in occupations: law enforcement workers including supervisors (population 5,000+)"
- #85 on the list of "Top 101 counties with the highest percentage of residents relocating from foreign countries between 2010 and 2011 (pop. 50,000+)"
- #86 on the list of "Top 101 counties with highest percentage of residents voting for Obama (Democrat) in the 2012 Presidential Election (pop. 50,000+)"
- #90 on the list of "Top 101 counties with the best general health status score of residents (1-5), 3 years of data"
- #92 on the list of "Top 101 counties with the highest percentage of residents that visited a dentist within the past year"
- #96 on the list of "Top 101 counties with the lowest number of deaths per 1000 residents 2007-2013 (pop. 50,000+)"

|
|
Total of 24 patent applications in 2008-2024.