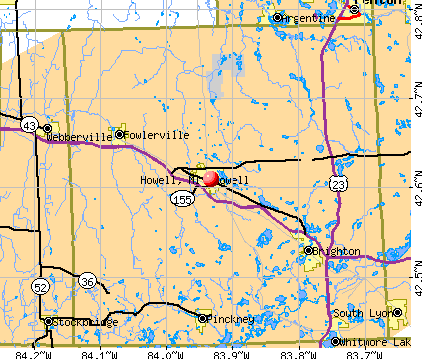
Howell, Michigan
Howell: Best restaurant in Howell
Howell: CSX trundles through Howell

Howell: Howell Depot
Howell

Howell: An array of colors at the Howell Hot Air Balloon Festival.

Howell: Northern lights ,holloween 2007,Thompson Lake ,city of howell public boat launch

Howell: Lightning at the industrial park
- add
your
Submit your own pictures of this city and show them to the world
- OSM Map
- General Map
- Google Map
- MSN Map
Population change since 2000: +9.2%
 |
| Males: 4,804 | |
| Females: 5,277 |
| Median resident age: | 37.7 years |
| Michigan median age: | 40.3 years |
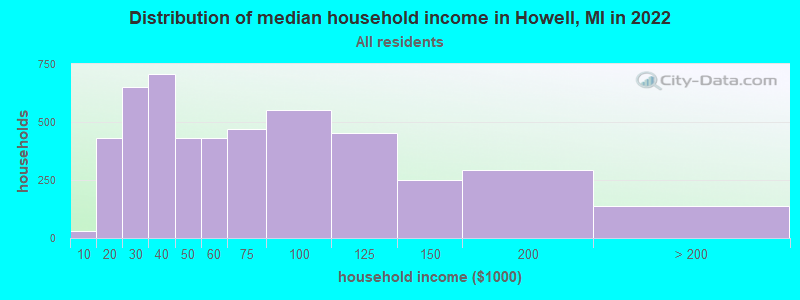
| Howell: | $56,200 |
| MI: | $66,986 |
Estimated per capita income in 2022: $38,654 (it was $22,254 in 2000)
Howell city income, earnings, and wages data
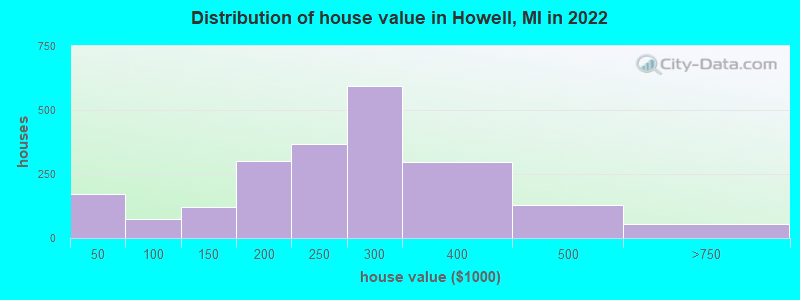
Estimated median house or condo value in 2022: $262,775 (it was $127,400 in 2000)
| Howell: | $262,775 |
| MI: | $224,400 |
Mean prices in 2022: all housing units: $240,857; detached houses: $266,169; townhouses or other attached units: $237,190; in 3-to-4-unit structures: $214,729; in 5-or-more-unit structures: $101,797; mobile homes: $15,954
Median gross rent in 2022: $1,097.
(5.7% for White Non-Hispanic residents, 2.7% for Black residents, 3.9% for Hispanic or Latino residents, 4.2% for two or more races residents)
Detailed information about poverty and poor residents in Howell, MI


Compare current foreclosures in Howell, MI:
| Photo | Address | Area | Beds / Baths | Price | Details |
|---|---|---|---|---|---|

|
#1
Dutcher Rd
Howell, MI 48843
|
2,008 sq. feet
|
2 baths 3 beds |
$469,900
|
show details |

|
#2
Skyline Dr
Howell, MI 48843
|
1,585 sq. feet
|
2 baths 3 beds |
show details | |

|
#3
S Barnard St
Howell, MI 48843
|
1,212 sq. feet
|
1 baths 3 beds |
show details | |

|
#4
Sunbury Dr
Howell, MI 48855
|
1,470 sq. feet
|
2 baths 3 beds |
show details | |

|
#5
Geneva Ct
Howell, MI 48855
|
1,636 sq. feet
|
2 baths 3 beds |
show details | |

|
#6
Schrepfer Rd
Howell, MI 48855
|
1,800 sq. feet
|
2 baths 3 beds |
show details | |

|
#7
Katsura Ln
Howell, MI 48855
|
1,416 sq. feet
|
2 baths 2 beds |
show details | |

|
#8
Byron Rd
Howell, MI 48855
|
2,352 sq. feet
|
2 baths 3 beds |
show details | |

|
#9
County Farm Rd
Howell, MI 48843
|
1,936 sq. feet
|
2 baths 3 beds |
show details | |

|
#10
Richards Rd
Howell, MI 48855
|
1,400 sq. feet
|
2 baths 3 beds |
show details |
| Photo | Address | Area | Beds / Baths | Price | Details |
|---|---|---|---|---|---|

|
#11
Byron Rd
Howell, MI 48855
|
1,680 sq. feet
|
2 baths 3 beds |
show details | |

|
#12
Cullen Rd
Howell, MI 48855
|
1,161 sq. feet
|
1 baths 3 beds |
show details | |

|
#13
Boston Blvd
Howell, MI 48843
|
1,300 sq. feet
|
2 baths 3 beds |
show details | |

|
#14
Andover Blvd
Howell, MI 48843
|
1,740 sq. feet
|
2 baths 3 beds |
show details | |

|
#15
Kimball St
Howell, MI 48855
|
1,494 sq. feet
|
2 baths 3 beds |
show details | |

|
#16
Snowden Ln
Howell, MI 48843
|
2,619 sq. feet
|
2 baths 4 beds |
show details | |

|
#17
Dutcher Rd
Howell, MI 48843
|
2,400 sq. feet
|
2 baths 3 beds |
show details | |

|
#18
Gilmore St
Howell, MI 48855
|
2,733 sq. feet
|
2 baths 3 beds |
show details | |

|
#19
Callaway Ct
Howell, MI 48843
|
1,494 sq. feet
|
2 baths 3 beds |
show details | |

|
#20
E Allen Rd
Howell, MI 48855
|
2,485 sq. feet
|
1 baths 3 beds |
show details |
| Photo | Address | Area | Beds / Baths | Price | Details |
|---|---|---|---|---|---|

|
#21
Curzon Ct Apt 202
Howell, MI 48843
|
1,055 sq. feet
|
2 baths 2 beds |
show details | |

|
#22
Melton Dr
Howell, MI 48843
|
960 sq. feet
|
1 baths 3 beds |
show details | |

|
#23
Willow Ln
Howell, MI 48843
|
2,502 sq. feet
|
2 baths 3 beds |
show details | |

|
#24
Kneeland Cir
Howell, MI 48843
|
1,324 sq. feet
|
2 baths - beds |
show details | |

|
#25
Brighton Rd
Howell, MI 48843
|
1,615 sq. feet
|
1 baths - beds |
show details | |

|
#26
Triangle Lake Rd
Howell, MI 48843
|
560 sq. feet
|
1 baths - beds |
show details | |

|
#27
Rurik Dr
Howell, MI 48843
|
2,952 sq. feet
|
2 baths - beds |
show details | |

|
#28
Argentine Rd
Howell, MI 48855
|
2,314 sq. feet
|
2 baths - beds |
show details | |

|
#29
Kneeland Cir
Howell, MI 48843
|
1,510 sq. feet
|
2 baths - beds |
show details | |

|
#30
Jewell Rd
Howell, MI 48843
|
1,440 sq. feet
|
1 baths - beds |
show details |
| Photo | Address | Area | Beds / Baths | Price | Details |
|---|---|---|---|---|---|

|
#31
Saddle Ridge Ct
Howell, MI 48855
|
1,524 sq. feet
|
2 baths - beds |
show details | |

|
#32
Lakewood Shores Dr # 31
Howell, MI 48843
|
2,164 sq. feet
|
2 baths - beds |
show details | |

|
#33
Bentley Lake Rd
Howell, MI 48843
|
1,728 sq. feet
|
2 baths - beds |
show details | |

|
#34
N Latson Rd
Howell, MI 48855
|
2,185 sq. feet
|
2 baths - beds |
show details | |

|
#35
Rial Lake Dr
Howell, MI 48843
|
1,276 sq. feet
|
2 baths - beds |
show details | |

|
#36
Steelwood Dr
Howell, MI 48843
|
- sq. feet
|
- baths - beds |
show details | |

|
#37
Waterway Dr
Howell, MI 48843
|
- sq. feet
|
- baths - beds |
show details | |

|
#38
Geneva Ct
Howell, MI 48855
|
- sq. feet
|
- baths - beds |
show details | |

|
#39
Oakbrooke Ln # 5
Howell, MI 48843
|
- sq. feet
|
- baths - beds |
show details | |

|
#40
S Hughes
Howell, MI 48843
|
- sq. feet
|
- baths - beds |
show details |
| Photo | Address | Area | Beds / Baths | Price | Details |
|---|---|---|---|---|---|

|
#41
Fairlawn Rd Lot 27
Howell, MI 48855
|
- sq. feet
|
- baths - beds |
show details | |

|
#42
Faussett Rd
Howell, MI 48855
|
- sq. feet
|
- baths - beds |
show details | |

|
#43
Gem Dr
Howell, MI 48855
|
- sq. feet
|
- baths - beds |
show details | |

|
#44
River Line Dr
Howell, MI 48843
|
- sq. feet
|
1 baths - beds |
show details | |

|
#45
Bogues View Dr
Howell, MI 48843
|
- sq. feet
|
- baths - beds |
show details | |

|
#46
Legrand Blvd
Howell, MI 48843
|
- sq. feet
|
- baths - beds |
show details | |

|
#47
Amber Oaks Dr
Howell, MI 48855
|
- sq. feet
|
- baths - beds |
show details | |

|
#48
Pinckney Rd # 100
Howell, MI 48843
|
- sq. feet
|
- baths - beds |
show details | |

|
#49
Barnsley Dr
Howell, MI 48843
|
- sq. feet
|
- baths - beds |
show details | |

|
Check over 1 million property listings on Foreclosure.com!
|
browse all offers | |||


- 8,82586.8%White alone
- 7967.8%Hispanic
- 2202.2%Black alone
- 2212.2%Two or more races
- 1041.0%Asian alone
- 300.3%Other race alone
- 190.2%American Indian alone
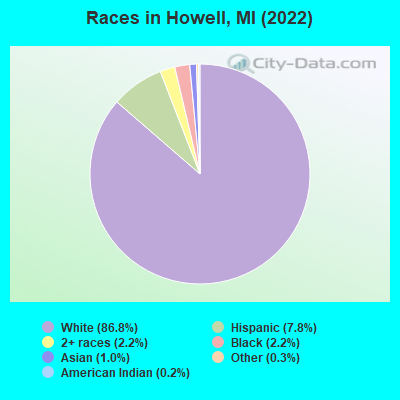
Races in Howell detailed stats: ancestries, foreign born residents, place of birth
According to our research of Michigan and other state lists, there were 116 registered sex offenders living in Howell, Michigan as of May 14, 2024.
The ratio of all residents to sex offenders in Howell is 82 to 1.
Type |
2009 |
2010 |
2011 |
2012 |
2013 |
2014 |
2015 |
2016 |
2017 |
2018 |
2019 |
2020 |
2021 |
2022 |
|---|---|---|---|---|---|---|---|---|---|---|---|---|---|---|
| Murders (per 100,000) | 0 (0.0) | 0 (0.0) | 0 (0.0) | 0 (0.0) | 0 (0.0) | 0 (0.0) | 0 (0.0) | 0 (0.0) | 0 (0.0) | 0 (0.0) | 1 (10.4) | 0 (0.0) | 0 (0.0) | 0 (0.0) |
| Rapes (per 100,000) | 6 (61.6) | 6 (63.2) | 5 (52.7) | 5 (52.4) | 13 (136.6) | 9 (94.0) | 8 (83.1) | 9 (94.4) | 7 (73.4) | 12 (125.9) | 8 (83.0) | 2 (20.8) | 4 (41.4) | 3 (29.7) |
| Robberies (per 100,000) | 1 (10.3) | 2 (21.1) | 1 (10.5) | 2 (21.0) | 2 (21.0) | 0 (0.0) | 2 (20.8) | 0 (0.0) | 0 (0.0) | 0 (0.0) | 2 (20.8) | 1 (10.4) | 0 (0.0) | 1 (9.9) |
| Assaults (per 100,000) | 30 (308.2) | 17 (179.2) | 12 (126.6) | 24 (251.7) | 13 (136.6) | 15 (156.6) | 14 (145.4) | 13 (136.4) | 15 (157.3) | 15 (157.4) | 20 (207.5) | 19 (197.5) | 8 (82.8) | 9 (89.1) |
| Burglaries (per 100,000) | 44 (452.1) | 55 (579.6) | 23 (242.6) | 32 (335.6) | 17 (178.7) | 16 (167.1) | 13 (135.0) | 18 (188.8) | 17 (178.2) | 8 (83.9) | 10 (103.8) | 12 (124.7) | 9 (93.1) | 29 (287.0) |
| Thefts (per 100,000) | 236 (2,425) | 220 (2,318) | 218 (2,299) | 229 (2,402) | 158 (1,661) | 123 (1,284) | 128 (1,329) | 105 (1,101) | 92 (964.6) | 97 (1,018) | 57 (591.5) | 60 (623.7) | 47 (486.2) | 69 (682.9) |
| Auto thefts (per 100,000) | 9 (92.5) | 8 (84.3) | 8 (84.4) | 12 (125.9) | 9 (94.6) | 3 (31.3) | 7 (72.7) | 1 (10.5) | 6 (62.9) | 7 (73.4) | 9 (93.4) | 8 (83.2) | 3 (31.0) | 2 (19.8) |
| Arson (per 100,000) | 1 (10.3) | 4 (42.2) | 0 (0.0) | 4 (42.0) | 2 (21.0) | 1 (10.4) | 1 (10.4) | 1 (10.5) | 1 (10.5) | 0 (0.0) | 1 (10.4) | 1 (10.4) | 2 (20.7) | 2 (19.8) |
| City-Data.com crime index | 250.1 | 232.8 | 186.4 | 228.2 | 229.5 | 172.1 | 170.2 | 160.9 | 146.3 | 184.6 | 173.3 | 99.6 | 78.1 | 93.5 |
The City-Data.com crime index weighs serious crimes and violent crimes more heavily. Higher means more crime, U.S. average is 246.1. It adjusts for the number of visitors and daily workers commuting into cities.
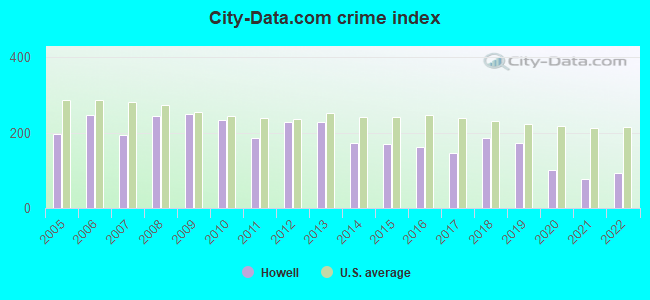
Crime rate in Howell detailed stats: murders, rapes, robberies, assaults, burglaries, thefts, arson
Full-time law enforcement employees in 2021, including police officers: 17 (15 officers - 13 male; 2 female).
| Officers per 1,000 residents here: | 1.55 |
| Michigan average: | 1.86 |
 Recent articles from our blog. Our writers, many of them Ph.D. graduates or candidates, create easy-to-read articles on a wide variety of topics.

 | Apartments in Howell (1 reply) |
| Race Relations in Detroit Suburbs (5 replies) |
| Gay Interracial Couple in Howell/Brighton area? (15 replies) |
| Possible Job Opportunity in Howell (10 replies) |
| Howell vs. Brighton schools (13 replies) |
| New Hudson Airport (3 replies) |
Latest news from Howell, MI collected exclusively by city-data.com from local newspapers, TV, and radio stations
Ancestries: German (17.9%), English (10.7%), American (9.4%), European (7.9%), Polish (6.1%), Irish (5.3%).
Current Local Time: EST time zone
Elevation: 922 feet
Land area: 4.11 square miles.
Population density: 2,452 people per square mile (low).
409 residents are foreign born (3.3% Latin America, 0.4% Asia).
| This city: | 4.0% |
| Michigan: | 6.9% |
Median real estate property taxes paid for housing units with mortgages in 2022: $3,004 (1.1%)
Median real estate property taxes paid for housing units with no mortgage in 2022: $2,707 (1.2%)
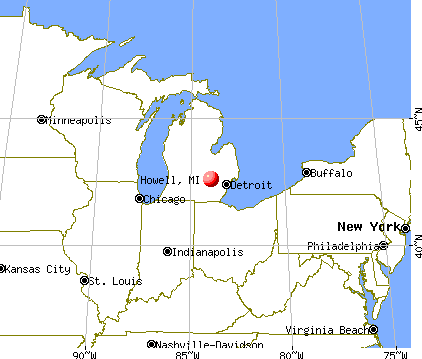
Nearest city with pop. 50,000+: Ann Arbor, MI  (25.2 miles , pop. 114,024).
Nearest city with pop. 200,000+: Detroit, MI (45.1 miles , pop. 951,270).
Nearest city with pop. 1,000,000+: Chicago, IL (199.1 miles , pop. 2,896,016).
Nearest cities:
), Latitude: 42.61 N, Longitude: 83.93 W
Daytime population change due to commuting: +4,247 (+41.8%)
Workers who live and work in this city: 1,559 (28.3%)
Area code: 517
Howell, Michigan accommodation & food services, waste management - Economy and Business Data
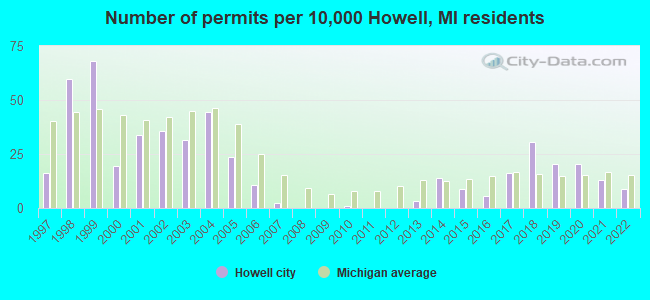
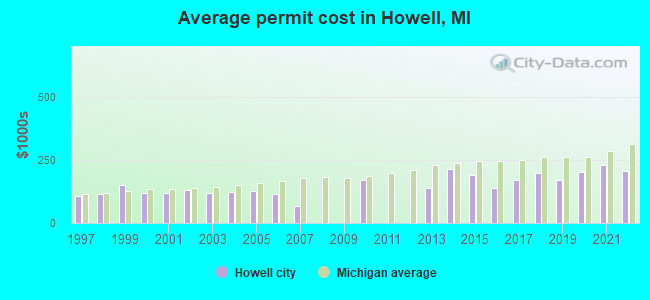
Single-family new house construction building permits:
- 2022: 8 buildings, average cost: $204,200
- 2021: 12 buildings, average cost: $228,500
- 2020: 19 buildings, average cost: $202,700
- 2019: 19 buildings, average cost: $170,300
- 2018: 28 buildings, average cost: $195,900
- 2017: 15 buildings, average cost: $170,700
- 2016: 5 buildings, average cost: $138,800
- 2015: 8 buildings, average cost: $187,600
- 2014: 13 buildings, average cost: $212,700
- 2013: 3 buildings, average cost: $136,600
- 2010: 1 building, cost: $170,000
- 2007: 2 buildings, average cost: $67,200
- 2006: 10 buildings, average cost: $114,000
- 2005: 22 buildings, average cost: $126,800
- 2004: 41 buildings, average cost: $123,500
- 2003: 29 buildings, average cost: $118,000
- 2002: 33 buildings, average cost: $130,800
- 2001: 31 buildings, average cost: $117,100
- 2000: 18 buildings, average cost: $117,000
- 1999: 63 buildings, average cost: $149,300
- 1998: 55 buildings, average cost: $116,000
- 1997: 15 buildings, average cost: $108,000
| Here: | 2.5% |
| Michigan: | 3.5% |
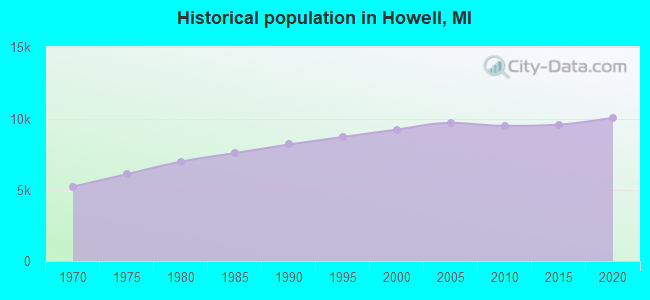
Population change in the 1990s: +1,188 (+14.8%).
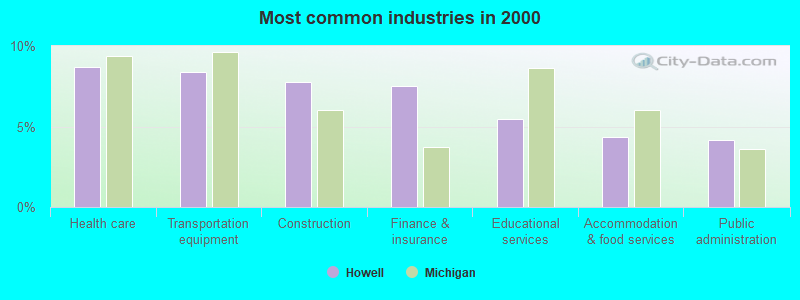
- Health care (8.7%)
- Transportation equipment (8.4%)
- Construction (7.8%)
- Finance & insurance (7.5%)
- Educational services (5.5%)
- Accommodation & food services (4.4%)
- Public administration (4.2%)
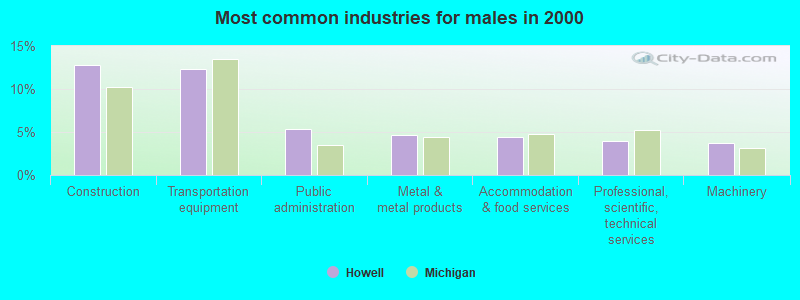
- Construction (12.8%)
- Transportation equipment (12.3%)
- Public administration (5.4%)
- Metal & metal products (4.7%)
- Accommodation & food services (4.4%)
- Professional, scientific, technical services (3.9%)
- Machinery (3.7%)
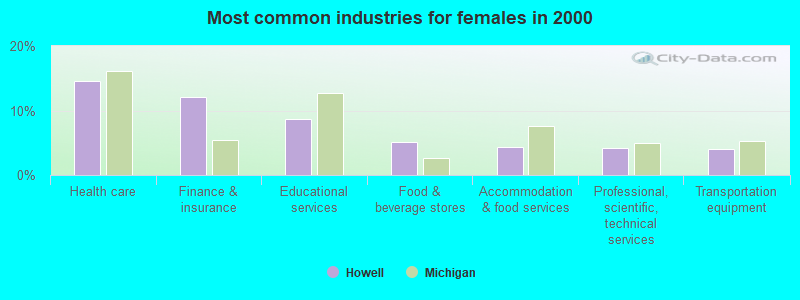
- Health care (14.6%)
- Finance & insurance (12.2%)
- Educational services (8.6%)
- Food & beverage stores (5.1%)
- Accommodation & food services (4.3%)
- Professional, scientific, technical services (4.1%)
- Transportation equipment (4.1%)
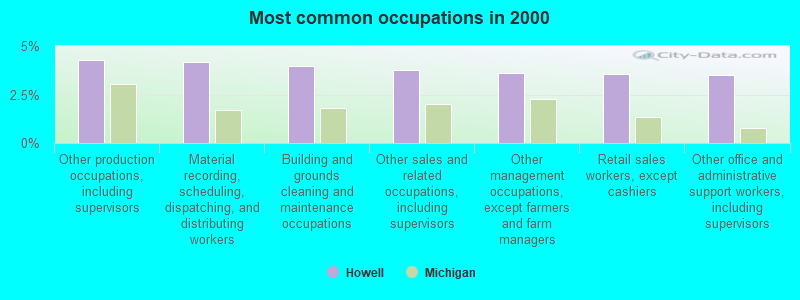
- Other production occupations, including supervisors (4.3%)
- Material recording, scheduling, dispatching, and distributing workers (4.2%)
- Building and grounds cleaning and maintenance occupations (4.0%)
- Other sales and related occupations, including supervisors (3.8%)
- Other management occupations, except farmers and farm managers (3.6%)
- Retail sales workers, except cashiers (3.5%)
- Other office and administrative support workers, including supervisors (3.5%)
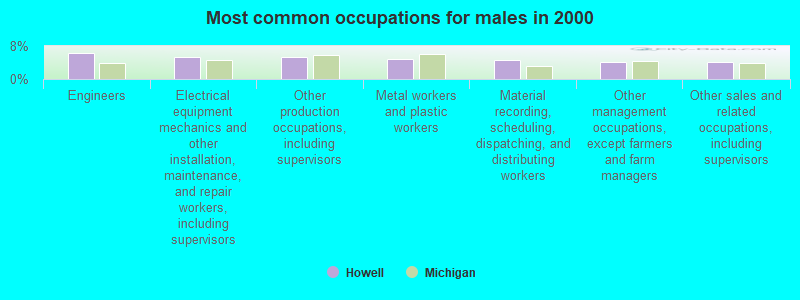
- Engineers (6.3%)
- Electrical equipment mechanics and other installation, maintenance, and repair workers, including supervisors (5.3%)
- Other production occupations, including supervisors (5.3%)
- Metal workers and plastic workers (4.8%)
- Material recording, scheduling, dispatching, and distributing workers (4.6%)
- Other management occupations, except farmers and farm managers (4.2%)
- Other sales and related occupations, including supervisors (4.1%)
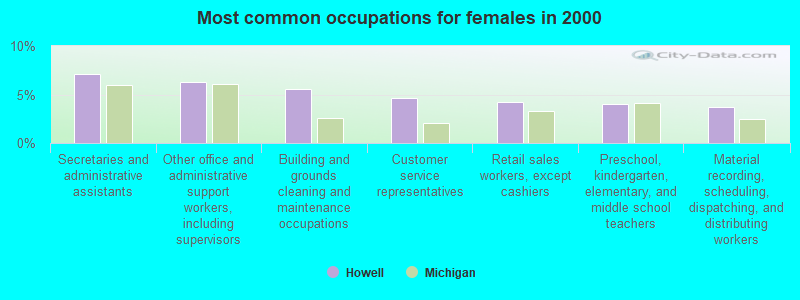
- Secretaries and administrative assistants (7.1%)
- Other office and administrative support workers, including supervisors (6.3%)
- Building and grounds cleaning and maintenance occupations (5.6%)
- Customer service representatives (4.6%)
- Retail sales workers, except cashiers (4.2%)
- Preschool, kindergarten, elementary, and middle school teachers (4.0%)
- Material recording, scheduling, dispatching, and distributing workers (3.7%)
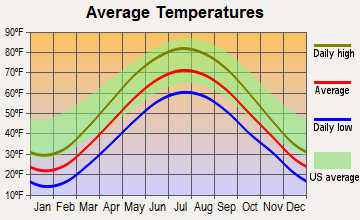
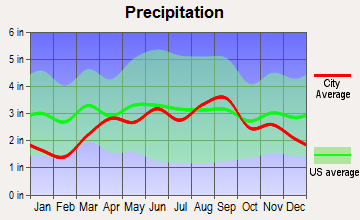
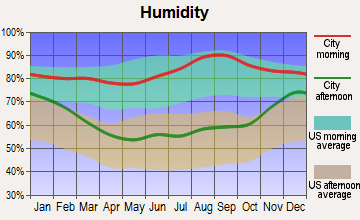
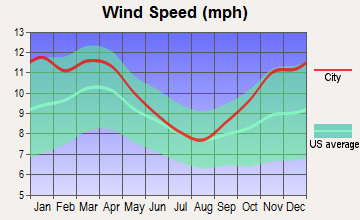
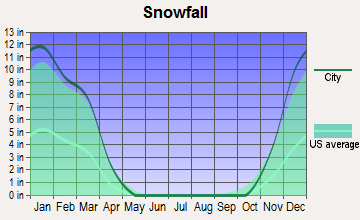
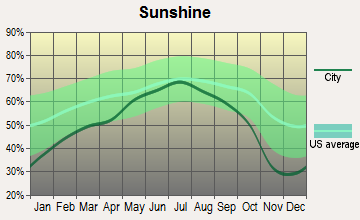
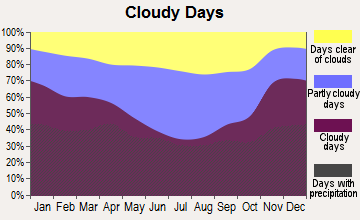
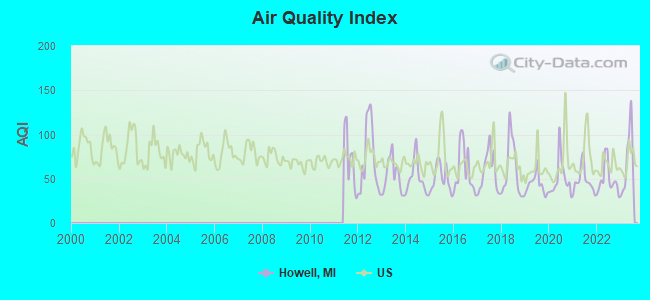
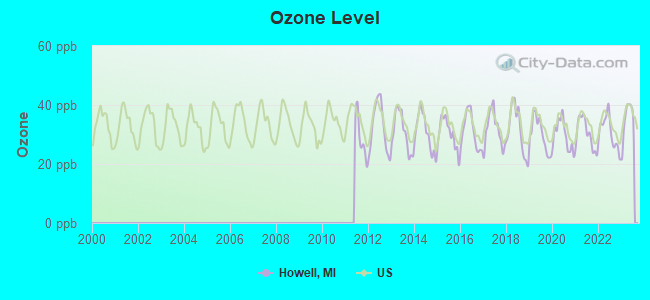
Average climate in Howell, Michigan
Based on data reported by over 4,000 weather stations
|
|

Tornado activity:
Howell-area historical tornado activity is above Michigan state average. It is 70% greater than the overall U.S. average.
On 7/4/1957, a category F4 (max. wind speeds 207-260 mph) tornado 12.1 miles away from the Howell city center injured 6 people and caused between $50,000 and $500,000 in damages.
On 6/8/1953, a category F5 (max. wind speeds 261-318 mph) tornado 34.2 miles away from the city center killed 116 people and injured 844 people and caused between $5,000,000 and $50,000,000 in damages.
Earthquake activity:
Howell-area historical earthquake activity is significantly above Michigan state average. It is 42% smaller than the overall U.S. average.On 9/25/1998 at 19:52:52, a magnitude 5.2 (4.8 MB, 4.3 MS, 5.2 LG, 4.5 MW, Depth: 3.1 mi, Class: Moderate, Intensity: VI - VII) earthquake occurred 197.4 miles away from Howell center
On 1/31/1986 at 16:46:43, a magnitude 5.0 (5.0 MB) earthquake occurred 158.4 miles away from Howell center
On 5/2/2015 at 16:23:07, a magnitude 4.2 (4.2 MW, Depth: 2.8 mi, Class: Light, Intensity: IV - V) earthquake occurred 80.6 miles away from the city center
On 7/12/1986 at 08:19:37, a magnitude 4.5 (4.5 MB) earthquake occurred 145.1 miles away from the city center
On 7/27/1980 at 18:52:21, a magnitude 5.2 (5.1 MB, 4.7 MS, 5.0 UK, 5.2 UK) earthquake occurred 304.7 miles away from the city center
On 4/18/2008 at 09:36:59, a magnitude 5.4 (5.1 MB, 4.8 MS, 5.4 MW, 5.2 MW) earthquake occurred 354.7 miles away from Howell center
Magnitude types: regional Lg-wave magnitude (LG), body-wave magnitude (MB), surface-wave magnitude (MS), moment magnitude (MW)
Natural disasters:
The number of natural disasters in Livingston County (7) is smaller than the US average (15).Major Disasters (Presidential) Declared: 2
Emergencies Declared: 4
Causes of natural disasters: Floods: 2, Storms: 2, Blizzard: 1, Hurricane: 1, Power Outage: 1, Snowstorm: 1, Tornado: 1, Wind: 1, Winter Storm: 1, Other: 1 (Note: some incidents may be assigned to more than one category).
Main business address for: FNBH BANCORP INC (NATIONAL COMMERCIAL BANKS).
Hospitals and medical centers in Howell:
Airports, heliports and other landing facilities located in Howell:
- Livingston County Spencer J Hardy Airport (OZW) (Runways: 1, Itinerant Ops: 19,646, Local Ops: 19,646)
- Raether Airport (4Y1) (Runways: 1, Itinerant Ops: 50, Local Ops: 50)
- Haigh Airport (MI27) (Runways: 1)
- Mckenzie's Landing Airport (1MI5) (Runways: 1)
- Johnston Field Heliport (MI36)
- Aeronut Park Balloonport (13M)
Colleges/universities with over 2000 students nearest to Howell:
- University of Michigan-Ann Arbor (about 26 miles; Ann Arbor, MI; Full-time enrollment: 39,547)
- Oakland Community College (about 26 miles; Bloomfield Hills, MI; FT enrollment: 18,956)
- Washtenaw Community College (about 28 miles; Ann Arbor, MI; FT enrollment: 8,452)
- Baker College of Flint (about 28 miles; Flint, MI; FT enrollment: 3,877)
- Baker College Center for Graduate Studies (about 29 miles; Flint, MI; FT enrollment: 3,405)
- Michigan State University (about 29 miles; East Lansing, MI; FT enrollment: 41,736)
- Baker College of Owosso (about 29 miles; Owosso, MI; FT enrollment: 2,081)
Public high schools in Howell:
- HOWELL HIGH SCHOOL (Students: 2,600, Location: 1200 WEST GRAND RIVER AVE, Grades: 9-12)
- LEGACY HIGH SCHOOL (Location: 9525 EAST HIGHLAND RD, Grades: 7-12)
- HARTLAND VIRTUAL ACADEMY (Location: 9525 E. HIGHLAND RD., Grades: KG-12)
- PATHWAY SCHOOL (Location: 1429 WEST GRAND RIVER AVE, Grades: PK-12)
Biggest public elementary/middle schools in Howell:
- HIGHLANDER WAY MIDDLE SCHOOL (Students: 1,111, Location: 511 NORTH HIGHLANDER WAY, Grades: 6-8)
- THREE FIRES ELEMENTARY (Students: 991, Location: 4125 CROOKED LAKE ROAD, Grades: KG-5)
- CHARYL STOCKWELL ACADEMY (Students: 722, Location: 9758 EAST HIGHLAND RD, Grades: KG-5, Charter school)
- RUAHMAH J. HUTCHINGS ELEMENTARY (Students: 622, Location: 3503 BIGELOW RD, Grades: PK-5)
- SOUTHWEST ELEMENTARY SCHOOL (Students: 552, Location: 915 GAY ST, Grades: KG-5)
- CHALLENGER ELEMENTARY SCHOOL (Students: 545, Location: 1066 WEST GRAND RIVER AVE, Grades: KG-5)
- VOYAGER ELEMENTARY SCHOOL (Students: 539, Location: 1450 BYRON RD, Grades: PK-5)
- NORTHWEST ELEMENTARY SCHOOL (Students: 537, Location: 1233 BOWER ST, Grades: KG-5)
- SOUTHEAST ELEMENTARY SCHOOL (Students: 537, Location: 861 EAST SIBLEY ST, Grades: KG-5)
- PARKER MIDDLE SCHOOL (Location: 400 WRIGHT RD, Grades: 6-8)
Private elementary/middle school in Howell:
User-submitted facts and corrections:
- zipcode 48855 is new
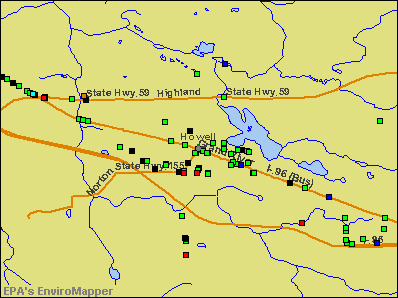
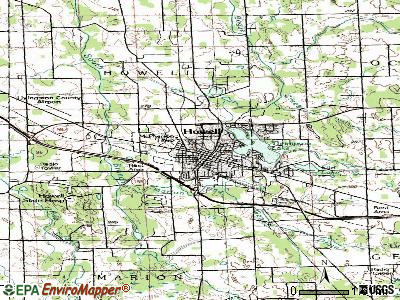
Points of interest:
Notable locations in Howell: Howell Station (A), Howell Depot Museum (B), Howell Carnegie District Library (C), Howell Area Fire Department Station 20 Headquarters (D), Livingston County Sheriff's Department (E), Howell City Hall (F), Howell City Police Department (G), ReadyCare of Howell (H), Howell Pediatrics (I), Howell Area Fire Department Station 21 (J). Display/hide their locations on the map
Shopping Centers: Promenade Center Shopping Center (1), Promenade Shopping Center (2). Display/hide their locations on the map
Main business address in Howell: FNBH BANCORP INC (A). Display/hide its location on the map
Churches in Howell include: Mount Hope Church (A), Howell Assembly of God Church (B), Church of the Nazarene (C), South Side Baptist Church (D), Church of Christ (E), Saint John's Episcopal Church (F), Grace Lutheran Church (G), Saint Joseph Catholic Church (H), First Presbyterian Church (I). Display/hide their locations on the map
Cemeteries: Lakeview Cemetery (1), Mount Olivet Cemetery (2). Display/hide their locations on the map
Parks in Howell include: Baldwin Park (1), Paul Bennett Recreation Center (2), Paul Bennett Field (3), Maple Street Park (4), West Street Park (5), McPherson Park (6), John S Page Athletic Field (7), Lakeside Park (8), Howell City Park (9). Display/hide their locations on the map
Tourist attractions: Howell Conference & Nature Center (Nature Centers; 1005 Triangle Lake Road), Howell Conference & Nature Center - Howell Nature Center- Wildlife Rehabilitation Infir (Nature Centers; 1005 Triangle Lake Road), Presbytery of Detroit (Nature Centers; 1005 Triangle Lake Road), Great Escape (Amusement & Theme Parks; 2630 East Grand River Avenue).
Hotels: Grand View Inn (5474 E Grand River Ave), Crest Motel (4495 West Grand River Avenue), Amerihost Suites Howell MI (4120 Lambert Drive), Amerihost Inn & Suites (4120 Lambert Drive), Best Western of Howell (1500 Pinckney Road).
Court: Livingston County - Juvenile Court (200 East Grand River Avenue).
Birthplace of: Trent Daavettila - Ice hockey player, Andy Hilbert - Ice hockey player, Mark Schauer - Politician, Milton C. Pettibone - Politician, Bert Tooley - Baseball player.
Drinking water stations with addresses in Howell and their reported violations in the past:
ST. JOHN CATHOLIC CHURCH (Population served: 800, Groundwater):Past monitoring violations:MUGG & BOPPS (Population served: 300, Groundwater):
- One regular monitoring violation
Past health violations:EASTERN MICHIGAN NAZARENE DISTRICT CENTE (Address: 4171 Woodland Drvie , Population served: 250, Groundwater):Past monitoring violations:
- MCL, Monthly (TCR) - In JUN-2010, Contaminant: Coliform. Follow-up actions: St Public Notif requested (JUN-25-2010), St Public Notif received (JUN-28-2010), St Compliance achieved (JUL-01-2010)
- 4 routine major monitoring violations
- One regular monitoring violation
Past monitoring violations:IRONWOOD GOLF COURSE (Population served: 200, Groundwater):
- One routine major monitoring violation
Past monitoring violations:HOWELL BEST WESTERN MOTEL (Population served: 162, Groundwater):
- One routine major monitoring violation
- One regular monitoring violation
Past monitoring violations:HAWK MEADOWS GOLF COURSE (Population served: 150, Groundwater):
- One regular monitoring violation
Past health violations:HIDDEN SPRINGS CHURCH (Population served: 125, Groundwater):Past monitoring violations:
- MCL, Monthly (TCR) - In DEC-2007, Contaminant: Coliform. Follow-up actions: St Public Notif issued (JAN-04-2008), St Formal NOV issued (JAN-04-2008), St Unresolved (JAN-04-2008), St Compliance achieved (APR-08-2008)
- One routine major monitoring violation
- One regular monitoring violation
Past monitoring violations:FAIRLAWN MEADOWS (Population served: 120, Groundwater):
- One routine major monitoring violation
Past monitoring violations:
- 2 routine major monitoring violations
- One minor monitoring violation
Drinking water stations with addresses in Howell that have no violations reported:
- LAKE CHEMUNG OUTDOOR RESORT (Population served: 500, Primary Water Source Type: Groundwater)
- VENTURE CORNER (Population served: 150, Primary Water Source Type: Groundwater)
- VIC & BOBS PARTY STORE (Population served: 150, Primary Water Source Type: Groundwater)
- MOBIL STATION-SPENCER RD (Population served: 100, Primary Water Source Type: Groundwater)
- WILDWOOD RANCH ( BATH HOUSE) (Population served: 100, Primary Water Source Type: Groundwater)
- HUNTERS RIDGE GOLF CLUB HOUSE (Population served: 50, Primary Water Source Type: Groundwater)
- PETTYSVILLE JUNCTION (Population served: 25, Primary Water Source Type: Groundwater)
- LAKE LANDING MARKET (Population served: 25, Primary Water Source Type: Groundwater)
- MARION TOWNSHIP HALL (Population served: 25, Primary Water Source Type: Groundwater)
- PARDIAC - SHELL GAS MART (Population served: 25, Primary Water Source Type: Groundwater)
| This city: | 2.2 people |
| Michigan: | 2.5 people |
| This city: | 55.5% |
| Whole state: | 66.0% |
| This city: | 8.9% |
| Whole state: | 6.4% |
Likely homosexual households (counted as self-reported same-sex unmarried-partner households)
- Lesbian couples: 0.4% of all households
- Gay men: 0.1% of all households
People in group quarters in Howell in 2010:
- 210 people in nursing facilities/skilled-nursing facilities
- 209 people in local jails and other municipal confinement facilities
- 6 people in group homes intended for adults
People in group quarters in Howell in 2000:
- 210 people in nursing homes
- 166 people in local jails and other confinement facilities (including police lockups)
- 17 people in homes for the mentally retarded
Banks with most branches in Howell (2011 data):
- First National Bank in Howell: Genoa Branch, Drive-In Branch, Vg's In-Store Branch, First National Bank In Howell. Info updated 2006/11/03: Bank assets: $292.1 mil, Deposits: $283.8 mil, local headquarters, negative income in the last year, Commercial Lending Specialization, 9 total offices, Holding Company: Fnbh Bancorp, Inc.
- Citizens Bank: 622 E Grand River Branch at 611 East Grand River, branch established on 1957/10/30; Highland Road, Howell Branch at 9402 East Highland Road, branch established on 2005/10/03. Info updated 2011/08/01: Bank assets: $9,212.3 mil, Deposits: $7,452.0 mil, headquarters in Flint, MI, positive income, Commercial Lending Specialization, 220 total offices, Holding Company: Citizens Republic Bancorp, Inc.
- PNC Bank, National Association: Howell Branch at 207 North Michigan Avenue, branch established on 1865/01/01; Chilson Road Branch at 2350 East Grand River, branch established on 1990/06/25. Info updated 2012/03/20: Bank assets: $263,309.6 mil, Deposits: $197,343.0 mil, headquarters in Wilmington, DE, positive income, Commercial Lending Specialization, 3085 total offices, Holding Company: Pnc Financial Services Group, Inc., The
- TCF National Bank: Howell Branch at 3857 E. Grand River Avenue, branch established on 2002/10/14; Hartland Branch at 10065 Highland Road, branch established on 2002/10/21. Info updated 2009/11/23: Bank assets: $19,007.0 mil, Deposits: $12,377.0 mil, headquarters in Sioux Falls, SD, positive income, Commercial Lending Specialization, 441 total offices, Holding Company: Tcf Financial Corporation
- Flagstar Bank, FSB: Howell M-59 Branch at 126 West Highland, branch established on 2006/04/12; Howell Branch at 4173 East Grand River, branch established on 1999/04/28. Info updated 2011/07/21: Bank assets: $13,623.5 mil, Deposits: $7,802.8 mil, headquarters in Troy, MI, negative income in the last year, Mortgage Lending Specialization, 135 total offices
- JPMorgan Chase Bank, National Association: Howell Branch at 2410 West Grand River Avenue, branch established on 1980/10/06; Howell Meijer Banking Ctr. Branch at 3883 East Grand River Avenue, branch established on 2006/03/31. Info updated 2011/11/10: Bank assets: $1,811,678.0 mil, Deposits: $1,190,738.0 mil, headquarters in Columbus, OH, positive income, International Specialization, 5577 total offices, Holding Company: Jpmorgan Chase & Co.
- Bank of America, National Association: Howell Branch at 3400 E. Grand River Road, branch established on 2000/11/08. Info updated 2009/11/18: Bank assets: $1,451,969.3 mil, Deposits: $1,077,176.8 mil, headquarters in Charlotte, NC, positive income, 5782 total offices, Holding Company: Bank Of America Corporation
- Comerica Bank: Latson-Grand River Branch at 1050 South Latson, branch established on 2002/12/18. Info updated 2011/07/29: Bank assets: $60,970.5 mil, Deposits: $48,300.9 mil, headquarters in Dallas, TX, positive income, Commercial Lending Specialization, 497 total offices, Holding Company: Comerica Incorporated
- Fifth Third Bank: Howell at 3866 East Grand River, branch established on 2000/12/11. Info updated 2009/10/05: Bank assets: $114,540.4 mil, Deposits: $89,689.1 mil, headquarters in Cincinnati, OH, positive income, Commercial Lending Specialization, 1378 total offices, Holding Company: Fifth Third Bancorp
For population 15 years and over in Howell:
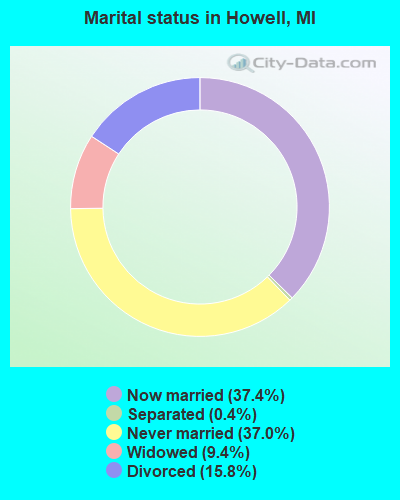
- Never married: 37.0%
- Now married: 37.4%
- Separated: 0.4%
- Widowed: 9.4%
- Divorced: 15.8%
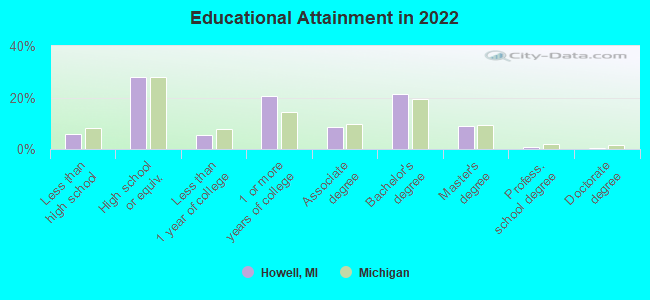
For population 25 years and over in Howell:
- High school or higher: 93.8%
- Bachelor's degree or higher: 29.3%
- Graduate or professional degree: 9.0%
- Unemployed: 3.9%
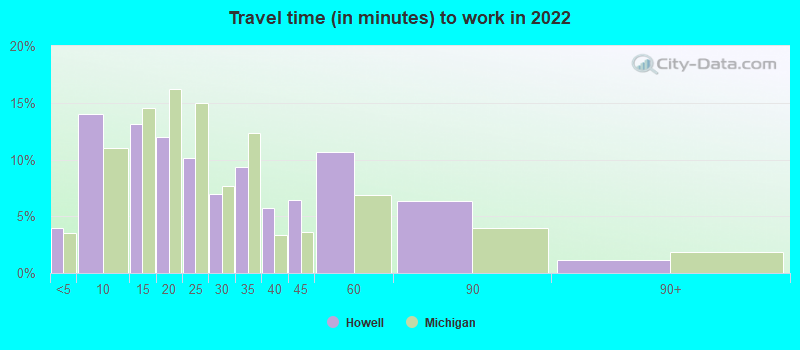
- Mean travel time to work (commute): 21.9 minutes
| Here: | 8.9 |
| Michigan average: | 11.0 |
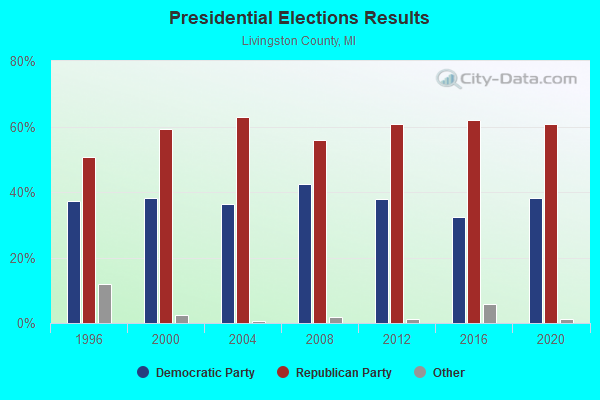
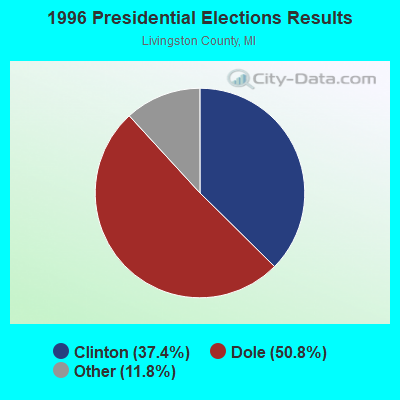
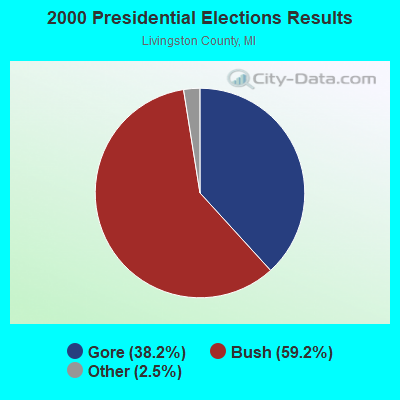
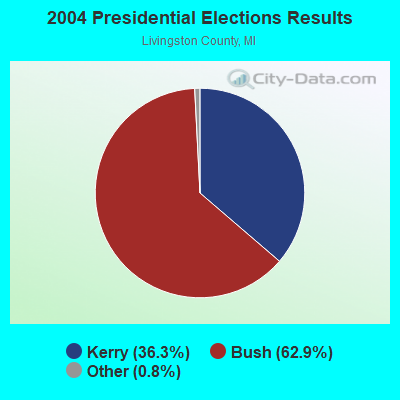
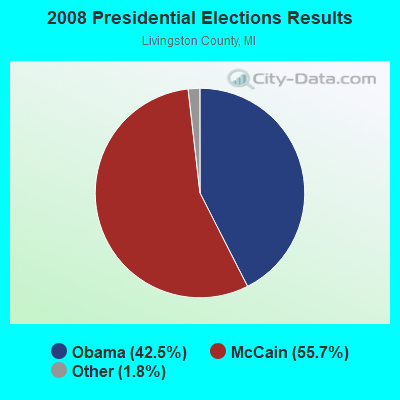
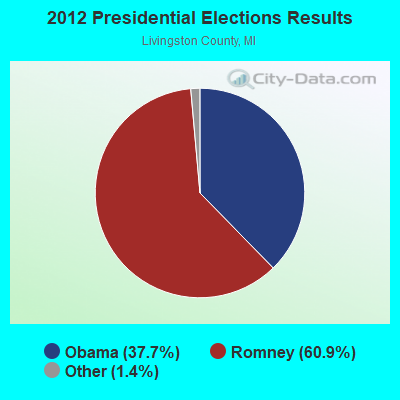
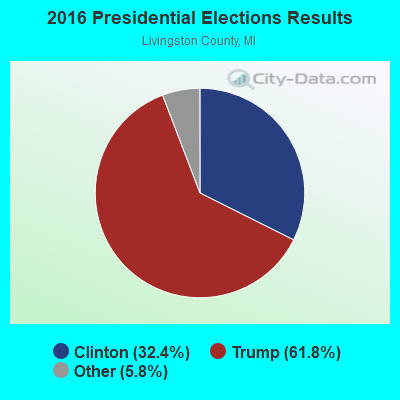
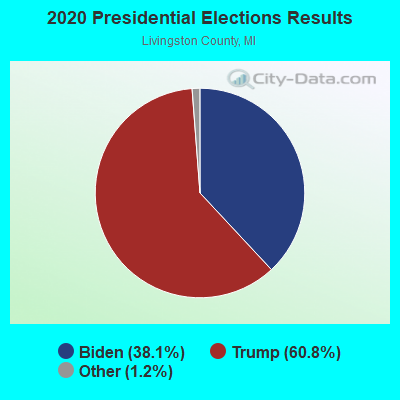
Graphs represent county-level data. Detailed 2008 Election Results
Religion statistics for Howell, MI (based on Livingston County data)
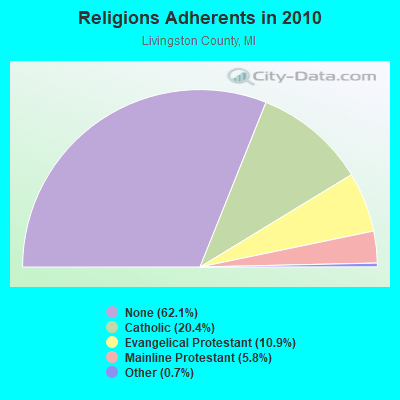
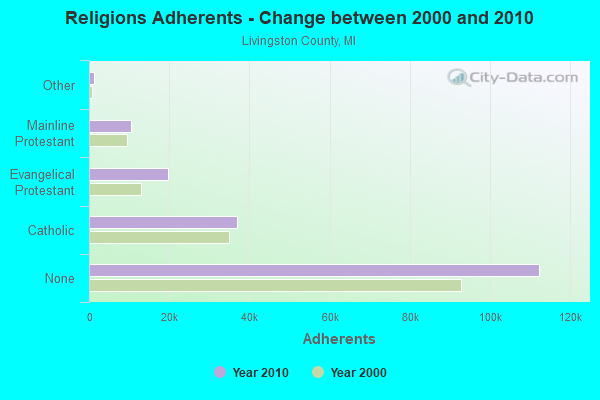
| Religion | Adherents | Congregations |
|---|---|---|
| Catholic | 36,976 | 9 |
| Evangelical Protestant | 19,679 | 59 |
| Mainline Protestant | 10,563 | 25 |
| Other | 1,249 | 7 |
| Black Protestant | 123 | 1 |
| None | 112,377 | - |
Food Environment Statistics:
| Livingston County: | 1.37 / 10,000 pop. |
| Michigan: | 2.34 / 10,000 pop. |
| This county: | 0.22 / 10,000 pop. |
| Michigan: | 0.18 / 10,000 pop. |
| Livingston County: | 0.93 / 10,000 pop. |
| State: | 1.52 / 10,000 pop. |
| Livingston County: | 2.03 / 10,000 pop. |
| Michigan: | 2.99 / 10,000 pop. |
| Livingston County: | 5.47 / 10,000 pop. |
| Michigan: | 6.80 / 10,000 pop. |
| Livingston County: | 7.9% |
| Michigan: | 9.7% |
| This county: | 25.7% |
| Michigan: | 29.7% |
| Livingston County: | 14.3% |
| Michigan: | 13.4% |
Health and Nutrition:
| This city: | 51.0% |
| Michigan: | 50.3% |
| Howell: | 49.0% |
| State: | 47.9% |
| This city: | 28.3 |
| Michigan: | 28.7 |
| This city: | 20.9% |
| Michigan: | 20.6% |
| This city: | 10.2% |
| Michigan: | 10.4% |
| Here: | 6.9 |
| Michigan: | 6.8 |
| This city: | 32.6% |
| Michigan: | 34.1% |
| This city: | 58.5% |
| Michigan: | 57.0% |
| Howell: | 79.9% |
| Michigan: | 79.6% |
More about Health and Nutrition of Howell, MI Residents
| Local government employment and payroll (March 2022) | |||||
| Function | Full-time employees | Monthly full-time payroll | Average yearly full-time wage | Part-time employees | Monthly part-time payroll |
|---|---|---|---|---|---|
| Police Protection - Officers | 14 | $88,931 | $76,227 | 0 | $0 |
| Streets and Highways | 9 | $46,953 | $62,604 | 4 | $7,095 |
| Sewerage | 6 | $33,901 | $67,802 | 0 | $0 |
| Other and Unallocable | 6 | $38,586 | $77,172 | 3 | $2,291 |
| Other Government Administration | 5 | $32,433 | $77,839 | 0 | $0 |
| Water Supply | 5 | $27,931 | $67,034 | 0 | $0 |
| Financial Administration | 5 | $30,208 | $72,499 | 2 | $6,657 |
| Police - Other | 4 | $24,864 | $74,592 | 3 | $1,329 |
| Totals for Government | 54 | $323,806 | $71,957 | 12 | $17,371 |
Howell government finances - Expenditure in 2017 (per resident):
- Current Operations - Sewerage: $3,422,000 ($339.45)
Police Protection: $2,360,000 ($234.10)
Regular Highways: $1,379,000 ($136.79)
General - Other: $1,297,000 ($128.66)
Solid Waste Management: $659,000 ($65.37)
Central Staff Services: $535,000 ($53.07)
Parks and Recreation: $492,000 ($48.80)
Financial Administration: $368,000 ($36.50)
Judicial and Legal Services: $109,000 ($10.81)
Protective Inspection and Regulation - Other: $76,000 ($7.54)
- General - Interest on Debt: $407,000 ($40.37)
- Other Capital Outlay - Regular Highways: $1,298,000 ($128.76)
General - Other: $393,000 ($38.98)
Water Utilities: $260,000 ($25.79)
Sewerage: $247,000 ($24.50)
- Total Salaries and Wages: $3,798,000 ($376.75)
- Water Utilities - Interest on Debt: $140,000 ($13.89)
Howell government finances - Revenue in 2017 (per resident):
- Charges - Sewerage: $2,177,000 ($215.95)
Other: $176,000 ($17.46)
Solid Waste Management: $174,000 ($17.26)
- Miscellaneous - General Revenue - Other: $522,000 ($51.78)
Rents: $140,000 ($13.89)
Fines and Forfeits: $60,000 ($5.95)
Interest Earnings: $9,000 ($0.89)
- Revenue - Water Utilities: $2,304,000 ($228.55)
- State Intergovernmental - Highways: $941,000 ($93.34)
General Local Government Support: $857,000 ($85.01)
Other: $604,000 ($59.91)
- Tax - Property: $5,235,000 ($519.29)
Occupation and Business License - Other: $323,000 ($32.04)
Howell government finances - Debt in 2017 (per resident):
- Long Term Debt - Outstanding Unspecified Public Purpose: $18,709,000 ($1855.87)
Beginning Outstanding - Unspecified Public Purpose: $17,919,000 ($1777.50)
Issue, Unspecified Public Purpose: $3,260,000 ($323.38)
Retired Unspecified Public Purpose: $2,470,000 ($245.02)
Howell government finances - Cash and Securities in 2017 (per resident):
- Other Funds - Cash and Securities: $8,042,000 ($797.74)
| Businesses in Howell, MI | ||||
| Name | Count | Name | Count | |
|---|---|---|---|---|
| 7-Eleven | 1 | Kohl's | 1 | |
| ALDI | 1 | Kroger | 2 | |
| AT&T | 1 | La-Z-Boy | 1 | |
| Ace Hardware | 1 | Lane Bryant | 1 | |
| Advance Auto Parts | 1 | Lane Furniture | 1 | |
| Aeropostale | 1 | Little Caesars Pizza | 1 | |
| Ann Taylor | 2 | Lowe's | 1 | |
| Applebee's | 1 | MasterBrand Cabinets | 2 | |
| AutoZone | 1 | Maurices | 1 | |
| Banana Republic | 1 | McDonald's | 3 | |
| Baskin-Robbins | 1 | Meijer | 1 | |
| Bath & Body Works | 1 | Motherhood Maternity | 1 | |
| Baymont Inn | 1 | Nike | 5 | |
| Best Western | 1 | Old Navy | 1 | |
| Blockbuster | 2 | Pac Sun | 1 | |
| Buffalo Wild Wings | 1 | Papa John's Pizza | 1 | |
| Burger King | 1 | Payless | 1 | |
| CVS | 3 | Penske | 1 | |
| Carson Pirie Scott | 1 | Pier 1 Imports | 1 | |
| Casual Male XL | 1 | Pizza Hut | 1 | |
| Chevrolet | 1 | RadioShack | 1 | |
| Curves | 1 | Rite Aid | 1 | |
| Dairy Queen | 1 | Rue21 | 1 | |
| Decora Cabinetry | 2 | Sears | 1 | |
| Discount Tire | 1 | Skechers USA | 1 | |
| DressBarn | 1 | Sprint Nextel | 3 | |
| Dressbarn | 1 | Staples | 1 | |
| Dunkin Donuts | 1 | Starbucks | 1 | |
| Eddie Bauer | 1 | Subway | 5 | |
| Famous Footwear | 1 | T-Mobile | 2 | |
| FedEx | 2 | T.J.Maxx | 1 | |
| Ford | 1 | Taco Bell | 1 | |
| GNC | 2 | Target | 1 | |
| Gap | 1 | The Room Place | 1 | |
| Gymboree | 1 | Toys"R"Us | 1 | |
| H&R Block | 2 | True Value | 1 | |
| Holiday Inn | 1 | U-Haul | 2 | |
| Home Depot | 1 | UPS | 11 | |
| J.Crew | 1 | Vans | 1 | |
| Jimmy John's | 1 | Walgreens | 1 | |
| Jones New York | 2 | Walmart | 1 | |
| Journeys | 1 | Wendy's | 2 | |
| Justice | 1 | White Castle | 1 | |
| KFC | 1 | YMCA | 1 | |
Strongest AM radio stations in Howell:
- WOAP (1080 AM; 50 kW; OWOSSO, MI)
- WWJ (950 AM; 50 kW; DETROIT, MI; Owner: INFINITY BROADCASTING OPERATIONS, INC.)
- WXYT (1270 AM; 50 kW; DETROIT, MI; Owner: INFINITY BROADCASTING CORP. OF DETROIT)
- WJR (760 AM; 50 kW; DETROIT, MI; Owner: ABC, INC.)
- WFDF (910 AM; 50 kW; FLINT, MI; Owner: ABC, INC.)
- WCHB (1200 AM; 50 kW; TAYLOR, MI; Owner: RADIO ONE OF DETROIT, LLC)
- WDFN (1130 AM; 50 kW; DETROIT, MI; Owner: AMFM RADIO LICENSES, L.L.C.)
- WKAR (870 AM; daytime; 10 kW; EAST LANSING, MI; Owner: MICHIGAN STATE UNIVERSITY)
- WDEO (990 AM; 9 kW; YPSILANTI, MI; Owner: WORD BROADCASTERS, INC.)
- WTKA (1050 AM; 10 kW; ANN ARBOR, MI; Owner: CAPSTAR TX LIMITED PARTNERSHIP)
- WTRX (1330 AM; 5 kW; FLINT, MI; Owner: CITADEL BROADCASTING COMPANY)
- WFNT (1470 AM; 5 kW; FLINT, MI)
- WILS (1320 AM; 5 kW; LANSING, MI)
Strongest FM radio stations in Howell:
- WHMI-FM (93.5 FM; HOWELL, MI; Owner: THE LIVINGSTON RADIO COMPANY)
- WUOM (91.7 FM; ANN ARBOR, MI; Owner: THE REGENTS OF THE UNIV. OF MICH.)
- WKAR-FM (90.5 FM; EAST LANSING, MI; Owner: MICHIGAN STATE UNIVERSITY)
- WLGH (88.1 FM; LEROY TOWNSHIP, MI; Owner: SUPERIOR COMMUNICATIONS)
- WAAQ (88.3 FM; ONSTED, MI; Owner: GREAT LAKES COMMUNITY BROADCASTING, INC.)
- WRIF (101.1 FM; DETROIT, MI; Owner: GREATER BOSTON RADIO, INC.)
- WFMK (99.1 FM; EAST LANSING, MI; Owner: CITADEL BROADCASTING COMPANY)
- WITL-FM (100.7 FM; LANSING, MI; Owner: CITADEL BROADCASTING COMPANY)
- WKRK-FM (97.1 FM; DETROIT, MI; Owner: INFINITY BROADCASTING OPERATIONS, INC.)
- WMGC-FM (105.1 FM; DETROIT, MI; Owner: GREATER BOSTON RADIO, INC.)
- WCSX (94.7 FM; BIRMINGHAM, MI; Owner: GREATER BOSTON RADIO, INC.)
- WWWW (102.9 FM; ANN ARBOR, MI; Owner: CAPSTAR TX LIMITED PARTNERSHIP)
- WYCD (99.5 FM; DETROIT, MI; Owner: INFINITY BROADCASTING CORPORATION OF MICHIGAN)
- WFBE (95.1 FM; FLINT, MI; Owner: CITADEL BROADCASTING COMPANY)
- WFUM-FM (91.1 FM; FLINT, MI; Owner: THE REGENTS OF THE UNIV. OF MICHIGAN)
- WQKL (107.1 FM; ANN ARBOR, MI; Owner: CAPSTAR TX LIMITED PARTNERSHIP)
TV broadcast stations around Howell:
- WPXD (Channel 31; ANN ARBOR, MI; Owner: PAXSON COMMUNICATIONS LICENSE COMPANY, LLC)
- WLNS-TV (Channel 6; LANSING, MI; Owner: YOUNG BROADCASTING OF LANSING, INC.)
- WKAR-TV (Channel 23; EAST LANSING, MI; Owner: BOARD OF TRUSTEES, MICH. STATE UNIV.)
- WXYZ-TV (Channel 7; DETROIT, MI; Owner: CHANNEL 7 OF DETROIT, INC.)
- WJBK (Channel 2; DETROIT, MI; Owner: FOX TELEVISION STATIONS, INC.)
- WKBD (Channel 50; DETROIT, MI; Owner: VIACOM STATIONS GROUP OF DETROIT INC.)
- WLAJ (Channel 53; LANSING, MI; Owner: FREEDOM BROADCASTING OF MICHIGAN, INC.)
- WHTV (Channel 18; JACKSON, MI; Owner: SPARTAN-TV, L.L.C.)
- WFUM (Channel 28; FLINT, MI; Owner: UNIVERSITY OF MICHIGAN)
- WEYI-TV (Channel 25; SAGINAW, MI; Owner: WEYI BROADCASTING, LLC)
- WILX-TV (Channel 10; ONONDAGA, MI; Owner: GRAY MIDAMERICA TV LICENSEE CORP.)
- W69BJ (Channel 69; LANSING, MI; Owner: TRI-STATE CHRISTIAN TV, INC.)
- WDIV-TV (Channel 4; DETROIT, MI; Owner: POST-NEWSWEEK STATIONS, MICHIGAN, INC.)
- WWJ-TV (Channel 62; DETROIT, MI; Owner: CBS BROADCASTING INC.)
- WDWB (Channel 20; DETROIT, MI; Owner: WXON LICENSE, INC.)
- WTVS (Channel 56; DETROIT, MI; Owner: DETROIT EDUC. TV FOUNDATION)
- WSYM-TV (Channel 47; LANSING, MI; Owner: JOURNAL BROADCAST CORPORATION)
- WSMH (Channel 66; FLINT, MI; Owner: WSMH LICENSEE, LLC)
- WAQP (Channel 49; SAGINAW, MI; Owner: TCT OF MICHIGAN, INC.)
- WJRT-TV (Channel 12; FLINT, MI; Owner: FLINT LICENSE SUBSIDIARY CORP.)
- W24CG (Channel 24; HOUGHTON LAKE, MI; Owner: MS COMMUNICATIONS, LLC)
- National Bridge Inventory (NBI) Statistics
- 37Number of bridges
- 338ft / 103mTotal length
- $30,000Total costs
- 604,927Total average daily traffic
- 49,364Total average daily truck traffic
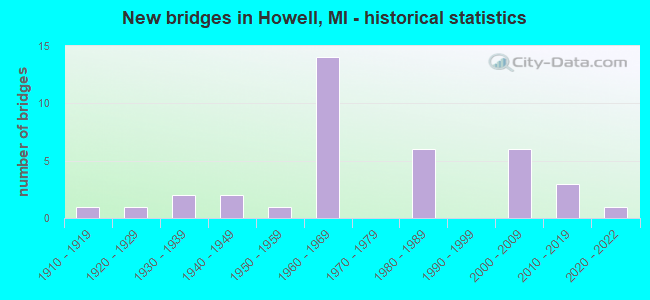
- New bridges - historical statistics
- 11910-1919
- 11920-1929
- 21930-1939
- 21940-1949
- 11950-1959
- 141960-1969
- 61980-1989
- 62000-2009
- 32010-2019
- 12020-2022
FCC Registered Antenna Towers: 217 (See the full list of FCC Registered Antenna Towers)
FCC Registered Private Land Mobile Towers: 4 (See the full list of FCC Registered Private Land Mobile Towers in Howell, MI)
FCC Registered Broadcast Land Mobile Towers: 49 (See the full list of FCC Registered Broadcast Land Mobile Towers)
FCC Registered Microwave Towers: 69 (See the full list of FCC Registered Microwave Towers in this town)
FCC Registered Paging Towers: 9 (See the full list of FCC Registered Paging Towers)
FCC Registered Maritime Coast & Aviation Ground Towers: 4 (See the full list of FCC Registered Maritime Coast & Aviation Ground Towers)
FCC Registered Amateur Radio Licenses: 348 (See the full list of FCC Registered Amateur Radio Licenses in Howell)
FAA Registered Aircraft Manufacturers and Dealers: 2 (See the full list of FAA Registered Manufacturers and Dealers in Howell)
FAA Registered Aircraft: 107 (See the full list of FAA Registered Aircraft)
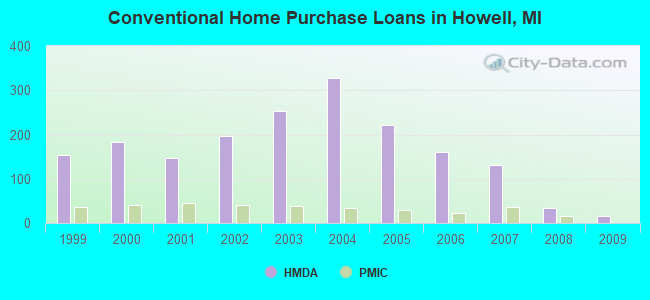
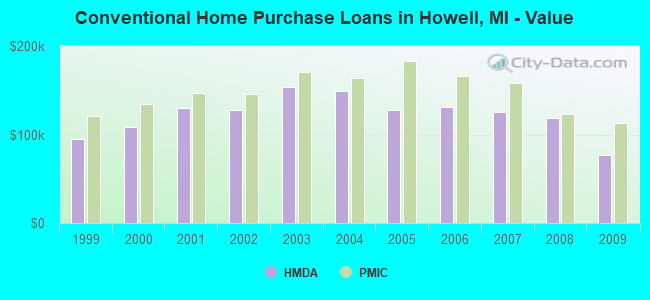
| Home Mortgage Disclosure Act Aggregated Statistics For Year 2009 (Based on 2 full tracts) | ||||||||||||||
| A) FHA, FSA/RHS & VA Home Purchase Loans | B) Conventional Home Purchase Loans | C) Refinancings | D) Home Improvement Loans | E) Loans on Dwellings For 5+ Families | F) Non-occupant Loans on < 5 Family Dwellings (A B C & D) | G) Loans On Manufactured Home Dwelling (A B C & D) | ||||||||
|---|---|---|---|---|---|---|---|---|---|---|---|---|---|---|
| Number | Average Value | Number | Average Value | Number | Average Value | Number | Average Value | Number | Average Value | Number | Average Value | Number | Average Value | |
| LOANS ORIGINATED | 40 | $112,687 | 16 | $77,111 | 81 | $139,088 | 4 | $59,488 | 1 | $2,118,000 | 12 | $88,984 | 0 | $0 |
| APPLICATIONS APPROVED, NOT ACCEPTED | 3 | $107,590 | 3 | $85,330 | 9 | $154,620 | 1 | $11,990 | 1 | $675,000 | 0 | $0 | 1 | $18,990 |
| APPLICATIONS DENIED | 7 | $93,991 | 5 | $79,000 | 44 | $152,635 | 6 | $12,828 | 0 | $0 | 5 | $136,800 | 0 | $0 |
| APPLICATIONS WITHDRAWN | 6 | $96,138 | 4 | $93,492 | 15 | $138,769 | 0 | $0 | 0 | $0 | 1 | $37,970 | 0 | $0 |
| FILES CLOSED FOR INCOMPLETENESS | 1 | $142,900 | 1 | $104,000 | 5 | $146,174 | 1 | $9,990 | 0 | $0 | 2 | $95,000 | 0 | $0 |
Detailed HMDA statistics for the following Tracts: 7250.00 , 7251.00
| Private Mortgage Insurance Companies Aggregated Statistics For Year 2009 (Based on 2 full tracts) | ||||
| A) Conventional Home Purchase Loans | B) Refinancings | |||
|---|---|---|---|---|
| Number | Average Value | Number | Average Value | |
| LOANS ORIGINATED | 1 | $113,000 | 1 | $124,910 |
| APPLICATIONS APPROVED, NOT ACCEPTED | 2 | $118,500 | 1 | $137,900 |
| APPLICATIONS DENIED | 0 | $0 | 0 | $0 |
| APPLICATIONS WITHDRAWN | 0 | $0 | 1 | $137,900 |
| FILES CLOSED FOR INCOMPLETENESS | 0 | $0 | 0 | $0 |
Detailed PMIC statistics for the following Tracts: 7250.00 , 7251.00
2002 - 2018 National Fire Incident Reporting System (NFIRS) incidents
- Fire incident types reported to NFIRS in Howell, MI
- 1,11545.9%Structure Fires
- 72529.8%Outside Fires
- 52521.6%Mobile Property/Vehicle Fires
- 662.7%Other
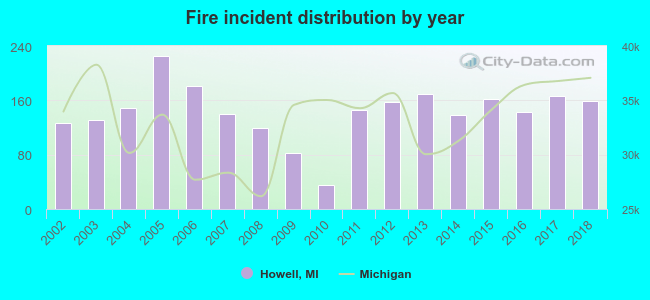 According to the data from the years 2002 - 2018 the average number of fires per year is 143. The highest number of fire incidents - 225 took place in 2005, and the least - 35 in 2010. The data has a rising trend.
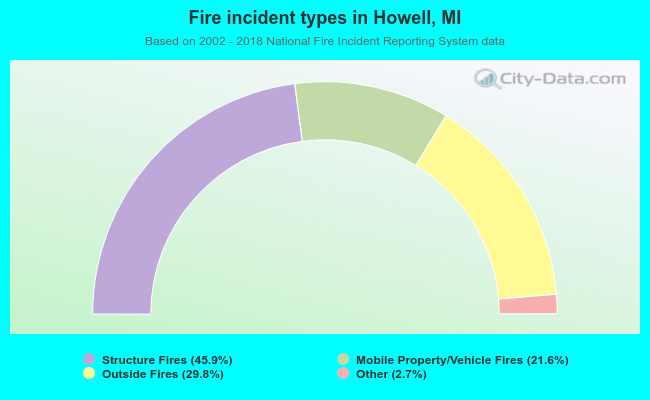 When looking into fire subcategories, the most incidents belonged to: Structure Fires (45.9%), and Outside Fires (29.8%).
Fire-safe hotels and motels in Howell, Michigan:
- Knights Inn, 124 Holiday Ln, Howell, Michigan 48843 , Phone: (517) 548-3510, Fax: (517) 548-1122
- Holiday Inn Express & Suites, 1397 N Burkhart Rd, Howell, Michigan 48855 , Phone: (517) 548-0100, Fax: (517) 548-0717
- Baymont Inn & Suites, 4120 Lambert Dr, Howell, Michigan 48855 , Phone: (517) 546-0712, Fax: (517) 546-0752
- Best Western Of Howell, 1500 Pinckney Rd, Howell, Michigan 48843 , Phone: (517) 548-2900, Fax: (517) 548-2163
| Most common first names in Howell, MI among deceased individuals | ||
| Name | Count | Lived (average) |
|---|---|---|
| William | 170 | 74.9 years |
| Mary | 162 | 79.2 years |
| John | 161 | 74.6 years |
| Robert | 150 | 71.6 years |
| James | 115 | 69.4 years |
| Helen | 106 | 82.4 years |
| Charles | 88 | 77.9 years |
| Margaret | 87 | 81.3 years |
| George | 84 | 77.7 years |
| Dorothy | 82 | 78.3 years |
| Most common last names in Howell, MI among deceased individuals | ||
| Last name | Count | Lived (average) |
|---|---|---|
| Smith | 86 | 74.5 years |
| Brown | 38 | 78.5 years |
| Miller | 38 | 77.0 years |
| Johnson | 38 | 74.3 years |
| Williams | 29 | 76.7 years |
| Cook | 26 | 76.2 years |
| White | 26 | 76.6 years |
| Clark | 25 | 81.9 years |
| Walker | 23 | 77.2 years |
| Wright | 22 | 75.9 years |
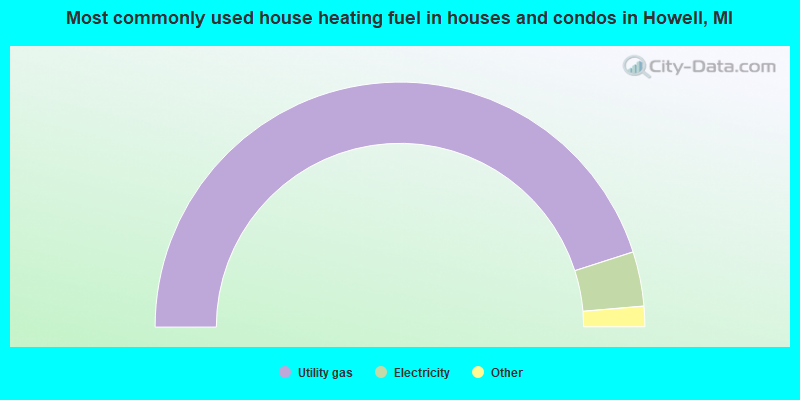
- 90.2%Utility gas
- 7.2%Electricity
- 2.3%Bottled, tank, or LP gas
- 0.3%Wood
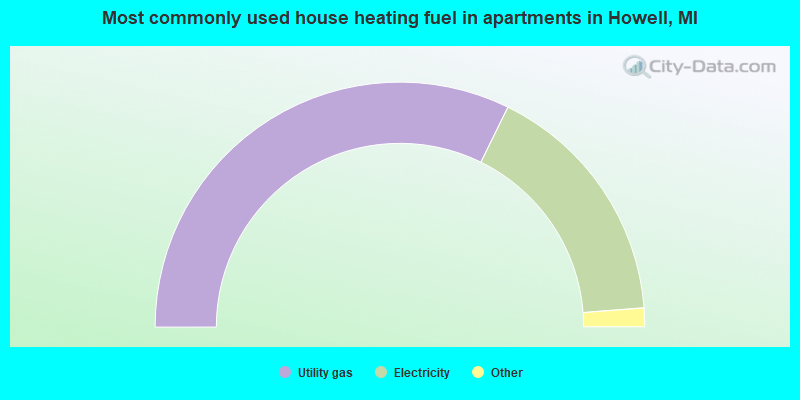
- 64.6%Utility gas
- 33.0%Electricity
- 1.3%Other fuel
- 1.1%Bottled, tank, or LP gas
Howell compared to Michigan state average:
- Unemployed percentage significantly below state average.
- Black race population percentage significantly below state average.
- Median age below state average.
- Foreign-born population percentage below state average.
- Renting percentage above state average.
- Number of rooms per house below state average.
- Institutionalized population percentage above state average.

|
|
Total of 1202 patent applications in 2008-2024.