Holyoke, Massachusetts Submit your own pictures of this city and show them to the world
OSM Map
General Map
Google Map
MSN Map
OSM Map
General Map
Google Map
MSN Map
OSM Map
General Map
Google Map
MSN Map
OSM Map
General Map
Google Map
MSN Map
Please wait while loading the map...
Population in 2022: 37,720 (99% urban, 1% rural). Population change since 2000: -5.3%Males: 18,609 Females: 19,111
March 2022 cost of living index in Holyoke: 120.2 (high, U.S. average is 100) Percentage of residents living in poverty in 2022: 26.0%for White Non-Hispanic residents , 43.7% for Black residents , 38.2% for Hispanic or Latino residents , 71.6% for American Indian residents , 29.5% for other race residents , 35.3% for two or more races residents )
Profiles of local businesses
Business Search - 14 Million verified businesses
Data:
Median household income ($)
Median household income (% change since 2000)
Household income diversity
Ratio of average income to average house value (%)
Ratio of average income to average rent
Median household income ($) - White
Median household income ($) - Black or African American
Median household income ($) - Asian
Median household income ($) - Hispanic or Latino
Median household income ($) - American Indian and Alaska Native
Median household income ($) - Multirace
Median household income ($) - Other Race
Median household income for houses/condos with a mortgage ($)
Median household income for apartments without a mortgage ($)
Races - White alone (%)
Races - White alone (% change since 2000)
Races - Black alone (%)
Races - Black alone (% change since 2000)
Races - American Indian alone (%)
Races - American Indian alone (% change since 2000)
Races - Asian alone (%)
Races - Asian alone (% change since 2000)
Races - Hispanic (%)
Races - Hispanic (% change since 2000)
Races - Native Hawaiian and Other Pacific Islander alone (%)
Races - Native Hawaiian and Other Pacific Islander alone (% change since 2000)
Races - Two or more races (%)
Races - Two or more races (% change since 2000)
Races - Other race alone (%)
Races - Other race alone (% change since 2000)
Racial diversity
Unemployment (%)
Unemployment (% change since 2000)
Unemployment (%) - White
Unemployment (%) - Black or African American
Unemployment (%) - Asian
Unemployment (%) - Hispanic or Latino
Unemployment (%) - American Indian and Alaska Native
Unemployment (%) - Multirace
Unemployment (%) - Other Race
Population density (people per square mile)
Population - Males (%)
Population - Females (%)
Population - Males (%) - White
Population - Males (%) - Black or African American
Population - Males (%) - Asian
Population - Males (%) - Hispanic or Latino
Population - Males (%) - American Indian and Alaska Native
Population - Males (%) - Multirace
Population - Males (%) - Other Race
Population - Females (%) - White
Population - Females (%) - Black or African American
Population - Females (%) - Asian
Population - Females (%) - Hispanic or Latino
Population - Females (%) - American Indian and Alaska Native
Population - Females (%) - Multirace
Population - Females (%) - Other Race
Coronavirus confirmed cases (May 16, 2024)
Deaths caused by coronavirus (May 16, 2024)
Coronavirus confirmed cases (per 100k population) (May 16, 2024)
Deaths caused by coronavirus (per 100k population) (May 16, 2024)
Daily increase in number of cases (May 16, 2024)
Weekly increase in number of cases (May 16, 2024)
Cases doubled (in days) (May 16, 2024)
Hospitalized patients (Apr 18, 2022)
Negative test results (Apr 18, 2022)
Total test results (Apr 18, 2022)
COVID Vaccine doses distributed (per 100k population) (Sep 19, 2023)
COVID Vaccine doses administered (per 100k population) (Sep 19, 2023)
COVID Vaccine doses distributed (Sep 19, 2023)
COVID Vaccine doses administered (Sep 19, 2023)
Likely homosexual households (%)
Likely homosexual households (% change since 2000)
Likely homosexual households - Lesbian couples (%)
Likely homosexual households - Lesbian couples (% change since 2000)
Likely homosexual households - Gay men (%)
Likely homosexual households - Gay men (% change since 2000)
Cost of living index
Median gross rent ($)
Median contract rent ($)
Median monthly housing costs ($)
Median house or condo value ($)
Median house or condo value ($ change since 2000)
Mean house or condo value by units in structure - 1, detached ($)
Mean house or condo value by units in structure - 1, attached ($)
Mean house or condo value by units in structure - 2 ($)
Mean house or condo value by units in structure by units in structure - 3 or 4 ($)
Mean house or condo value by units in structure - 5 or more ($)
Mean house or condo value by units in structure - Boat, RV, van, etc. ($)
Mean house or condo value by units in structure - Mobile home ($)
Median house or condo value ($) - White
Median house or condo value ($) - Black or African American
Median house or condo value ($) - Asian
Median house or condo value ($) - Hispanic or Latino
Median house or condo value ($) - American Indian and Alaska Native
Median house or condo value ($) - Multirace
Median house or condo value ($) - Other Race
Median resident age
Resident age diversity
Median resident age - Males
Median resident age - Females
Median resident age - White
Median resident age - Black or African American
Median resident age - Asian
Median resident age - Hispanic or Latino
Median resident age - American Indian and Alaska Native
Median resident age - Multirace
Median resident age - Other Race
Median resident age - Males - White
Median resident age - Males - Black or African American
Median resident age - Males - Asian
Median resident age - Males - Hispanic or Latino
Median resident age - Males - American Indian and Alaska Native
Median resident age - Males - Multirace
Median resident age - Males - Other Race
Median resident age - Females - White
Median resident age - Females - Black or African American
Median resident age - Females - Asian
Median resident age - Females - Hispanic or Latino
Median resident age - Females - American Indian and Alaska Native
Median resident age - Females - Multirace
Median resident age - Females - Other Race
Commute - mean travel time to work (minutes)
Travel time to work - Less than 5 minutes (%)
Travel time to work - Less than 5 minutes (% change since 2000)
Travel time to work - 5 to 9 minutes (%)
Travel time to work - 5 to 9 minutes (% change since 2000)
Travel time to work - 10 to 19 minutes (%)
Travel time to work - 10 to 19 minutes (% change since 2000)
Travel time to work - 20 to 29 minutes (%)
Travel time to work - 20 to 29 minutes (% change since 2000)
Travel time to work - 30 to 39 minutes (%)
Travel time to work - 30 to 39 minutes (% change since 2000)
Travel time to work - 40 to 59 minutes (%)
Travel time to work - 40 to 59 minutes (% change since 2000)
Travel time to work - 60 to 89 minutes (%)
Travel time to work - 60 to 89 minutes (% change since 2000)
Travel time to work - 90 or more minutes (%)
Travel time to work - 90 or more minutes (% change since 2000)
Marital status - Never married (%)
Marital status - Now married (%)
Marital status - Separated (%)
Marital status - Widowed (%)
Marital status - Divorced (%)
Median family income ($)
Median family income (% change since 2000)
Median non-family income ($)
Median non-family income (% change since 2000)
Median per capita income ($)
Median per capita income (% change since 2000)
Median family income ($) - White
Median family income ($) - Black or African American
Median family income ($) - Asian
Median family income ($) - Hispanic or Latino
Median family income ($) - American Indian and Alaska Native
Median family income ($) - Multirace
Median family income ($) - Other Race
Median year house/condo built
Median year apartment built
Year house built - Built 2005 or later (%)
Year house built - Built 2000 to 2004 (%)
Year house built - Built 1990 to 1999 (%)
Year house built - Built 1980 to 1989 (%)
Year house built - Built 1970 to 1979 (%)
Year house built - Built 1960 to 1969 (%)
Year house built - Built 1950 to 1959 (%)
Year house built - Built 1940 to 1949 (%)
Year house built - Built 1939 or earlier (%)
Average household size
Household density (households per square mile)
Average household size - White
Average household size - Black or African American
Average household size - Asian
Average household size - Hispanic or Latino
Average household size - American Indian and Alaska Native
Average household size - Multirace
Average household size - Other Race
Occupied housing units (%)
Vacant housing units (%)
Owner occupied housing units (%)
Renter occupied housing units (%)
Vacancy status - For rent (%)
Vacancy status - For sale only (%)
Vacancy status - Rented or sold, not occupied (%)
Vacancy status - For seasonal, recreational, or occasional use (%)
Vacancy status - For migrant workers (%)
Vacancy status - Other vacant (%)
Residents with income below the poverty level (%)
Residents with income below 50% of the poverty level (%)
Children below poverty level (%)
Poor families by family type - Married-couple family (%)
Poor families by family type - Male, no wife present (%)
Poor families by family type - Female, no husband present (%)
Poverty status for native-born residents (%)
Poverty status for foreign-born residents (%)
Poverty among high school graduates not in families (%)
Poverty among people who did not graduate high school not in families (%)
Residents with income below the poverty level (%) - White
Residents with income below the poverty level (%) - Black or African American
Residents with income below the poverty level (%) - Asian
Residents with income below the poverty level (%) - Hispanic or Latino
Residents with income below the poverty level (%) - American Indian and Alaska Native
Residents with income below the poverty level (%) - Multirace
Residents with income below the poverty level (%) - Other Race
Air pollution - Air Quality Index (AQI)
Air pollution - CO
Air pollution - NO2
Air pollution - SO2
Air pollution - Ozone
Air pollution - PM10
Air pollution - PM25
Air pollution - Pb
Crime - Murders per 100,000 population
Crime - Rapes per 100,000 population
Crime - Robberies per 100,000 population
Crime - Assaults per 100,000 population
Crime - Burglaries per 100,000 population
Crime - Thefts per 100,000 population
Crime - Auto thefts per 100,000 population
Crime - Arson per 100,000 population
Crime - City-data.com crime index
Crime - Violent crime index
Crime - Property crime index
Crime - Murders per 100,000 population (5 year average)
Crime - Rapes per 100,000 population (5 year average)
Crime - Robberies per 100,000 population (5 year average)
Crime - Assaults per 100,000 population (5 year average)
Crime - Burglaries per 100,000 population (5 year average)
Crime - Thefts per 100,000 population (5 year average)
Crime - Auto thefts per 100,000 population (5 year average)
Crime - Arson per 100,000 population (5 year average)
Crime - City-data.com crime index (5 year average)
Crime - Violent crime index (5 year average)
Crime - Property crime index (5 year average)
1996 Presidential Elections Results (%) - Democratic Party (Clinton)
1996 Presidential Elections Results (%) - Republican Party (Dole)
1996 Presidential Elections Results (%) - Other
2000 Presidential Elections Results (%) - Democratic Party (Gore)
2000 Presidential Elections Results (%) - Republican Party (Bush)
2000 Presidential Elections Results (%) - Other
2004 Presidential Elections Results (%) - Democratic Party (Kerry)
2004 Presidential Elections Results (%) - Republican Party (Bush)
2004 Presidential Elections Results (%) - Other
2008 Presidential Elections Results (%) - Democratic Party (Obama)
2008 Presidential Elections Results (%) - Republican Party (McCain)
2008 Presidential Elections Results (%) - Other
2012 Presidential Elections Results (%) - Democratic Party (Obama)
2012 Presidential Elections Results (%) - Republican Party (Romney)
2012 Presidential Elections Results (%) - Other
2016 Presidential Elections Results (%) - Democratic Party (Clinton)
2016 Presidential Elections Results (%) - Republican Party (Trump)
2016 Presidential Elections Results (%) - Other
2020 Presidential Elections Results (%) - Democratic Party (Biden)
2020 Presidential Elections Results (%) - Republican Party (Trump)
2020 Presidential Elections Results (%) - Other
Ancestries Reported - Arab (%)
Ancestries Reported - Czech (%)
Ancestries Reported - Danish (%)
Ancestries Reported - Dutch (%)
Ancestries Reported - English (%)
Ancestries Reported - French (%)
Ancestries Reported - French Canadian (%)
Ancestries Reported - German (%)
Ancestries Reported - Greek (%)
Ancestries Reported - Hungarian (%)
Ancestries Reported - Irish (%)
Ancestries Reported - Italian (%)
Ancestries Reported - Lithuanian (%)
Ancestries Reported - Norwegian (%)
Ancestries Reported - Polish (%)
Ancestries Reported - Portuguese (%)
Ancestries Reported - Russian (%)
Ancestries Reported - Scotch-Irish (%)
Ancestries Reported - Scottish (%)
Ancestries Reported - Slovak (%)
Ancestries Reported - Subsaharan African (%)
Ancestries Reported - Swedish (%)
Ancestries Reported - Swiss (%)
Ancestries Reported - Ukrainian (%)
Ancestries Reported - United States (%)
Ancestries Reported - Welsh (%)
Ancestries Reported - West Indian (%)
Ancestries Reported - Other (%)
Educational Attainment - No schooling completed (%)
Educational Attainment - Less than high school (%)
Educational Attainment - High school or equivalent (%)
Educational Attainment - Less than 1 year of college (%)
Educational Attainment - 1 or more years of college (%)
Educational Attainment - Associate degree (%)
Educational Attainment - Bachelor's degree (%)
Educational Attainment - Master's degree (%)
Educational Attainment - Professional school degree (%)
Educational Attainment - Doctorate degree (%)
School Enrollment - Nursery, preschool (%)
School Enrollment - Kindergarten (%)
School Enrollment - Grade 1 to 4 (%)
School Enrollment - Grade 5 to 8 (%)
School Enrollment - Grade 9 to 12 (%)
School Enrollment - College undergrad (%)
School Enrollment - Graduate or professional (%)
School Enrollment - Not enrolled in school (%)
School enrollment - Public schools (%)
School enrollment - Private schools (%)
School enrollment - Not enrolled (%)
Median number of rooms in houses and condos
Median number of rooms in apartments
Housing units lacking complete plumbing facilities (%)
Housing units lacking complete kitchen facilities (%)
Density of houses
Urban houses (%)
Rural houses (%)
Households with people 60 years and over (%)
Households with people 65 years and over (%)
Households with people 75 years and over (%)
Households with one or more nonrelatives (%)
Households with no nonrelatives (%)
Population in households (%)
Family households (%)
Nonfamily households (%)
Population in families (%)
Family households with own children (%)
Median number of bedrooms in owner occupied houses
Mean number of bedrooms in owner occupied houses
Median number of bedrooms in renter occupied houses
Mean number of bedrooms in renter occupied houses
Median number of vehichles in owner occupied houses
Mean number of vehichles in owner occupied houses
Median number of vehichles in renter occupied houses
Mean number of vehichles in renter occupied houses
Mortgage status - with mortgage (%)
Mortgage status - with second mortgage (%)
Mortgage status - with home equity loan (%)
Mortgage status - with both second mortgage and home equity loan (%)
Mortgage status - without a mortgage (%)
Average family size
Average family size - White
Average family size - Black or African American
Average family size - Asian
Average family size - Hispanic or Latino
Average family size - American Indian and Alaska Native
Average family size - Multirace
Average family size - Other Race
Geographical mobility - Same house 1 year ago (%)
Geographical mobility - Moved within same county (%)
Geographical mobility - Moved from different county within same state (%)
Geographical mobility - Moved from different state (%)
Geographical mobility - Moved from abroad (%)
Place of birth - Born in state of residence (%)
Place of birth - Born in other state (%)
Place of birth - Native, outside of US (%)
Place of birth - Foreign born (%)
Housing units in structures - 1, detached (%)
Housing units in structures - 1, attached (%)
Housing units in structures - 2 (%)
Housing units in structures - 3 or 4 (%)
Housing units in structures - 5 to 9 (%)
Housing units in structures - 10 to 19 (%)
Housing units in structures - 20 to 49 (%)
Housing units in structures - 50 or more (%)
Housing units in structures - Mobile home (%)
Housing units in structures - Boat, RV, van, etc. (%)
House/condo owner moved in on average (years ago)
Renter moved in on average (years ago)
Year householder moved into unit - Moved in 1999 to March 2000 (%)
Year householder moved into unit - Moved in 1995 to 1998 (%)
Year householder moved into unit - Moved in 1990 to 1994 (%)
Year householder moved into unit - Moved in 1980 to 1989 (%)
Year householder moved into unit - Moved in 1970 to 1979 (%)
Year householder moved into unit - Moved in 1969 or earlier (%)
Means of transportation to work - Drove car alone (%)
Means of transportation to work - Carpooled (%)
Means of transportation to work - Public transportation (%)
Means of transportation to work - Bus or trolley bus (%)
Means of transportation to work - Streetcar or trolley car (%)
Means of transportation to work - Subway or elevated (%)
Means of transportation to work - Railroad (%)
Means of transportation to work - Ferryboat (%)
Means of transportation to work - Taxicab (%)
Means of transportation to work - Motorcycle (%)
Means of transportation to work - Bicycle (%)
Means of transportation to work - Walked (%)
Means of transportation to work - Other means (%)
Working at home (%)
Industry diversity
Most Common Industries - Agriculture, forestry, fishing and hunting, and mining (%)
Most Common Industries - Agriculture, forestry, fishing and hunting (%)
Most Common Industries - Mining, quarrying, and oil and gas extraction (%)
Most Common Industries - Construction (%)
Most Common Industries - Manufacturing (%)
Most Common Industries - Wholesale trade (%)
Most Common Industries - Retail trade (%)
Most Common Industries - Transportation and warehousing, and utilities (%)
Most Common Industries - Transportation and warehousing (%)
Most Common Industries - Utilities (%)
Most Common Industries - Information (%)
Most Common Industries - Finance and insurance, and real estate and rental and leasing (%)
Most Common Industries - Finance and insurance (%)
Most Common Industries - Real estate and rental and leasing (%)
Most Common Industries - Professional, scientific, and management, and administrative and waste management services (%)
Most Common Industries - Professional, scientific, and technical services (%)
Most Common Industries - Management of companies and enterprises (%)
Most Common Industries - Administrative and support and waste management services (%)
Most Common Industries - Educational services, and health care and social assistance (%)
Most Common Industries - Educational services (%)
Most Common Industries - Health care and social assistance (%)
Most Common Industries - Arts, entertainment, and recreation, and accommodation and food services (%)
Most Common Industries - Arts, entertainment, and recreation (%)
Most Common Industries - Accommodation and food services (%)
Most Common Industries - Other services, except public administration (%)
Most Common Industries - Public administration (%)
Occupation diversity
Most Common Occupations - Management, business, science, and arts occupations (%)
Most Common Occupations - Management, business, and financial occupations (%)
Most Common Occupations - Management occupations (%)
Most Common Occupations - Business and financial operations occupations (%)
Most Common Occupations - Computer, engineering, and science occupations (%)
Most Common Occupations - Computer and mathematical occupations (%)
Most Common Occupations - Architecture and engineering occupations (%)
Most Common Occupations - Life, physical, and social science occupations (%)
Most Common Occupations - Education, legal, community service, arts, and media occupations (%)
Most Common Occupations - Community and social service occupations (%)
Most Common Occupations - Legal occupations (%)
Most Common Occupations - Education, training, and library occupations (%)
Most Common Occupations - Arts, design, entertainment, sports, and media occupations (%)
Most Common Occupations - Healthcare practitioners and technical occupations (%)
Most Common Occupations - Health diagnosing and treating practitioners and other technical occupations (%)
Most Common Occupations - Health technologists and technicians (%)
Most Common Occupations - Service occupations (%)
Most Common Occupations - Healthcare support occupations (%)
Most Common Occupations - Protective service occupations (%)
Most Common Occupations - Fire fighting and prevention, and other protective service workers including supervisors (%)
Most Common Occupations - Law enforcement workers including supervisors (%)
Most Common Occupations - Food preparation and serving related occupations (%)
Most Common Occupations - Building and grounds cleaning and maintenance occupations (%)
Most Common Occupations - Personal care and service occupations (%)
Most Common Occupations - Sales and office occupations (%)
Most Common Occupations - Sales and related occupations (%)
Most Common Occupations - Office and administrative support occupations (%)
Most Common Occupations - Natural resources, construction, and maintenance occupations (%)
Most Common Occupations - Farming, fishing, and forestry occupations (%)
Most Common Occupations - Construction and extraction occupations (%)
Most Common Occupations - Installation, maintenance, and repair occupations (%)
Most Common Occupations - Production, transportation, and material moving occupations (%)
Most Common Occupations - Production occupations (%)
Most Common Occupations - Transportation occupations (%)
Most Common Occupations - Material moving occupations (%)
People in Group quarters - Institutionalized population (%)
People in Group quarters - Correctional institutions (%)
People in Group quarters - Federal prisons and detention centers (%)
People in Group quarters - Halfway houses (%)
People in Group quarters - Local jails and other confinement facilities (including police lockups) (%)
People in Group quarters - Military disciplinary barracks (%)
People in Group quarters - State prisons (%)
People in Group quarters - Other types of correctional institutions (%)
People in Group quarters - Nursing homes (%)
People in Group quarters - Hospitals/wards, hospices, and schools for the handicapped (%)
People in Group quarters - Hospitals/wards and hospices for chronically ill (%)
People in Group quarters - Hospices or homes for chronically ill (%)
People in Group quarters - Military hospitals or wards for chronically ill (%)
People in Group quarters - Other hospitals or wards for chronically ill (%)
People in Group quarters - Hospitals or wards for drug/alcohol abuse (%)
People in Group quarters - Mental (Psychiatric) hospitals or wards (%)
People in Group quarters - Schools, hospitals, or wards for the mentally retarded (%)
People in Group quarters - Schools, hospitals, or wards for the physically handicapped (%)
People in Group quarters - Institutions for the deaf (%)
People in Group quarters - Institutions for the blind (%)
People in Group quarters - Orthopedic wards and institutions for the physically handicapped (%)
People in Group quarters - Wards in general hospitals for patients who have no usual home elsewhere (%)
People in Group quarters - Wards in military hospitals for patients who have no usual home elsewhere (%)
People in Group quarters - Juvenile institutions (%)
People in Group quarters - Long-term care (%)
People in Group quarters - Homes for abused, dependent, and neglected children (%)
People in Group quarters - Residential treatment centers for emotionally disturbed children (%)
People in Group quarters - Training schools for juvenile delinquents (%)
People in Group quarters - Short-term care, detention or diagnostic centers for delinquent children (%)
People in Group quarters - Type of juvenile institution unknown (%)
People in Group quarters - Noninstitutionalized population (%)
People in Group quarters - College dormitories (includes college quarters off campus) (%)
People in Group quarters - Military quarters (%)
People in Group quarters - On base (%)
People in Group quarters - Barracks, unaccompanied personnel housing (UPH), (Enlisted/Officer), ;and similar group living quarters for military personnel (%)
People in Group quarters - Transient quarters for temporary residents (%)
People in Group quarters - Military ships (%)
People in Group quarters - Group homes (%)
People in Group quarters - Homes or halfway houses for drug/alcohol abuse (%)
People in Group quarters - Homes for the mentally ill (%)
People in Group quarters - Homes for the mentally retarded (%)
People in Group quarters - Homes for the physically handicapped (%)
People in Group quarters - Other group homes (%)
People in Group quarters - Religious group quarters (%)
People in Group quarters - Dormitories (%)
People in Group quarters - Agriculture workers' dormitories on farms (%)
People in Group quarters - Job Corps and vocational training facilities (%)
People in Group quarters - Other workers' dormitories (%)
People in Group quarters - Crews of maritime vessels (%)
People in Group quarters - Other nonhousehold living situations (%)
People in Group quarters - Other noninstitutional group quarters (%)
Residents speaking English at home (%)
Residents speaking English at home - Born in the United States (%)
Residents speaking English at home - Native, born elsewhere (%)
Residents speaking English at home - Foreign born (%)
Residents speaking Spanish at home (%)
Residents speaking Spanish at home - Born in the United States (%)
Residents speaking Spanish at home - Native, born elsewhere (%)
Residents speaking Spanish at home - Foreign born (%)
Residents speaking other language at home (%)
Residents speaking other language at home - Born in the United States (%)
Residents speaking other language at home - Native, born elsewhere (%)
Residents speaking other language at home - Foreign born (%)
Class of Workers - Employee of private company (%)
Class of Workers - Self-employed in own incorporated business (%)
Class of Workers - Private not-for-profit wage and salary workers (%)
Class of Workers - Local government workers (%)
Class of Workers - State government workers (%)
Class of Workers - Federal government workers (%)
Class of Workers - Self-employed workers in own not incorporated business and Unpaid family workers (%)
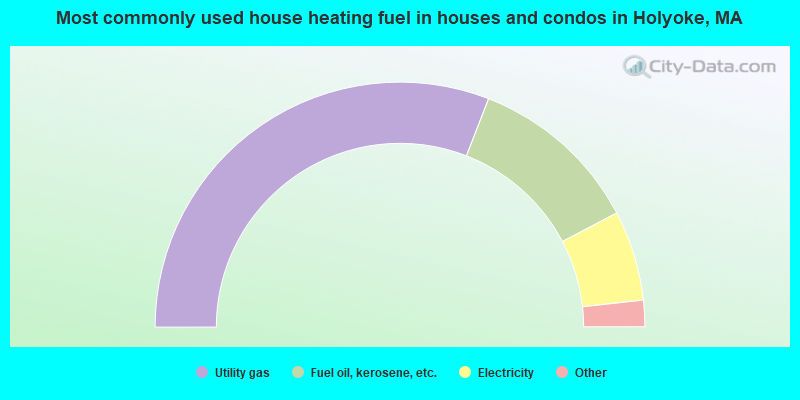
House heating fuel used in houses and condos - Utility gas (%)
House heating fuel used in houses and condos - Bottled, tank, or LP gas (%)
House heating fuel used in houses and condos - Electricity (%)
House heating fuel used in houses and condos - Fuel oil, kerosene, etc. (%)
House heating fuel used in houses and condos - Coal or coke (%)
House heating fuel used in houses and condos - Wood (%)
House heating fuel used in houses and condos - Solar energy (%)
House heating fuel used in houses and condos - Other fuel (%)
House heating fuel used in houses and condos - No fuel used (%)
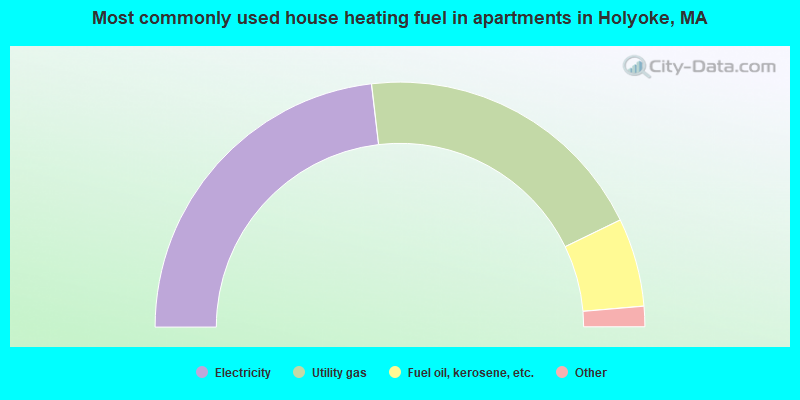
House heating fuel used in apartments - Utility gas (%)
House heating fuel used in apartments - Bottled, tank, or LP gas (%)
House heating fuel used in apartments - Electricity (%)
House heating fuel used in apartments - Fuel oil, kerosene, etc. (%)
House heating fuel used in apartments - Coal or coke (%)
House heating fuel used in apartments - Wood (%)
House heating fuel used in apartments - Solar energy (%)
House heating fuel used in apartments - Other fuel (%)
House heating fuel used in apartments - No fuel used (%)
Armed forces status - In Armed Forces (%)
Armed forces status - Civilian (%)
Armed forces status - Civilian - Veteran (%)
Armed forces status - Civilian - Nonveteran (%)
Fatal accidents locations in years 2005-2021
Fatal accidents locations in 2005
Fatal accidents locations in 2006
Fatal accidents locations in 2007
Fatal accidents locations in 2008
Fatal accidents locations in 2009
Fatal accidents locations in 2010
Fatal accidents locations in 2011
Fatal accidents locations in 2012
Fatal accidents locations in 2013
Fatal accidents locations in 2014
Fatal accidents locations in 2015
Fatal accidents locations in 2016
Fatal accidents locations in 2017
Fatal accidents locations in 2018
Fatal accidents locations in 2019
Fatal accidents locations in 2020
Fatal accidents locations in 2021
Alcohol use - People drinking some alcohol every month (%)
Alcohol use - People not drinking at all (%)
Alcohol use - Average days/month drinking alcohol
Alcohol use - Average drinks/week
Alcohol use - Average days/year people drink much
Audiometry - Average condition of hearing (%)
Audiometry - People that can hear a whisper from across a quiet room (%)
Audiometry - People that can hear normal voice from across a quiet room (%)
Audiometry - Ears ringing, roaring, buzzing (%)
Audiometry - Had a job exposure to loud noise (%)
Audiometry - Had off-work exposure to loud noise (%)
Blood Pressure & Cholesterol - Has high blood pressure (%)
Blood Pressure & Cholesterol - Checking blood pressure at home (%)
Blood Pressure & Cholesterol - Frequently checking blood cholesterol (%)
Blood Pressure & Cholesterol - Has high cholesterol level (%)
Consumer Behavior - Money monthly spent on food at supermarket/grocery store
Consumer Behavior - Money monthly spent on food at other stores
Consumer Behavior - Money monthly spent on eating out
Consumer Behavior - Money monthly spent on carryout/delivered foods
Consumer Behavior - Income spent on food at supermarket/grocery store (%)
Consumer Behavior - Income spent on food at other stores (%)
Consumer Behavior - Income spent on eating out (%)
Consumer Behavior - Income spent on carryout/delivered foods (%)
Current Health Status - General health condition (%)
Current Health Status - Blood donors (%)
Current Health Status - Has blood ever tested for HIV virus (%)
Current Health Status - Left-handed people (%)
Dermatology - People using sunscreen (%)
Diabetes - Diabetics (%)
Diabetes - Had a blood test for high blood sugar (%)
Diabetes - People taking insulin (%)
Diet Behavior & Nutrition - Diet health (%)
Diet Behavior & Nutrition - Milk product consumption (# of products/month)
Diet Behavior & Nutrition - Meals not home prepared (#/week)
Diet Behavior & Nutrition - Meals from fast food or pizza place (#/week)
Diet Behavior & Nutrition - Ready-to-eat foods (#/month)
Diet Behavior & Nutrition - Frozen meals/pizza (#/month)
Drug Use - People that ever used marijuana or hashish (%)
Drug Use - Ever used hard drugs (%)
Drug Use - Ever used any form of cocaine (%)
Drug Use - Ever used heroin (%)
Drug Use - Ever used methamphetamine (%)
Health Insurance - People covered by health insurance (%)
Kidney Conditions-Urology - Avg. # of times urinating at night
Medical Conditions - People with asthma (%)
Medical Conditions - People with anemia (%)
Medical Conditions - People with psoriasis (%)
Medical Conditions - People with overweight (%)
Medical Conditions - Elderly people having difficulties in thinking or remembering (%)
Medical Conditions - People who ever received blood transfusion (%)
Medical Conditions - People having trouble seeing even with glass/contacts (%)
Medical Conditions - People with arthritis (%)
Medical Conditions - People with gout (%)
Medical Conditions - People with congestive heart failure (%)
Medical Conditions - People with coronary heart disease (%)
Medical Conditions - People with angina pectoris (%)
Medical Conditions - People who ever had heart attack (%)
Medical Conditions - People who ever had stroke (%)
Medical Conditions - People with emphysema (%)
Medical Conditions - People with thyroid problem (%)
Medical Conditions - People with chronic bronchitis (%)
Medical Conditions - People with any liver condition (%)
Medical Conditions - People who ever had cancer or malignancy (%)
Mental Health - People who have little interest in doing things (%)
Mental Health - People feeling down, depressed, or hopeless (%)
Mental Health - People who have trouble sleeping or sleeping too much (%)
Mental Health - People feeling tired or having little energy (%)
Mental Health - People with poor appetite or overeating (%)
Mental Health - People feeling bad about themself (%)
Mental Health - People who have trouble concentrating on things (%)
Mental Health - People moving or speaking slowly or too fast (%)
Mental Health - People having thoughts they would be better off dead (%)
Oral Health - Average years since last visit a dentist
Oral Health - People embarrassed because of mouth (%)
Oral Health - People with gum disease (%)
Oral Health - General health of teeth and gums (%)
Oral Health - Average days a week using dental floss/device
Oral Health - Average days a week using mouthwash for dental problem
Oral Health - Average number of teeth
Pesticide Use - Households using pesticides to control insects (%)
Pesticide Use - Households using pesticides to kill weeds (%)
Physical Activity - People doing vigorous-intensity work activities (%)
Physical Activity - People doing moderate-intensity work activities (%)
Physical Activity - People walking or bicycling (%)
Physical Activity - People doing vigorous-intensity recreational activities (%)
Physical Activity - People doing moderate-intensity recreational activities (%)
Physical Activity - Average hours a day doing sedentary activities
Physical Activity - Average hours a day watching TV or videos
Physical Activity - Average hours a day using computer
Physical Functioning - People having limitations keeping them from working (%)
Physical Functioning - People limited in amount of work they can do (%)
Physical Functioning - People that need special equipment to walk (%)
Physical Functioning - People experiencing confusion/memory problems (%)
Physical Functioning - People requiring special healthcare equipment (%)
Prescription Medications - Average number of prescription medicines taking
Preventive Aspirin Use - Adults 40+ taking low-dose aspirin (%)
Reproductive Health - Vaginal deliveries (%)
Reproductive Health - Cesarean deliveries (%)
Reproductive Health - Deliveries resulted in a live birth (%)
Reproductive Health - Pregnancies resulted in a delivery (%)
Reproductive Health - Women breastfeeding newborns (%)
Reproductive Health - Women that had a hysterectomy (%)
Reproductive Health - Women that had both ovaries removed (%)
Reproductive Health - Women that have ever taken birth control pills (%)
Reproductive Health - Women taking birth control pills (%)
Reproductive Health - Women that have ever used Depo-Provera or injectables (%)
Reproductive Health - Women that have ever used female hormones (%)
Sexual Behavior - People 18+ that ever had sex (vaginal, anal, or oral) (%)
Sexual Behavior - Males 18+ that ever had vaginal sex with a woman (%)
Sexual Behavior - Males 18+ that ever performed oral sex on a woman (%)
Sexual Behavior - Males 18+ that ever had anal sex with a woman (%)
Sexual Behavior - Males 18+ that ever had any sex with a man (%)
Sexual Behavior - Females 18+ that ever had vaginal sex with a man (%)
Sexual Behavior - Females 18+ that ever performed oral sex on a man (%)
Sexual Behavior - Females 18+ that ever had anal sex with a man (%)
Sexual Behavior - Females 18+ that ever had any kind of sex with a woman (%)
Sexual Behavior - Average age people first had sex
Sexual Behavior - Average number of female sex partners in lifetime (males 18+)
Sexual Behavior - Average number of female vaginal sex partners in lifetime (males 18+)
Sexual Behavior - Average age people first performed oral sex on a woman (18+)
Sexual Behavior - Average number of woman performed oral sex on in lifetime (18+)
Sexual Behavior - Average number of male sex partners in lifetime (males 18+)
Sexual Behavior - Average number of male anal sex partners in lifetime (males 18+)
Sexual Behavior - Average age people first performed oral sex on a man (18+)
Sexual Behavior - Average number of male oral sex partners in lifetime (18+)
Sexual Behavior - People using protection when performing oral sex (%)
Sexual Behavior - Average number of times people have vaginal or anal sex a year
Sexual Behavior - People having sex without condom (%)
Sexual Behavior - Average number of male sex partners in lifetime (females 18+)
Sexual Behavior - Average number of male vaginal sex partners in lifetime (females 18+)
Sexual Behavior - Average number of female sex partners in lifetime (females 18+)
Sexual Behavior - Circumcised males 18+ (%)
Sleep Disorders - Average hours sleeping at night
Sleep Disorders - People that has trouble sleeping (%)
Smoking-Cigarette Use - People smoking cigarettes (%)
Taste & Smell - People 40+ having problems with smell (%)
Taste & Smell - People 40+ having problems with taste (%)
Taste & Smell - People 40+ that ever had wisdom teeth removed (%)
Taste & Smell - People 40+ that ever had tonsils teeth removed (%)
Taste & Smell - People 40+ that ever had a loss of consciousness because of a head injury (%)
Taste & Smell - People 40+ that ever had a broken nose or other serious injury to face or skull (%)
Taste & Smell - People 40+ that ever had two or more sinus infections (%)
Weight - Average height (inches)
Weight - Average weight (pounds)
Weight - Average BMI
Weight - People that are obese (%)
Weight - People that ever were obese (%)
Weight - People trying to lose weight (%)
Officers per 1,000 residents here:
2.65Massachusetts average:
2.53
Latest news from Holyoke, MA collected exclusively by city-data.com from local newspapers, TV, and radio stations
Ancestries: American (11.8%), Irish (7.9%), Polish (2.9%), French Canadian (2.7%), French (1.7%), Italian (1.4%).
Current Local Time:
Land area: 21.3 square miles.
Population density: 1,772 people per square mile (low).
2,161 residents are foreign born (2.6% Latin America , 1.5% Europe , 0.6% Asia ).
This city:
5.7%Massachusetts:
17.6%
Median real estate property taxes paid for housing units with mortgages in 2022: $3,818 (1.5%)Median real estate property taxes paid for housing units with no mortgage in 2022: $3,949 (1.5%)
Nearest city with pop. 50,000+: Chicopee, MA
Nearest city with pop. 200,000+: Boston, MA
Nearest city with pop. 1,000,000+: Bronx, NY
Nearest cities:
Latitude: 42.20 N, Longitude: 72.62 W
Nickname or alias (official or unofficial): Paper City
Daytime population change due to commuting: +6,731 (+17.8%)Workers who live and work in this city: 6,445 (43.1%)
Holyoke tourist attractions:
Single-family new house construction building permits:
2022: 3 buildings , average cost: $270,0002020: 3 buildings , average cost: $159,7002019: 4 buildings , average cost: $336,5002018: 5 buildings , average cost: $301,2002017: 1 building , cost: $142,0002016: 3 buildings , average cost: $204,1002015: 2 buildings , average cost: $227,5002014: 2 buildings , average cost: $225,0002013: 7 buildings , average cost: $190,0002012: 11 buildings , average cost: $200,0002011: 3 buildings , average cost: $190,5002010: 4 buildings , average cost: $190,5002009: 8 buildings , average cost: $171,5002008: 7 buildings , average cost: $217,3002007: 5 buildings , average cost: $192,3002006: 13 buildings , average cost: $142,8002005: 28 buildings , average cost: $162,1002004: 43 buildings , average cost: $172,3002003: 48 buildings , average cost: $153,5002002: 32 buildings , average cost: $136,0002001: 8 buildings , average cost: $154,3002000: 6 buildings , average cost: $139,7001999: 12 buildings , average cost: $100,1001998: 9 buildings , average cost: $90,4001997: 8 buildings , average cost: $103,300Unemployment in December 2023: Here:
5.4%Massachusetts:
3.5%
Most common occupations in Holyoke, MA (%)
Both Males Females
Other production occupations, including supervisors (6.5%)
Material recording, scheduling, dispatching, and distributing workers (4.0%)
Preschool, kindergarten, elementary, and middle school teachers (3.9%)
Other office and administrative support workers, including supervisors (3.4%)
Building and grounds cleaning and maintenance occupations (3.3%)
Other management occupations, except farmers and farm managers (3.1%)
Nursing, psychiatric, and home health aides (2.9%)
Other production occupations, including supervisors (8.1%)
Material recording, scheduling, dispatching, and distributing workers (5.1%)
Metal workers and plastic workers (4.9%)
Electrical equipment mechanics and other installation, maintenance, and repair workers, including supervisors (4.8%)
Building and grounds cleaning and maintenance occupations (4.7%)
Laborers and material movers, hand (3.7%)
Other sales and related occupations, including supervisors (3.5%)
Preschool, kindergarten, elementary, and middle school teachers (6.3%)
Other office and administrative support workers, including supervisors (5.7%)
Other production occupations, including supervisors (5.0%)
Registered nurses (4.9%)
Secretaries and administrative assistants (4.9%)
Nursing, psychiatric, and home health aides (4.8%)
Cashiers (3.9%)
Tornado activity:
Holyoke-area historical tornado activity is above Massachusetts state average. It is 8% smaller than the overall U.S. average.
On 10/3/1979, a category F4 (max. wind speeds 207-260 mph) tornado 11.3 miles away from the Holyoke city center killed 3 people and injured 500 people and caused between $50,000,000 and $500,000,000 in damages.
On 5/29/1995, a category F4 tornado 28.1 miles away from the city center killed 3 people and injured 24 people and caused between $5,000,000 and $50,000,000 in damages.
Earthquake activity:
Holyoke-area historical earthquake activity is significantly above Massachusetts state average. It is 70% smaller than the overall U.S. average. On 10/7/1983 at 10:18:46, a magnitude 5.3 (5.1 MB, 5.3 LG, 5.1 ML, Class: Moderate, Intensity: VI - VII) earthquake occurred 148.9 miles away from the city center On 4/20/2002 at 10:50:47, a magnitude 5.3 (5.3 ML, Depth: 3.0 mi) earthquake occurred 168.6 miles away from Holyoke center On 4/20/2002 at 10:50:47, a magnitude 5.2 (5.2 MB, 4.2 MS, 5.2 MW, 5.0 MW) earthquake occurred 167.3 miles away from Holyoke center On 1/19/1982 at 00:14:42, a magnitude 4.7 (4.5 MB, 4.7 MD, 4.5 LG, Class: Light, Intensity: IV - V) earthquake occurred 103.6 miles away from Holyoke center On 10/16/2012 at 23:12:25, a magnitude 4.7 (4.7 ML, Depth: 10.0 mi) earthquake occurred 138.7 miles away from Holyoke center On 8/23/2011 at 17:51:04, a magnitude 5.8 (5.8 MW, Depth: 3.7 mi) earthquake occurred 408.8 miles away from Holyoke center Magnitude types: regional Lg-wave magnitude (LG), body-wave magnitude (MB), duration magnitude (MD), local magnitude (ML), surface-wave magnitude (MS), moment magnitude (MW) Natural disasters: The number of natural disasters in Hampden County (22) is greater than the US average (15).Major Disasters (Presidential) Declared: 12Emergencies Declared: 9Storms: 6, Floods: 5, Hurricanes: 5, Snowstorms: 4, Winter Storms: 4, Blizzards: 2, Snows: 2, Snowfall: 1, Tornado: 1, Tropical Storm: 1, Wind: 1, Other: 1 (Note: some incidents may be assigned to more than one category). Hospitals in Holyoke: HOLYOKE MEDICAL CENTER (Voluntary non-profit - Private, provides emergency services, 575 BEECH STREET) HOSPICE LIFE CARE (113 HAMPTON STREET) PROVIDENCE HOSPITAL INC,THE (1233 MAIN ST) SOLDIERS HOME OF HOLYOKE (CHERRY STREET) Home Health Centers in Holyoke: HOLYOKE VISITING NURSE ASSOC (113 HAMPDEN STREET) PROVIDENCE HOMECARE (1236 MAIN STREET SUITE 101) Nursing Homes in Holyoke: HOLYOKE GERIATRIC AND CONVALESCENT CENTER (45 LOWER WESTFIELD ROAD) HOLYOKE HEALTH CARE CENTER (282 CABOT STREET) HOLYOKE NURSING HOME, INC (1913 NORTHAMPTON STREET) HOLYOKE REHABILITATION CENTER (260 EASTHAMPTON ROAD) LOOMIS HOUSE NURSING CENTER (298 JARVIS AVENUE) MARY'S MEADOW AT PROVIDENCE PLACE (12 GAMELIN STREET) MONT MARIE HEALTH CARE CENTER (36 LOWER WESTFIELD ROAD) MOUNT SAINT VINCENT CARE CENTER (35 HOLY FAMILY ROAD) OAK MANOR NURSING HOME (19 QUIRK AVENUE) RENAISSANCE MANOR ON CABOT (279 CABOT STREET) Heliports located in Holyoke: Amtrak stations near Holyoke: 7 miles: SPRINGFIELD (66 LYMAN ST.) Services: ticket office, partially wheelchair accessible, enclosed waiting area, public restrooms, public payphones, full-service food facilities, snack bar, vending machines, ATM, paid short-term parking, paid long-term parking, call for car rental service, taxi stand, intercity bus service, public transit connection.
14 miles: AMHERST (RAILROAD ST.) Services: enclosed waiting area, public payphones, free short-term parking, paid long-term parking, call for car rental service, call for taxi service, public transit connection.
20 miles: WINDSOR LOCKS (S. MAIN ST. (RTE. 159)) Services: public payphones, free short-term parking, free long-term parking, call for car rental service, call for taxi service, public transit connection.
College/University in Holyoke: Holyoke Community College Full-time enrollment: 4,911; Location: 303 Homestead Ave; Public; Website: www.hcc.edu)
Other colleges/universities with over 2000 students near Holyoke:
Mount Holyoke College (about 5 miles; South Hadley, MA ; Full-time enrollment: 2,573)
Springfield Technical Community College (about 7 miles; Springfield, MA ; FT enrollment: 4,750)
American International College (about 8 miles; Springfield, MA ; FT enrollment: 2,733)
Springfield College (about 8 miles; Springfield, MA ; FT enrollment: 3,144)
Smith College (about 8 miles; Northampton, MA ; FT enrollment: 3,549)
Western New England University (about 9 miles; Springfield, MA ; FT enrollment: 3,477)
Westfield State University (about 11 miles; Westfield, MA ; FT enrollment: 5,548)
Public high schools in Holyoke: HOLYOKE HIGH Students: 1,241, Location: 500 BEECH STREET, Grades: 9-12)WM J DEAN VOCATIONAL TECHNICAL HIGH Students: 771, Location: 1045 MAIN STREET, Grades: 9-12)PAULO FREIRE SOCIAL JUSTICE CHARTER SCHOOL Location: 161 LOWER WESTFIELD ROAD, Grades: 9-11, Charter school )
EARLY COLLEGE HIGH SCHOOL Location: 303 HOMESTEAD AVENUE, Grades: 11-12)
GATEWAY TO COLLEGE AT HOLYOKE COMMUNITY COLLEGE Location: 303 HOMESTEAD AVENUE, Grades: 10-12)
Private high schools in Holyoke: CENTER SCHOOL Students: 90, Location: 1913 NORTHHAMPTON ST, Grades: UG-12)
NEW ENGLAND ADOLESCENT RESEARCH INSTITUTE Students: 42, Location: 70 N SUMMER ST, Grades: 3-12)
RFKCAC EXPERIMENT WITH TRAVEL SCHOOL Students: 20, Location: 15 PAPINEAU ST, Grades: 7-12)
SPRINGDALE EDUCATION CENTER Students: 16, Location: 317 MAPLE ST STE 2, Grades: UG-12)
Public elementary/middle schools in Holyoke: HOLYOKE COMMUNITY CHARTER SCHOOL Students: 694, Location: 2200 NORTHAMPTON ST, Grades: KG-8, Charter school )LT CLAYRE SULLIVAN ELEMENTARY Students: 636, Location: 400 JARVIS AVENUE, Grades: KG-8)MAURICE A DONAHUE ELEMENTARY Students: 548, Location: 210 WHITING FARMS ROAD, Grades: KG-8)H.B. LAWRENCE SCHOOL Students: 469, Location: 156 CABOT STREET, Grades: KG-3)E N WHITE ELEMENTARY Students: 460, Location: 1 JEFFERSON STREET, Grades: KG-8)KELLY ELEMENTARY Students: 459, Location: 216 WEST STREET, Grades: KG-8)LT ELMER J MCMAHON ELEMENTARY Students: 317, Location: 75 KANE RD, Grades: KG-8)MORGAN FULL SERVICE COMMUNITY SCHOOL Location: 596 SOUTH BRIDGE STREET, Grades: PK-8)
WILLIAM R. PECK SCHOOL Location: 1916 NORTHAMPTON STREET, Grades: 4-8)
Private elementary/middle schools in Holyoke: BLESSED SACRAMENT ELEMENTARY SCHOOL Students: 291, Location: 21 WESTFIELD RD, Grades: PK-8)
MATER DOLOROSA ELEMENTARY SCHOOL Students: 251, Location: 25 MAPLE ST, Grades: PK-8)
FIRST LUTHERAN SCHOOL Students: 97, Location: 1810 NORTHAMPTON ST, Grades: PK-8)
See full list of schools located in Holyoke Library in Holyoke: HOLYOKE PUBLIC LIBRARY Operating income: $746,334; Location: 335 MAPLE ST.; 66,613 books ; 930 e-books ; 3,827 audio materials ; 7,101 video materials ; 12 local licensed databases ; 30 state licensed databases ; 119 print serial subscriptions )
User-submitted facts and corrections:
Holyoke Catholic is now located in Granby, MA
Notable locations in Holyoke: (A) , Ward 1 Pool (B) , Ward 2 Pool (C) , Ward 4 Pool (D) , Holyoke Country Club (E) , Holyoke Mini-Mall (F) , Hampden Plaza (G) , Holyoke Heights Plaza (H) , Wyckoff Park Country Clubv (I) , Holyoke Fire Department Station 5 (J) , Holyoke Fire Department Station 6 (K) , Holyoke Fire Department Station 3 (L) , Holyoke Fire Department Station 1 Headquarters (M) , Holyoke Community College Library (N) , Holyoke Public Library (O) , Wistariahurst Museum (P) , YMCA (Q) . Display/hide their locations on the map
Shopping Centers: (1) , Holyoke Heights Plaza Shopping Center (2) , Holyoke Mall at Ingleside Shopping Center (3) , Holyoke Mall Shopping Center (4) , Lincoln Plaza Shopping Center (5) , South Street Mall Shopping Center (6) , Stop and Shop Plaza Shopping Center (7) , Holyoke Shopping Center (8) , Holyoke Mall at Ingleside (9) . Display/hide their locations on the map
Churches in Holyoke include: (A) , True Deliverance Church of God (B) , Salvation Army (C) , Saint Peters Lutheran Church (D) , Saint Pauls Episcopal Church (E) , Presbyterian First Church (F) , Missionary Church (G) , First Lutheran Church (H) , First Baptist Church (I) . Display/hide their locations on the map
Cemeteries: (1) , Forestdale Cemetery West (2) , Saint Jerome Cemetery (3) , Forestdale Cemetery (4) , Calvary Cemetery (5) . Display/hide their locations on the map
Lakes and reservoirs: (A) , Snake Pond (B) , High Service Reservoir (C) , Lake Bray (D) , Cedar Pond (E) , Connor Reservoir (F) , McLean Reservoir (G) , Wright Cutoff (H) . Display/hide their locations on the map
Streams, rivers, and creeks: (A) . Display/hide its location on the map
Parks in Holyoke include: (1) , McNulty Park (2) , Hampden Park (3) , Riverside P (4) , Prospect Park (5) , Mount Tom State Reservation (6) , Jones Park (7) , Elmwood Park (8) , Holyoke Heritage State Park (9) . Display/hide their locations on the map
Tourist attractions: (1) , Pioneer Valley Amusement (Amusement & Theme Parks; 108 Cabot Street) (2) , Namco Cyber Station (Amusement & Theme Parks; 50 Holyoke Street) (3) . Display/hide their approximate locations on the map
Hotels: (1) , Homewood Suites (375 Whitney Avenue) (2) , Hotel-A-Copy Holiday Inn (245 Whiting Farms Road) (3) , Economy Inn (671 Northampton Street) (4) , Holiday Inn Holyoke (245 Whiting Farms Road) (5) , Holiday Inn Holidome & Conference Center (245 Whiting Farms Road) (6) . Display/hide their approximate locations on the map
Courts: (1) , Honor Court (380 High) (2) , District Court (20 Newton Street) (3) . Display/hide their approximate locations on the map
Birthplace of: Bob Goodlatte - Politician, Jack Buck - Recipient of the Purple Heart medal, Arthur Adams (comics) - Comic book artist and writer, Adam Pineault - Ice hockey player, Tommy Dowd (baseball) - Major League Baseball player, Billy Mitchell (electronic sports player) - Electronic sports player, Tommy Tucker (baseball) - Baseball player, Hal Blaine - Drummer, David E. Sweet - College president, Homer E. Newell, Jr. - Mathematician.
Hampden County has a predicted average indoor radon screening level between 2 and 4 pCi/L (pico curies per liter) - Moderate Potential Drinking water stations with addresses in Holyoke that have no violations reported:
HOLYOKE WATER WORKS (Population served: 39,905, Primary Water Source Type: Surface water)
Average household size: This city:
2.5 peopleMassachusetts:
2.5 people
Percentage of family households: This city:
60.7%Whole state:
63.0%
Percentage of households with unmarried partners: This city:
10.6%Whole state:
7.0%
Likely homosexual households (counted as self-reported same-sex unmarried-partner households)
Lesbian couples: 0.9% of all households Gay men: 0.4% of all households
People in group quarters in Holyoke in 2010:
934 people in nursing facilities/skilled-nursing facilities
173 people in other noninstitutional facilities
104 people in mental (psychiatric) hospitals and psychiatric units in other hospitals
72 people in residential treatment centers for adults
48 people in group homes for juveniles (non-correctional)
31 people in group homes intended for adults
23 people in emergency and transitional shelters (with sleeping facilities) for people experiencing homelessness
People in group quarters in Holyoke in 2000:
1,180 people in nursing homes
145 people in other noninstitutional group quarters
32 people in religious group quarters
10 people in other nonhousehold living situations
6 people in homes for abused, dependent, and neglected children
6 people in homes for the mentally retarded
2 people in hospitals or wards for drug/alcohol abuse
Banks with branches in Holyoke (2011 data):
PeoplesBank: Peoplesbank, Hampden Street Branch, South Street Branch. Info updated 2007/02/12: Bank assets: $1,653.1 mil, Deposits: $1,224.2 mil, local headquarters , positive income , Commercial Lending Specialization, 18 total offices , Holding Company: Peoplesbancorp, Mhc
Bank of America, National Association: Highland Branch at 40 Lincoln Street, branch established on 1958/06/04; Holyoke Ingleside Mall Branch at 50 Holyoke Street, branch established on 1996/08/26. Info updated 2009/11/18: Bank assets: $1,451,969.3 mil, Deposits: $1,077,176.8 mil, headquarters in Charlotte, NC, positive income , 5782 total offices , Holding Company: Bank Of America Corporation
RBS Citizens, National Association: Holyoke Stop & Shop Branch at 28 Lincoln Street, branch established on 2001/08/23; Holyoke Stop & Shop Notha at 2265 Northampton Street, branch established on 2001/12/16. Info updated 2007/09/19: Bank assets: $106,940.6 mil, Deposits: $75,690.2 mil, headquarters in Providence, RI, positive income , 1135 total offices , Holding Company: Uk Financial Investments Limited
People's United Bank: Holyoke Branch at 1515 Northampton Street, branch established on 1995/06/26. Info updated 2012/02/16: Bank assets: $27,319.3 mil, Deposits: $20,835.4 mil, headquarters in Bridgeport, CT, positive income , Commercial Lending Specialization, 374 total offices
TD Bank, National Association: Ingelside Mall Branch at 50 Holyoke St., branch established on 1981/01/02. Info updated 2010/10/04: Bank assets: $188,912.6 mil, Deposits: $153,149.8 mil, headquarters in Wilmington, DE, positive income , 1314 total offices , Holding Company: Toronto-Dominion Bank, The
First Niagara Bank, National Association: Holyoke Branch at 378 High Street, branch established on 1892/01/01. Info updated 2011/06/09: Bank assets: $32,750.6 mil, Deposits: $19,595.4 mil, headquarters in Buffalo, NY, positive income , Commercial Lending Specialization, 351 total offices , Holding Company: First Niagara Financial Group, Inc.
United Bank: City Branch at 1830 Northampton Street, branch established on 1889/01/01. Info updated 2012/01/20: Bank assets: $1,617.9 mil, Deposits: $1,235.2 mil, headquarters in West Springfield, MA, positive income , Commercial Lending Specialization, 25 total offices
Westfield Bank: Northampton Street Branch at 1642 Northampton Street, branch established on 2001/06/18. Info updated 2011/07/21: Bank assets: $1,259.3 mil, Deposits: $733.6 mil, headquarters in Westfield, MA, positive income , Commercial Lending Specialization, 12 total offices
For population 15 years and over in Holyoke:
Never married: 51.2%Now married: 32.0%Separated: 2.3%Widowed: 5.8%Divorced: 8.7% For population 25 years and over in Holyoke:
High school or higher: 78.8%Bachelor's degree or higher: 22.2%Graduate or professional degree: 8.2%Unemployed: 6.7%Mean travel time to work (commute): 17.7 minutes
Education Gini index (Inequality in education) Here:
14.4Massachusetts average:
13.0
Religion statistics for Holyoke, MA (based on Hampden County data)
Religion Adherents Congregations Catholic 223,685 65 Mainline Protestant 21,962 88 Evangelical Protestant 19,438 114 Other 9,140 31 Orthodox 3,406 10 Black Protestant 2,491 16 None 183,368 -
Source: Clifford Grammich, Kirk Hadaway, Richard Houseal, Dale E.Jones, Alexei Krindatch, Richie Stanley and Richard H.Taylor. 2012. 2010 U.S.Religion Census: Religious Congregations & Membership Study. Association of Statisticians of American Religious Bodies. Jones, Dale E., et al. 2002. Congregations and Membership in the United States 2000. Nashville, TN: Glenmary Research Center. Graphs represent county-level data
Food Environment Statistics: Number of grocery stores : 90Here :
1.95 / 10,000 pop.Massachusetts :
1.98 / 10,000 pop.
Number of supercenters and club stores : 2Hampden County :
0.04 / 10,000 pop.State :
0.05 / 10,000 pop.
Number of convenience stores (no gas) : 86This county :
1.87 / 10,000 pop.Massachusetts :
2.22 / 10,000 pop.
Number of convenience stores (with gas) : 112Hampden County :
2.43 / 10,000 pop.Massachusetts :
1.77 / 10,000 pop.
Number of full-service restaurants : 335Hampden County :
7.27 / 10,000 pop.Massachusetts :
8.76 / 10,000 pop.
Adult diabetes rate : Hampden County :
9.2%State :
8.1%
Adult obesity rate : This county :
25.9%Massachusetts :
22.5%
Low-income preschool obesity rate : Hampden County :
16.2%State :
16.5%
Health and Nutrition: Healthy diet rate : Holyoke:
48.1%Massachusetts:
50.5%
Average overall health of teeth and gums : Holyoke:
46.4%Massachusetts:
48.0%
Average BMI : This city:
28.5Massachusetts:
28.4
People feeling badly about themselves : This city:
21.7%State:
20.7%
People not drinking alcohol at all : Holyoke:
10.9%Massachusetts:
10.4%
Average hours sleeping at night : Overweight people : This city:
33.5%Massachusetts:
33.4%
General health condition : Holyoke:
54.7%Massachusetts:
57.1%
Average condition of hearing : Holyoke:
79.1%Massachusetts:
79.2%
More about Health and Nutrition of Holyoke, MA Residents
Local government employment and payroll (March 2022)
Function
Full-time employees
Monthly full-time payroll
Average yearly full-time wage
Part-time employees
Monthly part-time payroll
Elementary and Secondary - Instruction
665 $4,135,427 $74,624 326 $185,710 Elementary and Secondary - Other Total
187 $1,067,000 $68,471 125 $109,749 Police Protection - Officers
91 $842,918 $111,154 0 $0 Firefighters
80 $499,738 $74,961 0 $0 Electric Power
70 $567,365 $97,263 0 $0 Gas Supply
33 $289,335 $105,213 0 $0 Streets and Highways
26 $126,216 $58,254 0 $0 Water Supply
20 $105,512 $63,307 0 $0 Other Government Administration
16 $82,186 $61,640 7 $7,960 Financial Administration
14 $70,542 $60,465 1 $967 Police - Other
12 $51,790 $51,790 5 $9,592 Solid Waste Management
10 $43,835 $52,602 0 $0 Other and Unallocable
10 $31,035 $37,242 1 $1,102 Parks and Recreation
8 $31,832 $47,748 11 $4,291 Health
8 $32,806 $49,209 0 $0 Fire - Other
7 $39,764 $68,167 0 $0 Welfare
7 $22,723 $38,954 5 $13,055 Local Libraries
7 $27,233 $46,685 5 $5,299 Housing and Community Development (Local)
5 $28,077 $67,385 1 $1,839 Judicial and Legal
3 $17,822 $71,288 1 $3,436 Sewerage
1 $6,940 $83,280 0 $0 Natural Resources
1 $8,725 $104,700 0 $0
Totals for Government
1,281 $8,128,821 $76,148 488 $343,000
Holyoke government finances - Expenditure in 2021 (per resident):
Construction - Sewerage: $3,525,000 ($93.45)
Electric Utilities: $3,504,000 ($92.90)Gas Utilities: $2,696,000 ($71.47)Current Operations - Elementary and Secondary Education: $111,174,000 ($2947.35)
Electric Utilities: $37,220,000 ($986.74)General - Other: $23,217,000 ($615.51)Gas Utilities: $17,641,000 ($467.68)Police Protection: $12,229,000 ($324.20)Local Fire Protection: $9,326,000 ($247.24)Sewerage: $6,863,000 ($181.95)Water Utilities: $6,653,000 ($176.38)Regular Highways: $6,003,000 ($159.15)Solid Waste Management: $1,666,000 ($44.17)Housing and Community Development: $1,574,000 ($41.73)Financial Administration: $993,000 ($26.33)Central Staff Services: $860,000 ($22.80)Parks and Recreation: $742,000 ($19.67)Health - Other: $671,000 ($17.79)Protective Inspection and Regulation - Other: $648,000 ($17.18)Libraries: $569,000 ($15.08)Public Welfare - Other: $437,000 ($11.59)Judicial and Legal Services: $423,000 ($11.21)Parking Facilities: $119,000 ($3.15)General Public Buildings: $110,000 ($2.92)Natural Resources - Other: $74,000 ($1.96)Electric Utilities - Interest on Debt: $931,000 ($24.68)
General - Interest on Debt: $2,026,000 ($53.71)
Intergovernmental to Local - Other - Elementary and Secondary Education: $5,204,000 ($137.96)
Other - Health - Other: $9,000 ($0.24)Intergovernmental to State - Transit Utilities: $885,000 ($23.46)
General - Other: $84,000 ($2.23)Other Capital Outlay - Elementary and Secondary Education: $2,202,000 ($58.38)
General - Other: $2,119,000 ($56.18)Police Protection: $175,000 ($4.64)Total Salaries and Wages: $58,570,000 ($1552.76)
Water Utilities - Interest on Debt: $87,000 ($2.31)
Holyoke government finances - Revenue in 2021 (per resident):
Charges - Sewerage: $10,088,000 ($267.44)
Elementary and Secondary Education School Lunch: $2,349,000 ($62.27)Other: $2,337,000 ($61.96)Regular Highways: $13,000 ($0.34)Parking Facilities: $11,000 ($0.29)Federal Intergovernmental - Other: $3,575,000 ($94.78)
Housing and Community Development: $1,680,000 ($44.54)Education: $1,605,000 ($42.55)Local Intergovernmental - Education: $1,093,000 ($28.98)
Miscellaneous - Interest Earnings: $13,143,000 ($348.44)
Donations From Private Sources: $1,409,000 ($37.35)General Revenue - Other: $1,139,000 ($30.20)Revenue - Electric Utilities: $50,049,000 ($1326.86)
Gas Utilities: $20,372,000 ($540.08)Water Utilities: $6,876,000 ($182.29)State Intergovernmental - Education: $102,996,000 ($2730.54)
General Local Government Support: $12,458,000 ($330.28)Other: $3,565,000 ($94.51)Highways: $3,528,000 ($93.53)Public Welfare: $258,000 ($6.84)Tax - Property: $59,491,000 ($1577.17)
Other Selective Sales: $1,603,000 ($42.50)Other License: $590,000 ($15.64)
Holyoke government finances - Debt in 2021 (per resident):
Long Term Debt - Beginning Outstanding - Unspecified Public Purpose: $78,980,000 ($2093.85)
Outstanding Unspecified Public Purpose: $73,108,000 ($1938.18)Retired Unspecified Public Purpose: $5,872,000 ($155.67)Short Term Debt Outstanding - End of Fiscal Year: $8,751,000 ($232.00)
Beginning: $6,230,000 ($165.16)
Holyoke government finances - Cash and Securities in 2021 (per resident):
Other Funds - Cash and Securities: $158,445,000 ($4200.56)
3.64% of this county's 2021 resident taxpayers lived in other counties in 2020 ($58,474 average adjusted gross income )
Here:
3.64%Massachusetts average:
6.35%
0.02% of residents moved from foreign countries ($105 average AGI )Hampden County:
0.02%Massachusetts average:
0.01%
Top counties from which taxpayers relocated into this county between 2020 and 2021:
4.26% of this county's 2020 resident taxpayers moved to other counties in 2021 ($66,146 average adjusted gross income )
Here:
4.26%Massachusetts average:
7.18%
0.03% of residents moved to foreign countries ($223 average AGI )Hampden County:
0.03%Massachusetts average:
0.02%
Top counties to which taxpayers relocated from this county between 2020 and 2021:
Businesses in Holyoke, MA
Name Count Name Count
7-Eleven 1 JCPenney 1 ALDO 1 Jones New York 1 AT&T 2 Journeys 1 Abercrombie & Fitch 1 KFC 1 Abercrombie Kids 1 Kmart 1 Advance Auto Parts 1 Lane Bryant 1 Aeropostale 1 Lane Furniture 1 American Eagle Outfitters 1 LensCrafters 1 Ann Taylor 1 Macy's 1 Apple Store 1 McDonald's 3 AutoZone 1 Men's Wearhouse 1 Bakers 1 Motherhood Maternity 2 Banana Republic 1 New Balance 1 Barnes & Noble 1 New York & Co 1 Bath & Body Works 1 Nike 6 Bed Bath & Beyond 1 Old Navy 1 Brookstone 1 Pac Sun 1 Burger King 1 Payless 1 Burlington Coat Factory 1 Pier 1 Imports 1 CVS 2 Pottery Barn 1 Cache 1 RadioShack 1 Charlotte Russe 1 Red Robin 1 Clarks 1 Rite Aid 1 Coldwater Creek 1 Ruby Tuesday 1 Cracker Barrel 1 Sears 3 Dairy Queen 1 Sephora 1 Deb 1 Spencer Gifts 1 Dennys 1 Sprint Nextel 1 Domino's Pizza 1 Starbucks 1 Dunkin Donuts 2 Stop & Shop 2 Express 1 Subway 4 FedEx 6 T-Mobile 1 Finish Line 1 Taco Bell 1 Foot Locker 1 Target 1 Ford 1 Toys"R"Us 2 Forever 21 1 True Value 2 Fredericks Of Hollywood 1 U-Haul 1 GNC 2 UPS 6 GameStop 1 Vans 4 Gap 1 Verizon Wireless 2 H&M 1 Victoria's Secret 1 H&R Block 3 Walgreens 1 Holiday Inn 1 Wendy's 1 Hollister Co. 1 Wet Seal 1 Hot Topic 1 YMCA 1 Hyundai 1
Strongest AM radio stations in Holyoke:
WNNZ (640 AM; 50 kW; WESTFIELD, MA; Owner: CLEAR CHANNEL BROADCASTING LICENSES, INC.)
WACE (730 AM; 5 kW; CHICOPEE, MA; Owner: CARTER BROADCASTING CORP.)
WHYN (560 AM; 5 kW; SPRINGFIELD, MA; Owner: CLEAR CHANNEL BROADCASTING LICENSES, INC.)
WSPR (1270 AM; 5 kW; SPRINGFIELD, MA; Owner: ANTONIO F. AND HELENA R. GOIS, TENANTS BY THE ENTIRETY)
WTIC (1080 AM; 50 kW; HARTFORD, CT; Owner: INFINITY RADIO OPERATIONS INC.)
WCRN (830 AM; 50 kW; WORCESTER, MA; Owner: CARTER BROADCASTING CORPORATION)
WVNE (760 AM; daytime; 25 kW; LEICESTER, MA; Owner: BLOUNT MASSCOM, INC.)
WPNI (1430 AM; 5 kW; AMHERST, MA; Owner: WESTERN MASSACHUSETTS RADIO COMPANY)
WMAS (1450 AM; 1 kW; SPRINGFIELD, MA; Owner: LAPPIN COMMUNICATIONS, INC.)
WALE (990 AM; 50 kW; GREENVILLE, RI; Owner: NORTH AMERICAN BROADCASTING CO., INC.)
WHNP (1600 AM; 2 kW; EAST LONGMEADOW, MA; Owner: SAGA COMMUNICATIONS OF NEW ENGLAND, LLC)
WACM (1490 AM; 1 kW; WEST SPRINGFIELD, MA; Owner: ANTONIO F. GOIS)
WRKO (680 AM; 50 kW; BOSTON, MA; Owner: ENTERCOM BOSTON LICENSE, LLC)
Strongest FM radio stations in Holyoke:
WCCH (103.5 FM; HOLYOKE, MA; Owner: HOLYOKE COMMUNITY COLLEGE)
WHYN-FM (93.1 FM; SPRINGFIELD, MA; Owner: CLEAR CHANNEL BROADCASTING LICENSES, INC.)
WRNX (100.9 FM; AMHERST, MA; Owner: WESTERN MASSACHUSETTS RADIO COMPANY)
WAQY (102.1 FM; SPRINGFIELD, MA; Owner: SAGA COMMUNICATIONS OF NEW ENGLAND, LLC)
WPKX (97.9 FM; ENFIELD, CT; Owner: CAPSTAR TX LIMITED PARTNERSHIP)
WFCR (88.5 FM; AMHERST, MA; Owner: UNIVERSITY OF MASSACHUSETTS)
WAMH (89.3 FM; AMHERST, MA; Owner: TRUSTEES OF AMHERST COLLEGE)
W246AM (97.1 FM; AMHERST, MA; Owner: GREAT NORTHERN RADIO, LLC)
WMAS-FM (94.7 FM; SPRINGFIELD, MA; Owner: LAPPIN COMMUNICATIONS, INC.)
WLZX (99.3 FM; NORTHAMPTON, MA; Owner: SAGA COMMUNICATIONS OF NEW ENGLAND, LLC)
WAMC-FM (90.3 FM; ALBANY, NY; Owner: WAMC)
WRCH (100.5 FM; NEW BRITAIN, CT; Owner: INFINITY RADIO OPERATIONS INC.)
WEIB (106.3 FM; NORTHAMPTON, MA; Owner: CUTTING EDGE BROADCASTING, INC.)
WAAF (107.3 FM; WORCESTER, MA; Owner: ENTERCOM BOSTON LICENSE, LLC)
WTIC-FM (96.5 FM; HARTFORD, CT; Owner: INFINITY RADIO OPERATIONS INC.)
WWUH (91.3 FM; WEST HARTFORD, CT; Owner: UNIVERSITY OF HARTFORD)
WCCC-FM (106.9 FM; HARTFORD, CT; Owner: MARLIN BROADCASTING, LLC)
WVAY (100.7 FM; WILMINGTON, VT; Owner: GREAT NORTHERN RADIO, L.L.C.)
WPVQ (95.3 FM; GREENFIELD, MA; Owner: GREAT NORTHERN RADIO, L.L.C.)
WTCC (90.7 FM; SPRINGFIELD, MA; Owner: SPRINGFIELD TECH. COMM. COLLEGE)
TV broadcast stations around Holyoke:
WGBY-TV (Channel 57; SPRINGFIELD, MA; Owner: WGBH EDUCATIONAL FOUNDATION)
WGGB-TV (Channel 40; SPRINGFIELD, MA; Owner: WGGB LICENSEE, LLC)
W67DF (Channel 67; SPRINGFIELD, MA; Owner: TRINITY BROADCASTING NETWORK)
WWLP (Channel 22; SPRINGFIELD, MA; Owner: WWLP BROADCASTING, LLC)
WYDN (Channel 48; WORCESTER, MA; Owner: EDUCATIONAL PUBLIC TV CORPORATION)
WTIC-TV (Channel 61; HARTFORD, CT; Owner: TRIBUNE TELEVISION COMPANY)
W11BJ (Channel 11; HARTFORD, CT; Owner: COMMUNICATIONS SITE MANAGEMENT LLC)
WUVN (Channel 18; HARTFORD, CT; Owner: ENTRAVISION HOLDINGS, LLC)
WTXX (Channel 20; WATERBURY, CT; Owner: WTXX INC.)
WDMR-LP (Channel 65; SPRINGFIELD, MA; Owner: ZGS HARTFORD, INC.)
WVIT (Channel 30; NEW BRITAIN, CT; Owner: OUTLET BROADCASTING, INC)
WEDH (Channel 24; HARTFORD, CT; Owner: CONNECTICUT PUBLIC BROADCASTING, INC.)
WUNI (Channel 27; WORCESTER, MA; Owner: ENTRAVISION HOLDINGS, LLC)
WFSB (Channel 3; HARTFORD, CT; Owner: MEREDITH CORPORATION)
W12CL (Channel 12; GRANBY, CT; Owner: SALVATORE MINNITI)
Medal of Honor Recipients
Medal of Honor Recipients born in Holyoke: Joseph E. Muller, Raymond O. Beaudoin.
National Bridge Inventory (NBI) Statistics 51 Number of bridges1,102ft / 336m Total length $344,437,000 Total costs1,213,779 Total average daily traffic70,682 Total average daily truck traffic
New bridges - historical statistics
7 Before 1900 1 1900-1909 1 1910-1919 4 1920-1929 1 1950-1959 26 1960-1969 4 1970-1979 1 1980-1989 3 1990-1999 3 2010-2019
See full National Bridge Inventory statistics for Holyoke, MA
Home Mortgage Disclosure Act Aggregated Statistics For Year 2009(Based on 9 full tracts) A) FHA, FSA/RHS & VA B) Conventional C) Refinancings D) Home Improvement Loans E) Loans on Dwellings For 5+ Families F) Non-occupant Loans on G) Loans On Manufactured Number Average Value Number Average Value Number Average Value Number Average Value Number Average Value Number Average Value Number Average Value
LOANS ORIGINATED 91 $160,868 136 $120,588 385 $149,148 40 $64,500 4 $433,750 20 $107,700 0 $0 APPLICATIONS APPROVED, NOT ACCEPTED 2 $218,500 3 $140,333 20 $138,600 4 $48,000 0 $0 1 $138,000 0 $0 APPLICATIONS DENIED 10 $115,100 19 $91,316 144 $144,493 41 $39,805 5 $225,000 5 $57,400 1 $3,000 APPLICATIONS WITHDRAWN 10 $139,700 24 $124,917 63 $159,206 5 $59,800 2 $151,000 3 $112,000 0 $0 FILES CLOSED FOR INCOMPLETENESS 3 $113,333 9 $96,778 41 $157,683 2 $116,500 0 $0 3 $67,333 1 $120,000
Aggregated Statistics For Year 2008(Based on 9 full tracts) A) FHA, FSA/RHS & VA B) Conventional C) Refinancings D) Home Improvement Loans E) Loans on Dwellings For 5+ Families F) Non-occupant Loans on G) Loans On Manufactured Number Average Value Number Average Value Number Average Value Number Average Value Number Average Value Number Average Value Number Average Value
LOANS ORIGINATED 52 $157,577 204 $132,123 281 $146,342 78 $59,744 7 $522,714 35 $189,371 0 $0 APPLICATIONS APPROVED, NOT ACCEPTED 6 $143,667 18 $165,500 51 $142,980 18 $25,833 0 $0 2 $126,000 1 $60,000 APPLICATIONS DENIED 6 $156,000 24 $87,667 240 $152,042 85 $44,918 3 $606,333 20 $86,650 1 $3,000 APPLICATIONS WITHDRAWN 8 $126,250 26 $116,692 78 $147,821 13 $61,077 2 $437,500 7 $132,857 1 $30,000 FILES CLOSED FOR INCOMPLETENESS 1 $54,000 11 $122,818 34 $153,265 3 $65,000 1 $768,000 1 $178,000 0 $0
Aggregated Statistics For Year 2007(Based on 9 full tracts) A) FHA, FSA/RHS & VA B) Conventional C) Refinancings D) Home Improvement Loans E) Loans on Dwellings For 5+ Families F) Non-occupant Loans on G) Loans On Manufactured Number Average Value Number Average Value Number Average Value Number Average Value Number Average Value Number Average Value Number Average Value
LOANS ORIGINATED 16 $179,125 349 $137,487 377 $135,751 114 $52,061 14 $771,214 53 $116,245 0 $0 APPLICATIONS APPROVED, NOT ACCEPTED 2 $119,000 51 $143,647 69 $132,710 16 $55,438 2 $211,500 13 $134,846 1 $60,000 APPLICATIONS DENIED 2 $150,500 87 $126,736 442 $150,335 139 $44,374 6 $253,833 37 $103,000 1 $1,000 APPLICATIONS WITHDRAWN 0 $0 39 $145,872 161 $146,068 20 $59,950 1 $189,000 14 $126,000 0 $0 FILES CLOSED FOR INCOMPLETENESS 0 $0 12 $225,000 36 $180,861 2 $135,000 1 $50,000 7 $311,571 0 $0
Aggregated Statistics For Year 2006(Based on 9 full tracts) A) FHA, FSA/RHS & VA B) Conventional C) Refinancings D) Home Improvement Loans E) Loans on Dwellings For 5+ Families F) Non-occupant Loans on G) Loans On Manufactured Number Average Value Number Average Value Number Average Value Number Average Value Number Average Value Number Average Value Number Average Value
LOANS ORIGINATED 14 $185,071 436 $127,803 508 $126,581 177 $57,469 25 $487,560 105 $113,876 2 $8,500 APPLICATIONS APPROVED, NOT ACCEPTED 1 $137,000 60 $107,917 100 $126,910 26 $48,462 0 $0 12 $82,250 0 $0 APPLICATIONS DENIED 1 $145,000 126 $184,984 465 $136,297 214 $33,056 9 $209,667 105 $52,876 19 $18,421 APPLICATIONS WITHDRAWN 0 $0 43 $128,930 312 $140,808 15 $79,600 2 $360,000 20 $142,650 0 $0 FILES CLOSED FOR INCOMPLETENESS 0 $0 20 $111,650 78 $148,282 3 $38,333 5 $649,200 7 $119,143 1 $104,000
Aggregated Statistics For Year 2005(Based on 9 full tracts) A) FHA, FSA/RHS & VA B) Conventional C) Refinancings D) Home Improvement Loans E) Loans on Dwellings For 5+ Families F) Non-occupant Loans on G) Loans On Manufactured Number Average Value Number Average Value Number Average Value Number Average Value Number Average Value Number Average Value Number Average Value
LOANS ORIGINATED 19 $174,211 522 $115,377 556 $130,009 127 $56,835 42 $311,143 92 $110,848 4 $29,500 APPLICATIONS APPROVED, NOT ACCEPTED 2 $101,000 56 $126,714 106 $126,623 29 $30,069 4 $297,250 20 $118,200 1 $15,000 APPLICATIONS DENIED 3 $133,333 127 $99,811 428 $127,061 267 $29,637 10 $217,000 167 $30,796 17 $45,471 APPLICATIONS WITHDRAWN 6 $136,333 92 $117,783 371 $129,609 26 $117,231 11 $312,455 30 $154,633 0 $0 FILES CLOSED FOR INCOMPLETENESS 0 $0 17 $144,471 62 $139,935 1 $60,000 2 $480,500 4 $104,500 0 $0
Aggregated Statistics For Year 2004(Based on 9 full tracts) A) FHA, FSA/RHS & VA B) Conventional C) Refinancings D) Home Improvement Loans E) Loans on Dwellings For 5+ Families F) Non-occupant Loans on G) Loans On Manufactured Number Average Value Number Average Value Number Average Value Number Average Value Number Average Value Number Average Value Number Average Value
LOANS ORIGINATED 26 $136,115 457 $110,361 558 $113,416 137 $46,526 21 $416,762 104 $80,000 6 $14,000 APPLICATIONS APPROVED, NOT ACCEPTED 6 $131,333 37 $132,189 98 $111,684 27 $39,407 4 $291,750 10 $78,900 0 $0 APPLICATIONS DENIED 3 $148,667 76 $114,947 392 $108,125 233 $20,433 5 $242,000 141 $20,021 5 $6,800 APPLICATIONS WITHDRAWN 9 $164,667 41 $119,171 402 $114,348 26 $63,808 2 $76,000 17 $113,059 2 $167,500 FILES CLOSED FOR INCOMPLETENESS 2 $74,000 5 $109,800 71 $133,592 8 $36,375 0 $0 3 $167,333 0 $0
Aggregated Statistics For Year 2003(Based on 9 full tracts) A) FHA, FSA/RHS & VA B) Conventional C) Refinancings D) Home Improvement Loans E) Loans on Dwellings For 5+ Families F) Non-occupant Loans on Number Average Value Number Average Value Number Average Value Number Average Value Number Average Value Number Average Value
LOANS ORIGINATED 52 $128,288 344 $114,610 995 $102,734 55 $26,200 10 $240,700 78 $91,179 APPLICATIONS APPROVED, NOT ACCEPTED 7 $123,714 34 $103,912 133 $97,406 12 $33,083 0 $0 7 $79,286 APPLICATIONS DENIED 3 $118,000 70 $97,857 371 $93,585 61 $20,230 3 $822,000 33 $95,788 APPLICATIONS WITHDRAWN 4 $106,750 33 $104,394 256 $110,152 8 $43,875 0 $0 10 $89,700 FILES CLOSED FOR INCOMPLETENESS 1 $113,000 5 $142,600 21 $110,857 0 $0 0 $0 1 $109,000
Aggregated Statistics For Year 2002(Based on 9 full tracts) A) FHA, FSA/RHS & VA B) Conventional C) Refinancings D) Home Improvement Loans E) Loans on Dwellings For 5+ Families F) Non-occupant Loans on Number Average Value Number Average Value Number Average Value Number Average Value Number Average Value Number Average Value
LOANS ORIGINATED 48 $108,750 289 $99,886 618 $95,584 53 $27,943 12 $268,417 46 $81,543 APPLICATIONS APPROVED, NOT ACCEPTED 7 $89,571 23 $110,043 95 $87,895 18 $29,111 4 $107,750 8 $80,500 APPLICATIONS DENIED 17 $93,647 43 $73,233 221 $85,462 52 $16,365 2 $127,500 16 $64,000 APPLICATIONS WITHDRAWN 11 $103,909 26 $81,731 138 $90,065 4 $40,750 1 $170,000 7 $54,571 FILES CLOSED FOR INCOMPLETENESS 0 $0 9 $72,111 29 $95,655 1 $70,000 0 $0 3 $72,667
Aggregated Statistics For Year 2001(Based on 9 full tracts) A) FHA, FSA/RHS & VA B) Conventional C) Refinancings D) Home Improvement Loans E) Loans on Dwellings For 5+ Families F) Non-occupant Loans on Number Average Value Number Average Value Number Average Value Number Average Value Number Average Value Number Average Value
LOANS ORIGINATED 88 $102,386 273 $87,824 452 $89,584 49 $24,102 5 $793,600 29 $63,931 APPLICATIONS APPROVED, NOT ACCEPTED 5 $89,200 27 $82,667 54 $98,648 25 $30,520 3 $143,333 9 $120,556 APPLICATIONS DENIED 7 $102,857 42 $57,333 258 $72,833 80 $13,300 5 $2,460,400 22 $52,773 APPLICATIONS WITHDRAWN 9 $101,556 21 $96,095 137 $82,146 12 $34,917 1 $98,000 6 $91,167 FILES CLOSED FOR INCOMPLETENESS 0 $0 4 $99,500 20 $111,150 6 $11,167 2 $820,000 3 $153,667
Aggregated Statistics For Year 2000(Based on 9 full tracts) A) FHA, FSA/RHS & VA B) Conventional C) Refinancings D) Home Improvement Loans E) Loans on Dwellings For 5+ Families F) Non-occupant Loans on Number Average Value Number Average Value Number Average Value Number Average Value Number Average Value Number Average Value
LOANS ORIGINATED 86 $97,698 256 $77,438 124 $70,839 54 $17,630 4 $372,000 20 $59,150 APPLICATIONS APPROVED, NOT ACCEPTED 3 $69,333 19 $63,211 31 $70,742 24 $19,500 0 $0 5 $70,200 APPLICATIONS DENIED 8 $107,625 41 $60,780 184 $54,065 76 $24,645 3 $195,333 8 $52,250 APPLICATIONS WITHDRAWN 7 $75,857 26 $70,846 106 $59,915 13 $36,462 3 $123,667 2 $54,500 FILES CLOSED FOR INCOMPLETENESS 1 $55,000 2 $66,000 23 $97,130 0 $0 0 $0 3 $71,000
Aggregated Statistics For Year 1999(Based on 9 full tracts) A) FHA, FSA/RHS & VA B) Conventional C) Refinancings D) Home Improvement Loans E) Loans on Dwellings For 5+ Families F) Non-occupant Loans on Number Average Value Number Average Value Number Average Value Number Average Value Number Average Value Number Average Value
LOANS ORIGINATED 80 $89,631 201 $82,142 282 $77,562 54 $13,701 7 $65,934 32 $58,441 APPLICATIONS APPROVED, NOT ACCEPTED 5 $67,760 11 $52,176 53 $79,319 21 $19,976 0 $0 9 $193,111 APPLICATIONS DENIED 5 $58,944 42 $70,116 179 $56,990 67 $18,167 2 $131,000 14 $47,364 APPLICATIONS WITHDRAWN 15 $88,410 21 $71,138 111 $67,496 5 $37,204 1 $110,000 9 $46,439 FILES CLOSED FOR INCOMPLETENESS 5 $67,568 1 $63,830 24 $72,559 0 $0 0 $0 0 $0
Detailed mortgage data for all 9 tracts in Holyoke, MA
Private Mortgage Insurance Companies Aggregated Statistics For Year 2009(Based on 5 full tracts) A) Conventional B) Refinancings Number Average Value Number Average Value
LOANS ORIGINATED 19 $166,789 22 $196,273 APPLICATIONS APPROVED, NOT ACCEPTED 2 $161,500 5 $197,400 APPLICATIONS DENIED 3 $152,333 0 $0 APPLICATIONS WITHDRAWN 1 $197,000 0 $0 FILES CLOSED FOR INCOMPLETENESS 1 $223,000 1 $236,000
Aggregated Statistics For Year 2008(Based on 8 full tracts) A) Conventional B) Refinancings C) Non-occupant Loans on Number Average Value Number Average Value Number Average Value
LOANS ORIGINATED 51 $161,980 25 $182,920 5 $138,400 APPLICATIONS APPROVED, NOT ACCEPTED 12 $134,250 13 $219,769 1 $138,000 APPLICATIONS DENIED 5 $135,800 2 $151,000 0 $0 APPLICATIONS WITHDRAWN 3 $185,667 3 $172,667 0 $0 FILES CLOSED FOR INCOMPLETENESS 0 $0 0 $0 0 $0
Aggregated Statistics For Year 2007(Based on 9 full tracts) A) Conventional B) Refinancings C) Non-occupant Loans on Number Average Value Number Average Value Number Average Value
LOANS ORIGINATED 97 $159,794 30 $207,533 11 $109,182 APPLICATIONS APPROVED, NOT ACCEPTED 9 $148,333 13 $171,538 1 $72,000 APPLICATIONS DENIED 5 $111,600 5 $197,800 0 $0 APPLICATIONS WITHDRAWN 3 $206,000 6 $192,500 0 $0 FILES CLOSED FOR INCOMPLETENESS 0 $0 1 $201,000 0 $0
Aggregated Statistics For Year 2006(Based on 8 full tracts) A) Conventional B) Refinancings C) Non-occupant Loans on Number Average Value Number Average Value Number Average Value
LOANS ORIGINATED 56 $151,732 17 $184,471 7 $96,714 APPLICATIONS APPROVED, NOT ACCEPTED 7 $152,286 8 $146,375 0 $0 APPLICATIONS DENIED 2 $172,500 0 $0 1 $135,000 APPLICATIONS WITHDRAWN 0 $0 2 $112,500 0 $0 FILES CLOSED FOR INCOMPLETENESS 0 $0 0 $0 0 $0
Aggregated Statistics For Year 2005(Based on 8 full tracts) A) Conventional B) Refinancings C) Non-occupant Loans on Number Average Value Number Average Value Number Average Value
LOANS ORIGINATED 65 $156,415 13 $164,308 6 $149,833 APPLICATIONS APPROVED, NOT ACCEPTED 8 $156,125 2 $164,000 2 $156,000 APPLICATIONS DENIED 0 $0 2 $196,000 0 $0 APPLICATIONS WITHDRAWN 2 $143,000 1 $148,000 1 $77,000 FILES CLOSED FOR INCOMPLETENESS 1 $170,000 0 $0 0 $0
Aggregated Statistics For Year 2004(Based on 8 full tracts) A) Conventional B) Refinancings C) Non-occupant Loans on Number Average Value Number Average Value Number Average Value
LOANS ORIGINATED 90 $141,878 23 $137,826 11 $109,818 APPLICATIONS APPROVED, NOT ACCEPTED 8 $143,875 8 $129,375 1 $161,000 APPLICATIONS DENIED 1 $97,000 3 $136,667 2 $118,000 APPLICATIONS WITHDRAWN 2 $137,500 1 $75,000 0 $0 FILES CLOSED FOR INCOMPLETENESS 1 $121,000 0 $0 0 $0
Aggregated Statistics For Year 2003(Based on 8 full tracts) A) Conventional B) Refinancings C) Non-occupant Loans on Number Average Value Number Average Value Number Average Value
LOANS ORIGINATED 97 $127,103 59 $139,339 11 $90,273 APPLICATIONS APPROVED, NOT ACCEPTED 12 $150,917 8 $134,875 0 $0 APPLICATIONS DENIED 4 $136,250 1 $133,000 0 $0 APPLICATIONS WITHDRAWN 4 $179,000 3 $154,667 1 $166,000 FILES CLOSED FOR INCOMPLETENESS 0 $0 0 $0 0 $0
Aggregated Statistics For Year 2002(Based on 9 full tracts) A) Conventional B) Refinancings C) Non-occupant Loans on Number Average Value Number Average Value Number Average Value
LOANS ORIGINATED 106 $117,679 38 $109,421 8 $87,000 APPLICATIONS APPROVED, NOT ACCEPTED 9 $102,222 11 $110,364 2 $78,000 APPLICATIONS DENIED 1 $95,000 1 $119,000 0 $0 APPLICATIONS WITHDRAWN 0 $0 3 $108,333 0 $0 FILES CLOSED FOR INCOMPLETENESS 2 $104,000 0 $0 0 $0
Aggregated Statistics For Year 2001(Based on 9 full tracts) A) Conventional B) Refinancings C) Non-occupant Loans on Number Average Value Number Average Value Number Average Value
LOANS ORIGINATED 92 $104,250 34 $117,529 5 $48,800 APPLICATIONS APPROVED, NOT ACCEPTED 13 $90,154 7 $114,429 2 $53,500 APPLICATIONS DENIED 1 $30,000 1 $113,000 1 $30,000 APPLICATIONS WITHDRAWN 2 $97,500 1 $62,000 0 $0 FILES CLOSED FOR INCOMPLETENESS 0 $0 0 $0 0 $0
Aggregated Statistics For Year 2000(Based on 8 full tracts) A) Conventional B) Refinancings C) Non-occupant Loans on Number Average Value Number Average Value Number Average Value
LOANS ORIGINATED 81 $97,444 13 $105,385 4 $66,000 APPLICATIONS APPROVED, NOT ACCEPTED 5 $112,200 2 $80,500 1 $113,000 APPLICATIONS DENIED 1 $89,000 0 $0 0 $0 APPLICATIONS WITHDRAWN 2 $108,000 1 $85,000 0 $0 FILES CLOSED FOR INCOMPLETENESS 0 $0 0 $0 0 $0
Aggregated Statistics For Year 1999(Based on 8 full tracts) A) Conventional B) Refinancings C) Non-occupant Loans on Number Average Value Number Average Value Number Average Value
LOANS ORIGINATED 61 $89,282 31 $96,702 3 $61,693 APPLICATIONS APPROVED, NOT ACCEPTED 6 $111,747 4 $103,825 0 $0 APPLICATIONS DENIED 3 $102,553 2 $97,865 0 $0 APPLICATIONS WITHDRAWN 1 $85,780 1 $87,730 0 $0 FILES CLOSED FOR INCOMPLETENESS 1 $80,000 1 $90,000 0 $0
Fire-safe hotels and motels in Holyoke, Massachusetts:
D. Hotel & Suites, 1 Country Club Rd, Holyoke, Massachusetts 01040 Phone: (413) 533-2100, Fax: (413) 539-9761
Homewood Suites By Hilton, 375 Whitney Ave, Holyoke, Massachusetts 01040 Phone: (413) 532-3100, Fax: (413) 532-3150
Americas Best Value Inn, 671 Northampton St, Holyoke, Massachusetts 01040 Phone: (413) 536-3377, Fax: (413) 536-5388
Fairfield Inn & Suites Springfield/Holyoke, 229 Whiting Farms Rd, Holyoke, Massachusetts 01040 Phone: (413) 533-2800
All 4 fire-safe hotels and motels in Holyoke, Massachusetts
Most common first names in Holyoke, MA among deceased individuals Name Count Lived (average)
Mary 904 82.0 years John 687 75.6 years William 457 75.7 years Joseph 425 75.6 years Helen 363 82.3 years Edward 338 73.0 years James 330 74.8 years Margaret 287 82.9 years George 277 75.2 years Anna 252 83.6 years
Most common last names in Holyoke, MA among deceased individuals Last name Count Lived (average)
Sullivan 181 79.4 years Oconnor 128 79.0 years Kennedy 103 79.3 years Moriarty 103 78.7 years Murphy 99 78.8 years Smith 96 78.8 years Shea 96 79.0 years Griffin 88 79.6 years Fitzgerald 74 79.6 years Kane 70 79.0 years
Holyoke compared to Massachusetts state average:
Median household income below state average. Median house value below state average. Unemployed percentage below state average. Black race population percentage below state average. Hispanic race population percentage significantly above state average. Median age below state average. Foreign-born population percentage significantly below state average. Renting percentage above state average. Length of stay since moving in significantly above state average. Institutionalized population percentage above state average. Number of college students below state average.
#14 on the list of "Top 101 cities with the biggest local government total salary and wages expenses per resident (population 10,000+)"
#71 on the list of "Top 101 cities with the least cars per house, population 5,000+"
#85 on the list of "Top 101 cities with the largest percentage of likely lesbian couples (counted as self-reported female-female unmarried-partner households) (population 5,000+)"
#14 on the list of "Top 101 counties with the lowest percentage of residents relocating from other counties between 2010 and 2011"
#21 on the list of "Top 101 counties with the largest number of people moving out compared to moving in (pop. 50,000+)"
#22 on the list of "Top 101 counties with the highest carbon monoxide air pollution readings in 2012 (ppm)"
#31 on the list of "Top 101 counties with the lowest percentage of residents relocating to other counties in 2011"
#34 on the list of "Top 101 counties with the lowest percentage of residents that keep firearms around their homes"
Top Patent Applicants
Sean P. Breen (10)
Vanwijak Eowsakul (6)
Scott Defelice (5)
Patrick Taylor (4)
Scott F. Defelice (4)
Desiree L. Plata (3)
Robert Hazen (3)
Jerel Richard Lear (3)
Joseph Donald Gagne (3)
John Linscott (3)
Total of 69 patent applications in 2008-2024.
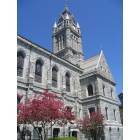
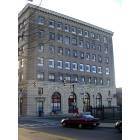


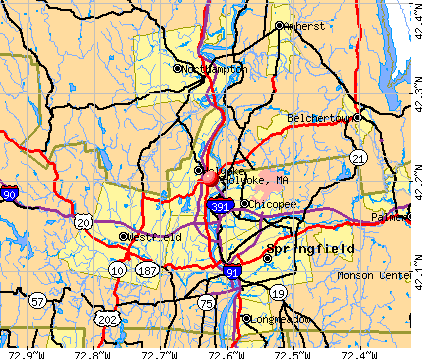


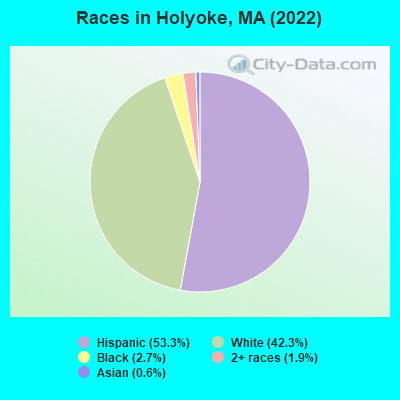
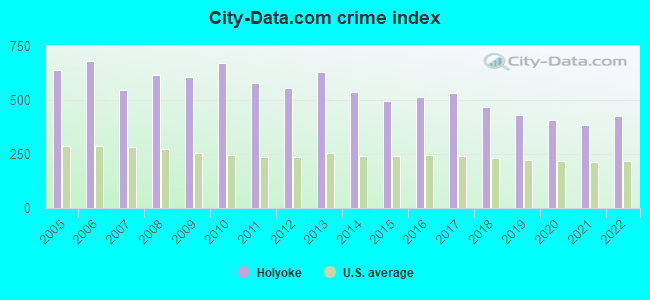
 Recent articles from our blog. Our writers, many of them Ph.D. graduates or candidates, create easy-to-read articles on a wide variety of topics.

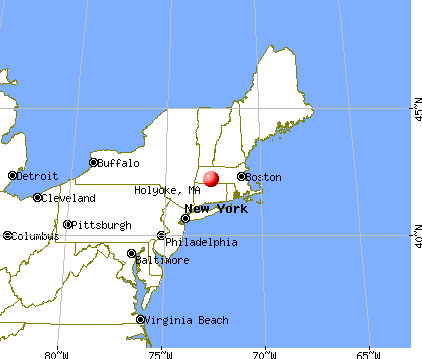
 (2.9 miles
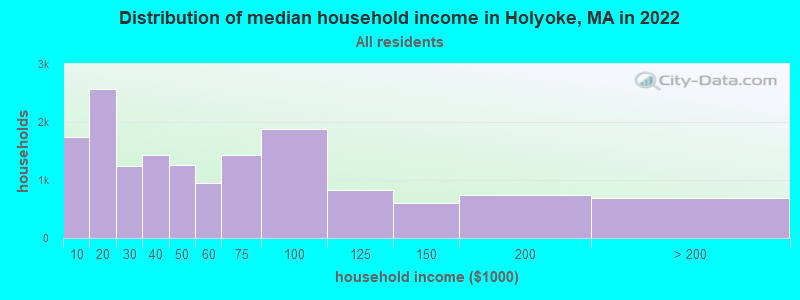
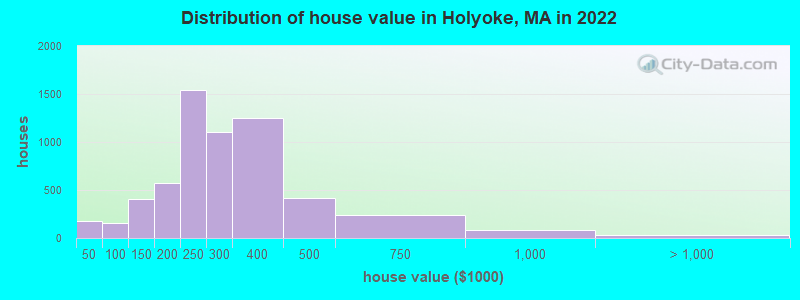
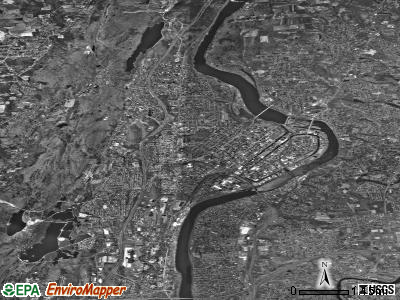

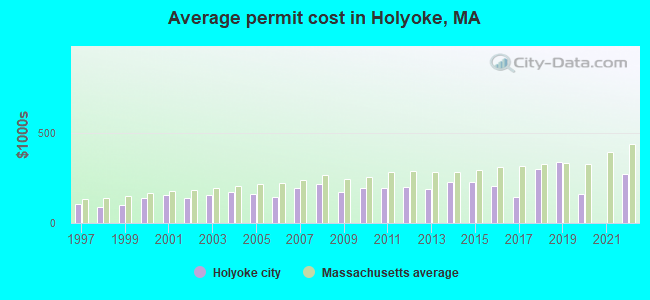
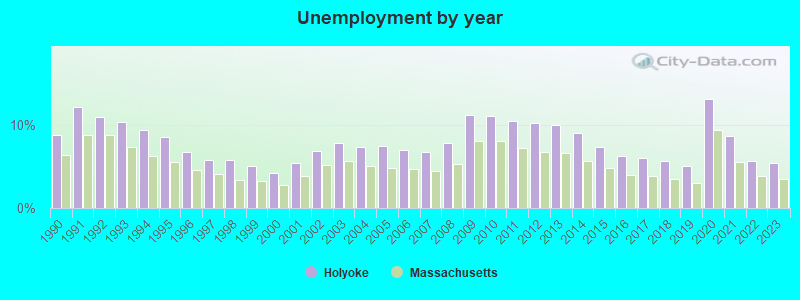
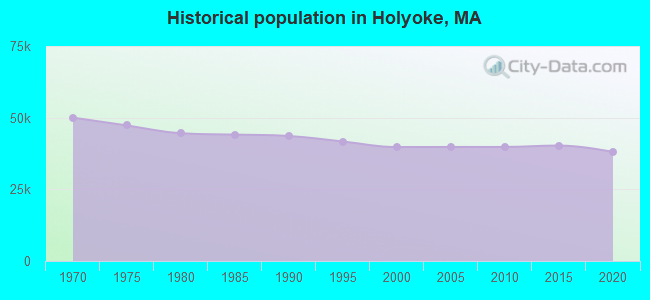
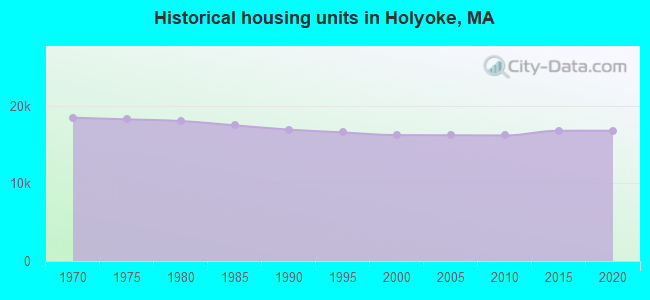
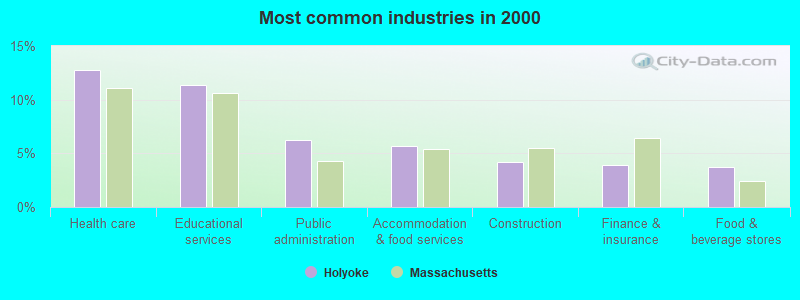
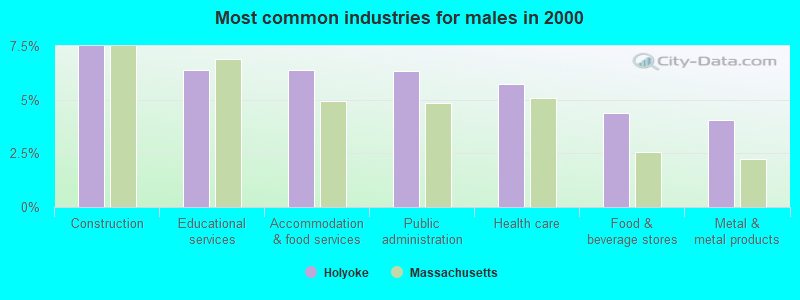
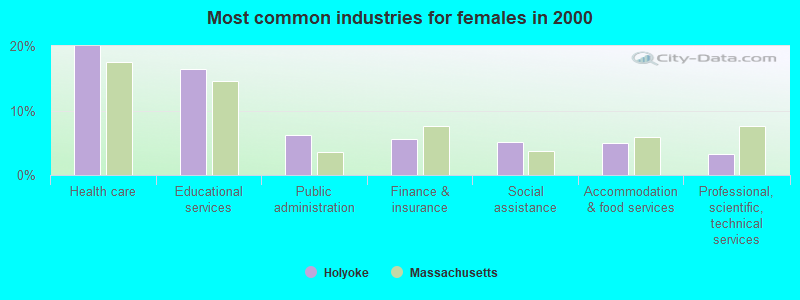
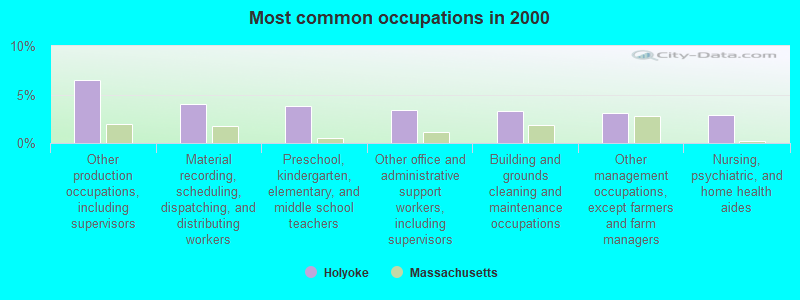
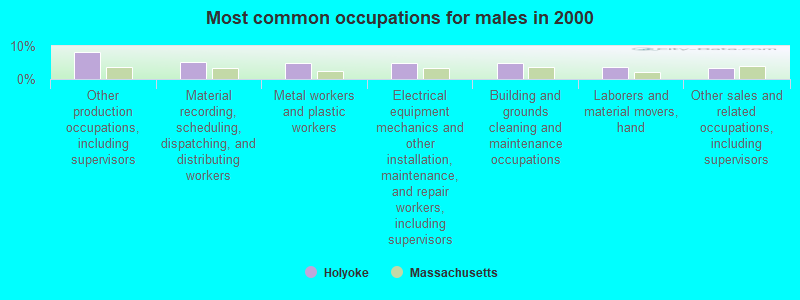
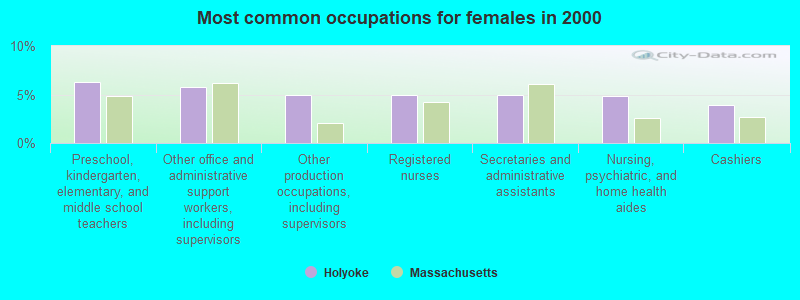
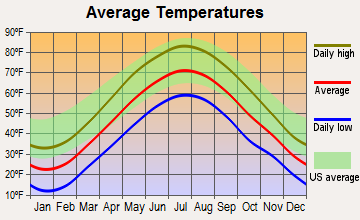
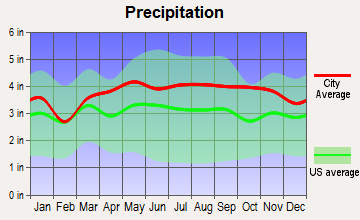
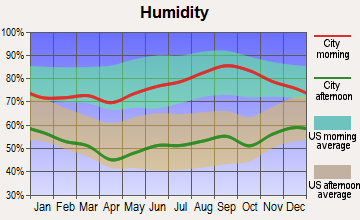
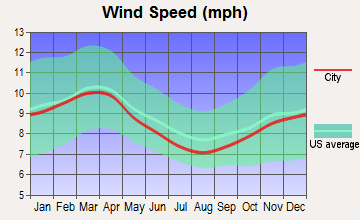
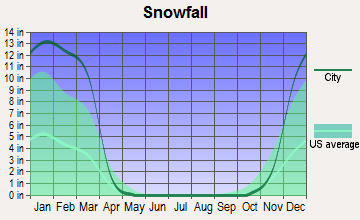
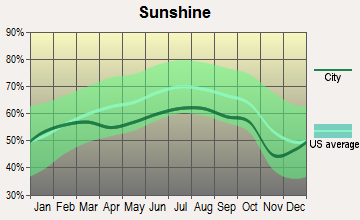
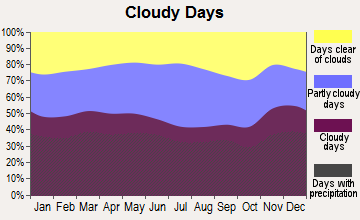
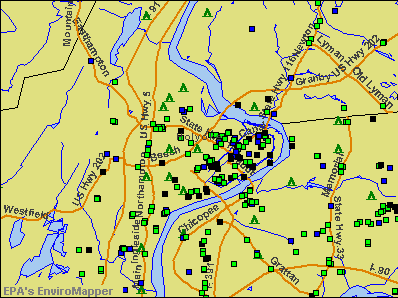

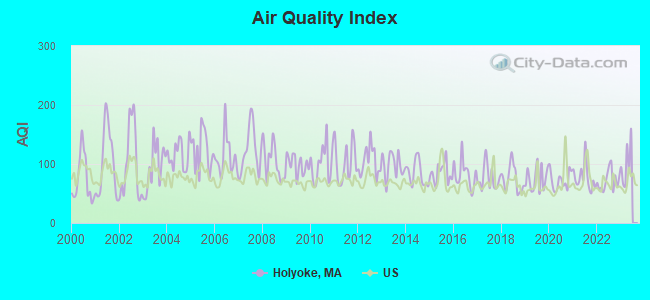
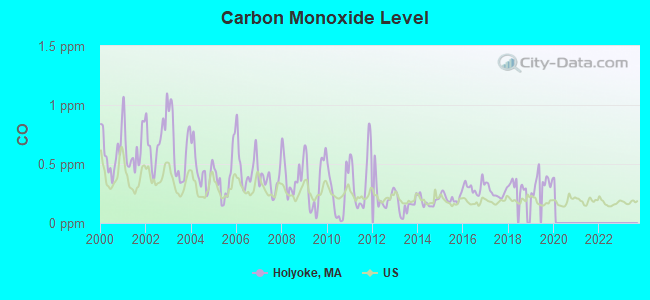

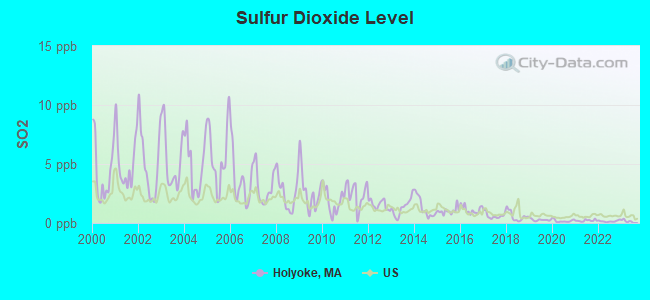
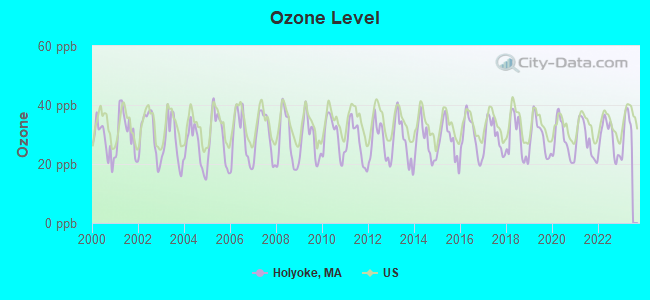
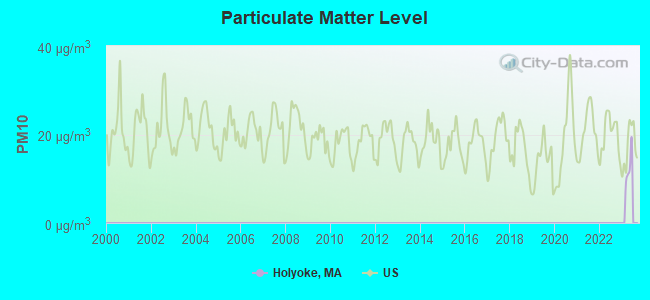
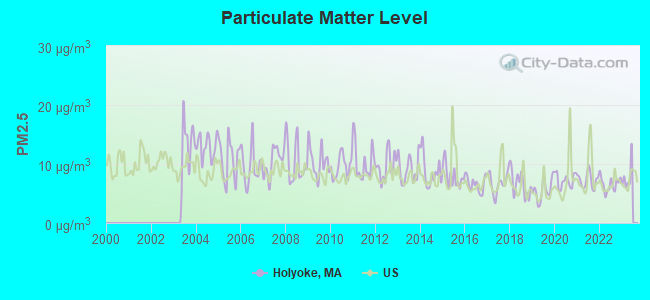
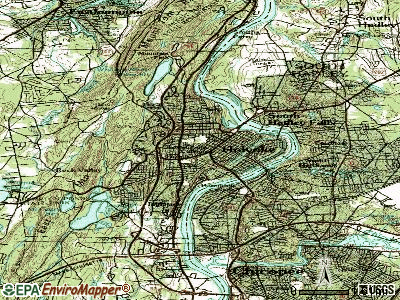
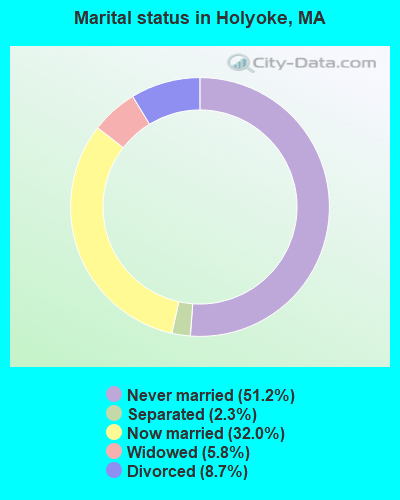
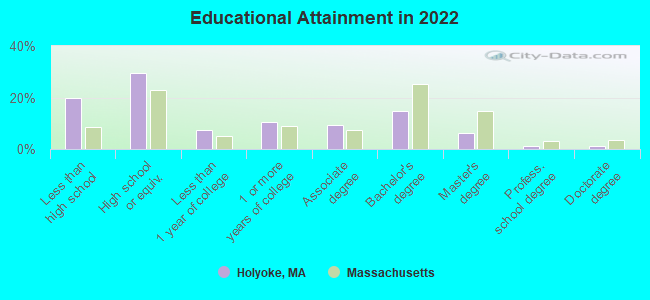
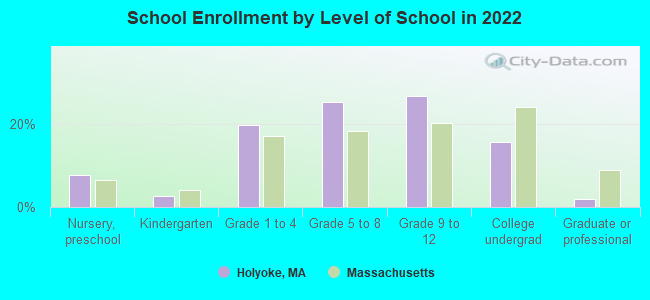
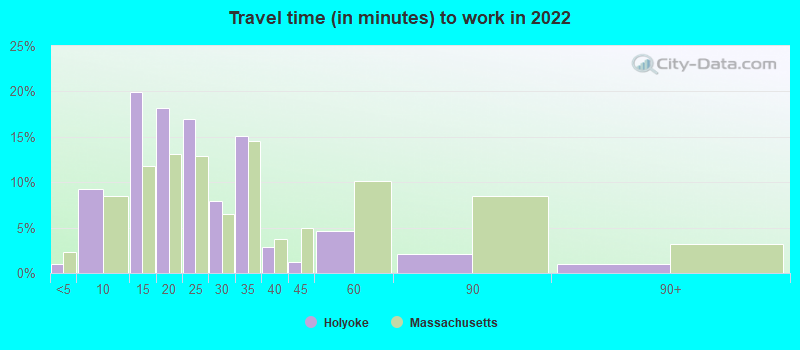
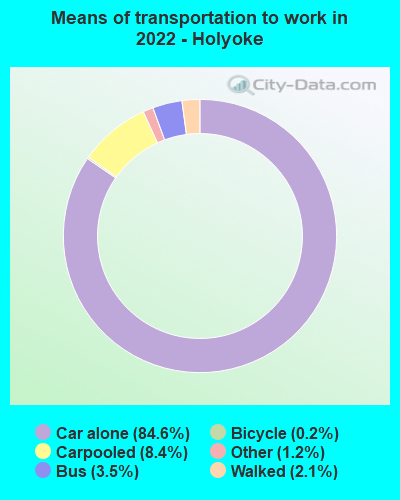
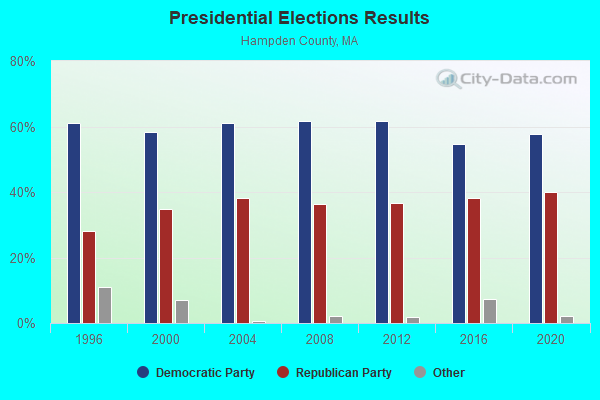
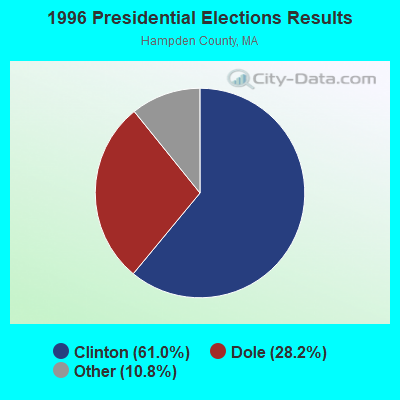
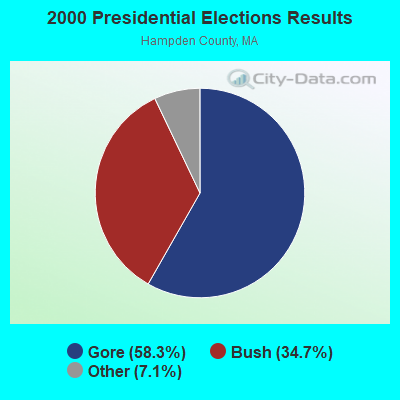
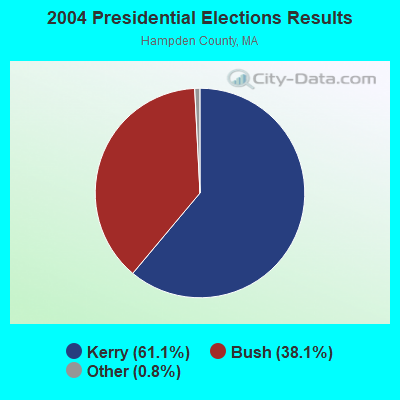
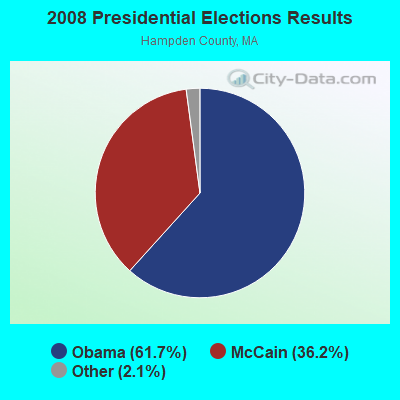
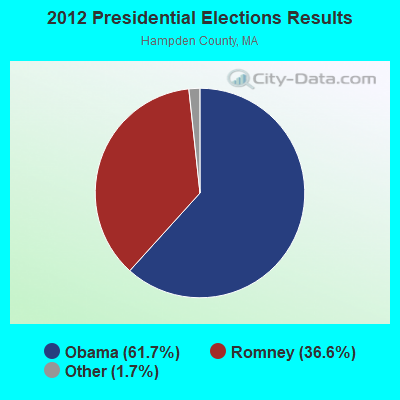
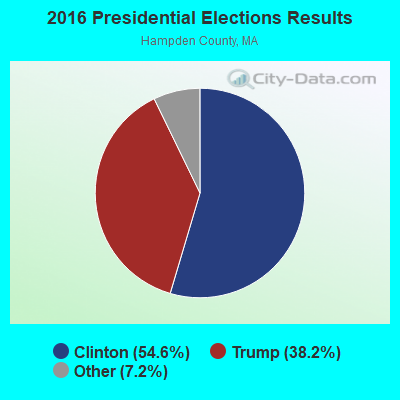
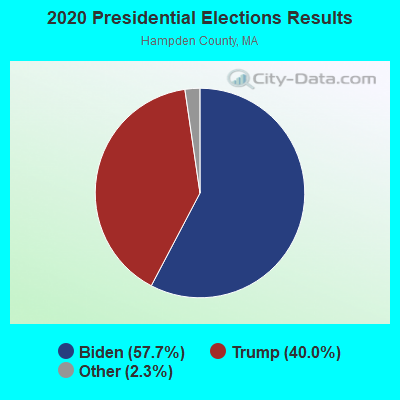
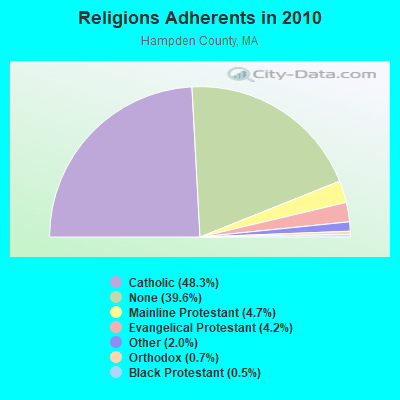
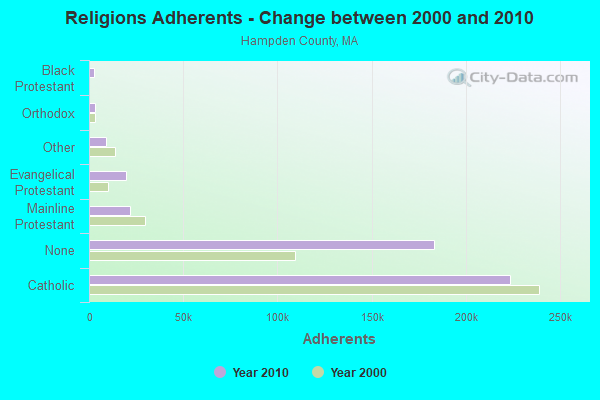
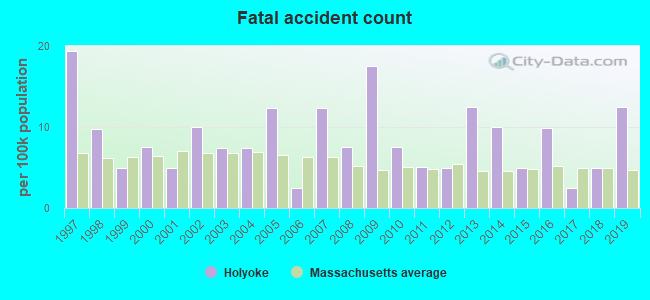
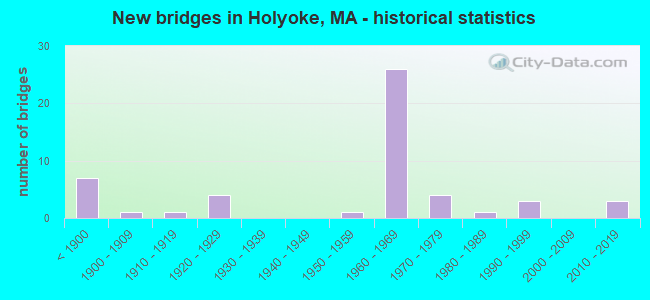
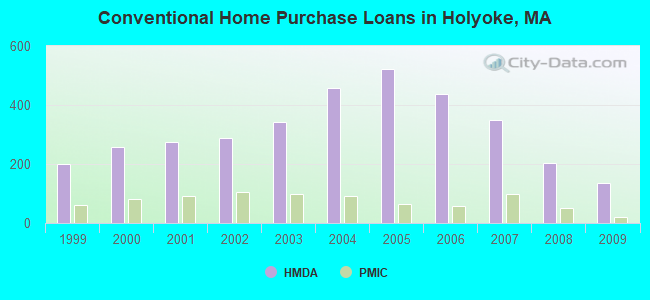
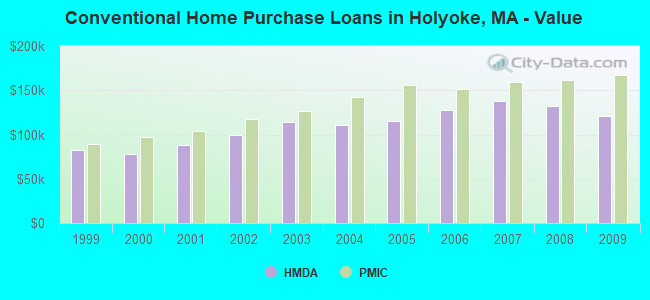
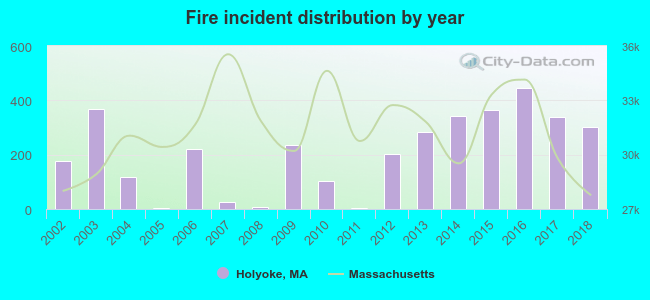 According to the data from the years 2002 - 2018 the average number of fire incidents per year is 208. The highest number of fire incidents - 445 took place in 2016, and the least - 3 in 2005. The data has a rising trend.
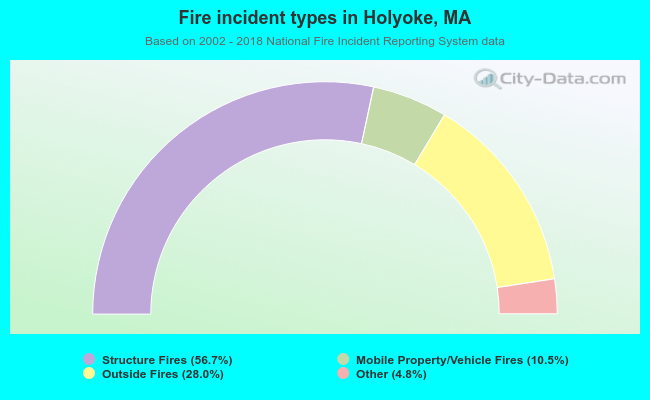 When looking into fire subcategories, the most incidents belonged to: Structure Fires (56.7%), and Outside Fires (28.0%).