High Desert, Nevada
Submit your own pictures of this place and show them to the world
- OSM Map
- General Map
- Google Map
- MSN Map

| Males: 634 | |
| Females: 451 |
| Median resident age: | 38.0 years |
| Nevada median age: | 35.0 years |
| High Desert: | $47,220 |
| NV: | $72,333 |
Estimated per capita income in 2022: $27,260 (it was $14,652 in 2000)
High Desert CCD income, earnings, and wages data
Estimated median house or condo value in 2022: $256,863 (it was $72,400 in 2000)
| High Desert: | $256,863 |
| NV: | $434,700 |
Mean prices in 2022: all housing units: $613,067; detached houses: $676,960; townhouses or other attached units: $384,722; in 3-to-4-unit structures: $610,331; in 5-or-more-unit structures: $303,040; mobile homes: $180,941; occupied boats, rvs, vans, etc.: $38,281
Detailed information about poverty and poor residents in High Desert, NV


- 65872.1%White alone
- 22024.1%Hispanic
- 202.2%American Indian alone
- 91.0%Two or more races
- 30.3%Asian alone
- 20.2%Other race alone

Races in High Desert detailed stats: ancestries, foreign born residents, place of birth
 Recent articles from our blog. Our writers, many of them Ph.D. graduates or candidates, create easy-to-read articles on a wide variety of topics.
Current Local Time: PST time zone
Land area: 4400.5 square miles.
Population density: 0.2 people per square mile (very low).

| High Desert CCD: | 0.6% ($407) |
| Nevada: | 0.9% ($1,187) |
Nearest city with pop. 50,000+: Sparks, NV  (92.3 miles , pop. 66,346).
Nearest city with pop. 200,000+: Sacramento, CA (187.7 miles , pop. 407,018).
Nearest city with pop. 1,000,000+: Los Angeles, CA (475.8 miles , pop. 3,694,820).
Nearest cities:
), ), Latitude: 40.89 N, Longitude: 119.66 W


| Here: | 3.9% |
| Nevada: | 5.0% |

- Agriculture, forestry, fishing & hunting (37.8%)
- Nonmetallic mineral products (19.9%)
- Educational services (6.9%)
- Groceries & related products merchant wholesalers (4.8%)
- Construction (4.5%)
- Accommodation & food services (3.6%)
- Professional, scientific, technical services (2.9%)

- Agriculture, forestry, fishing & hunting (47.1%)
- Nonmetallic mineral products (19.1%)
- Groceries & related products merchant wholesalers (6.4%)
- Construction (6.1%)
- Educational services (4.1%)
- Truck transportation (2.5%)
- Religious, grantmaking, civic, professional, similar organizations (2.5%)

- Nonmetallic mineral products (22.1%)
- Educational services (15.4%)
- Food & beverage stores (10.6%)
- Agriculture, forestry, fishing & hunting (9.6%)
- Accommodation & food services (9.6%)
- Other direct selling establishments (8.7%)
- Arts, entertainment, recreation (6.7%)

- Agricultural workers, including supervisors (14.8%)
- Electrical equipment mechanics and other installation, maintenance, and repair workers, including supervisors (11.7%)
- Other production occupations, including supervisors (11.5%)
- Construction laborers (6.2%)
- Laborers and material movers, hand (5.0%)
- Construction traders workers except carpenters, electricians, painters, plumbers, and construction laborers (4.8%)
- Building and grounds cleaning and maintenance occupations (4.5%)

- Agricultural workers, including supervisors (18.5%)
- Electrical equipment mechanics and other installation, maintenance, and repair workers, including supervisors (15.6%)
- Other production occupations, including supervisors (10.2%)
- Construction laborers (8.3%)
- Laborers and material movers, hand (6.7%)
- Construction traders workers except carpenters, electricians, painters, plumbers, and construction laborers (6.4%)
- Building and grounds cleaning and maintenance occupations (4.5%)

- Other office and administrative support workers, including supervisors (15.4%)
- Other production occupations, including supervisors (15.4%)
- Food and beverage serving workers, except waiters and waitresses (10.6%)
- Other sales and related occupations, including supervisors (8.7%)
- Preschool, kindergarten, elementary, and middle school teachers (6.7%)
- Supervisors and other personal care and service workers, except child care workers (6.7%)
- Art and design workers (5.8%)
Average climate in High Desert, Nevada
Based on data reported by over 4,000 weather stations


Earthquake activity:
High Desert-area historical earthquake activity is significantly above Nevada state average. It is 4776% greater than the overall U.S. average.Natural disasters:
The number of natural disasters in Washoe County (28) is a lot greater than the US average (15).Major Disasters (Presidential) Declared: 4
Emergencies Declared: 3
Causes of natural disasters: Fires: 18, Floods: 6, Storms: 4, Mudslides: 2, Snows: 2, Winter Storms: 2, Hurricane: 1, Other: 1 (Note: some incidents may be assigned to more than one category).
Colleges/universities with over 2000 students nearest to High Desert:
- Truckee Meadows Community College (about 92 miles; Reno, NV; Full-time enrollment: 6,919)
- University of Nevada-Reno (about 93 miles; Reno, NV; FT enrollment: 15,092)
- Western Nevada College (about 118 miles; Carson City, NV; FT enrollment: 2,338)
- Butte College (about 136 miles; Oroville, CA; FT enrollment: 8,649)
- Shasta College (about 141 miles; Redding, CA; FT enrollment: 5,645)
- California State University-Chico (about 141 miles; Chico, CA; FT enrollment: 14,838)
- Oregon Institute of Technology (about 145 miles; Klamath Falls, OR; FT enrollment: 2,900)
Points of interest:
Notable locations in High Desert: Home Camp (A), Board Corral Ranch (B), Calcutta Ranch (C), Denio Camp (D), Bandy Ranch (E), Bernards Corrals (F), Big Canyon Ranch (G), Bitner Ranch (H), Brush Corral (I), Lost Creek Ranch (J), Button Brush Windmill (K), Cornell Place (L), Hoover Ranch (M), Stevens Camp (N), Murphy Ranch (O), Grass Valley Ranch (P), Coleman Ranch (Q), Conlon Camp (R), Negro Creek Ranch (S), Williams Place (T). Display/hide their locations on the map
Lakes, reservoirs, and swamps: North Lake (A), Fatty Martin Lake (B), Mud Lake (C), West Lake (D), Massacre Lake (E), Central Lake (F), Melody Lake (G), Cow Lake (H). Display/hide their locations on the map
Streams, rivers, and creeks: North Fork Dry Valley Creek (A), Rock Creek (B), Wall Canyon Creek (C), Squaw Creek (D), Parsnip Wash (E), Negro Creek (F), Grass Valley Creek (G), Buffalo Creek (H), Texas Creek (I). Display/hide their locations on the map
Parks in High Desert include: Sheldon National Antelope Refuge (1), Great Boiling Spring Park (2). Display/hide their locations on the map
| This place: | 2.3 people |
| Nevada: | 2.6 people |
| This place: | 60.5% |
| Whole state: | 65.3% |
| This place: | 5.8% |
| Whole state: | 8.7% |
Likely homosexual households (counted as self-reported same-sex unmarried-partner households)
- Lesbian couples: 0.4% of all households
- Gay men: 0.0% of all households
| This place: | 17.6% |
| Whole state: | 10.5% |
| This place: | 10.3% |
| Whole state: | 4.9% |
86 people in agriculture workers' dormitories on farms in 2000
42 people in nursing homes in 2000
For population 15 years and over in High Desert:

- Never married: 29.7%
- Now married: 57.0%
- Separated: 1.8%
- Widowed: 6.3%
- Divorced: 7.0%
For population 25 years and over in High Desert:
- High school or higher: 70.3%
- Bachelor's degree or higher: 10.4%
- Graduate or professional degree: 1.3%
- Unemployed: 3.0%
- Mean travel time to work (commute): 9.1 minutes


| Here: | 12.2 |
| Nevada average: | 11.9 |
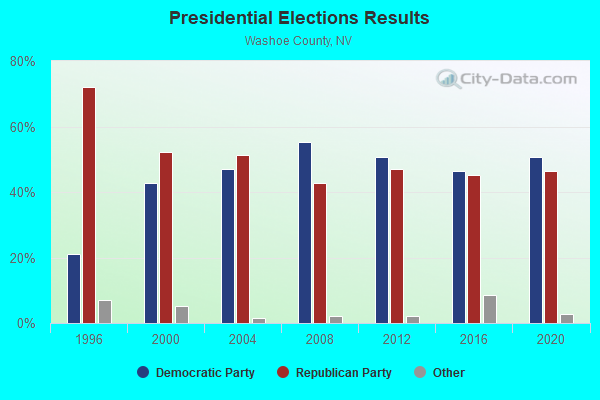
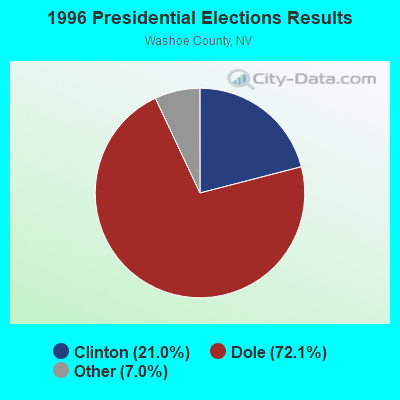
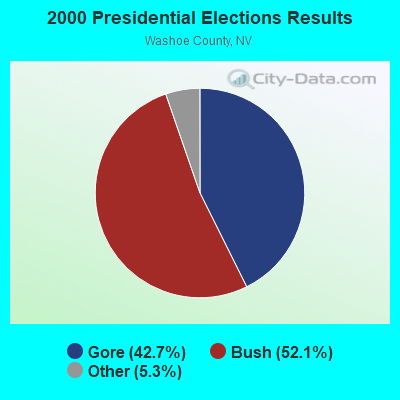
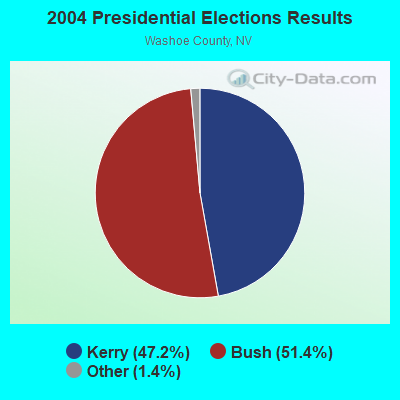
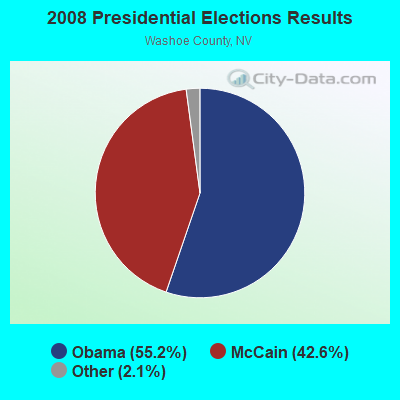
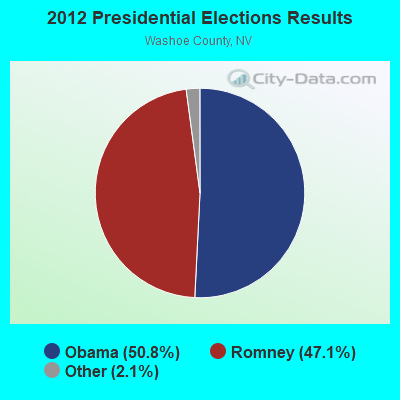
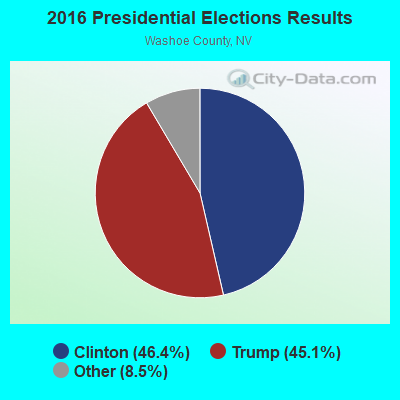
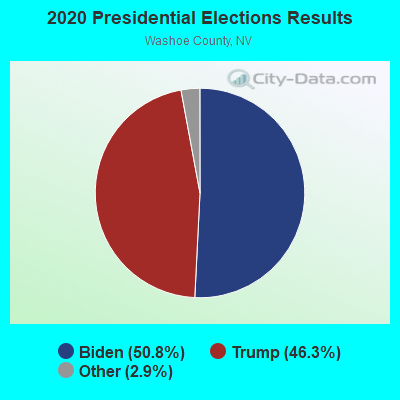
Graphs represent county-level data. Detailed 2008 Election Results
Religion statistics for High Desert, NV (based on Washoe County data)
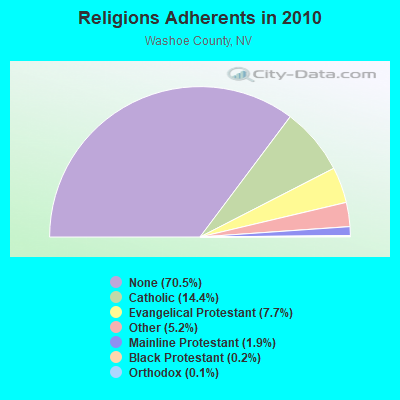
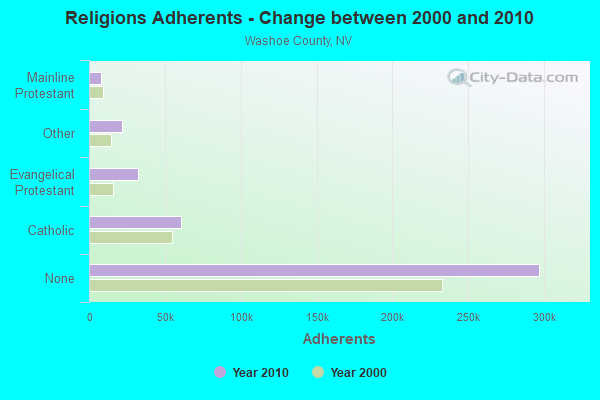
| Religion | Adherents | Congregations |
|---|---|---|
| Catholic | 60,509 | 13 |
| Evangelical Protestant | 32,557 | 109 |
| Other | 21,728 | 57 |
| Mainline Protestant | 8,194 | 28 |
| Black Protestant | 1,028 | 4 |
| Orthodox | 490 | 3 |
| None | 296,901 | - |
Food Environment Statistics:
| Washoe County: | 1.38 / 10,000 pop. |
| Nevada: | 1.50 / 10,000 pop. |
| Washoe County: | 0.12 / 10,000 pop. |
| Nevada: | 0.10 / 10,000 pop. |
| Washoe County: | 0.99 / 10,000 pop. |
| State: | 1.00 / 10,000 pop. |
| Washoe County: | 2.69 / 10,000 pop. |
| Nevada: | 2.56 / 10,000 pop. |
| Washoe County: | 6.99 / 10,000 pop. |
| Nevada: | 6.14 / 10,000 pop. |
| Washoe County: | 6.5% |
| Nevada: | 8.2% |
| This county: | 21.2% |
| State: | 24.5% |
| Washoe County: | 14.3% |
| State: | 13.2% |
6.72% of this county's 2021 resident taxpayers lived in other counties in 2020 ($145,713 average adjusted gross income)
| Here: | 6.72% |
| Nevada average: | 6.67% |
0.01% of residents moved from foreign countries ($163 average AGI)
Washoe County: 0.01% Nevada average: 0.05%
Top counties from which taxpayers relocated into this county between 2020 and 2021:
| from Clark County, NV | |
| from Lyon County, NV | |
| from Los Angeles County, CA |
6.06% of this county's 2020 resident taxpayers moved to other counties in 2021 ($85,171 average adjusted gross income)
| Here: | 6.06% |
| Nevada average: | 5.77% |
0.01% of residents moved to foreign countries ($110 average AGI)
Washoe County: 0.01% Nevada average: 0.04%
Top counties to which taxpayers relocated from this county between 2020 and 2021:
| to Clark County, NV | |
| to Lyon County, NV | |
| to Carson City, NV |
Strongest AM radio stations in High Desert:
- KKOH (780 AM; 50 kW; RENO, NV; Owner: CITADEL BROADCASTING COMPANY)
- KCFJ (570 AM; 5 kW; ALTURAS, CA; Owner: EDI MEDIA, INC.)
- KCBC (770 AM; 50 kW; RIVERBANK, CA; Owner: KIERTRON, INC.)
- KHTK (1140 AM; 50 kW; SACRAMENTO, CA; Owner: INFINITY RADIO SUBSIDIARY OPERATIONS INC.)
- KFIA (710 AM; 25 kW; CARMICHAEL, CA; Owner: VISTA BROADCASTING INC.)
- KBZZ (1270 AM; 13 kW; SPARKS, NV; Owner: AMERICOM LAS VEGAS LIMITED PARTNERSHIP)
- KBOI (670 AM; 50 kW; BOISE, ID; Owner: CITADEL BROADCASTING COMPANY)
- KFBK (1530 AM; 50 kW; SACRAMENTO, CA; Owner: AMFM RADIO LICENSES, L.L.C.)
- KCBS (740 AM; 50 kW; SAN FRANCISCO, CA; Owner: INFINITY BROADCASTING OPERATIONS, INC.)
- KSTE (650 AM; 25 kW; RANCHO CORDOVA, CA; Owner: AMFM RADIO LICENSES, L.L.C.)
- KNBR (680 AM; 50 kW; SAN FRANCISCO, CA; Owner: KNBR LICO, INC.)
- KMJ (580 AM; 50 kW; FRESNO, CA; Owner: INFINITY RADIO OPERATIONS INC.)
- KPTT (630 AM; 5 kW; RENO, NV; Owner: LOTUS RADIO CORP.)
Strongest FM radio stations in High Desert:
- K278AB (103.5 FM; ALTURAS, CA; Owner: THE UNIV FOUND, CA STATE UNIV, CHICO)

- 71.7%Bottled, tank, or LP gas
- 17.3%Wood
- 8.7%Fuel oil, kerosene, etc.
- 2.4%Other fuel

- 60.5%Bottled, tank, or LP gas
- 14.7%Electricity
- 10.9%Wood
- 9.2%Utility gas
- 4.6%Fuel oil, kerosene, etc.
High Desert compared to Nevada state average:
- Median household income below state average.
- Median house value below state average.
- Unemployed percentage significantly below state average.
- Black race population percentage significantly below state average.
- Foreign-born population percentage significantly below state average.
- Length of stay since moving in significantly above state average.
- Number of rooms per house significantly below state average.
- House age significantly below state average.
- Institutionalized population percentage significantly above state average.
- Percentage of population with a bachelor's degree or higher below state average.
High Desert on our top lists:
- #5 on the list of "Top 101 cities with the largest percentage of people in agriculture workers' dormitories on farms (population 1,000+)"
- #8 on the list of "Top 100 cities with largest land areas"
- #86 on the list of "Top 100 highest located cities (pop. 50,000+)"
- #6 on the list of "Top 101 counties with the largest increase in the number of infant deaths per 1000 residents 2000-2006 to 2007-2013 (pop. 50,000+)"
- #27 on the list of "Top 101 counties with the lowest Sulfur Oxides Annual air pollution readings in 2012 (µg/m3)"
- #57 on the list of "Top 101 counties with the highest percentage of residents that exercised in the past month"
- #59 on the list of "Top 101 counties with the highest percentage of residents that keep firearms around their homes"
- #70 on the list of "Top 101 counties with the highest Nitrogen Dioxide air pollution readings in 2012 (ppm)"