Heath, Ohio Submit your own pictures of this city and show them to the world
OSM Map
General Map
Google Map
MSN Map
OSM Map
General Map
Google Map
MSN Map
OSM Map
General Map
Google Map
MSN Map
OSM Map
General Map
Google Map
MSN Map
Please wait while loading the map...
Population in 2022: 10,621 (97% urban, 3% rural). Population change since 2000: +24.6%Males: 4,934 Females: 5,687
March 2022 cost of living index in Heath: 94.2 (less than average, U.S. average is 100) Percentage of residents living in poverty in 2022: 9.4%for White Non-Hispanic residents , 0.6% for Black residents , 5.3% for Hispanic or Latino residents , 7.1% for two or more races residents )Business Search - 14 Million verified businesses
Data:
Median household income ($)
Median household income (% change since 2000)
Household income diversity
Ratio of average income to average house value (%)
Ratio of average income to average rent
Median household income ($) - White
Median household income ($) - Black or African American
Median household income ($) - Asian
Median household income ($) - Hispanic or Latino
Median household income ($) - American Indian and Alaska Native
Median household income ($) - Multirace
Median household income ($) - Other Race
Median household income for houses/condos with a mortgage ($)
Median household income for apartments without a mortgage ($)
Races - White alone (%)
Races - White alone (% change since 2000)
Races - Black alone (%)
Races - Black alone (% change since 2000)
Races - American Indian alone (%)
Races - American Indian alone (% change since 2000)
Races - Asian alone (%)
Races - Asian alone (% change since 2000)
Races - Hispanic (%)
Races - Hispanic (% change since 2000)
Races - Native Hawaiian and Other Pacific Islander alone (%)
Races - Native Hawaiian and Other Pacific Islander alone (% change since 2000)
Races - Two or more races (%)
Races - Two or more races (% change since 2000)
Races - Other race alone (%)
Races - Other race alone (% change since 2000)
Racial diversity
Unemployment (%)
Unemployment (% change since 2000)
Unemployment (%) - White
Unemployment (%) - Black or African American
Unemployment (%) - Asian
Unemployment (%) - Hispanic or Latino
Unemployment (%) - American Indian and Alaska Native
Unemployment (%) - Multirace
Unemployment (%) - Other Race
Population density (people per square mile)
Population - Males (%)
Population - Females (%)
Population - Males (%) - White
Population - Males (%) - Black or African American
Population - Males (%) - Asian
Population - Males (%) - Hispanic or Latino
Population - Males (%) - American Indian and Alaska Native
Population - Males (%) - Multirace
Population - Males (%) - Other Race
Population - Females (%) - White
Population - Females (%) - Black or African American
Population - Females (%) - Asian
Population - Females (%) - Hispanic or Latino
Population - Females (%) - American Indian and Alaska Native
Population - Females (%) - Multirace
Population - Females (%) - Other Race
Coronavirus confirmed cases (May 16, 2024)
Deaths caused by coronavirus (May 16, 2024)
Coronavirus confirmed cases (per 100k population) (May 16, 2024)
Deaths caused by coronavirus (per 100k population) (May 16, 2024)
Daily increase in number of cases (May 16, 2024)
Weekly increase in number of cases (May 16, 2024)
Cases doubled (in days) (May 16, 2024)
Hospitalized patients (Apr 18, 2022)
Negative test results (Apr 18, 2022)
Total test results (Apr 18, 2022)
COVID Vaccine doses distributed (per 100k population) (Sep 19, 2023)
COVID Vaccine doses administered (per 100k population) (Sep 19, 2023)
COVID Vaccine doses distributed (Sep 19, 2023)
COVID Vaccine doses administered (Sep 19, 2023)
Likely homosexual households (%)
Likely homosexual households (% change since 2000)
Likely homosexual households - Lesbian couples (%)
Likely homosexual households - Lesbian couples (% change since 2000)
Likely homosexual households - Gay men (%)
Likely homosexual households - Gay men (% change since 2000)
Cost of living index
Median gross rent ($)
Median contract rent ($)
Median monthly housing costs ($)
Median house or condo value ($)
Median house or condo value ($ change since 2000)
Mean house or condo value by units in structure - 1, detached ($)
Mean house or condo value by units in structure - 1, attached ($)
Mean house or condo value by units in structure - 2 ($)
Mean house or condo value by units in structure by units in structure - 3 or 4 ($)
Mean house or condo value by units in structure - 5 or more ($)
Mean house or condo value by units in structure - Boat, RV, van, etc. ($)
Mean house or condo value by units in structure - Mobile home ($)
Median house or condo value ($) - White
Median house or condo value ($) - Black or African American
Median house or condo value ($) - Asian
Median house or condo value ($) - Hispanic or Latino
Median house or condo value ($) - American Indian and Alaska Native
Median house or condo value ($) - Multirace
Median house or condo value ($) - Other Race
Median resident age
Resident age diversity
Median resident age - Males
Median resident age - Females
Median resident age - White
Median resident age - Black or African American
Median resident age - Asian
Median resident age - Hispanic or Latino
Median resident age - American Indian and Alaska Native
Median resident age - Multirace
Median resident age - Other Race
Median resident age - Males - White
Median resident age - Males - Black or African American
Median resident age - Males - Asian
Median resident age - Males - Hispanic or Latino
Median resident age - Males - American Indian and Alaska Native
Median resident age - Males - Multirace
Median resident age - Males - Other Race
Median resident age - Females - White
Median resident age - Females - Black or African American
Median resident age - Females - Asian
Median resident age - Females - Hispanic or Latino
Median resident age - Females - American Indian and Alaska Native
Median resident age - Females - Multirace
Median resident age - Females - Other Race
Commute - mean travel time to work (minutes)
Travel time to work - Less than 5 minutes (%)
Travel time to work - Less than 5 minutes (% change since 2000)
Travel time to work - 5 to 9 minutes (%)
Travel time to work - 5 to 9 minutes (% change since 2000)
Travel time to work - 10 to 19 minutes (%)
Travel time to work - 10 to 19 minutes (% change since 2000)
Travel time to work - 20 to 29 minutes (%)
Travel time to work - 20 to 29 minutes (% change since 2000)
Travel time to work - 30 to 39 minutes (%)
Travel time to work - 30 to 39 minutes (% change since 2000)
Travel time to work - 40 to 59 minutes (%)
Travel time to work - 40 to 59 minutes (% change since 2000)
Travel time to work - 60 to 89 minutes (%)
Travel time to work - 60 to 89 minutes (% change since 2000)
Travel time to work - 90 or more minutes (%)
Travel time to work - 90 or more minutes (% change since 2000)
Marital status - Never married (%)
Marital status - Now married (%)
Marital status - Separated (%)
Marital status - Widowed (%)
Marital status - Divorced (%)
Median family income ($)
Median family income (% change since 2000)
Median non-family income ($)
Median non-family income (% change since 2000)
Median per capita income ($)
Median per capita income (% change since 2000)
Median family income ($) - White
Median family income ($) - Black or African American
Median family income ($) - Asian
Median family income ($) - Hispanic or Latino
Median family income ($) - American Indian and Alaska Native
Median family income ($) - Multirace
Median family income ($) - Other Race
Median year house/condo built
Median year apartment built
Year house built - Built 2005 or later (%)
Year house built - Built 2000 to 2004 (%)
Year house built - Built 1990 to 1999 (%)
Year house built - Built 1980 to 1989 (%)
Year house built - Built 1970 to 1979 (%)
Year house built - Built 1960 to 1969 (%)
Year house built - Built 1950 to 1959 (%)
Year house built - Built 1940 to 1949 (%)
Year house built - Built 1939 or earlier (%)
Average household size
Household density (households per square mile)
Average household size - White
Average household size - Black or African American
Average household size - Asian
Average household size - Hispanic or Latino
Average household size - American Indian and Alaska Native
Average household size - Multirace
Average household size - Other Race
Occupied housing units (%)
Vacant housing units (%)
Owner occupied housing units (%)
Renter occupied housing units (%)
Vacancy status - For rent (%)
Vacancy status - For sale only (%)
Vacancy status - Rented or sold, not occupied (%)
Vacancy status - For seasonal, recreational, or occasional use (%)
Vacancy status - For migrant workers (%)
Vacancy status - Other vacant (%)
Residents with income below the poverty level (%)
Residents with income below 50% of the poverty level (%)
Children below poverty level (%)
Poor families by family type - Married-couple family (%)
Poor families by family type - Male, no wife present (%)
Poor families by family type - Female, no husband present (%)
Poverty status for native-born residents (%)
Poverty status for foreign-born residents (%)
Poverty among high school graduates not in families (%)
Poverty among people who did not graduate high school not in families (%)
Residents with income below the poverty level (%) - White
Residents with income below the poverty level (%) - Black or African American
Residents with income below the poverty level (%) - Asian
Residents with income below the poverty level (%) - Hispanic or Latino
Residents with income below the poverty level (%) - American Indian and Alaska Native
Residents with income below the poverty level (%) - Multirace
Residents with income below the poverty level (%) - Other Race
Air pollution - Air Quality Index (AQI)
Air pollution - CO
Air pollution - NO2
Air pollution - SO2
Air pollution - Ozone
Air pollution - PM10
Air pollution - PM25
Air pollution - Pb
Crime - Murders per 100,000 population
Crime - Rapes per 100,000 population
Crime - Robberies per 100,000 population
Crime - Assaults per 100,000 population
Crime - Burglaries per 100,000 population
Crime - Thefts per 100,000 population
Crime - Auto thefts per 100,000 population
Crime - Arson per 100,000 population
Crime - City-data.com crime index
Crime - Violent crime index
Crime - Property crime index
Crime - Murders per 100,000 population (5 year average)
Crime - Rapes per 100,000 population (5 year average)
Crime - Robberies per 100,000 population (5 year average)
Crime - Assaults per 100,000 population (5 year average)
Crime - Burglaries per 100,000 population (5 year average)
Crime - Thefts per 100,000 population (5 year average)
Crime - Auto thefts per 100,000 population (5 year average)
Crime - Arson per 100,000 population (5 year average)
Crime - City-data.com crime index (5 year average)
Crime - Violent crime index (5 year average)
Crime - Property crime index (5 year average)
1996 Presidential Elections Results (%) - Democratic Party (Clinton)
1996 Presidential Elections Results (%) - Republican Party (Dole)
1996 Presidential Elections Results (%) - Other
2000 Presidential Elections Results (%) - Democratic Party (Gore)
2000 Presidential Elections Results (%) - Republican Party (Bush)
2000 Presidential Elections Results (%) - Other
2004 Presidential Elections Results (%) - Democratic Party (Kerry)
2004 Presidential Elections Results (%) - Republican Party (Bush)
2004 Presidential Elections Results (%) - Other
2008 Presidential Elections Results (%) - Democratic Party (Obama)
2008 Presidential Elections Results (%) - Republican Party (McCain)
2008 Presidential Elections Results (%) - Other
2012 Presidential Elections Results (%) - Democratic Party (Obama)
2012 Presidential Elections Results (%) - Republican Party (Romney)
2012 Presidential Elections Results (%) - Other
2016 Presidential Elections Results (%) - Democratic Party (Clinton)
2016 Presidential Elections Results (%) - Republican Party (Trump)
2016 Presidential Elections Results (%) - Other
2020 Presidential Elections Results (%) - Democratic Party (Biden)
2020 Presidential Elections Results (%) - Republican Party (Trump)
2020 Presidential Elections Results (%) - Other
Ancestries Reported - Arab (%)
Ancestries Reported - Czech (%)
Ancestries Reported - Danish (%)
Ancestries Reported - Dutch (%)
Ancestries Reported - English (%)
Ancestries Reported - French (%)
Ancestries Reported - French Canadian (%)
Ancestries Reported - German (%)
Ancestries Reported - Greek (%)
Ancestries Reported - Hungarian (%)
Ancestries Reported - Irish (%)
Ancestries Reported - Italian (%)
Ancestries Reported - Lithuanian (%)
Ancestries Reported - Norwegian (%)
Ancestries Reported - Polish (%)
Ancestries Reported - Portuguese (%)
Ancestries Reported - Russian (%)
Ancestries Reported - Scotch-Irish (%)
Ancestries Reported - Scottish (%)
Ancestries Reported - Slovak (%)
Ancestries Reported - Subsaharan African (%)
Ancestries Reported - Swedish (%)
Ancestries Reported - Swiss (%)
Ancestries Reported - Ukrainian (%)
Ancestries Reported - United States (%)
Ancestries Reported - Welsh (%)
Ancestries Reported - West Indian (%)
Ancestries Reported - Other (%)
Educational Attainment - No schooling completed (%)
Educational Attainment - Less than high school (%)
Educational Attainment - High school or equivalent (%)
Educational Attainment - Less than 1 year of college (%)
Educational Attainment - 1 or more years of college (%)
Educational Attainment - Associate degree (%)
Educational Attainment - Bachelor's degree (%)
Educational Attainment - Master's degree (%)
Educational Attainment - Professional school degree (%)
Educational Attainment - Doctorate degree (%)
School Enrollment - Nursery, preschool (%)
School Enrollment - Kindergarten (%)
School Enrollment - Grade 1 to 4 (%)
School Enrollment - Grade 5 to 8 (%)
School Enrollment - Grade 9 to 12 (%)
School Enrollment - College undergrad (%)
School Enrollment - Graduate or professional (%)
School Enrollment - Not enrolled in school (%)
School enrollment - Public schools (%)
School enrollment - Private schools (%)
School enrollment - Not enrolled (%)
Median number of rooms in houses and condos
Median number of rooms in apartments
Housing units lacking complete plumbing facilities (%)
Housing units lacking complete kitchen facilities (%)
Density of houses
Urban houses (%)
Rural houses (%)
Households with people 60 years and over (%)
Households with people 65 years and over (%)
Households with people 75 years and over (%)
Households with one or more nonrelatives (%)
Households with no nonrelatives (%)
Population in households (%)
Family households (%)
Nonfamily households (%)
Population in families (%)
Family households with own children (%)
Median number of bedrooms in owner occupied houses
Mean number of bedrooms in owner occupied houses
Median number of bedrooms in renter occupied houses
Mean number of bedrooms in renter occupied houses
Median number of vehichles in owner occupied houses
Mean number of vehichles in owner occupied houses
Median number of vehichles in renter occupied houses
Mean number of vehichles in renter occupied houses
Mortgage status - with mortgage (%)
Mortgage status - with second mortgage (%)
Mortgage status - with home equity loan (%)
Mortgage status - with both second mortgage and home equity loan (%)
Mortgage status - without a mortgage (%)
Average family size
Average family size - White
Average family size - Black or African American
Average family size - Asian
Average family size - Hispanic or Latino
Average family size - American Indian and Alaska Native
Average family size - Multirace
Average family size - Other Race
Geographical mobility - Same house 1 year ago (%)
Geographical mobility - Moved within same county (%)
Geographical mobility - Moved from different county within same state (%)
Geographical mobility - Moved from different state (%)
Geographical mobility - Moved from abroad (%)
Place of birth - Born in state of residence (%)
Place of birth - Born in other state (%)
Place of birth - Native, outside of US (%)
Place of birth - Foreign born (%)
Housing units in structures - 1, detached (%)
Housing units in structures - 1, attached (%)
Housing units in structures - 2 (%)
Housing units in structures - 3 or 4 (%)
Housing units in structures - 5 to 9 (%)
Housing units in structures - 10 to 19 (%)
Housing units in structures - 20 to 49 (%)
Housing units in structures - 50 or more (%)
Housing units in structures - Mobile home (%)
Housing units in structures - Boat, RV, van, etc. (%)
House/condo owner moved in on average (years ago)
Renter moved in on average (years ago)
Year householder moved into unit - Moved in 1999 to March 2000 (%)
Year householder moved into unit - Moved in 1995 to 1998 (%)
Year householder moved into unit - Moved in 1990 to 1994 (%)
Year householder moved into unit - Moved in 1980 to 1989 (%)
Year householder moved into unit - Moved in 1970 to 1979 (%)
Year householder moved into unit - Moved in 1969 or earlier (%)
Means of transportation to work - Drove car alone (%)
Means of transportation to work - Carpooled (%)
Means of transportation to work - Public transportation (%)
Means of transportation to work - Bus or trolley bus (%)
Means of transportation to work - Streetcar or trolley car (%)
Means of transportation to work - Subway or elevated (%)
Means of transportation to work - Railroad (%)
Means of transportation to work - Ferryboat (%)
Means of transportation to work - Taxicab (%)
Means of transportation to work - Motorcycle (%)
Means of transportation to work - Bicycle (%)
Means of transportation to work - Walked (%)
Means of transportation to work - Other means (%)
Working at home (%)
Industry diversity
Most Common Industries - Agriculture, forestry, fishing and hunting, and mining (%)
Most Common Industries - Agriculture, forestry, fishing and hunting (%)
Most Common Industries - Mining, quarrying, and oil and gas extraction (%)
Most Common Industries - Construction (%)
Most Common Industries - Manufacturing (%)
Most Common Industries - Wholesale trade (%)
Most Common Industries - Retail trade (%)
Most Common Industries - Transportation and warehousing, and utilities (%)
Most Common Industries - Transportation and warehousing (%)
Most Common Industries - Utilities (%)
Most Common Industries - Information (%)
Most Common Industries - Finance and insurance, and real estate and rental and leasing (%)
Most Common Industries - Finance and insurance (%)
Most Common Industries - Real estate and rental and leasing (%)
Most Common Industries - Professional, scientific, and management, and administrative and waste management services (%)
Most Common Industries - Professional, scientific, and technical services (%)
Most Common Industries - Management of companies and enterprises (%)
Most Common Industries - Administrative and support and waste management services (%)
Most Common Industries - Educational services, and health care and social assistance (%)
Most Common Industries - Educational services (%)
Most Common Industries - Health care and social assistance (%)
Most Common Industries - Arts, entertainment, and recreation, and accommodation and food services (%)
Most Common Industries - Arts, entertainment, and recreation (%)
Most Common Industries - Accommodation and food services (%)
Most Common Industries - Other services, except public administration (%)
Most Common Industries - Public administration (%)
Occupation diversity
Most Common Occupations - Management, business, science, and arts occupations (%)
Most Common Occupations - Management, business, and financial occupations (%)
Most Common Occupations - Management occupations (%)
Most Common Occupations - Business and financial operations occupations (%)
Most Common Occupations - Computer, engineering, and science occupations (%)
Most Common Occupations - Computer and mathematical occupations (%)
Most Common Occupations - Architecture and engineering occupations (%)
Most Common Occupations - Life, physical, and social science occupations (%)
Most Common Occupations - Education, legal, community service, arts, and media occupations (%)
Most Common Occupations - Community and social service occupations (%)
Most Common Occupations - Legal occupations (%)
Most Common Occupations - Education, training, and library occupations (%)
Most Common Occupations - Arts, design, entertainment, sports, and media occupations (%)
Most Common Occupations - Healthcare practitioners and technical occupations (%)
Most Common Occupations - Health diagnosing and treating practitioners and other technical occupations (%)
Most Common Occupations - Health technologists and technicians (%)
Most Common Occupations - Service occupations (%)
Most Common Occupations - Healthcare support occupations (%)
Most Common Occupations - Protective service occupations (%)
Most Common Occupations - Fire fighting and prevention, and other protective service workers including supervisors (%)
Most Common Occupations - Law enforcement workers including supervisors (%)
Most Common Occupations - Food preparation and serving related occupations (%)
Most Common Occupations - Building and grounds cleaning and maintenance occupations (%)
Most Common Occupations - Personal care and service occupations (%)
Most Common Occupations - Sales and office occupations (%)
Most Common Occupations - Sales and related occupations (%)
Most Common Occupations - Office and administrative support occupations (%)
Most Common Occupations - Natural resources, construction, and maintenance occupations (%)
Most Common Occupations - Farming, fishing, and forestry occupations (%)
Most Common Occupations - Construction and extraction occupations (%)
Most Common Occupations - Installation, maintenance, and repair occupations (%)
Most Common Occupations - Production, transportation, and material moving occupations (%)
Most Common Occupations - Production occupations (%)
Most Common Occupations - Transportation occupations (%)
Most Common Occupations - Material moving occupations (%)
People in Group quarters - Institutionalized population (%)
People in Group quarters - Correctional institutions (%)
People in Group quarters - Federal prisons and detention centers (%)
People in Group quarters - Halfway houses (%)
People in Group quarters - Local jails and other confinement facilities (including police lockups) (%)
People in Group quarters - Military disciplinary barracks (%)
People in Group quarters - State prisons (%)
People in Group quarters - Other types of correctional institutions (%)
People in Group quarters - Nursing homes (%)
People in Group quarters - Hospitals/wards, hospices, and schools for the handicapped (%)
People in Group quarters - Hospitals/wards and hospices for chronically ill (%)
People in Group quarters - Hospices or homes for chronically ill (%)
People in Group quarters - Military hospitals or wards for chronically ill (%)
People in Group quarters - Other hospitals or wards for chronically ill (%)
People in Group quarters - Hospitals or wards for drug/alcohol abuse (%)
People in Group quarters - Mental (Psychiatric) hospitals or wards (%)
People in Group quarters - Schools, hospitals, or wards for the mentally retarded (%)
People in Group quarters - Schools, hospitals, or wards for the physically handicapped (%)
People in Group quarters - Institutions for the deaf (%)
People in Group quarters - Institutions for the blind (%)
People in Group quarters - Orthopedic wards and institutions for the physically handicapped (%)
People in Group quarters - Wards in general hospitals for patients who have no usual home elsewhere (%)
People in Group quarters - Wards in military hospitals for patients who have no usual home elsewhere (%)
People in Group quarters - Juvenile institutions (%)
People in Group quarters - Long-term care (%)
People in Group quarters - Homes for abused, dependent, and neglected children (%)
People in Group quarters - Residential treatment centers for emotionally disturbed children (%)
People in Group quarters - Training schools for juvenile delinquents (%)
People in Group quarters - Short-term care, detention or diagnostic centers for delinquent children (%)
People in Group quarters - Type of juvenile institution unknown (%)
People in Group quarters - Noninstitutionalized population (%)
People in Group quarters - College dormitories (includes college quarters off campus) (%)
People in Group quarters - Military quarters (%)
People in Group quarters - On base (%)
People in Group quarters - Barracks, unaccompanied personnel housing (UPH), (Enlisted/Officer), ;and similar group living quarters for military personnel (%)
People in Group quarters - Transient quarters for temporary residents (%)
People in Group quarters - Military ships (%)
People in Group quarters - Group homes (%)
People in Group quarters - Homes or halfway houses for drug/alcohol abuse (%)
People in Group quarters - Homes for the mentally ill (%)
People in Group quarters - Homes for the mentally retarded (%)
People in Group quarters - Homes for the physically handicapped (%)
People in Group quarters - Other group homes (%)
People in Group quarters - Religious group quarters (%)
People in Group quarters - Dormitories (%)
People in Group quarters - Agriculture workers' dormitories on farms (%)
People in Group quarters - Job Corps and vocational training facilities (%)
People in Group quarters - Other workers' dormitories (%)
People in Group quarters - Crews of maritime vessels (%)
People in Group quarters - Other nonhousehold living situations (%)
People in Group quarters - Other noninstitutional group quarters (%)
Residents speaking English at home (%)
Residents speaking English at home - Born in the United States (%)
Residents speaking English at home - Native, born elsewhere (%)
Residents speaking English at home - Foreign born (%)
Residents speaking Spanish at home (%)
Residents speaking Spanish at home - Born in the United States (%)
Residents speaking Spanish at home - Native, born elsewhere (%)
Residents speaking Spanish at home - Foreign born (%)
Residents speaking other language at home (%)
Residents speaking other language at home - Born in the United States (%)
Residents speaking other language at home - Native, born elsewhere (%)
Residents speaking other language at home - Foreign born (%)
Class of Workers - Employee of private company (%)
Class of Workers - Self-employed in own incorporated business (%)
Class of Workers - Private not-for-profit wage and salary workers (%)
Class of Workers - Local government workers (%)
Class of Workers - State government workers (%)
Class of Workers - Federal government workers (%)
Class of Workers - Self-employed workers in own not incorporated business and Unpaid family workers (%)
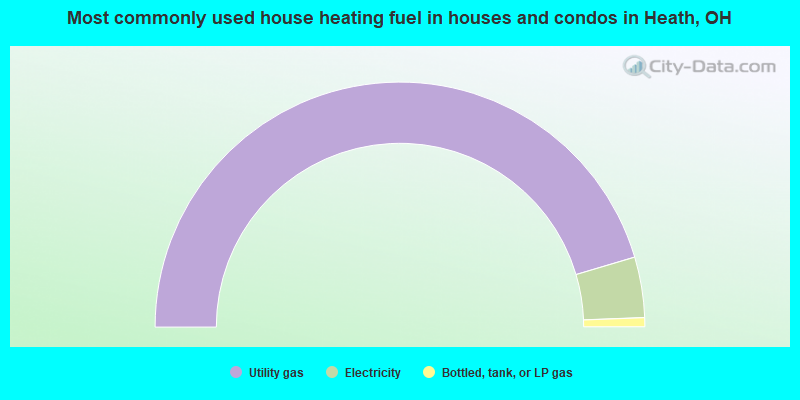
House heating fuel used in houses and condos - Utility gas (%)
House heating fuel used in houses and condos - Bottled, tank, or LP gas (%)
House heating fuel used in houses and condos - Electricity (%)
House heating fuel used in houses and condos - Fuel oil, kerosene, etc. (%)
House heating fuel used in houses and condos - Coal or coke (%)
House heating fuel used in houses and condos - Wood (%)
House heating fuel used in houses and condos - Solar energy (%)
House heating fuel used in houses and condos - Other fuel (%)
House heating fuel used in houses and condos - No fuel used (%)
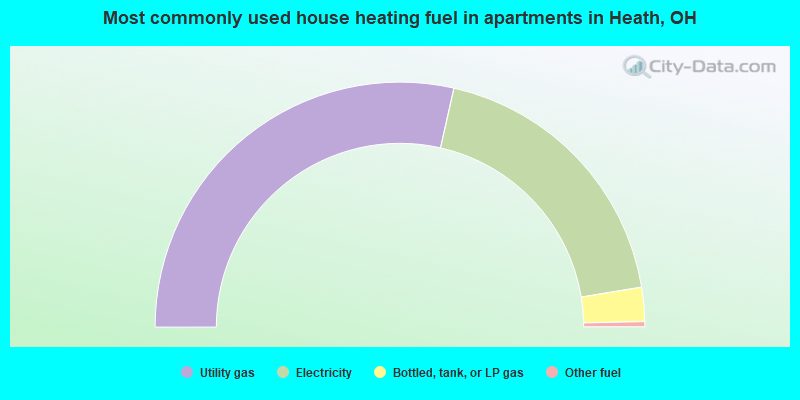
House heating fuel used in apartments - Utility gas (%)
House heating fuel used in apartments - Bottled, tank, or LP gas (%)
House heating fuel used in apartments - Electricity (%)
House heating fuel used in apartments - Fuel oil, kerosene, etc. (%)
House heating fuel used in apartments - Coal or coke (%)
House heating fuel used in apartments - Wood (%)
House heating fuel used in apartments - Solar energy (%)
House heating fuel used in apartments - Other fuel (%)
House heating fuel used in apartments - No fuel used (%)
Armed forces status - In Armed Forces (%)
Armed forces status - Civilian (%)
Armed forces status - Civilian - Veteran (%)
Armed forces status - Civilian - Nonveteran (%)
Fatal accidents locations in years 2005-2021
Fatal accidents locations in 2005
Fatal accidents locations in 2006
Fatal accidents locations in 2007
Fatal accidents locations in 2008
Fatal accidents locations in 2009
Fatal accidents locations in 2010
Fatal accidents locations in 2011
Fatal accidents locations in 2012
Fatal accidents locations in 2013
Fatal accidents locations in 2014
Fatal accidents locations in 2015
Fatal accidents locations in 2016
Fatal accidents locations in 2017
Fatal accidents locations in 2018
Fatal accidents locations in 2019
Fatal accidents locations in 2020
Fatal accidents locations in 2021
Alcohol use - People drinking some alcohol every month (%)
Alcohol use - People not drinking at all (%)
Alcohol use - Average days/month drinking alcohol
Alcohol use - Average drinks/week
Alcohol use - Average days/year people drink much
Audiometry - Average condition of hearing (%)
Audiometry - People that can hear a whisper from across a quiet room (%)
Audiometry - People that can hear normal voice from across a quiet room (%)
Audiometry - Ears ringing, roaring, buzzing (%)
Audiometry - Had a job exposure to loud noise (%)
Audiometry - Had off-work exposure to loud noise (%)
Blood Pressure & Cholesterol - Has high blood pressure (%)
Blood Pressure & Cholesterol - Checking blood pressure at home (%)
Blood Pressure & Cholesterol - Frequently checking blood cholesterol (%)
Blood Pressure & Cholesterol - Has high cholesterol level (%)
Consumer Behavior - Money monthly spent on food at supermarket/grocery store
Consumer Behavior - Money monthly spent on food at other stores
Consumer Behavior - Money monthly spent on eating out
Consumer Behavior - Money monthly spent on carryout/delivered foods
Consumer Behavior - Income spent on food at supermarket/grocery store (%)
Consumer Behavior - Income spent on food at other stores (%)
Consumer Behavior - Income spent on eating out (%)
Consumer Behavior - Income spent on carryout/delivered foods (%)
Current Health Status - General health condition (%)
Current Health Status - Blood donors (%)
Current Health Status - Has blood ever tested for HIV virus (%)
Current Health Status - Left-handed people (%)
Dermatology - People using sunscreen (%)
Diabetes - Diabetics (%)
Diabetes - Had a blood test for high blood sugar (%)
Diabetes - People taking insulin (%)
Diet Behavior & Nutrition - Diet health (%)
Diet Behavior & Nutrition - Milk product consumption (# of products/month)
Diet Behavior & Nutrition - Meals not home prepared (#/week)
Diet Behavior & Nutrition - Meals from fast food or pizza place (#/week)
Diet Behavior & Nutrition - Ready-to-eat foods (#/month)
Diet Behavior & Nutrition - Frozen meals/pizza (#/month)
Drug Use - People that ever used marijuana or hashish (%)
Drug Use - Ever used hard drugs (%)
Drug Use - Ever used any form of cocaine (%)
Drug Use - Ever used heroin (%)
Drug Use - Ever used methamphetamine (%)
Health Insurance - People covered by health insurance (%)
Kidney Conditions-Urology - Avg. # of times urinating at night
Medical Conditions - People with asthma (%)
Medical Conditions - People with anemia (%)
Medical Conditions - People with psoriasis (%)
Medical Conditions - People with overweight (%)
Medical Conditions - Elderly people having difficulties in thinking or remembering (%)
Medical Conditions - People who ever received blood transfusion (%)
Medical Conditions - People having trouble seeing even with glass/contacts (%)
Medical Conditions - People with arthritis (%)
Medical Conditions - People with gout (%)
Medical Conditions - People with congestive heart failure (%)
Medical Conditions - People with coronary heart disease (%)
Medical Conditions - People with angina pectoris (%)
Medical Conditions - People who ever had heart attack (%)
Medical Conditions - People who ever had stroke (%)
Medical Conditions - People with emphysema (%)
Medical Conditions - People with thyroid problem (%)
Medical Conditions - People with chronic bronchitis (%)
Medical Conditions - People with any liver condition (%)
Medical Conditions - People who ever had cancer or malignancy (%)
Mental Health - People who have little interest in doing things (%)
Mental Health - People feeling down, depressed, or hopeless (%)
Mental Health - People who have trouble sleeping or sleeping too much (%)
Mental Health - People feeling tired or having little energy (%)
Mental Health - People with poor appetite or overeating (%)
Mental Health - People feeling bad about themself (%)
Mental Health - People who have trouble concentrating on things (%)
Mental Health - People moving or speaking slowly or too fast (%)
Mental Health - People having thoughts they would be better off dead (%)
Oral Health - Average years since last visit a dentist
Oral Health - People embarrassed because of mouth (%)
Oral Health - People with gum disease (%)
Oral Health - General health of teeth and gums (%)
Oral Health - Average days a week using dental floss/device
Oral Health - Average days a week using mouthwash for dental problem
Oral Health - Average number of teeth
Pesticide Use - Households using pesticides to control insects (%)
Pesticide Use - Households using pesticides to kill weeds (%)
Physical Activity - People doing vigorous-intensity work activities (%)
Physical Activity - People doing moderate-intensity work activities (%)
Physical Activity - People walking or bicycling (%)
Physical Activity - People doing vigorous-intensity recreational activities (%)
Physical Activity - People doing moderate-intensity recreational activities (%)
Physical Activity - Average hours a day doing sedentary activities
Physical Activity - Average hours a day watching TV or videos
Physical Activity - Average hours a day using computer
Physical Functioning - People having limitations keeping them from working (%)
Physical Functioning - People limited in amount of work they can do (%)
Physical Functioning - People that need special equipment to walk (%)
Physical Functioning - People experiencing confusion/memory problems (%)
Physical Functioning - People requiring special healthcare equipment (%)
Prescription Medications - Average number of prescription medicines taking
Preventive Aspirin Use - Adults 40+ taking low-dose aspirin (%)
Reproductive Health - Vaginal deliveries (%)
Reproductive Health - Cesarean deliveries (%)
Reproductive Health - Deliveries resulted in a live birth (%)
Reproductive Health - Pregnancies resulted in a delivery (%)
Reproductive Health - Women breastfeeding newborns (%)
Reproductive Health - Women that had a hysterectomy (%)
Reproductive Health - Women that had both ovaries removed (%)
Reproductive Health - Women that have ever taken birth control pills (%)
Reproductive Health - Women taking birth control pills (%)
Reproductive Health - Women that have ever used Depo-Provera or injectables (%)
Reproductive Health - Women that have ever used female hormones (%)
Sexual Behavior - People 18+ that ever had sex (vaginal, anal, or oral) (%)
Sexual Behavior - Males 18+ that ever had vaginal sex with a woman (%)
Sexual Behavior - Males 18+ that ever performed oral sex on a woman (%)
Sexual Behavior - Males 18+ that ever had anal sex with a woman (%)
Sexual Behavior - Males 18+ that ever had any sex with a man (%)
Sexual Behavior - Females 18+ that ever had vaginal sex with a man (%)
Sexual Behavior - Females 18+ that ever performed oral sex on a man (%)
Sexual Behavior - Females 18+ that ever had anal sex with a man (%)
Sexual Behavior - Females 18+ that ever had any kind of sex with a woman (%)
Sexual Behavior - Average age people first had sex
Sexual Behavior - Average number of female sex partners in lifetime (males 18+)
Sexual Behavior - Average number of female vaginal sex partners in lifetime (males 18+)
Sexual Behavior - Average age people first performed oral sex on a woman (18+)
Sexual Behavior - Average number of woman performed oral sex on in lifetime (18+)
Sexual Behavior - Average number of male sex partners in lifetime (males 18+)
Sexual Behavior - Average number of male anal sex partners in lifetime (males 18+)
Sexual Behavior - Average age people first performed oral sex on a man (18+)
Sexual Behavior - Average number of male oral sex partners in lifetime (18+)
Sexual Behavior - People using protection when performing oral sex (%)
Sexual Behavior - Average number of times people have vaginal or anal sex a year
Sexual Behavior - People having sex without condom (%)
Sexual Behavior - Average number of male sex partners in lifetime (females 18+)
Sexual Behavior - Average number of male vaginal sex partners in lifetime (females 18+)
Sexual Behavior - Average number of female sex partners in lifetime (females 18+)
Sexual Behavior - Circumcised males 18+ (%)
Sleep Disorders - Average hours sleeping at night
Sleep Disorders - People that has trouble sleeping (%)
Smoking-Cigarette Use - People smoking cigarettes (%)
Taste & Smell - People 40+ having problems with smell (%)
Taste & Smell - People 40+ having problems with taste (%)
Taste & Smell - People 40+ that ever had wisdom teeth removed (%)
Taste & Smell - People 40+ that ever had tonsils teeth removed (%)
Taste & Smell - People 40+ that ever had a loss of consciousness because of a head injury (%)
Taste & Smell - People 40+ that ever had a broken nose or other serious injury to face or skull (%)
Taste & Smell - People 40+ that ever had two or more sinus infections (%)
Weight - Average height (inches)
Weight - Average weight (pounds)
Weight - Average BMI
Weight - People that are obese (%)
Weight - People that ever were obese (%)
Weight - People trying to lose weight (%)
According to our research of Ohio and other state lists, there were 16 registered sex offenders living in Heath, Ohio as of May 16, 2024 . The ratio of all residents to sex offenders in Heath is 656 to 1.The ratio of registered sex offenders to all residents in this city is near the state average.
Officers per 1,000 residents here:
1.72Ohio average:
2.24
Latest news from Heath, OH collected exclusively by city-data.com from local newspapers, TV, and radio stations
Ancestries: English (22.8%), American (19.8%), German (14.4%), Irish (10.4%), Italian (2.7%), Eastern European (2.0%).
Current Local Time:
Land area: 10.4 square miles.
Population density: 1,017 people per square mile (low).
159 residents are foreign born
Median real estate property taxes paid for housing units with mortgages in 2022: $3,072 (1.3%)Median real estate property taxes paid for housing units with no mortgage in 2022: $2,407 (1.3%)
Nearest city with pop. 50,000+: Columbus, OH
Nearest city with pop. 1,000,000+: Chicago, IL
Nearest cities:
Latitude: 40.03 N, Longitude: 82.44 W
Daytime population change due to commuting: +3,408 (+32.0%)Workers who live and work in this city: 1,610 (33.9%)
Area code commonly used in this area: 740
Single-family new house construction building permits:
1997: 13 buildings , average cost: $144,100Unemployment in December 2023:
Population change in the 1990s: +1,157 (+15.7%).
Most common occupations in Heath, OH (%)
Both Males Females
Other office and administrative support workers, including supervisors (6.8%)
Other production occupations, including supervisors (5.4%)
Material recording, scheduling, dispatching, and distributing workers (3.5%)
Other sales and related occupations, including supervisors (3.3%)
Laborers and material movers, hand (3.3%)
Retail sales workers, except cashiers (2.9%)
Metal workers and plastic workers (2.9%)
Other production occupations, including supervisors (8.5%)
Material recording, scheduling, dispatching, and distributing workers (5.3%)
Laborers and material movers, hand (5.2%)
Electrical equipment mechanics and other installation, maintenance, and repair workers, including supervisors (4.6%)
Other office and administrative support workers, including supervisors (4.1%)
Building and grounds cleaning and maintenance occupations (3.6%)
Driver/sales workers and truck drivers (3.5%)
Other office and administrative support workers, including supervisors (9.7%)
Secretaries and administrative assistants (5.5%)
Information and record clerks, except customer service representatives (4.1%)
Cashiers (3.8%)
Bookkeeping, accounting, and auditing clerks (3.7%)
Other financial specialists (3.4%)
Other sales and related occupations, including supervisors (3.2%)
Air pollution and air quality trends(lower is better)
AQI Ozone PM2.5
Tornado activity:
Heath-area historical tornado activity is slightly below Ohio state average. It is 3% greater than the overall U.S. average.
On 5/10/1973, a category F3 (max. wind speeds 158-206 mph) tornado 9.6 miles away from the Heath city center injured 8 people and caused between $500 and $5000 in damages.
On 5/31/1985, a category F3 tornado 17.8 miles away from the city center killed one person and injured 20 people and caused between $5,000,000 and $50,000,000 in damages.
Earthquake activity:
Heath-area historical earthquake activity is significantly above Ohio state average. It is 14% smaller than the overall U.S. average. On 9/25/1998 at 19:52:52, a magnitude 5.2 (4.8 MB, 4.3 MS, 5.2 LG, 4.5 MW, Depth: 3.1 mi, Class: Moderate, Intensity: VI - VII) earthquake occurred 147.0 miles away from Heath center On 7/27/1980 at 18:52:21, a magnitude 5.2 (5.1 MB, 4.7 MS, 5.0 UK, 5.2 UK) earthquake occurred 150.0 miles away from the city center On 8/23/2011 at 17:51:04, a magnitude 5.8 (5.8 MW, Depth: 3.7 mi) earthquake occurred 282.9 miles away from the city center On 1/31/1986 at 16:46:43, a magnitude 5.0 (5.0 MB) earthquake occurred 127.5 miles away from Heath center On 7/12/1986 at 08:19:37, a magnitude 4.5 (4.5 MB, Class: Light, Intensity: IV - V) earthquake occurred 107.9 miles away from Heath center On 9/7/1988 at 02:28:09, a magnitude 4.6 (4.5 MB, 4.6 LG) earthquake occurred 151.9 miles away from Heath center Magnitude types: regional Lg-wave magnitude (LG), body-wave magnitude (MB), surface-wave magnitude (MS), moment magnitude (MW) Natural disasters: The number of natural disasters in Licking County (15) is near the US average (15).Major Disasters (Presidential) Declared: 11Emergencies Declared: 3Storms: 9, Floods: 7, Tornadoes: 3, Mudslides: 2, Winds: 2, Blizzard: 1, Heavy Rain: 1, Hurricane: 1, Landslide: 1, Snow: 1, Snowstorm: 1, Tropical Depression: 1, Winter Storm: 1, Other: 1 (Note: some incidents may be assigned to more than one category). Hospitals and medical centers in Heath: CSS HOME III (1723 WATSON ROAD) MAXIM HEALTHCARE SERVICES INC (671 SOUTH 30TH STREET)
HEATH NURSING CARE CENTER (717 SOUTH 30TH STREET)
Airports located in Heath: Colleges/universities with over 2000 students nearest to Heath:
Ohio State University-Newark Campus (about 3 miles; Newark, OH ; Full-time enrollment: 2,028)
Central Ohio Technical College (about 3 miles; Newark, OH ; FT enrollment: 2,995)
Denison University (about 6 miles; Granville, OH ; FT enrollment: 2,268)
Zane State College (about 22 miles; Zanesville, OH ; FT enrollment: 2,200)
Ohio Dominican University (about 27 miles; Columbus, OH ; FT enrollment: 2,045)
Capital University (about 28 miles; Columbus, OH ; FT enrollment: 3,029)
Otterbein University (about 28 miles; Westerville, OH ; FT enrollment: 2,933)
Public high school in Heath:
Private high school in Heath: LICKING COUNTY CHRISTIAN ACADEMY Students: 193, Location: 81 LICKING VIEW DR, Grades: PK-12)
Public elementary/middle schools in Heath:
Private elementary/middle school in Heath: NEWARK SEVENTH-DAY ADVENTIST SCHOOL Students: 6, Location: 701 LINNVILLE RD, Grades: 5-8)
See full list of schools located in Heath
Notable locations in Heath: (A) , Heath Fire Department Station 1 Headquarters (B) , Heath Fire Department Station 2 (C) . Display/hide their locations on the map
Shopping Centers: (1) , Southgate Shopping Center (2) , Indian Mound Mall Shopping Center (3) . Display/hide their locations on the map
Church in Heath: (A) . Display/hide its location on the map
Cemetery: (1) . Display/hide its location on the map
Streams, rivers, and creeks: (A) , Ramp Creek (B) . Display/hide their locations on the map
Parks in Heath include: (1) , Heath Community Park (2) , Moundbuilders State Memorial (3) . Display/hide their locations on the map
Tourist attractions: (1) , Fun 4 U (Amusement & Theme Parks; 771 South 30th Street) (2) , John Hinderer Honda Power Store (Tours & Charters; 1555 Hebron Road) (3) . Display/hide their approximate locations on the map
Hotels: (1) , Hampton Inn (1008 Hebron Road) (2) , Holiday Inn Express Hotel & Suites (773 Hebron Road) (3) . Display/hide their approximate locations on the map
Licking County has a predicted average indoor radon screening level greater than 4 pCi/L (pico curies per liter) - Highest Potential Drinking water stations with addresses in Heath and their reported violations in the past:
WALDO DUCHESS SHOPPE 235 PWS (Population served: 2,006, Groundwater):
Past monitoring violations:
One minor monitoring violation
Drinking water stations with addresses in Heath that have no violations reported:
CITY OF HEATH PWS (Population served: 10,000, Primary Water Source Type: Groundwater)
THORNVILLE DUKE AND DUCHESS PWS (Population served: 904, Primary Water Source Type: Groundwater)
Average household size: This city:
2.5 peopleOhio:
2.4 people
Percentage of family households: This city:
67.1%Whole state:
65.0%
Percentage of households with unmarried partners: This city:
8.1%Whole state:
6.8%
Likely homosexual households (counted as self-reported same-sex unmarried-partner households)
Lesbian couples: 0.3% of all households Gay men: 0.3% of all households
166 people in nursing facilities/skilled-nursing facilities in 2010people in group homes intended for adults in 2010People in group quarters in Heath in 2000:
136 people in nursing homes
8 people in homes for the mentally retarded
3 people in other nonhousehold living situations
Banks with branches in Heath (2011 data):
The Park National Bank: 0502 30th Street Branch at 800 South 30th Street, branch established on 1989/08/21; 0503 Southgate Branch at 567 Hebron Road, branch established on 1961/06/28. Info updated 2008/09/29: Bank assets: $6,281.7 mil, Deposits: $4,611.6 mil, headquarters in Newark, OH, positive income , Commercial Lending Specialization, 123 total offices , Holding Company: Park National Corporation
PNC Bank, National Association: Heath Branch at 586 Hebron Road, branch established on 1962/06/01. Info updated 2012/03/20: Bank assets: $263,309.6 mil, Deposits: $197,343.0 mil, headquarters in Wilmington, DE, positive income , Commercial Lending Specialization, 3085 total offices , Holding Company: Pnc Financial Services Group, Inc., The
First Federal Savings and Loan Association: Hebron Road Branch at 900 Hebron Road, branch established on 1991/09/30. Info updated 2011/07/21: Bank assets: $176.6 mil, Deposits: $136.5 mil, headquarters in Newark, OH, negative income in the last year , Mortgage Lending Specialization, 6 total offices
Ohio Heritage Bank: Heath Branch at 1066 Hebron Road, branch established on 2009/04/24. Info updated 2006/11/03: Bank assets: $270.2 mil, Deposits: $184.5 mil, headquarters in Coshocton, OH, positive income , Mortgage Lending Specialization, 6 total offices , Holding Company: Ohio Heritage Bancorp, Inc.
Woodforest National Bank: Heath Wal-Mart Branch at 911 Hebron Road, branch established on 2006/09/18. Info updated 2011/05/10: Bank assets: $3,488.9 mil, Deposits: $3,097.6 mil, headquarters in Houston, TX, positive income , Commercial Lending Specialization, 766 total offices , Holding Company: Woodforest Financial Group Employee Stock Ownership Plan (With 401(K) Provisions)
JPMorgan Chase Bank, National Association: Heath Branch at 895 Hebron Road, branch established on 1966/02/07. Info updated 2011/11/10: Bank assets: $1,811,678.0 mil, Deposits: $1,190,738.0 mil, headquarters in Columbus, OH, positive income , International Specialization, 5577 total offices , Holding Company: Jpmorgan Chase & Co.
The Huntington National Bank: Heath Branch at 580 Hebron Rd, branch established on 1900/01/01. Info updated 2012/04/02: Bank assets: $54,183.4 mil, Deposits: $44,300.3 mil, headquarters in Columbus, OH, positive income , Commercial Lending Specialization, 878 total offices , Holding Company: Huntington Bancshares Incorporated
For population 15 years and over in Heath:
Never married: 23.5%Now married: 53.5%Separated: 1.3%Widowed: 9.4%Divorced: 12.3% For population 25 years and over in Heath:
High school or higher: 94.3%Bachelor's degree or higher: 23.7%Graduate or professional degree: 10.8%Unemployed: 3.6%Mean travel time to work (commute): 18.2 minutes
Education Gini index (Inequality in education) Here:
9.7Ohio average:
11.0
Religion statistics for Heath, OH (based on Licking County data)
Religion Adherents Congregations Evangelical Protestant 21,879 97 Mainline Protestant 17,189 82 Catholic 16,000 7 Other 1,167 6 Black Protestant 697 3 None 109,560 -
Source: Clifford Grammich, Kirk Hadaway, Richard Houseal, Dale E.Jones, Alexei Krindatch, Richie Stanley and Richard H.Taylor. 2012. 2010 U.S.Religion Census: Religious Congregations & Membership Study. Association of Statisticians of American Religious Bodies. Jones, Dale E., et al. 2002. Congregations and Membership in the United States 2000. Nashville, TN: Glenmary Research Center. Graphs represent county-level data
Food Environment Statistics: Number of grocery stores : 25Licking County :
1.60 / 10,000 pop.State :
1.89 / 10,000 pop.
Number of supercenters and club stores : 2This county :
0.13 / 10,000 pop.State :
0.13 / 10,000 pop.
Number of convenience stores (no gas) : 10This county :
0.64 / 10,000 pop.State :
1.25 / 10,000 pop.
Number of convenience stores (with gas) : 49Here :
3.13 / 10,000 pop.State :
2.93 / 10,000 pop.
Number of full-service restaurants : 69Licking County :
4.40 / 10,000 pop.Ohio :
6.25 / 10,000 pop.
Adult diabetes rate : This county :
11.1%Ohio :
10.3%
Adult obesity rate : Licking County :
30.1%Ohio :
29.1%
Low-income preschool obesity rate : Licking County :
12.7%State :
11.9%
Health and Nutrition:
Average overall health of teeth and gums : People feeling badly about themselves : People not drinking alcohol at all : Average hours sleeping at night : Overweight people : This city:
35.3%Ohio:
34.3%
General health condition : Average condition of hearing : More about Health and Nutrition of Heath, OH Residents
Local government employment and payroll (March 2022)
Function
Full-time employees
Monthly full-time payroll
Average yearly full-time wage
Part-time employees
Monthly part-time payroll
Police Protection - Officers
20 $163,042 $97,825 0 $0 Firefighters
19 $129,177 $81,585 0 $0 Water Supply
9 $43,620 $58,160 0 $0 Streets and Highways
8 $29,283 $43,925 0 $0 Police - Other
8 $39,540 $59,310 0 $0 Sewerage
7 $44,085 $75,574 0 $0 Other Government Administration
7 $33,119 $56,775 7 $4,000 Financial Administration
5 $23,383 $56,119 0 $0 Parks and Recreation
4 $16,612 $49,836 1 $836 Judicial and Legal
1 $6,610 $79,320 0 $0 Fire - Other
1 $3,648 $43,776 0 $0
Totals for Government
89 $532,118 $71,746 8 $4,836
Heath government finances - Expenditure in 2018 (per resident):
Construction - Water Utilities: $903,000 ($85.02)
Sewerage: $437,000 ($41.14)Current Operations - Local Fire Protection: $2,114,000 ($199.04)
Police Protection: $2,100,000 ($197.72)Sewerage: $1,448,000 ($136.33)Water Utilities: $1,399,000 ($131.72)Parks and Recreation: $1,047,000 ($98.58)Central Staff Services: $1,028,000 ($96.79)Regular Highways: $834,000 ($78.52)General - Other: $741,000 ($69.77)Financial Administration: $394,000 ($37.10)Judicial and Legal Services: $175,000 ($16.48)Health - Other: $58,000 ($5.46)General - Interest on Debt: $196,000 ($18.45)
Intergovernmental to State - Sewerage: $319,000 ($30.03)
General - Other: $9,000 ($0.85)Other Capital Outlay - Regular Highways: $269,000 ($25.33)
General - Other: $180,000 ($16.95)Local Fire Protection: $153,000 ($14.41)Parks and Recreation: $36,000 ($3.39)Central Staff Services: $34,000 ($3.20)Police Protection: $8,000 ($0.75)Financial Administration: $2,000 ($0.19)Total Salaries and Wages: $7,789,000 ($733.36)
Water Utilities - Interest on Debt: $72,000 ($6.78)
Heath government finances - Revenue in 2018 (per resident):
Charges - Sewerage: $2,164,000 ($203.75)
Parks and Recreation: $496,000 ($46.70)Other: $474,000 ($44.63)Miscellaneous - Interest Earnings: $178,000 ($16.76)
General Revenue - Other: $143,000 ($13.46)Fines and Forfeits: $82,000 ($7.72)Sale of Property: $18,000 ($1.69)Revenue - Water Utilities: $2,292,000 ($215.80)
State Intergovernmental - Sewerage: $630,000 ($59.32)
Highways: $480,000 ($45.19)General Local Government Support: $357,000 ($33.61)Other: $272,000 ($25.61)Tax - Individual Income: $5,613,000 ($528.48)
Property: $2,347,000 ($220.98)Motor Vehicle License: $158,000 ($14.88)Other License: $67,000 ($6.31)
Heath government finances - Debt in 2018 (per resident):
Long Term Debt - Beginning Outstanding - Unspecified Public Purpose: $4,370,000 ($411.45)
Outstanding Unspecified Public Purpose: $3,555,000 ($334.71)Retired Unspecified Public Purpose: $815,000 ($76.73)
Heath government finances - Cash and Securities in 2018 (per resident):
Bond Funds - Cash and Securities: $1,633,000 ($153.75)
Other Funds - Cash and Securities: $10,673,000 ($1004.90)
Sinking Funds - Cash and Securities: $136,000 ($12.80)
Businesses in Heath, OH
Name Count Name Count
ALDI 1 Lowe's 1 AT&T 1 MasterBrand Cabinets 1 Advance Auto Parts 1 Maurices 1 Aeropostale 1 McDonald's 1 American Eagle Outfitters 1 Nike 1 Applebee's 1 Olive Garden 1 Arby's 2 Pac Sun 1 AutoZone 1 Payless 2 Bath & Body Works 1 Penske 1 Blockbuster 1 Pizza Hut 1 Buffalo Wild Wings 1 Quiznos 1 Burger King 1 RadioShack 1 Caribou Coffee 1 Red Lobster 1 DHL 1 Rite Aid 1 Dairy Queen 1 Ruby Tuesday 1 Deb 1 SONIC Drive-In 1 Econo Lodge 1 Sears 2 Fashion Bug 1 Spencer Gifts 1 FedEx 3 Sprint Nextel 2 Finish Line 1 Staples 1 GNC 1 Super 8 1 GameStop 2 T-Mobile 3 H&R Block 1 Taco Bell 1 Hilton 1 Target 1 Hobby Lobby 1 Tim Hortons 1 Holiday Inn 1 Toyota 1 Honda 1 Toys"R"Us 1 Hyundai 1 U-Haul 2 JCPenney 1 UPS 2 Jimmy John's 1 Vans 2 Journeys 1 Verizon Wireless 3 Justice 1 Victoria's Secret 1 KFC 1 Walgreens 1 Kroger 2 Walmart 1 LensCrafters 1 Wendy's 1 Long John Silver's 1 White Castle 1
Strongest AM radio stations in Heath:
WHTH (790 AM; 1 kW; HEATH, OH; Owner: RUNNYMEDE, INC.)
WCLT (1430 AM; 0 kW; NEWARK, OH)
WTVN (610 AM; 50 kW; COLUMBUS, OH; Owner: CITICASTERS LICENSES, L.P.)
WRFD (880 AM; daytime; 23 kW; COLUMBUS-WORTHINGTON, OH; Owner: SALEM MEDIA OF OHIO, INC.)
WWVA (1170 AM; 53 kW; WHEELING, WV; Owner: CAPSTAR TX LIMITED PARTNERSHIP)
WKNR (850 AM; 50 kW; CLEVELAND, OH; Owner: CARON BROADCASTING, INC.)
WLW (700 AM; 50 kW; CINCINNATI, OH; Owner: JACOR BROADCASTING CORPORATION)
WOSU (820 AM; 5 kW; COLUMBUS, OH; Owner: THE OHIO STATE UNIVERSITY)
WBNS (1460 AM; 5 kW; COLUMBUS, OH; Owner: RADIOHIO, INCORPORATED)
WTAM (1100 AM; 50 kW; CLEVELAND, OH; Owner: JACOR BROADCASTING CORPORATION)
WHK (1220 AM; 50 kW; CLEVELAND, OH; Owner: CARON BROADCASTING, INC.)
WJR (760 AM; 50 kW; DETROIT, MI; Owner: ABC, INC.)
KDKA (1020 AM; 50 kW; PITTSBURGH, PA; Owner: INFINITY BROADCASTING OPERATIONS, INC.)
Strongest FM radio stations in Heath:
WCLT-FM (100.3 FM; NEWARK, OH; Owner: WCLT RADIO, INC.)
WNKO (101.7 FM; NEWARK, OH; Owner: RUNNYMEDE, INC.)
WDUB (91.1 FM; GRANVILLE, OH; Owner: DENISON UNIVERSITY)
W294AC (106.7 FM; NEWARK, OH; Owner: BD. OF EDUC. CITY SCHOOL DISTRICT)
WJIC (91.7 FM; ZANESVILLE, OH; Owner: VCY/AMERICA, INC.)
WWJM (106.3 FM; NEW LEXINGTON, OH; Owner: PERRY COUNTY BROADCASTING CO., INC.)
WSMZ (103.1 FM; JOHNSTOWN, OH; Owner: STOP 26- RIVERBEND, INC.)
W201AK (88.1 FM; COLUMBUS, OH; Owner: THE CEDARVILLE UNIVERSITY)
WOSU-FM (89.7 FM; COLUMBUS, OH; Owner: THE OHIO STATE UNIVERSITY)
WHOK-FM (95.5 FM; LANCASTER, OH; Owner: INFINITY RADIO SUBSIDIARY OPERATIONS INC.)
WBZX (99.7 FM; COLUMBUS, OH; Owner: NORTH AMERICAN BROADCASTING CO., INC)
WBNS-FM (97.1 FM; COLUMBUS, OH; Owner: RADIO OHIO, INC.)
WUFM (88.7 FM; COLUMBUS, OH; Owner: SPIRIT COMMUNICATIONS, INC)
WCOL-FM (92.3 FM; COLUMBUS, OH; Owner: CITICASTERS LICENSES, L.P.)
WXMG (98.9 FM; UPPER ARLINGTON, OH; Owner: BLUE CHIP BROADCASTING LICENSES, LTD)
WLVQ (96.3 FM; COLUMBUS, OH; Owner: INFINITY RADIO OPERATIONS INC.)
WQIO (93.7 FM; MOUNT VERNON, OH; Owner: CAPSTAR TX LIMITED PARTNERSHIP)
WSNY (94.7 FM; COLUMBUS, OH; Owner: FRANKLIN COMMUNICATIONS, INC.)
WHIZ-FM (102.5 FM; ZANESVILLE, OH; Owner: SOUTHEASTERN OHIO BROADCASTING SYSTEM, INC.)
WLRY (88.5 FM; RUSHVILLE, OH; Owner: ARCANGEL BROADCASTING FOUNDATION)
TV broadcast stations around Heath:
WSFJ-TV (Channel 51; NEWARK, OH; Owner: GUARDIAN VISION INTERNATIONAL, INC.)
WOSU-TV (Channel 34; COLUMBUS, OH; Owner: THE OHIO STATE UNIVERSITY)
WSYX (Channel 6; COLUMBUS, OH; Owner: WSYX LICENSEE, INC.)
WBNS-TV (Channel 10; COLUMBUS, OH; Owner: WBNS-TV, INC.)
WTTE (Channel 28; COLUMBUS, OH; Owner: COLUMBUS (WTTE-TV) LICENSEE, INC.)
W31AA (Channel 31; NEWARK, OH; Owner: OHIO EDUC'L. TV NETWORK COMMISSION)
WCMH-TV (Channel 4; COLUMBUS, OH; Owner: OUTLET BROADCASTING, INC.)
WMFD-TV (Channel 68; MANSFIELD, OH; Owner: MID-STATE TELEVISION,INC.)
WINJ-LP (Channel 8; COLUMBUS, OH; Owner: THE NEW LIFE FELLOWSHIP OF CHURCHES)
WWHO (Channel 53; CHILLICOTHE, OH; Owner: UPN STATIONS GROUP INC.)
WHIZ-TV (Channel 18; ZANESVILLE, OH; Owner: SOUTHEASTERN OHIO TELEVISION SYSTEM)
WCLL-LP (Channel 19; COLUMBUS, OH; Owner: JONATHAN W. OWENS)
WDEM-LP (Channel 17; COLUMBUS, OH; Owner: TRIPLETT & ASSOCIATES, INC.)
WCPX-LP (Channel 48; COLUMBUS, OH; Owner: PAXSON COMMUNICATIONS LICENSE COMPANY, LLC)
National Bridge Inventory (NBI) Statistics 20 Number of bridges174ft / 53.5m Total length $508,000 Total costs66,550 Total average daily traffic3,938 Total average daily truck traffic92,371 Total future (year 2030) average daily traffic
New bridges - historical statistics
1 1960-1969 2 1970-1979 3 1980-1989 5 1990-1999 3 2000-2009 6 2010-2019
See full National Bridge Inventory statistics for Heath, OH
FCC Registered Antenna Towers: 98 (
See the full list of FCC Registered Antenna Towers in Heath )
FCC Registered Broadcast Land Mobile Towers: 13 (
See the full list of FCC Registered Broadcast Land Mobile Towers in Heath, OH )
FCC Registered Microwave Towers: 5
Heath, Lat: 40.016806 Lon: -82.357889, Call Sign: WQAS965, Licensee ID: L00069237, Assigned Frequencies: 956.356 MHz, Grant Date: 08/02/2004, Expiration Date: 08/02/2014, Cancellation Date: 10/04/2014, Certifier: David Brenner, Registrant: City Of Heath OH0090, 440 Industrial Parkway (Lat: 40.037194 Lon: -82.424000), Type: Tower, Structure height: 45.7 m, Overall height: 51.8 m, Call Sign: WQNL595, Assigned Frequencies: 11325.0 MHz, Grant Date: 03/15/2011, Expiration Date: 03/15/2021, Cancellation Date: 02/16/2012, Certifier: Madanraj Jothi, Registrant: Open Range Communications Inc., 6430 S. Fiddlers Green Circle, Suite 500, Greenwood Village, CO 80111, Phone: (303) 376-2112, Fax: (303) 376-2109, Email:
Newark TS, 9020 Blue Jay Rd (Lat: 40.029722 Lon: -82.372222), Type: Ltower, Structure height: 48 m, Overall height: 54 m, Call Sign: WRDJ729, Licensee ID: L00268142, Assigned Frequencies: 6815.00 MHz, Grant Date: 05/15/2019, Expiration Date: 05/15/2029, Certifier: Trish Tyler, Registrant: American Electric Power Service Corporation OH089P004, Heath Newark Licking County Port Authority (Lat: 40.019167 Lon: -82.473889), Type: Mtower, Structure height: 38.1 m, Overall height: 42.7 m, Call Sign: WRDU351, Assigned Frequencies: 11075.0 MHz, 11075.0 MHz, 11075.0 MHz, 11075.0 MHz, 11075.0 MHz, 11075.0 MHz, 11075.0 MHz, 11075.0 MHz, 11075.0 MHz, 11075.0 MHz... (+30 more), Grant Date: 07/22/2019, Expiration Date: 07/22/2029, Certifier: David Weisman, Registrant: Agile Network Builders LLC, 213 Market Ave N, Suite 310, Canton, OH 44702, Phone: (888) 494-0549, Fax: (330) 451-5720, Email:
INDIAN MOUND, South 30th Street (Lat: 40.042417 Lon: -82.445472), Type: Mtower, Structure height: 47.2 m, Overall height: 48.8 m, Call Sign: WRZZ284, Assigned Frequencies: 17980.0 MHz, 18060.0 MHz, 17980.0 MHz, 18060.0 MHz, 17980.0 MHz, 18060.0 MHz, 17980.0 MHz, 18060.0 MHz, 17980.0 MHz, 18060.0 MHz... (+8 more), Grant Date: 12/27/2023, Expiration Date: 12/27/2033, Certifier: Christophe Le Scanve, Registrant: Cellco Partnership, 5055 Northpointe Pkwy, Alpharetta, GA 30022, Phone: (770) 797-1070, Email:
FCC Registered Maritime Coast & Aviation Ground Towers: 2
Newark Heath Airport (Lat: 40.033389 Lon: -82.449889), Type: Tower, Call Sign: WLA9, Licensee ID: L00079074, Assigned Frequencies: 122.700 MHz, Grant Date: 04/17/2007, Expiration Date: 03/24/2017, Cancellation Date: 05/27/2017, Registrant: Aviation Works Inc, 530 Heath Rd, Heath, OH 43056, Phone: (740) 522-6968 Licking County Newark Heath Airport (Lat: 40.017833 Lon: -82.451833), Type: Tower, Call Sign: WRLL2045, Licensee ID: L00066753, Assigned Frequencies: 110.900 MHz, Grant Date: 04/17/1997, Expiration Date: 04/21/2002, Cancellation Date: 01/18/2004, Registrant: Licking County Airport Authority, 530 Heath Rd, Heath, OH 43055 FCC Registered Amateur Radio Licenses: 73 (
See the full list of FCC Registered Amateur Radio Licenses in Heath )
FAA Registered Aircraft: 5
Aircraft: CESSNA 172D (Category: Land, Seats: 4, Weight: Up to 12,499 Pounds, Speed: 105 mph), Engine: CONT MOTOR 0-300 SER (145 HP) (Reciprocating)N-Number: 2430U, N2430U, N-2430U, Serial Number: 17250030, Year manufactured: 1963, Airworthiness Date: 02/06/1963, Certificate Issue Date: 09/09/2019Registrant (Individual): Nancy A Anderson, 1077 Franklin Ave, Heath, OH 43056Aircraft: PIPER PA-28R-200 (Category: Land, Seats: 4, Weight: Up to 12,499 Pounds, Speed: 107 mph), Engine: LYCOMING I0360 SER (180 HP) (Reciprocating)N-Number: 3511T, N3511T, N-3511T, Serial Number: 28R-7435063, Year manufactured: 1973, Airworthiness Date: 10/24/1973, Certificate Issue Date: 04/16/2020Registrant (Individual): Daniel W Tippett, 11245 Palmer Rd Sw, Heath, OH 43056Aircraft: PIPER PA-28-140 (Category: Land, Seats: 4, Weight: Up to 12,499 Pounds, Speed: 107 mph), Engine: LYCOMING 0-320 SERIES (180 HP) (Reciprocating)N-Number: 4524R, N4524R, N-4524R, Serial Number: 28-21226, Year manufactured: 1965, Airworthiness Date: 10/22/1965, Certificate Issue Date: 03/19/2020Registrant (Individual): Robert W Jr Dennis, 10839 Fairview Rd, Heath, OH 43056Aircraft: PIPER PA-30 (Category: Land, Engines: 2, Seats: 6, Weight: Up to 12,499 Pounds, Speed: 139 mph), Engine: LYCOMING IO-320 SERIES (150 HP) (Reciprocating)N-Number: 7858Y, N7858Y, N-7858Y, Serial Number: 30-778, Year manufactured: 1965, Airworthiness Date: 11/08/1965, Certificate Issue Date: 10/04/2007Registrant (Individual): Stuart H Graham, 735 Franklin Ave, Heath, OH 43056Aircraft: CESSNA 172S (Category: Land, Seats: 4, Weight: Up to 12,499 Pounds), Engine: LYCOMING I0360 SER (180 HP) (Reciprocating)N-Number: 785SP, N785SP, N-785SP, Serial Number: 172S8712, Year manufactured: 2001, Airworthiness Date: 01/24/2001, Certificate Issue Date: 07/22/2004Registrant (Individual): Hara Toshiyuki, 374 Laurel Oaks Ln, Heath, OH 43056
Home Mortgage Disclosure Act Aggregated Statistics For Year 2009(Based on 2 partial tracts) A) FHA, FSA/RHS & VA B) Conventional C) Refinancings D) Home Improvement Loans F) Non-occupant Loans on G) Loans On Manufactured Number Average Value Number Average Value Number Average Value Number Average Value Number Average Value Number Average Value
LOANS ORIGINATED 22 $114,865 17 $116,171 102 $126,145 5 $81,972 7 $103,149 1 $51,590 APPLICATIONS APPROVED, NOT ACCEPTED 3 $94,813 1 $77,850 14 $108,226 0 $0 2 $74,860 0 $0 APPLICATIONS DENIED 3 $142,530 5 $99,436 41 $130,055 8 $96,835 4 $73,725 3 $32,250 APPLICATIONS WITHDRAWN 2 $120,755 1 $71,470 13 $146,416 2 $37,610 1 $64,010 1 $83,490 FILES CLOSED FOR INCOMPLETENESS 0 $0 0 $0 3 $125,337 0 $0 0 $0 0 $0
Aggregated Statistics For Year 2008(Based on 2 partial tracts) A) FHA, FSA/RHS & VA B) Conventional C) Refinancings D) Home Improvement Loans E) Loans on Dwellings For 5+ Families F) Non-occupant Loans on G) Loans On Manufactured Number Average Value Number Average Value Number Average Value Number Average Value Number Average Value Number Average Value Number Average Value
LOANS ORIGINATED 13 $135,129 33 $129,912 56 $119,441 5 $42,282 1 $5,116,490 9 $141,956 3 $36,170 APPLICATIONS APPROVED, NOT ACCEPTED 2 $145,880 3 $130,567 9 $100,507 2 $52,810 0 $0 1 $66,840 2 $60,540 APPLICATIONS DENIED 6 $110,785 6 $91,572 46 $128,782 8 $63,754 0 $0 3 $91,337 2 $43,090 APPLICATIONS WITHDRAWN 1 $108,170 5 $137,150 20 $124,590 0 $0 0 $0 1 $25,940 0 $0 FILES CLOSED FOR INCOMPLETENESS 0 $0 0 $0 5 $145,004 1 $14,410 0 $0 0 $0 0 $0
Aggregated Statistics For Year 2007(Based on 2 partial tracts) A) FHA, FSA/RHS & VA B) Conventional C) Refinancings D) Home Improvement Loans F) Non-occupant Loans on G) Loans On Manufactured Number Average Value Number Average Value Number Average Value Number Average Value Number Average Value Number Average Value
LOANS ORIGINATED 13 $127,940 46 $115,634 55 $119,695 10 $29,354 8 $73,239 3 $68,120 APPLICATIONS APPROVED, NOT ACCEPTED 1 $65,710 6 $81,103 14 $108,711 4 $24,705 2 $59,830 1 $88,770 APPLICATIONS DENIED 2 $113,840 12 $97,091 80 $126,966 19 $63,246 2 $88,710 2 $44,850 APPLICATIONS WITHDRAWN 3 $114,860 6 $129,427 19 $112,994 2 $106,750 1 $181,880 0 $0 FILES CLOSED FOR INCOMPLETENESS 0 $0 2 $97,705 6 $140,058 0 $0 0 $0 0 $0
Aggregated Statistics For Year 2006(Based on 2 partial tracts) A) FHA, FSA/RHS & VA B) Conventional C) Refinancings D) Home Improvement Loans F) Non-occupant Loans on G) Loans On Manufactured Number Average Value Number Average Value Number Average Value Number Average Value Number Average Value Number Average Value
LOANS ORIGINATED 14 $145,343 75 $98,165 81 $94,770 15 $32,457 20 $68,875 2 $26,445 APPLICATIONS APPROVED, NOT ACCEPTED 1 $92,220 8 $79,199 16 $107,546 1 $3,460 1 $99,720 2 $48,050 APPLICATIONS DENIED 3 $121,317 16 $84,671 87 $107,100 19 $49,424 5 $96,474 5 $68,170 APPLICATIONS WITHDRAWN 1 $85,880 7 $99,633 30 $118,111 1 $169,930 2 $83,020 1 $43,040 FILES CLOSED FOR INCOMPLETENESS 1 $42,650 9 $110,501 9 $126,732 0 $0 0 $0 0 $0
Aggregated Statistics For Year 2005(Based on 2 partial tracts) A) FHA, FSA/RHS & VA B) Conventional C) Refinancings D) Home Improvement Loans F) Non-occupant Loans on G) Loans On Manufactured Number Average Value Number Average Value Number Average Value Number Average Value Number Average Value Number Average Value
LOANS ORIGINATED 7 $116,230 71 $101,591 92 $112,249 13 $43,611 20 $56,805 5 $40,878 APPLICATIONS APPROVED, NOT ACCEPTED 1 $59,950 5 $89,988 28 $108,201 1 $19,460 1 $92,800 2 $34,270 APPLICATIONS DENIED 1 $115,860 18 $125,156 79 $115,151 17 $46,868 3 $73,473 3 $53,937 APPLICATIONS WITHDRAWN 0 $0 8 $111,199 33 $122,025 9 $98,619 1 $333,280 0 $0 FILES CLOSED FOR INCOMPLETENESS 0 $0 3 $88,607 6 $120,055 2 $48,675 1 $37,470 0 $0
Aggregated Statistics For Year 2004(Based on 2 partial tracts) A) FHA, FSA/RHS & VA B) Conventional C) Refinancings D) Home Improvement Loans E) Loans on Dwellings For 5+ Families F) Non-occupant Loans on G) Loans On Manufactured Number Average Value Number Average Value Number Average Value Number Average Value Number Average Value Number Average Value Number Average Value
LOANS ORIGINATED 13 $127,092 92 $94,077 115 $115,388 13 $55,534 1 $352,180 27 $59,043 5 $33,720 APPLICATIONS APPROVED, NOT ACCEPTED 3 $123,460 10 $81,926 30 $100,421 3 $61,917 0 $0 1 $95,070 4 $49,590 APPLICATIONS DENIED 2 $104,370 21 $87,060 101 $115,793 13 $25,682 0 $0 4 $67,185 5 $49,214 APPLICATIONS WITHDRAWN 1 $77,820 6 $80,562 47 $122,309 2 $50,075 0 $0 1 $373,510 1 $8,070 FILES CLOSED FOR INCOMPLETENESS 0 $0 1 $149,340 11 $132,311 1 $17,940 0 $0 0 $0 1 $80,700
Aggregated Statistics For Year 2003(Based on 2 partial tracts) A) FHA, FSA/RHS & VA B) Conventional C) Refinancings D) Home Improvement Loans E) Loans on Dwellings For 5+ Families F) Non-occupant Loans on Number Average Value Number Average Value Number Average Value Number Average Value Number Average Value Number Average Value
LOANS ORIGINATED 19 $117,707 86 $100,970 314 $102,643 13 $21,545 1 $616,240 24 $66,240 APPLICATIONS APPROVED, NOT ACCEPTED 3 $132,250 7 $53,450 40 $95,995 6 $23,713 0 $0 2 $92,530 APPLICATIONS DENIED 2 $140,610 15 $66,591 101 $104,613 7 $34,833 0 $0 3 $26,750 APPLICATIONS WITHDRAWN 1 $92,820 8 $114,228 55 $112,381 1 $111,170 0 $0 1 $104,180 FILES CLOSED FOR INCOMPLETENESS 1 $87,430 1 $110,040 12 $123,586 0 $0 0 $0 0 $0
Aggregated Statistics For Year 2002(Based on 2 partial tracts) A) FHA, FSA/RHS & VA B) Conventional C) Refinancings D) Home Improvement Loans E) Loans on Dwellings For 5+ Families F) Non-occupant Loans on Number Average Value Number Average Value Number Average Value Number Average Value Number Average Value Number Average Value
LOANS ORIGINATED 27 $112,237 64 $97,735 189 $106,018 6 $18,457 1 $4,482,450 10 $86,692 APPLICATIONS APPROVED, NOT ACCEPTED 2 $115,855 5 $102,026 36 $106,059 4 $46,258 0 $0 1 $192,440 APPLICATIONS DENIED 2 $133,395 21 $56,240 102 $105,165 9 $11,889 0 $0 1 $221,960 APPLICATIONS WITHDRAWN 1 $150,240 5 $115,424 59 $112,036 2 $31,050 0 $0 1 $77,480 FILES CLOSED FOR INCOMPLETENESS 0 $0 3 $74,057 15 $101,734 0 $0 0 $0 0 $0
Aggregated Statistics For Year 2001(Based on 2 partial tracts) A) FHA, FSA/RHS & VA B) Conventional C) Refinancings D) Home Improvement Loans E) Loans on Dwellings For 5+ Families F) Non-occupant Loans on Number Average Value Number Average Value Number Average Value Number Average Value Number Average Value Number Average Value
LOANS ORIGINATED 31 $118,053 63 $92,218 156 $97,103 16 $19,201 1 $251,160 10 $87,257 APPLICATIONS APPROVED, NOT ACCEPTED 1 $176,380 16 $64,364 33 $75,852 2 $18,020 0 $0 1 $48,870 APPLICATIONS DENIED 2 $73,930 43 $41,581 91 $94,548 10 $10,302 0 $0 1 $53,110 APPLICATIONS WITHDRAWN 2 $76,950 3 $94,413 36 $111,298 1 $14,860 0 $0 1 $28,820 FILES CLOSED FOR INCOMPLETENESS 0 $0 1 $120,470 7 $126,180 0 $0 0 $0 1 $80,700
Aggregated Statistics For Year 2000(Based on 2 partial tracts) A) FHA, FSA/RHS & VA B) Conventional C) Refinancings D) Home Improvement Loans F) Non-occupant Loans on Number Average Value Number Average Value Number Average Value Number Average Value Number Average Value
LOANS ORIGINATED 20 $104,226 69 $92,422 46 $76,273 21 $16,145 8 $71,038 APPLICATIONS APPROVED, NOT ACCEPTED 1 $87,210 16 $55,747 18 $70,949 8 $22,348 2 $85,595 APPLICATIONS DENIED 2 $145,730 45 $44,481 55 $75,054 15 $29,932 2 $64,155 APPLICATIONS WITHDRAWN 1 $152,710 5 $100,530 14 $79,261 2 $15,645 1 $87,210 FILES CLOSED FOR INCOMPLETENESS 0 $0 2 $71,325 1 $249,280 0 $0 0 $0
Aggregated Statistics For Year 1999(Based on 2 partial tracts) A) FHA, FSA/RHS & VA B) Conventional C) Refinancings D) Home Improvement Loans F) Non-occupant Loans on Number Average Value Number Average Value Number Average Value Number Average Value Number Average Value
LOANS ORIGINATED 22 $102,515 70 $81,242 93 $77,911 19 $15,025 7 $80,699 APPLICATIONS APPROVED, NOT ACCEPTED 0 $0 14 $47,812 25 $63,981 7 $8,617 1 $25,780 APPLICATIONS DENIED 3 $85,233 31 $44,255 48 $57,075 14 $9,359 1 $127,700 APPLICATIONS WITHDRAWN 0 $0 9 $81,322 25 $72,440 2 $92,980 2 $81,195 FILES CLOSED FOR INCOMPLETENESS 0 $0 1 $59,060 5 $102,728 0 $0 1 $28,640
Detailed HMDA statistics for the following Tracts:
7528.00
, 7531.00
Private Mortgage Insurance Companies Aggregated Statistics For Year 2009(Based on 2 partial tracts) A) Conventional B) Refinancings C) Non-occupant Loans on Number Average Value Number Average Value Number Average Value
LOANS ORIGINATED 5 $149,382 8 $126,466 1 $44,380 APPLICATIONS APPROVED, NOT ACCEPTED 3 $146,850 2 $178,160 0 $0 APPLICATIONS DENIED 0 $0 1 $139,720 0 $0 APPLICATIONS WITHDRAWN 0 $0 1 $78,970 0 $0 FILES CLOSED FOR INCOMPLETENESS 0 $0 0 $0 0 $0
Aggregated Statistics For Year 2008(Based on 2 partial tracts) A) Conventional B) Refinancings C) Non-occupant Loans on Number Average Value Number Average Value Number Average Value
LOANS ORIGINATED 12 $135,640 3 $122,867 2 $77,670 APPLICATIONS APPROVED, NOT ACCEPTED 4 $112,190 1 $189,400 0 $0 APPLICATIONS DENIED 1 $255,860 2 $96,470 0 $0 APPLICATIONS WITHDRAWN 1 $34,010 1 $87,610 1 $34,010 FILES CLOSED FOR INCOMPLETENESS 0 $0 0 $0 0 $0
Aggregated Statistics For Year 2007(Based on 2 partial tracts) A) Conventional B) Refinancings Number Average Value Number Average Value
LOANS ORIGINATED 20 $126,396 9 $162,953 APPLICATIONS APPROVED, NOT ACCEPTED 3 $128,610 2 $119,635 APPLICATIONS DENIED 0 $0 0 $0 APPLICATIONS WITHDRAWN 1 $156,830 1 $123,520 FILES CLOSED FOR INCOMPLETENESS 0 $0 0 $0
Aggregated Statistics For Year 2006(Based on 2 partial tracts) A) Conventional B) Refinancings Number Average Value Number Average Value
LOANS ORIGINATED 16 $124,525 6 $151,522 APPLICATIONS APPROVED, NOT ACCEPTED 2 $135,870 3 $153,787 APPLICATIONS DENIED 0 $0 0 $0 APPLICATIONS WITHDRAWN 0 $0 0 $0 FILES CLOSED FOR INCOMPLETENESS 1 $87,110 1 $90,490
Aggregated Statistics For Year 2005(Based on 2 partial tracts) A) Conventional B) Refinancings C) Non-occupant Loans on Number Average Value Number Average Value Number Average Value
LOANS ORIGINATED 10 $130,208 10 $134,075 1 $54,180 APPLICATIONS APPROVED, NOT ACCEPTED 3 $110,790 4 $114,392 0 $0 APPLICATIONS DENIED 0 $0 0 $0 0 $0 APPLICATIONS WITHDRAWN 1 $80,700 1 $61,670 0 $0 FILES CLOSED FOR INCOMPLETENESS 0 $0 1 $136,250 0 $0
Aggregated Statistics For Year 2004(Based on 2 partial tracts) A) Conventional B) Refinancings C) Non-occupant Loans on Number Average Value Number Average Value Number Average Value
LOANS ORIGINATED 15 $146,657 16 $125,829 2 $75,220 APPLICATIONS APPROVED, NOT ACCEPTED 3 $136,093 13 $126,100 1 $66,250 APPLICATIONS DENIED 0 $0 0 $0 0 $0 APPLICATIONS WITHDRAWN 0 $0 2 $113,705 0 $0 FILES CLOSED FOR INCOMPLETENESS 0 $0 1 $157,990 0 $0
Aggregated Statistics For Year 2003(Based on 2 partial tracts) A) Conventional B) Refinancings C) Non-occupant Loans on Number Average Value Number Average Value Number Average Value
LOANS ORIGINATED 21 $130,270 32 $128,447 1 $75,510 APPLICATIONS APPROVED, NOT ACCEPTED 3 $117,180 14 $113,195 0 $0 APPLICATIONS DENIED 0 $0 1 $159,660 0 $0 APPLICATIONS WITHDRAWN 1 $85,760 2 $186,275 0 $0 FILES CLOSED FOR INCOMPLETENESS 0 $0 0 $0 0 $0
Aggregated Statistics For Year 2002(Based on 2 partial tracts) A) Conventional B) Refinancings C) Non-occupant Loans on Number Average Value Number Average Value Number Average Value
LOANS ORIGINATED 15 $109,095 21 $132,103 2 $92,460 APPLICATIONS APPROVED, NOT ACCEPTED 4 $121,745 8 $132,252 1 $134,750 APPLICATIONS DENIED 0 $0 0 $0 0 $0 APPLICATIONS WITHDRAWN 2 $146,540 2 $139,305 0 $0 FILES CLOSED FOR INCOMPLETENESS 0 $0 1 $105,480 0 $0
Aggregated Statistics For Year 2001(Based on 2 partial tracts) A) Conventional B) Refinancings C) Non-occupant Loans on Number Average Value Number Average Value Number Average Value
LOANS ORIGINATED 16 $121,014 19 $119,674 2 $104,345 APPLICATIONS APPROVED, NOT ACCEPTED 3 $139,803 6 $104,965 1 $85,910 APPLICATIONS DENIED 0 $0 1 $140,640 0 $0 APPLICATIONS WITHDRAWN 0 $0 0 $0 0 $0 FILES CLOSED FOR INCOMPLETENESS 0 $0 0 $0 0 $0
Aggregated Statistics For Year 2000(Based on 2 partial tracts) A) Conventional B) Refinancings C) Non-occupant Loans on Number Average Value Number Average Value Number Average Value
LOANS ORIGINATED 17 $120,417 6 $96,238 1 $42,080 APPLICATIONS APPROVED, NOT ACCEPTED 2 $158,390 2 $151,190 0 $0 APPLICATIONS DENIED 1 $100,630 0 $0 0 $0 APPLICATIONS WITHDRAWN 0 $0 0 $0 0 $0 FILES CLOSED FOR INCOMPLETENESS 0 $0 1 $51,880 0 $0
Aggregated Statistics For Year 1999(Based on 2 partial tracts) A) Conventional B) Refinancings Number Average Value Number Average Value
LOANS ORIGINATED 16 $113,555 9 $92,752 APPLICATIONS APPROVED, NOT ACCEPTED 1 $132,400 1 $133,710 APPLICATIONS DENIED 1 $55,560 1 $86,510 APPLICATIONS WITHDRAWN 0 $0 1 $67,780 FILES CLOSED FOR INCOMPLETENESS 0 $0 0 $0
Detailed PMIC statistics for the following Tracts:
7528.00
, 7531.00 Fire-safe hotels and motels in Heath, Ohio:
Quality Inn, 733 Hebron Rd, Heath, Ohio 43056 Phone: (740) 522-1165, Fax: (740) 522-6420
Hampton Inn Heath/Newark, 1008 Hebron Rd, Heath, Ohio 43056 Phone: (740) 788-8991, Fax: (740) 788-8993
Americas Best Value Inn, 1266 Hebron Rd, Heath, Ohio 43056 Phone: (740) 522-6112, Fax: (740) 522-3089
All 3 fire-safe hotels and motels in Heath, Ohio
Most common first names in Heath, OH among deceased individuals Name Count Lived (average)
James 58 71.0 years Robert 55 73.6 years Mary 55 79.7 years John 55 73.1 years Charles 52 75.1 years William 38 75.5 years Helen 32 83.8 years Paul 28 73.9 years Ruth 26 77.7 years Dorothy 26 81.5 years
Most common last names in Heath, OH among deceased individuals Last name Count Lived (average)
Smith 37 74.7 years Jones 17 76.2 years Brown 14 74.7 years Miller 13 73.9 years Williams 13 75.6 years Johnson 12 69.3 years Moore 11 77.1 years Thompson 11 70.6 years Davis 10 67.7 years Wilson 10 75.2 years
Heath compared to Ohio state average:
Unemployed percentage significantly below state average. Black race population percentage significantly below state average. Foreign-born population percentage significantly below state average. Length of stay since moving in above state average. House age below state average.
Top Patent Applicants
Joseph Michael Rhodes (7)
William Kunkler (7)
Robert A. Matuska (5)
Kevin D. Predmore (3)
David Anthony Rigsby (3)
Scott E. Colangelo (3)
Harry B. Cline (2)
David J. Shoemaker (2)
William Anthony Kunkler (2)
James Lee Gillespie (2)
Total of 50 patent applications in 2008-2024.
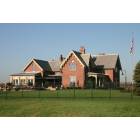
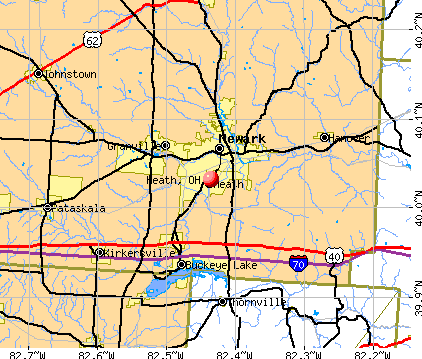


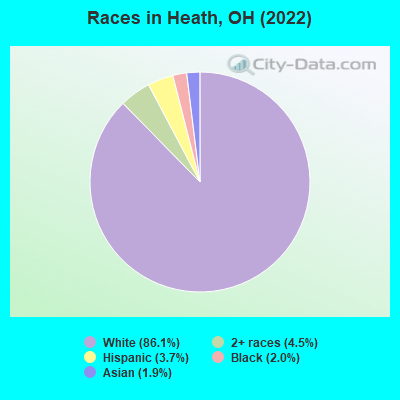
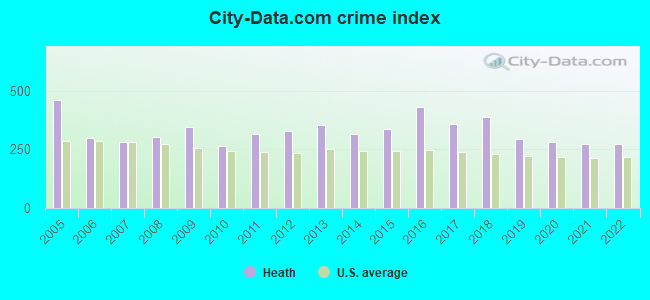
 Recent articles from our blog. Our writers, many of them Ph.D. graduates or candidates, create easy-to-read articles on a wide variety of topics.

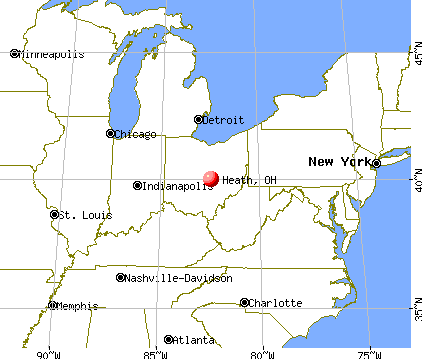
 (29.6 miles
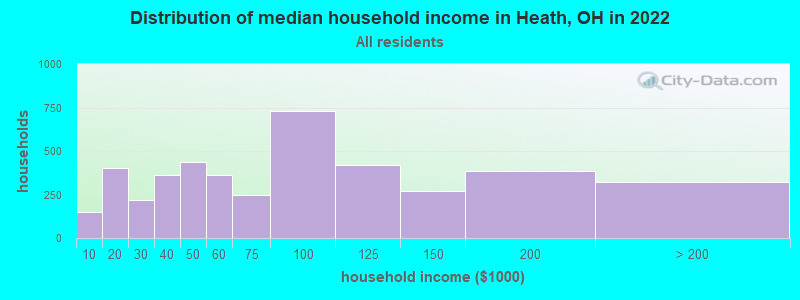
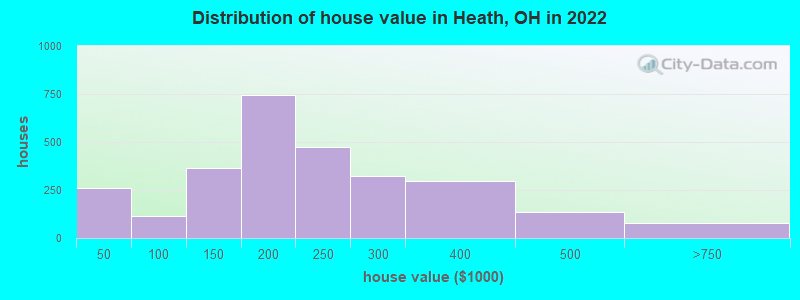

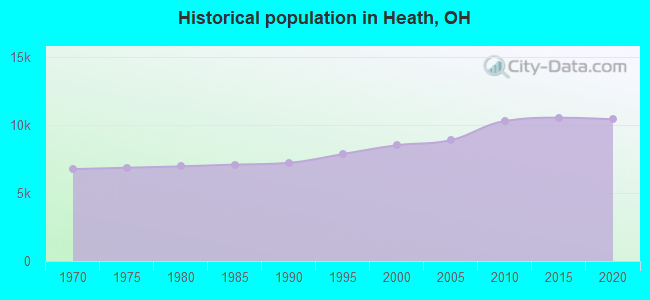
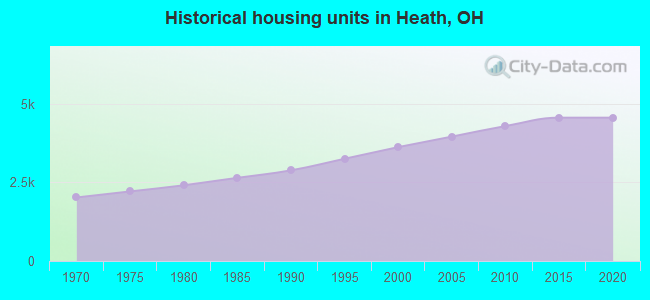
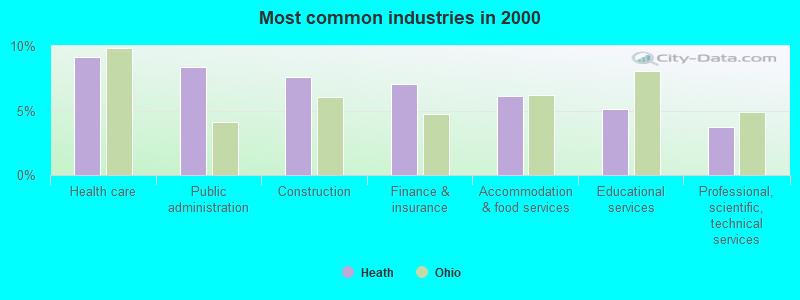
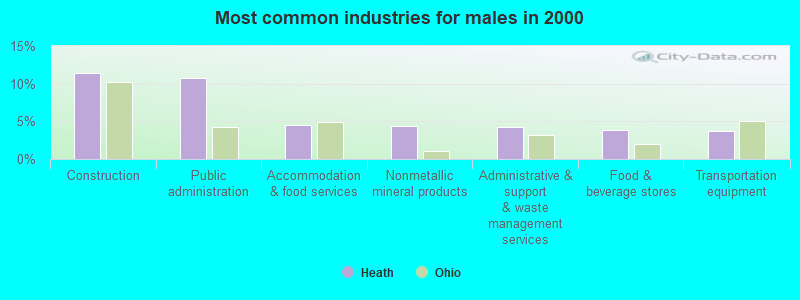
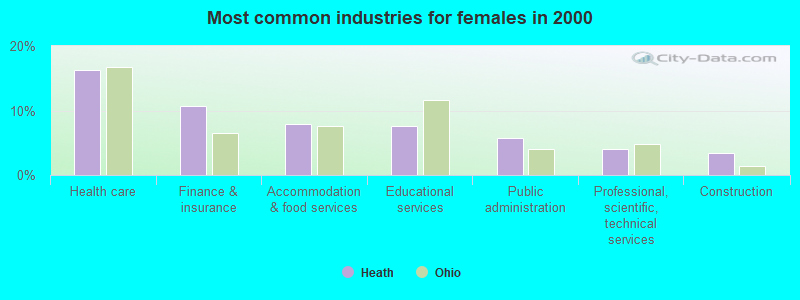
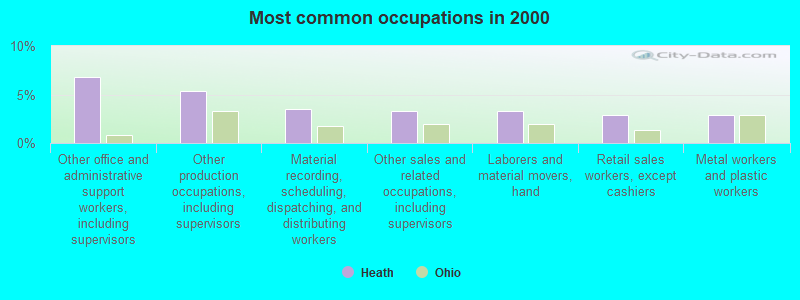
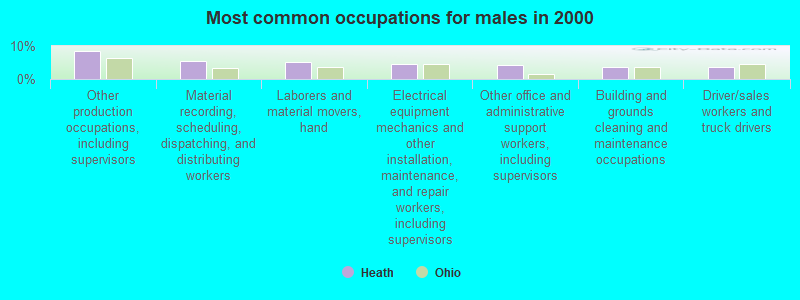
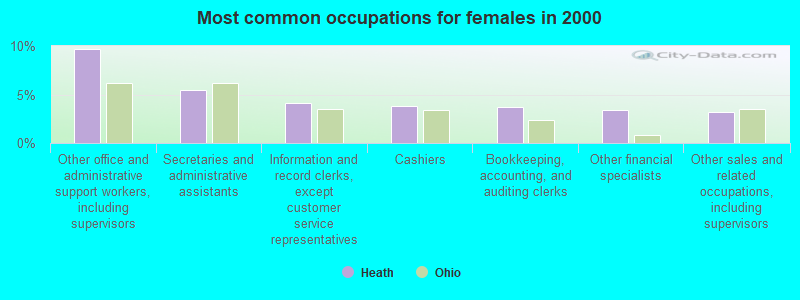
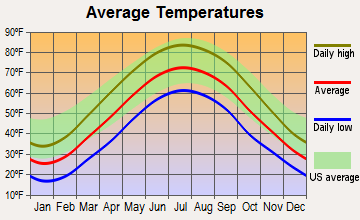
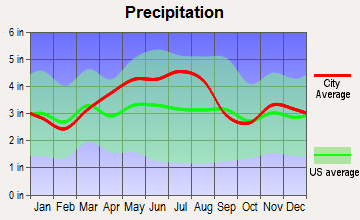
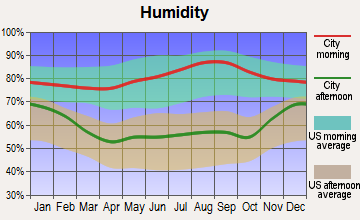
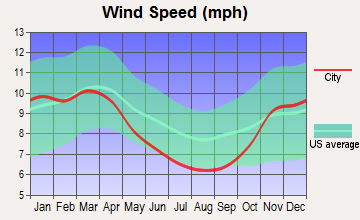
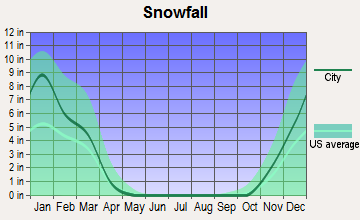
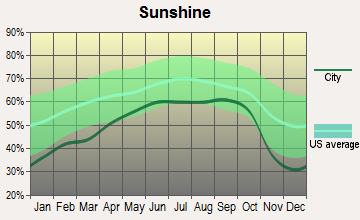
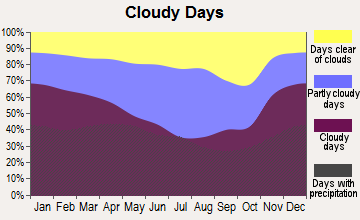
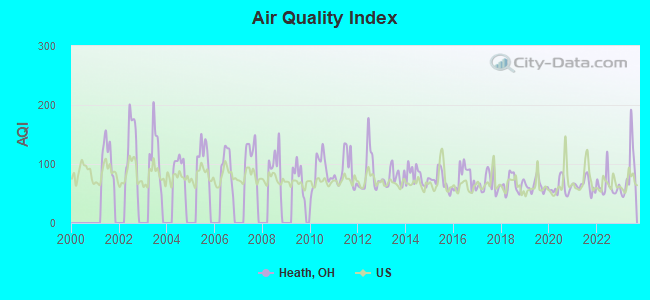
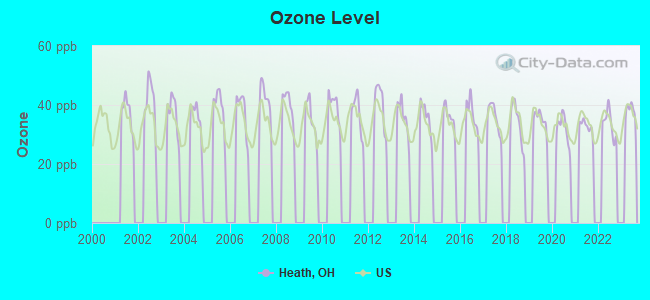
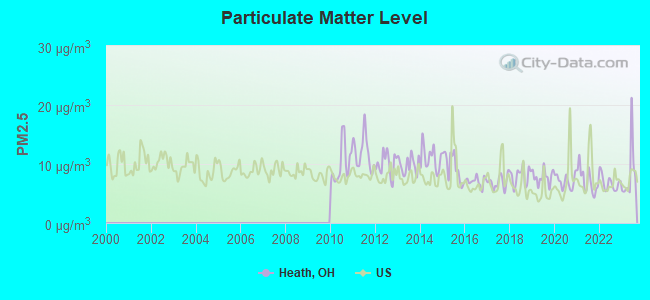
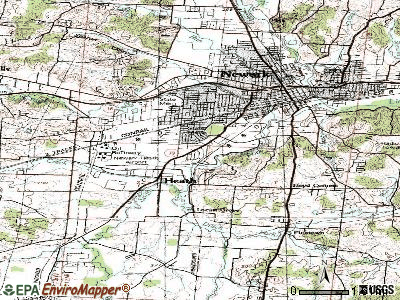
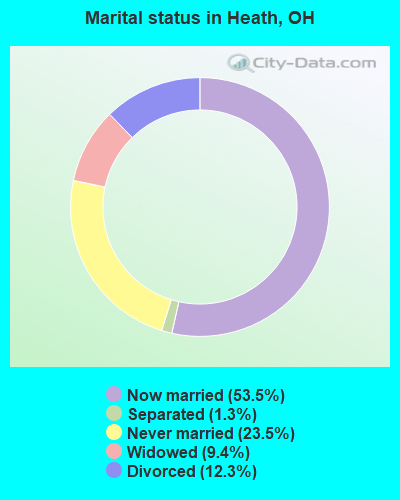
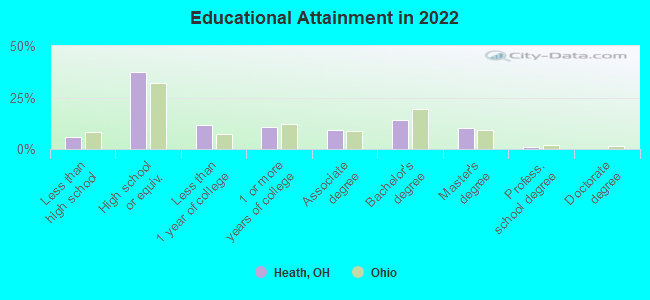
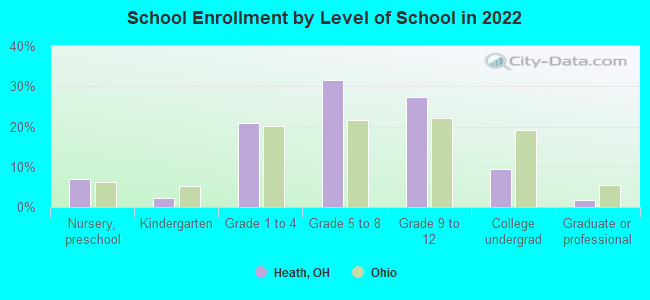
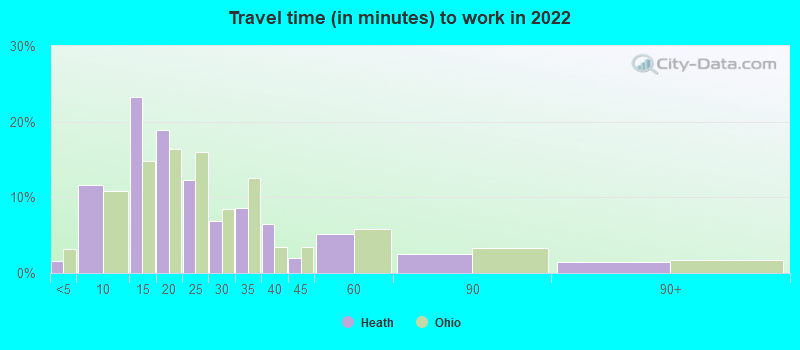
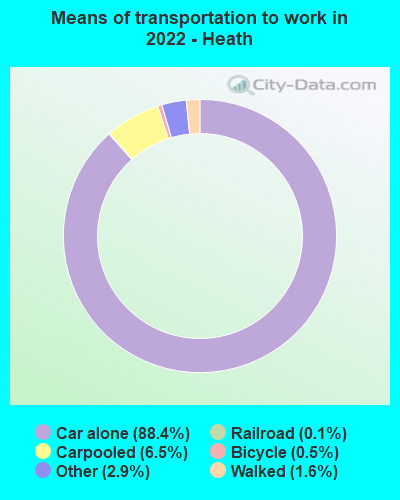
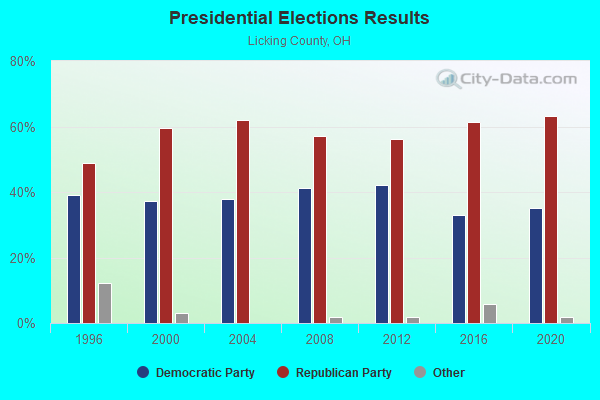
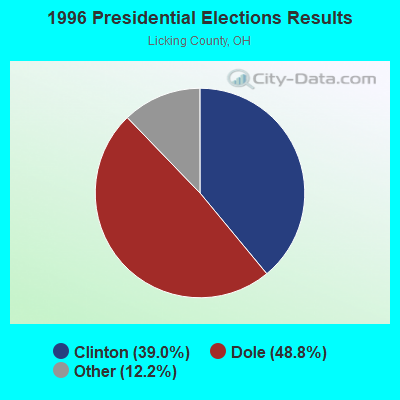
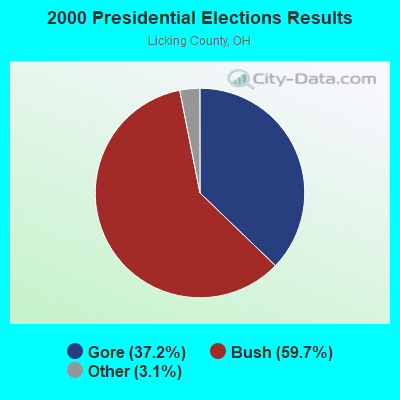
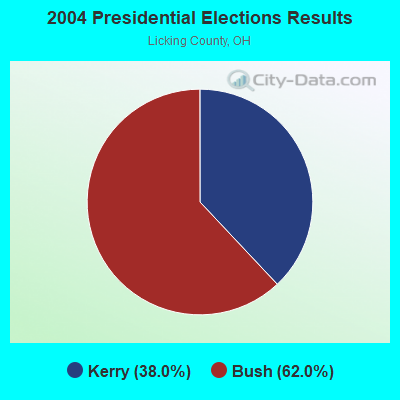
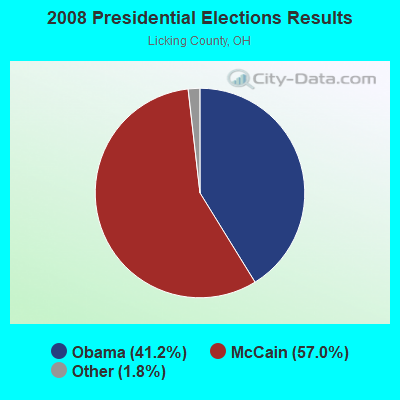
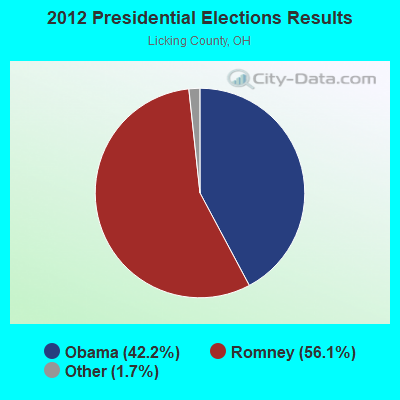
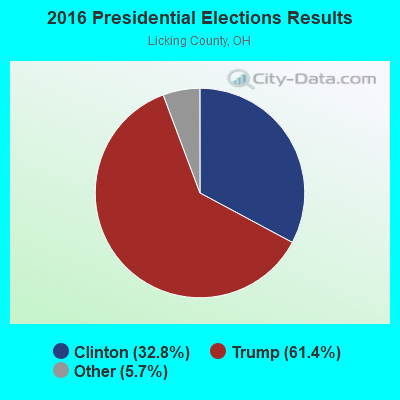
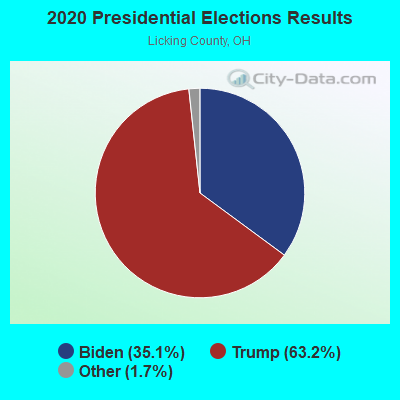
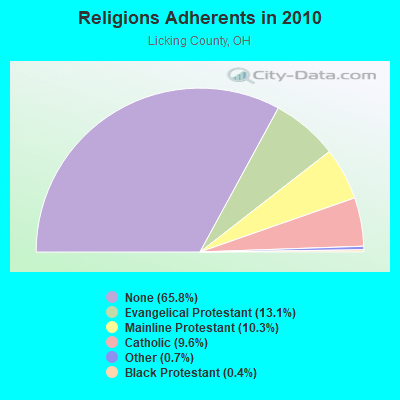
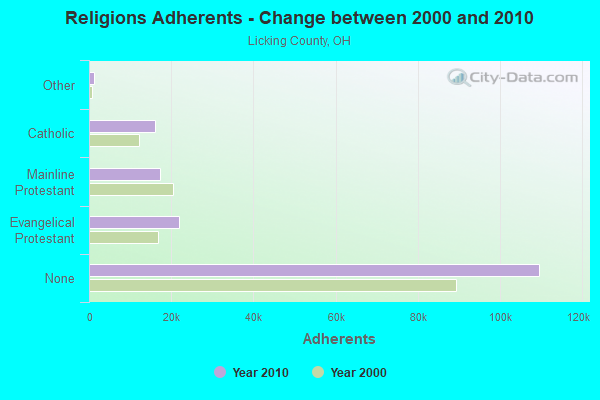
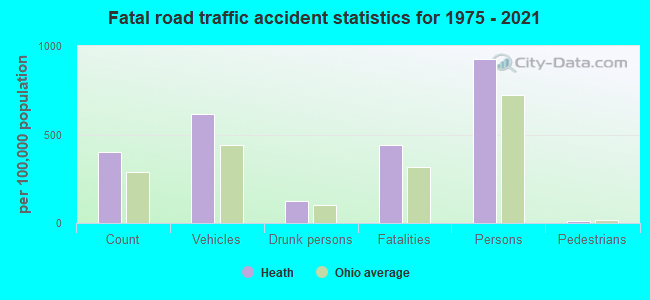
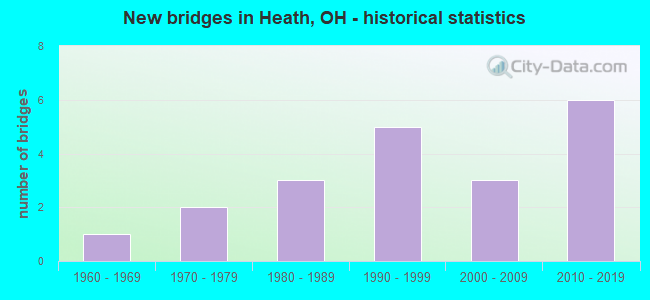
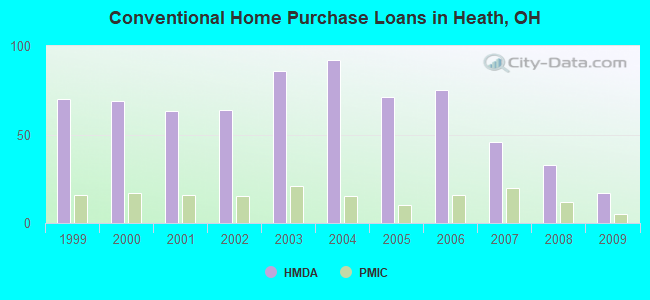
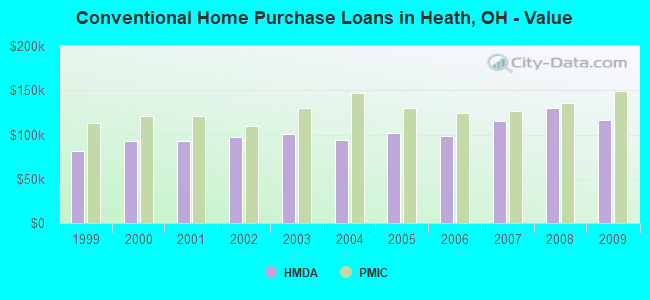
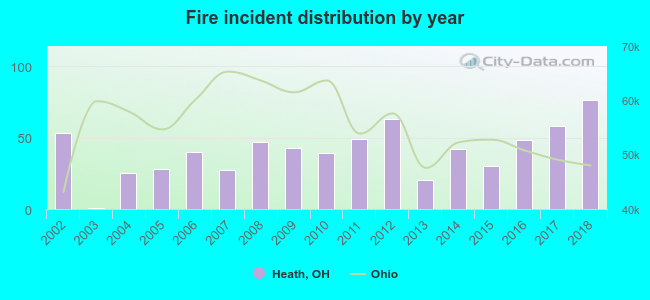 According to the data from the years 2002 - 2018 the average number of fires per year is 41. The highest number of fire incidents - 76 took place in 2018, and the least - 1 in 2003. The data has an increasing trend.
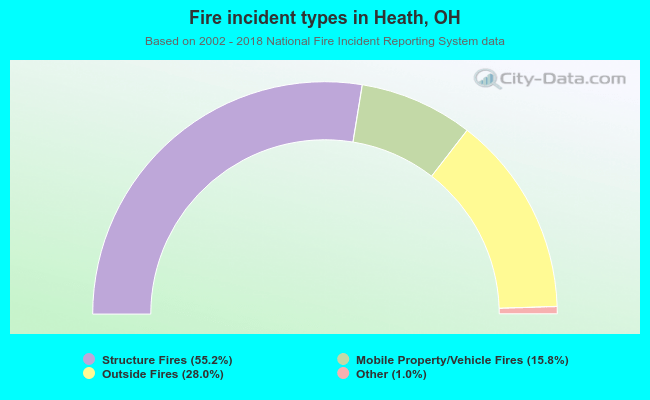 When looking into fire subcategories, the most incidents belonged to: Structure Fires (55.2%), and Outside Fires (28.0%).