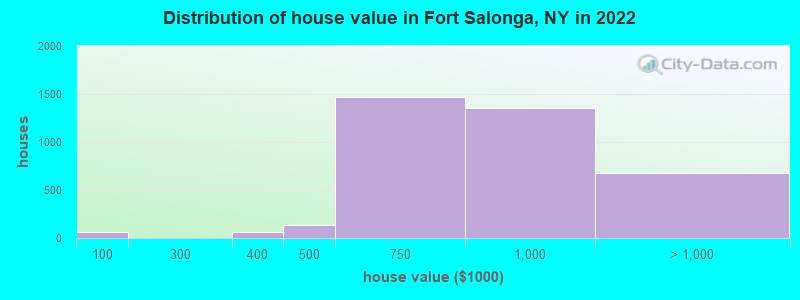
Estimated median house or condo value in 2022: $852,462 (it was $365,600 in 2000)
Fort Salonga:
$852,462
NY:
$400,400
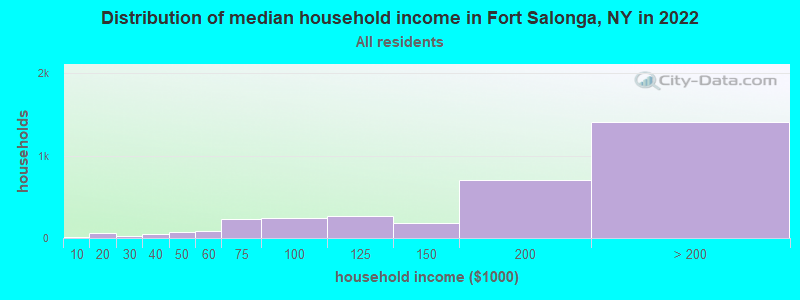
Mean prices in 2022:all housing units: $933,045; detached houses: $871,214; townhouses or other attached units: over $1,000,000; in 2-unit structures: over $1,000,000
Median gross rent in 2022: $3,269.
March 2022 cost of living index in Fort Salonga: 155.5 (very high, U.S. average is 100)
Percentage of residents living in poverty in 2022: 2.2%
(1.6% for White Non-Hispanic residents, 62.2% for Black residents, 7.6% for Hispanic or Latino residents, 9.1% for two or more races residents)
Latest news from Fort Salonga, NY collected exclusively by city-data.com from local newspapers, TV, and radio stations
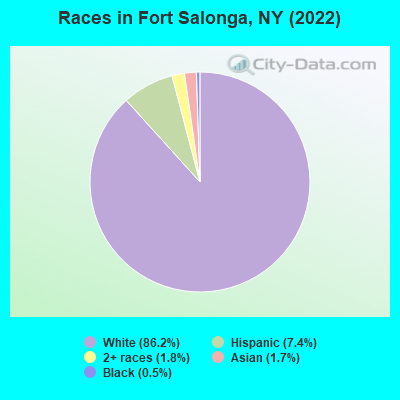
Ancestries: Italian (25.8%), Irish (15.2%), English (5.1%), German (4.8%), Russian (3.5%), American (3.5%).
Current Local Time: EST time zone
Elevation: 31 feet
Land area: 9.01 square miles.
Population density: 1,110 people per square mile (low).
524 residents are foreign born (2.9% Europe, 1.5% Asia, 0.9% Latin America).
This place:
5.3%
New York:
22.6%
Median real estate property taxes paid for housing units with mortgages in 2022: $10,001 (1.1%) Median real estate property taxes paid for housing units with no mortgage in 2022: $9,738 (1.3%)
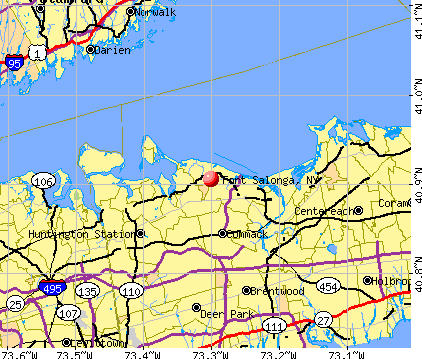
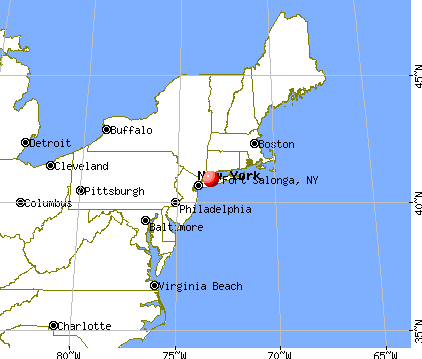
Nearest city with pop. 50,000+: Brentwood, NY (9.1 miles , pop. 53,917).
Nearest city with pop. 200,000+: North Hempstead, NY (21.1 miles , pop. 222,611).
Nearest city with pop. 1,000,000+: Bronx, NY (30.2 miles , pop. 1,332,650).
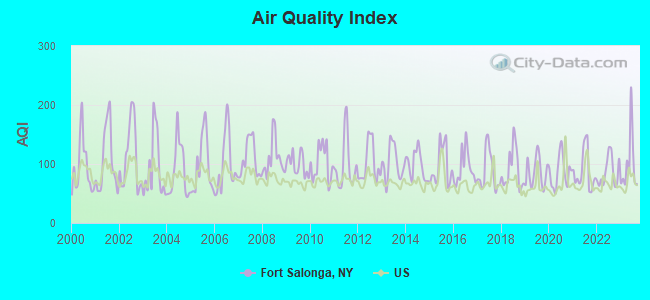
Air Quality Index (AQI) level in 2023 was 98.3. This is worse than average.
City:
98.3
U.S.:
72.6
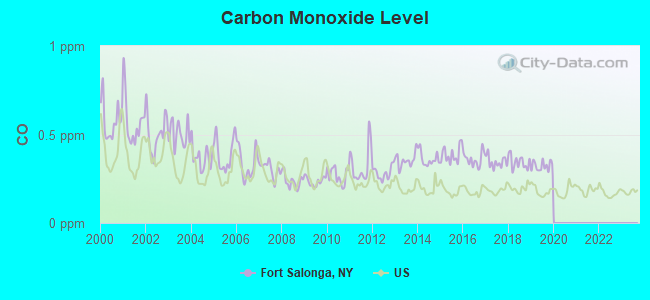
Carbon Monoxide (CO) [ppm] level in 2019 was 0.322. This is worse than average.Closest monitor was 12.7 miles away from the city center.
City:
0.322
U.S.:
0.251
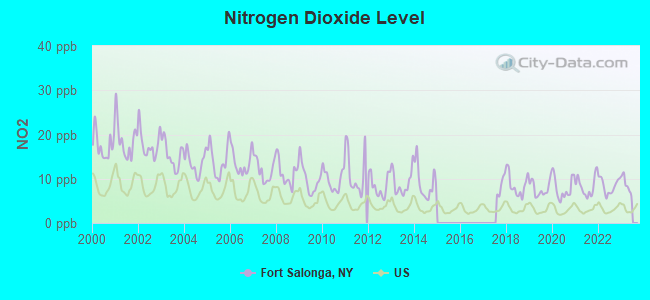
Nitrogen Dioxide (NO2) [ppb] level in 2022 was 8.39. This is significantly worse than average.Closest monitor was 13.8 miles away from the city center.
City:
8.39
U.S.:
5.11
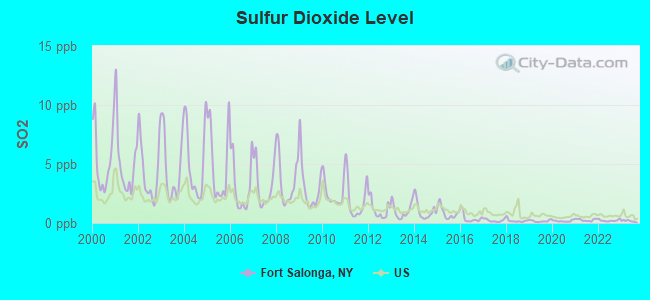
Sulfur Dioxide (SO2) [ppb] level in 2023 was 0.177. This is significantly better than average.Closest monitor was 1.3 miles away from the city center.
City:
0.177
U.S.:
1.515
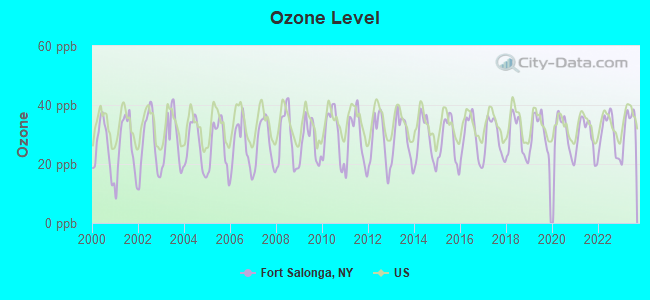
Ozone [ppb] level in 2023 was 33.2. This is about average.Closest monitor was 9.0 miles away from the city center.
City:
33.2
U.S.:
33.3
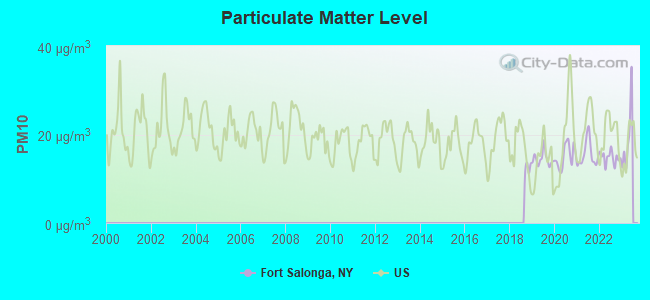
Particulate Matter (PM10) [µg/m3] level in 2022 was 14.8. This is better than average.Closest monitor was 12.7 miles away from the city center.
City:
14.8
U.S.:
19.2
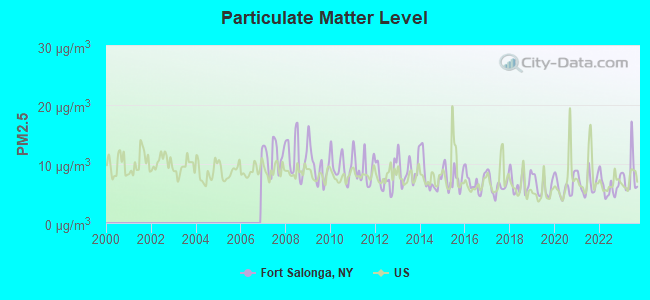
Particulate Matter (PM2.5) [µg/m3] level in 2023 was 8.11. This is about average.Closest monitor was 12.7 miles away from the city center.
City:
8.11
U.S.:
8.11
Tornado activity:
Fort Salonga-area historical tornado activity is slightly above New York state average. It is 51% smaller than the overall U.S. average.
On 7/10/1989, a category F4 (max. wind speeds 207-260 mph) tornado 34.9 miles away from the Fort Salonga place center injured 40 peopleand causedbetween $50,000,000 and $500,000,000 in damages.
On 7/19/1971, a category F2 (max. wind speeds 113-157 mph) tornado 15.0 miles away from the place center causedbetween $5000 and $50,000 in damages.
Earthquake activity:
Fort Salonga-area historical earthquake activity is significantly above New York state average. It is 70% smaller than the overall U.S. average.
On 10/7/1983 at 10:18:46, a magnitude 5.3 (5.1 MB, 5.3 LG, 5.1 ML, Class: Moderate, Intensity: VI - VII) earthquake occurred 217.4 miles away from Fort Salonga center On 8/23/2011 at 17:51:04, a magnitude 5.8 (5.8 MW, Depth: 3.7 mi) earthquake occurred 322.9 miles away from Fort Salonga center On 4/20/2002 at 10:50:47, a magnitude 5.3 (5.3 ML, Depth: 3.0 mi) earthquake occurred 250.3 miles away from Fort Salonga center On 4/20/2002 at 10:50:47, a magnitude 5.2 (5.2 MB, 4.2 MS, 5.2 MW, 5.0 MW) earthquake occurred 248.6 miles away from Fort Salonga center On 1/16/1994 at 01:49:16, a magnitude 4.6 (4.6 MB, 4.6 LG, Depth: 3.1 mi, Class: Light, Intensity: IV - V) earthquake occurred 149.1 miles away from the city center On 8/22/1992 at 12:20:32, a magnitude 4.8 (4.8 MB, 3.8 MS, 4.7 LG, Depth: 6.2 mi) earthquake occurred 201.1 miles away from Fort Salonga center Magnitude types: regional Lg-wave magnitude (LG), body-wave magnitude (MB), local magnitude (ML), surface-wave magnitude (MS), moment magnitude (MW)
Natural disasters:
The number of natural disasters in Suffolk County (28) is a lot greater than the US average (15). Major Disasters (Presidential) Declared: 19 Emergencies Declared: 7
Causes of natural disasters: Hurricanes: 9, Floods: 7, Storms: 7, Snowstorms: 4, Winter Storms: 3, Blizzards: 2, Heavy Rain: 1, Power Outage: 1, Tropical Depression: 1, Tropical Storm: 1, Water Shortage: 1, Other: 3 (Note: some incidents may be assigned to more than one category).
Hospitals and medical centers near Fort Salonga:
NORTHPORT VA MEDICAL CENTER (Hospital, Acute Care - Veterans Administration, about 1 miles away; NORTHPORT, NY)
VNS AND HOSPICE OF SUFFOLK INC CHHA (Home Health Center, about 2 miles away; NORTHPORT, NY)
VNS AND HOSPICE OF SUFFOLK, INC (Hospital, about 2 miles away; EAST NORTHPORT, NY)
ST JOHNLAND NURSING CENTER INC (Nursing Home, about 3 miles away; KINGS PARK, NY)
UCPA OF GREATER SUFFOLK (Hospital, about 4 miles away; EAST NORTHPORT, NY)
UCPA OF GREATER SUFFOLK (Hospital, about 4 miles away; COMMACK, NY)
DEVELOPMENTAL DISABILITIES INSTITUTE (Hospital, about 5 miles away; GREENLAWN, NY)
Amtrak stations near Fort Salonga:
16 miles: STAMFORD (WASHINGTON BLVD. & E. STATE ST.) . Services: ticket office, fully wheelchair accessible, enclosed waiting area, public restrooms, public payphones, snack bar, ATM, paid short-term parking, paid long-term parking, call for car rental service, taxi stand, public transit connection.
20 miles: BRIDGEPORT (525 WATER ST.) . Services: fully wheelchair accessible, enclosed waiting area, public restrooms, public payphones, snack bar, paid short-term parking, paid long-term parking, call for car rental service, taxi stand, intercity bus service, public transit connection.
Colleges/universities with over 2000 students nearest to Fort Salonga:
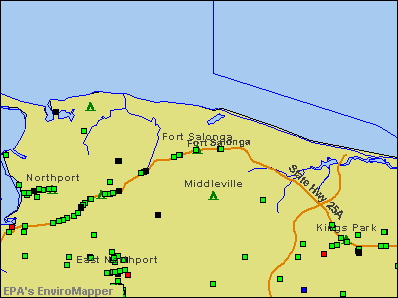
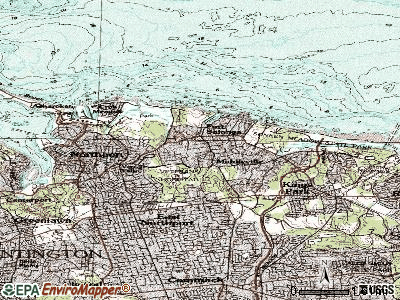
Notable locations in Fort Salonga: Crab Meadow Golf Course (A), Sunken Meadow State Park Golf Course (B), Indian Hills Country Club (C), Richters Orchards (D), Northport Power Station (E). Display/hide their locations on the map
Parks in Fort Salonga include: Callahan's Beach Park (1), Crab Meadow Beach Park (2), Sunken Meadow State Park (3), Crab Meadow Park (4). Display/hide their locations on the map
Suffolk County has a predicted average indoor radon screening level less than 2 pCi/L (pico curies per liter) - Low Potential
Average household size:
This place:
2.9 people
New York:
2.6 people
Percentage of family households:
This place:
81.8%
Whole state:
63.5%
Percentage of households with unmarried partners:
This place:
3.8%
Whole state:
6.8%
Likely homosexual households (counted as self-reported same-sex unmarried-partner households)
Lesbian couples: 0.5% of all households
Gay men: 0.3% of all households
People in group quarters in Fort Salonga in 2010:
110 people in nursing facilities/skilled-nursing facilities
42 people in emergency and transitional shelters (with sleeping facilities) for people experiencing homelessness
19 people in workers' group living quarters and job corps centers
6 people in residential treatment centers for adults
47 people in other noninstitutional group quarters in 2000
40 people in hospitals or wards for drug/alcohol abuse in 2000
Banks with branches in Fort Salonga (2011 data):
JPMorgan Chase Bank, National Association: Fort Salonga Branch at 2 Fort Salonga Road, branch established on 1974/05/31. Info updated 2011/11/10: Bank assets: $1,811,678.0 mil, Deposits: $1,190,738.0 mil, headquarters in Columbus, OH, positive income, International Specialization, 5577 total offices, Holding Company: Jpmorgan Chase & Co.
Capital One, National Association: Fort Salonga Branch at 9 Route 25a, branch established on 1936/02/01. Info updated 2011/07/01: Bank assets: $133,477.8 mil, Deposits: $97,063.7 mil, headquarters in Mclean, VA, positive income, 984 total offices, Holding Company: Capital One Financial Corporation
Religion statistics for Fort Salonga, NY (based on Suffolk County data)
Religion
Adherents
Congregations
Catholic
879,457
75
Mainline Protestant
69,205
182
Evangelical Protestant
58,909
264
Other
50,771
124
Orthodox
10,190
10
Black Protestant
8,298
49
None
416,520
-
Source: Clifford Grammich, Kirk Hadaway, Richard Houseal, Dale E.Jones, Alexei Krindatch, Richie Stanley and Richard H.Taylor. 2012. 2010 U.S.Religion Census: Religious Congregations & Membership Study. Association of Statisticians of American Religious Bodies. Jones, Dale E., et al. 2002. Congregations and Membership in the United States 2000. Nashville, TN: Glenmary Research Center. Graphs represent county-level data
Aircraft: BREDFIELD ROY LANCAIR 320 (Category: Land, Seats: 2, Weight: Up to 12,499 Pounds), Engine: LYCOMING I0360 SER (180 HP) (Reciprocating) N-Number: 35BZ, N35BZ, N-35BZ, Serial Number: 905-320-746, Year manufactured: 2004, Airworthiness Date: 08/03/2004, Certificate Issue Date: 08/16/2010 Registrant (Individual): Jack W Gasser, 4 Marions Ln, Fort Salonga, NY 11768
Aircraft: CIRRUS DESIGN CORP SR22 (Category: Land, Seats: 4, Weight: Up to 12,499 Pounds), Engine: CONT MOTOR IO-550-N (310 HP) (Reciprocating) N-Number: 485DW, N485DW, N-485DW, Serial Number: 4473, Year manufactured: 2017, Airworthiness Date: 05/08/2017, Certificate Issue Date: 06/02/2017 Registrant (Corporation): Dashj Corp, 10 Marions Ln, Fort Salonga, NY 11768
Aircraft: CESSNA 172N (Category: Land, Seats: 4, Weight: Up to 12,499 Pounds, Speed: 105 mph), Engine: LYCOMING 0-320 SERIES (180 HP) (Reciprocating) N-Number: 737HV, N737HV, N-737HV, Serial Number: 17269438, Year manufactured: 1977, Airworthiness Date: 09/26/1977, Certificate Issue Date: 01/21/2016 Registrant (Individual): Eric C Schuler, 43 Brookfield Rd, Fort Salonga, NY 11768
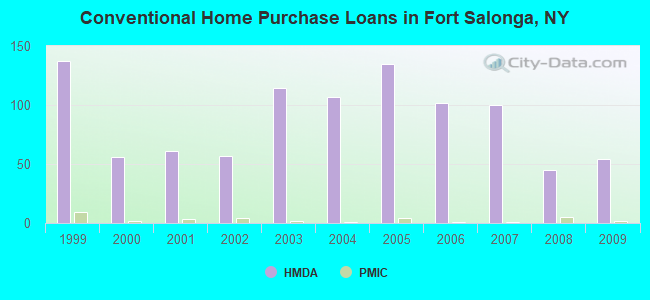
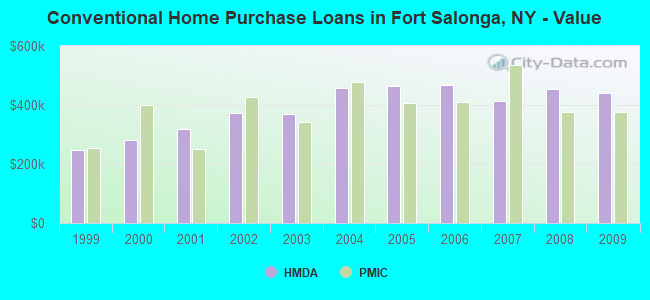
Home Mortgage Disclosure Act Aggregated Statistics For Year 2009 (Based on 1 full and 1 partial tracts)
A) FHA, FSA/RHS & VA Home Purchase Loans
B) Conventional Home Purchase Loans
C) Refinancings
D) Home Improvement Loans
F) Non-occupant Loans on < 5 Family Dwellings (A B C & D)
Number
Average Value
Number
Average Value
Number
Average Value
Number
Average Value
Number
Average Value
LOANS ORIGINATED
4
$517,420
54
$439,664
135
$335,088
9
$278,203
3
$244,313
APPLICATIONS APPROVED, NOT ACCEPTED
0
$0
6
$435,400
22
$364,155
1
$214,880
0
$0
APPLICATIONS DENIED
2
$295,670
3
$381,333
58
$441,188
4
$125,122
1
$223,470
APPLICATIONS WITHDRAWN
1
$297,390
7
$390,601
34
$368,561
3
$270,967
2
$256,130
FILES CLOSED FOR INCOMPLETENESS
0
$0
2
$296,545
11
$558,027
1
$171,900
0
$0
Aggregated Statistics For Year 2008 (Based on 1 full and 1 partial tracts)
A) FHA, FSA/RHS & VA Home Purchase Loans
B) Conventional Home Purchase Loans
C) Refinancings
D) Home Improvement Loans
F) Non-occupant Loans on < 5 Family Dwellings (A B C & D)
Number
Average Value
Number
Average Value
Number
Average Value
Number
Average Value
Number
Average Value
LOANS ORIGINATED
5
$474,088
45
$453,834
60
$367,156
14
$201,804
5
$238,842
APPLICATIONS APPROVED, NOT ACCEPTED
0
$0
11
$386,467
18
$377,556
5
$191,784
1
$185,650
APPLICATIONS DENIED
1
$317,160
8
$447,904
23
$494,714
4
$35,698
1
$305,980
APPLICATIONS WITHDRAWN
1
$333,490
5
$502,576
32
$380,069
5
$309,346
1
$166,000
FILES CLOSED FOR INCOMPLETENESS
0
$0
2
$345,520
10
$394,972
1
$650,000
2
$351,105
Aggregated Statistics For Year 2007 (Based on 1 full and 1 partial tracts)
B) Conventional Home Purchase Loans
C) Refinancings
D) Home Improvement Loans
F) Non-occupant Loans on < 5 Family Dwellings (A B C & D)
Number
Average Value
Number
Average Value
Number
Average Value
Number
Average Value
LOANS ORIGINATED
100
$414,582
102
$381,807
30
$221,759
6
$343,887
APPLICATIONS APPROVED, NOT ACCEPTED
14
$413,579
23
$382,345
6
$122,012
0
$0
APPLICATIONS DENIED
15
$474,315
55
$434,688
12
$269,450
0
$0
APPLICATIONS WITHDRAWN
6
$624,708
20
$405,416
3
$68,213
1
$358,410
FILES CLOSED FOR INCOMPLETENESS
5
$411,960
16
$383,834
3
$183,667
0
$0
Aggregated Statistics For Year 2006 (Based on 1 full and 1 partial tracts)
B) Conventional Home Purchase Loans
C) Refinancings
D) Home Improvement Loans
F) Non-occupant Loans on < 5 Family Dwellings (A B C & D)
Number
Average Value
Number
Average Value
Number
Average Value
Number
Average Value
LOANS ORIGINATED
102
$467,279
138
$406,053
29
$164,940
4
$291,782
APPLICATIONS APPROVED, NOT ACCEPTED
21
$550,669
21
$322,416
14
$233,129
4
$472,248
APPLICATIONS DENIED
22
$471,602
45
$412,665
10
$221,414
4
$430,325
APPLICATIONS WITHDRAWN
11
$506,970
47
$334,786
5
$460,280
3
$272,933
FILES CLOSED FOR INCOMPLETENESS
6
$471,765
19
$416,611
2
$129,200
0
$0
Aggregated Statistics For Year 2005 (Based on 1 full and 1 partial tracts)
B) Conventional Home Purchase Loans
C) Refinancings
D) Home Improvement Loans
F) Non-occupant Loans on < 5 Family Dwellings (A B C & D)
G) Loans On Manufactured Home Dwelling (A B C & D)
Number
Average Value
Number
Average Value
Number
Average Value
Number
Average Value
Number
Average Value
LOANS ORIGINATED
135
$464,908
150
$333,012
28
$198,858
12
$406,457
0
$0
APPLICATIONS APPROVED, NOT ACCEPTED
17
$474,239
26
$406,033
9
$94,673
1
$412,560
1
$10,310
APPLICATIONS DENIED
24
$487,256
41
$410,891
6
$211,440
5
$388,504
0
$0
APPLICATIONS WITHDRAWN
20
$467,233
52
$398,286
8
$347,449
5
$435,182
0
$0
FILES CLOSED FOR INCOMPLETENESS
13
$364,235
34
$400,551
0
$0
0
$0
0
$0
Aggregated Statistics For Year 2004 (Based on 1 full and 1 partial tracts)
A) FHA, FSA/RHS & VA Home Purchase Loans
B) Conventional Home Purchase Loans
C) Refinancings
D) Home Improvement Loans
F) Non-occupant Loans on < 5 Family Dwellings (A B C & D)
G) Loans On Manufactured Home Dwelling (A B C & D)
Number
Average Value
Number
Average Value
Number
Average Value
Number
Average Value
Number
Average Value
Number
Average Value
LOANS ORIGINATED
0
$0
107
$456,665
184
$306,221
38
$134,200
3
$614,257
2
$34,380
APPLICATIONS APPROVED, NOT ACCEPTED
0
$0
13
$487,975
41
$324,040
12
$81,962
0
$0
0
$0
APPLICATIONS DENIED
1
$153,850
15
$468,998
68
$342,269
7
$331,029
4
$356,610
0
$0
APPLICATIONS WITHDRAWN
0
$0
10
$397,514
41
$268,400
7
$195,934
0
$0
0
$0
FILES CLOSED FOR INCOMPLETENESS
0
$0
10
$472,930
19
$362,827
2
$135,745
0
$0
0
$0
Aggregated Statistics For Year 2003 (Based on 1 full and 1 partial tracts)
A) FHA, FSA/RHS & VA Home Purchase Loans
B) Conventional Home Purchase Loans
C) Refinancings
D) Home Improvement Loans
F) Non-occupant Loans on < 5 Family Dwellings (A B C & D)
Number
Average Value
Number
Average Value
Number
Average Value
Number
Average Value
Number
Average Value
LOANS ORIGINATED
4
$351,830
114
$369,564
548
$264,064
17
$76,818
16
$320,571
APPLICATIONS APPROVED, NOT ACCEPTED
0
$0
15
$395,361
86
$241,626
7
$74,547
1
$125,490
APPLICATIONS DENIED
0
$0
18
$383,389
109
$332,363
11
$96,912
3
$210,263
APPLICATIONS WITHDRAWN
0
$0
16
$469,514
80
$289,628
5
$45,352
6
$268,347
FILES CLOSED FOR INCOMPLETENESS
0
$0
9
$439,858
20
$328,962
3
$145,000
0
$0
Aggregated Statistics For Year 2002 (Based on 1 full tract)
A) FHA, FSA/RHS & VA Home Purchase Loans
B) Conventional Home Purchase Loans
C) Refinancings
D) Home Improvement Loans
F) Non-occupant Loans on < 5 Family Dwellings (A B C & D)
Number
Average Value
Number
Average Value
Number
Average Value
Number
Average Value
Number
Average Value
LOANS ORIGINATED
1
$84,000
57
$373,825
165
$257,352
15
$86,667
1
$126,000
APPLICATIONS APPROVED, NOT ACCEPTED
0
$0
8
$480,875
24
$236,792
4
$164,750
0
$0
APPLICATIONS DENIED
0
$0
8
$335,500
57
$272,070
8
$163,000
2
$200,000
APPLICATIONS WITHDRAWN
0
$0
7
$420,714
32
$233,562
4
$124,500
0
$0
FILES CLOSED FOR INCOMPLETENESS
0
$0
3
$456,667
22
$318,045
1
$25,000
1
$60,000
Aggregated Statistics For Year 2001 (Based on 1 full tract)
A) FHA, FSA/RHS & VA Home Purchase Loans
B) Conventional Home Purchase Loans
C) Refinancings
D) Home Improvement Loans
F) Non-occupant Loans on < 5 Family Dwellings (A B C & D)
Number
Average Value
Number
Average Value
Number
Average Value
Number
Average Value
Number
Average Value
LOANS ORIGINATED
0
$0
61
$317,344
99
$232,414
11
$41,727
1
$600,000
APPLICATIONS APPROVED, NOT ACCEPTED
0
$0
7
$478,000
22
$171,864
5
$101,000
0
$0
APPLICATIONS DENIED
0
$0
10
$344,700
37
$223,541
12
$78,333
2
$256,000
APPLICATIONS WITHDRAWN
1
$100,000
6
$386,500
20
$199,500
5
$86,400
0
$0
FILES CLOSED FOR INCOMPLETENESS
0
$0
1
$571,000
5
$278,200
2
$137,500
0
$0
Aggregated Statistics For Year 2000 (Based on 1 full tract)
B) Conventional Home Purchase Loans
C) Refinancings
D) Home Improvement Loans
F) Non-occupant Loans on < 5 Family Dwellings (A B C & D)
Number
Average Value
Number
Average Value
Number
Average Value
Number
Average Value
LOANS ORIGINATED
56
$282,304
27
$184,000
13
$52,462
1
$170,000
APPLICATIONS APPROVED, NOT ACCEPTED
6
$373,167
8
$130,125
8
$45,125
0
$0
APPLICATIONS DENIED
6
$303,667
20
$283,900
10
$46,200
0
$0
APPLICATIONS WITHDRAWN
8
$303,625
16
$153,125
1
$208,000
0
$0
FILES CLOSED FOR INCOMPLETENESS
1
$350,000
6
$333,833
1
$70,000
0
$0
Aggregated Statistics For Year 1999 (Based on 1 full and 1 partial tracts)
A) FHA, FSA/RHS & VA Home Purchase Loans
B) Conventional Home Purchase Loans
C) Refinancings
D) Home Improvement Loans
E) Loans on Dwellings For 5+ Families
F) Non-occupant Loans on < 5 Family Dwellings (A B C & D)
#51 on the list of "Top 101 cities with the largest percentage of people in hospitals or wards for drug/alcohol abuse (population 1,000+)"
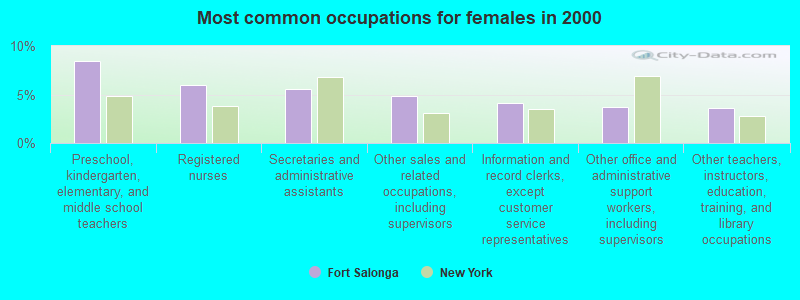
#75 on the list of "Top 101 cities with largest percentage of females in occupations: fire fighting and prevention workers including supervisors (population 5,000+)"
#87 on the list of "Top 101 cities with largest percentage of females in occupations: legal occupations (population 5,000+)"
#3 on the list of "Top 101 counties with the most Catholic adherents"
#6 on the list of "Top 101 counties with the lowest percentage of residents relocating from other counties between 2010 and 2011"
#7 on the list of "Top 101 counties with the lowest surface withdrawal of fresh water for public supply (pop. 50,000+)"
#9 on the list of "Top 101 counties with the lowest percentage of residents relocating to other counties in 2011"
#19 on the list of "Top 101 counties with the highest ground withdrawal of fresh water for public supply (pop. 50,000+)"


 Recent articles from our blog. Our writers, many of them Ph.D. graduates or candidates, create easy-to-read articles on a wide variety of topics.

 (9.1 miles