Folsom, Pennsylvania Submit your own pictures of this place and show them to the world
OSM Map
General Map
Google Map
MSN Map
OSM Map
General Map
Google Map
MSN Map
OSM Map
General Map
Google Map
MSN Map
OSM Map
General Map
Google Map
MSN Map
Please wait while loading the map...
Population in 2010: 8,323. Population change since 2000: +3.1%Males: 3,961 Females: 4,362
March 2022 cost of living index in Folsom: 103.7 (near average, U.S. average is 100) Percentage of residents living in poverty in 2022: 9.5%for White Non-Hispanic residents , 7.7% for Black residents )
Profiles of local businesses
Business Search - 14 Million verified businesses
Data:
Median household income ($)
Median household income (% change since 2000)
Household income diversity
Ratio of average income to average house value (%)
Ratio of average income to average rent
Median household income ($) - White
Median household income ($) - Black or African American
Median household income ($) - Asian
Median household income ($) - Hispanic or Latino
Median household income ($) - American Indian and Alaska Native
Median household income ($) - Multirace
Median household income ($) - Other Race
Median household income for houses/condos with a mortgage ($)
Median household income for apartments without a mortgage ($)
Races - White alone (%)
Races - White alone (% change since 2000)
Races - Black alone (%)
Races - Black alone (% change since 2000)
Races - American Indian alone (%)
Races - American Indian alone (% change since 2000)
Races - Asian alone (%)
Races - Asian alone (% change since 2000)
Races - Hispanic (%)
Races - Hispanic (% change since 2000)
Races - Native Hawaiian and Other Pacific Islander alone (%)
Races - Native Hawaiian and Other Pacific Islander alone (% change since 2000)
Races - Two or more races (%)
Races - Two or more races (% change since 2000)
Races - Other race alone (%)
Races - Other race alone (% change since 2000)
Racial diversity
Unemployment (%)
Unemployment (% change since 2000)
Unemployment (%) - White
Unemployment (%) - Black or African American
Unemployment (%) - Asian
Unemployment (%) - Hispanic or Latino
Unemployment (%) - American Indian and Alaska Native
Unemployment (%) - Multirace
Unemployment (%) - Other Race
Population density (people per square mile)
Population - Males (%)
Population - Females (%)
Population - Males (%) - White
Population - Males (%) - Black or African American
Population - Males (%) - Asian
Population - Males (%) - Hispanic or Latino
Population - Males (%) - American Indian and Alaska Native
Population - Males (%) - Multirace
Population - Males (%) - Other Race
Population - Females (%) - White
Population - Females (%) - Black or African American
Population - Females (%) - Asian
Population - Females (%) - Hispanic or Latino
Population - Females (%) - American Indian and Alaska Native
Population - Females (%) - Multirace
Population - Females (%) - Other Race
Coronavirus confirmed cases (May 16, 2024)
Deaths caused by coronavirus (May 16, 2024)
Coronavirus confirmed cases (per 100k population) (May 16, 2024)
Deaths caused by coronavirus (per 100k population) (May 16, 2024)
Daily increase in number of cases (May 16, 2024)
Weekly increase in number of cases (May 16, 2024)
Cases doubled (in days) (May 16, 2024)
Hospitalized patients (Apr 18, 2022)
Negative test results (Apr 18, 2022)
Total test results (Apr 18, 2022)
COVID Vaccine doses distributed (per 100k population) (Sep 19, 2023)
COVID Vaccine doses administered (per 100k population) (Sep 19, 2023)
COVID Vaccine doses distributed (Sep 19, 2023)
COVID Vaccine doses administered (Sep 19, 2023)
Likely homosexual households (%)
Likely homosexual households (% change since 2000)
Likely homosexual households - Lesbian couples (%)
Likely homosexual households - Lesbian couples (% change since 2000)
Likely homosexual households - Gay men (%)
Likely homosexual households - Gay men (% change since 2000)
Cost of living index
Median gross rent ($)
Median contract rent ($)
Median monthly housing costs ($)
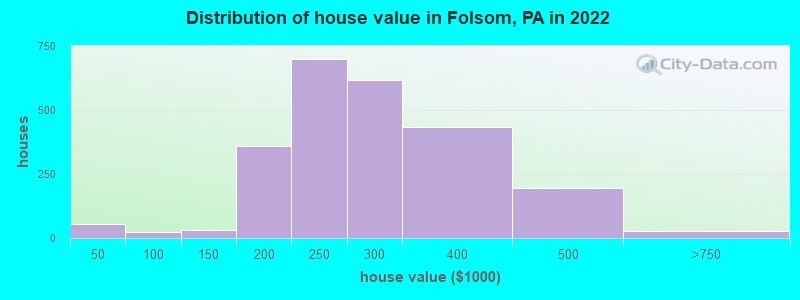
Median house or condo value ($)
Median house or condo value ($ change since 2000)
Mean house or condo value by units in structure - 1, detached ($)
Mean house or condo value by units in structure - 1, attached ($)
Mean house or condo value by units in structure - 2 ($)
Mean house or condo value by units in structure by units in structure - 3 or 4 ($)
Mean house or condo value by units in structure - 5 or more ($)
Mean house or condo value by units in structure - Boat, RV, van, etc. ($)
Mean house or condo value by units in structure - Mobile home ($)
Median house or condo value ($) - White
Median house or condo value ($) - Black or African American
Median house or condo value ($) - Asian
Median house or condo value ($) - Hispanic or Latino
Median house or condo value ($) - American Indian and Alaska Native
Median house or condo value ($) - Multirace
Median house or condo value ($) - Other Race
Median resident age
Resident age diversity
Median resident age - Males
Median resident age - Females
Median resident age - White
Median resident age - Black or African American
Median resident age - Asian
Median resident age - Hispanic or Latino
Median resident age - American Indian and Alaska Native
Median resident age - Multirace
Median resident age - Other Race
Median resident age - Males - White
Median resident age - Males - Black or African American
Median resident age - Males - Asian
Median resident age - Males - Hispanic or Latino
Median resident age - Males - American Indian and Alaska Native
Median resident age - Males - Multirace
Median resident age - Males - Other Race
Median resident age - Females - White
Median resident age - Females - Black or African American
Median resident age - Females - Asian
Median resident age - Females - Hispanic or Latino
Median resident age - Females - American Indian and Alaska Native
Median resident age - Females - Multirace
Median resident age - Females - Other Race
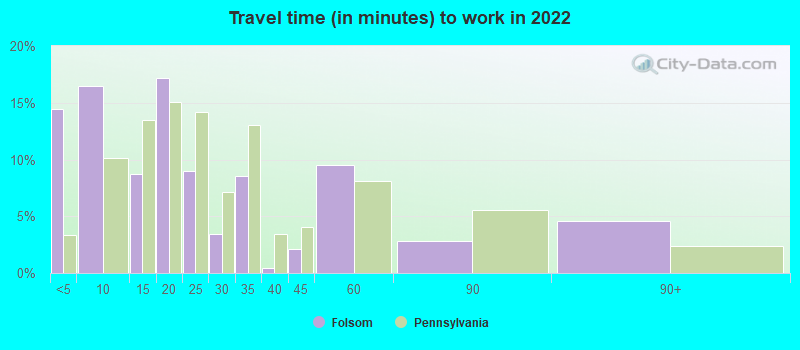
Commute - mean travel time to work (minutes)
Travel time to work - Less than 5 minutes (%)
Travel time to work - Less than 5 minutes (% change since 2000)
Travel time to work - 5 to 9 minutes (%)
Travel time to work - 5 to 9 minutes (% change since 2000)
Travel time to work - 10 to 19 minutes (%)
Travel time to work - 10 to 19 minutes (% change since 2000)
Travel time to work - 20 to 29 minutes (%)
Travel time to work - 20 to 29 minutes (% change since 2000)
Travel time to work - 30 to 39 minutes (%)
Travel time to work - 30 to 39 minutes (% change since 2000)
Travel time to work - 40 to 59 minutes (%)
Travel time to work - 40 to 59 minutes (% change since 2000)
Travel time to work - 60 to 89 minutes (%)
Travel time to work - 60 to 89 minutes (% change since 2000)
Travel time to work - 90 or more minutes (%)
Travel time to work - 90 or more minutes (% change since 2000)
Marital status - Never married (%)
Marital status - Now married (%)
Marital status - Separated (%)
Marital status - Widowed (%)
Marital status - Divorced (%)
Median family income ($)
Median family income (% change since 2000)
Median non-family income ($)
Median non-family income (% change since 2000)
Median per capita income ($)
Median per capita income (% change since 2000)
Median family income ($) - White
Median family income ($) - Black or African American
Median family income ($) - Asian
Median family income ($) - Hispanic or Latino
Median family income ($) - American Indian and Alaska Native
Median family income ($) - Multirace
Median family income ($) - Other Race
Median year house/condo built
Median year apartment built
Year house built - Built 2005 or later (%)
Year house built - Built 2000 to 2004 (%)
Year house built - Built 1990 to 1999 (%)
Year house built - Built 1980 to 1989 (%)
Year house built - Built 1970 to 1979 (%)
Year house built - Built 1960 to 1969 (%)
Year house built - Built 1950 to 1959 (%)
Year house built - Built 1940 to 1949 (%)
Year house built - Built 1939 or earlier (%)
Average household size
Household density (households per square mile)
Average household size - White
Average household size - Black or African American
Average household size - Asian
Average household size - Hispanic or Latino
Average household size - American Indian and Alaska Native
Average household size - Multirace
Average household size - Other Race
Occupied housing units (%)
Vacant housing units (%)
Owner occupied housing units (%)
Renter occupied housing units (%)
Vacancy status - For rent (%)
Vacancy status - For sale only (%)
Vacancy status - Rented or sold, not occupied (%)
Vacancy status - For seasonal, recreational, or occasional use (%)
Vacancy status - For migrant workers (%)
Vacancy status - Other vacant (%)
Residents with income below the poverty level (%)
Residents with income below 50% of the poverty level (%)
Children below poverty level (%)
Poor families by family type - Married-couple family (%)
Poor families by family type - Male, no wife present (%)
Poor families by family type - Female, no husband present (%)
Poverty status for native-born residents (%)
Poverty status for foreign-born residents (%)
Poverty among high school graduates not in families (%)
Poverty among people who did not graduate high school not in families (%)
Residents with income below the poverty level (%) - White
Residents with income below the poverty level (%) - Black or African American
Residents with income below the poverty level (%) - Asian
Residents with income below the poverty level (%) - Hispanic or Latino
Residents with income below the poverty level (%) - American Indian and Alaska Native
Residents with income below the poverty level (%) - Multirace
Residents with income below the poverty level (%) - Other Race
Air pollution - Air Quality Index (AQI)
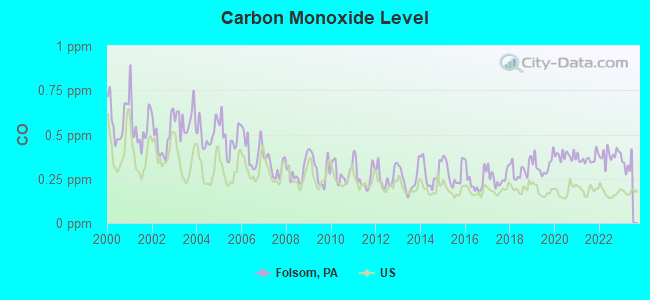
Air pollution - CO
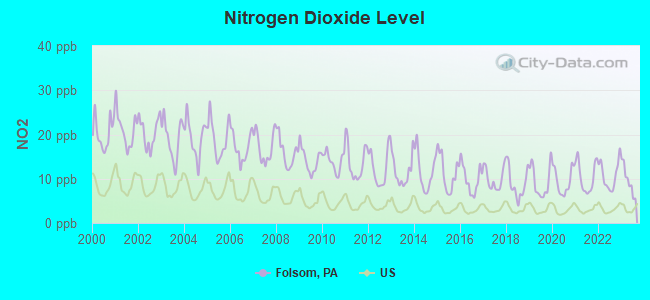
Air pollution - NO2
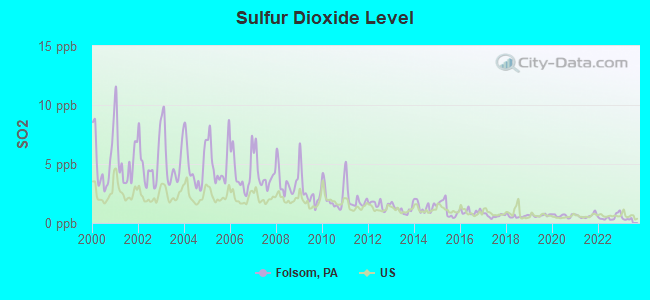
Air pollution - SO2
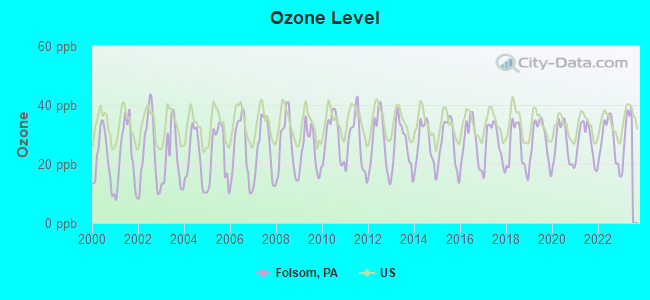
Air pollution - Ozone
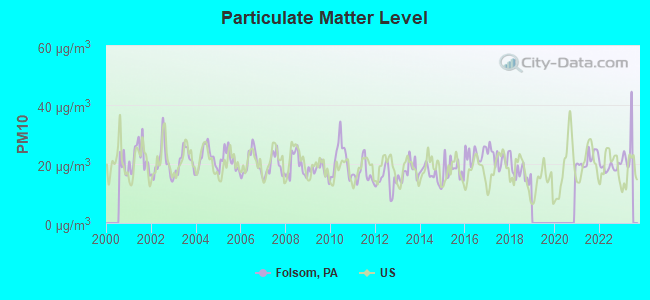
Air pollution - PM10
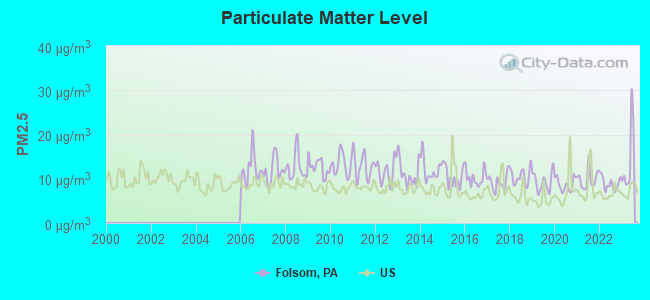
Air pollution - PM25
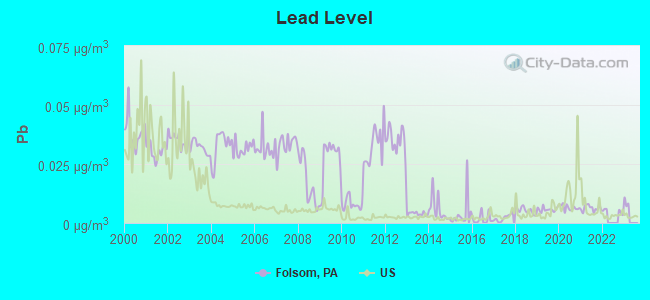
Air pollution - Pb
Crime - Murders per 100,000 population
Crime - Rapes per 100,000 population
Crime - Robberies per 100,000 population
Crime - Assaults per 100,000 population
Crime - Burglaries per 100,000 population
Crime - Thefts per 100,000 population
Crime - Auto thefts per 100,000 population
Crime - Arson per 100,000 population
Crime - City-data.com crime index
Crime - Violent crime index
Crime - Property crime index
Crime - Murders per 100,000 population (5 year average)
Crime - Rapes per 100,000 population (5 year average)
Crime - Robberies per 100,000 population (5 year average)
Crime - Assaults per 100,000 population (5 year average)
Crime - Burglaries per 100,000 population (5 year average)
Crime - Thefts per 100,000 population (5 year average)
Crime - Auto thefts per 100,000 population (5 year average)
Crime - Arson per 100,000 population (5 year average)
Crime - City-data.com crime index (5 year average)
Crime - Violent crime index (5 year average)
Crime - Property crime index (5 year average)
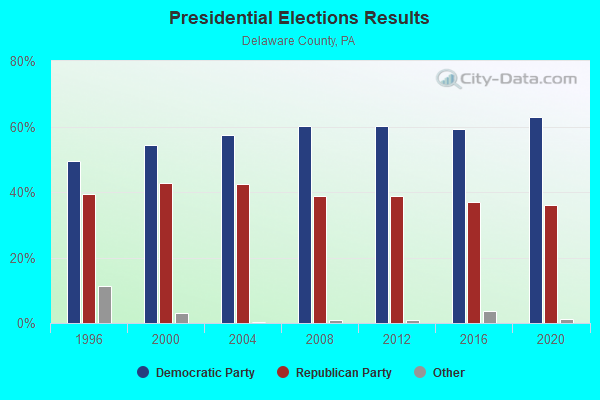
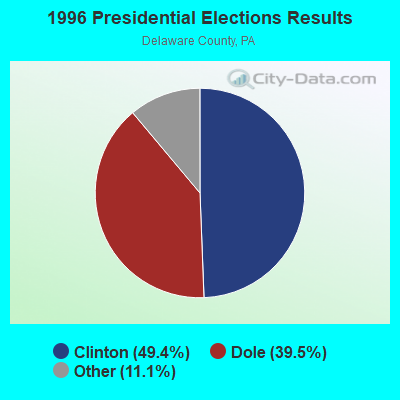
1996 Presidential Elections Results (%) - Democratic Party (Clinton)
1996 Presidential Elections Results (%) - Republican Party (Dole)
1996 Presidential Elections Results (%) - Other
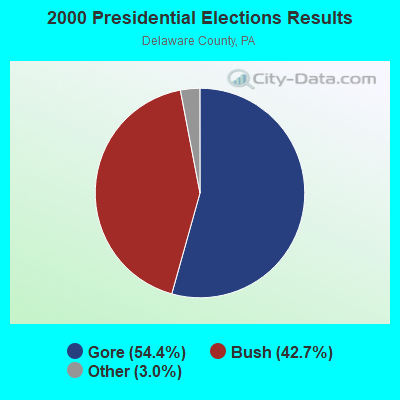
2000 Presidential Elections Results (%) - Democratic Party (Gore)
2000 Presidential Elections Results (%) - Republican Party (Bush)
2000 Presidential Elections Results (%) - Other
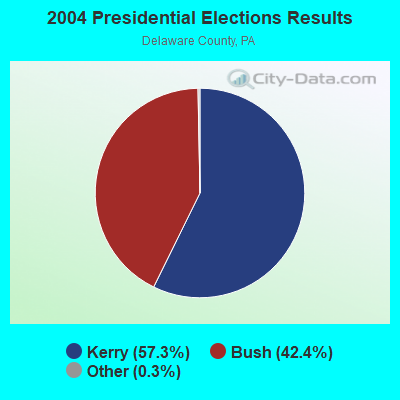
2004 Presidential Elections Results (%) - Democratic Party (Kerry)
2004 Presidential Elections Results (%) - Republican Party (Bush)
2004 Presidential Elections Results (%) - Other
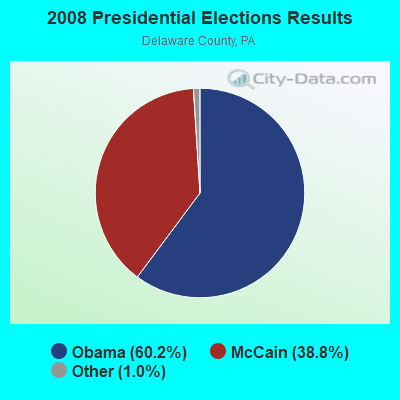
2008 Presidential Elections Results (%) - Democratic Party (Obama)
2008 Presidential Elections Results (%) - Republican Party (McCain)
2008 Presidential Elections Results (%) - Other
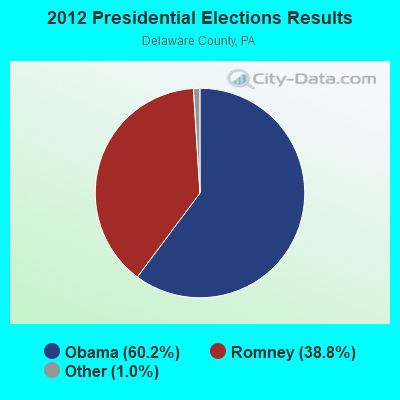
2012 Presidential Elections Results (%) - Democratic Party (Obama)
2012 Presidential Elections Results (%) - Republican Party (Romney)
2012 Presidential Elections Results (%) - Other
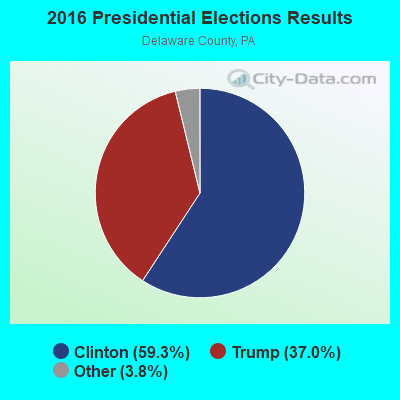
2016 Presidential Elections Results (%) - Democratic Party (Clinton)
2016 Presidential Elections Results (%) - Republican Party (Trump)
2016 Presidential Elections Results (%) - Other
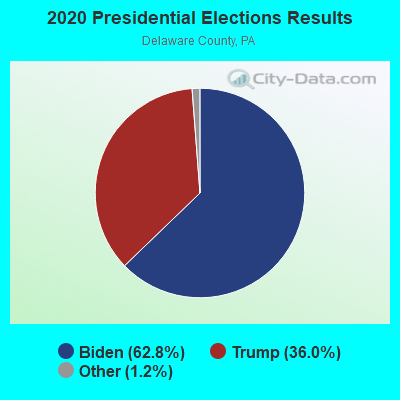
2020 Presidential Elections Results (%) - Democratic Party (Biden)
2020 Presidential Elections Results (%) - Republican Party (Trump)
2020 Presidential Elections Results (%) - Other
Ancestries Reported - Arab (%)
Ancestries Reported - Czech (%)
Ancestries Reported - Danish (%)
Ancestries Reported - Dutch (%)
Ancestries Reported - English (%)
Ancestries Reported - French (%)
Ancestries Reported - French Canadian (%)
Ancestries Reported - German (%)
Ancestries Reported - Greek (%)
Ancestries Reported - Hungarian (%)
Ancestries Reported - Irish (%)
Ancestries Reported - Italian (%)
Ancestries Reported - Lithuanian (%)
Ancestries Reported - Norwegian (%)
Ancestries Reported - Polish (%)
Ancestries Reported - Portuguese (%)
Ancestries Reported - Russian (%)
Ancestries Reported - Scotch-Irish (%)
Ancestries Reported - Scottish (%)
Ancestries Reported - Slovak (%)
Ancestries Reported - Subsaharan African (%)
Ancestries Reported - Swedish (%)
Ancestries Reported - Swiss (%)
Ancestries Reported - Ukrainian (%)
Ancestries Reported - United States (%)
Ancestries Reported - Welsh (%)
Ancestries Reported - West Indian (%)
Ancestries Reported - Other (%)
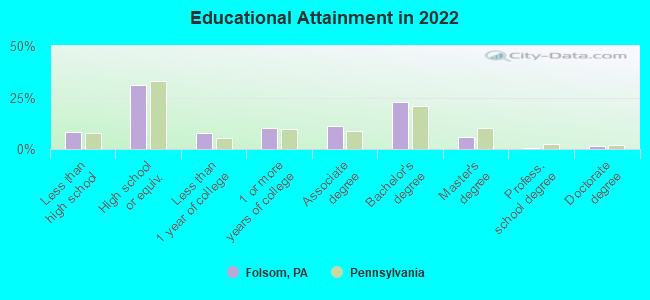
Educational Attainment - No schooling completed (%)
Educational Attainment - Less than high school (%)
Educational Attainment - High school or equivalent (%)
Educational Attainment - Less than 1 year of college (%)
Educational Attainment - 1 or more years of college (%)
Educational Attainment - Associate degree (%)
Educational Attainment - Bachelor's degree (%)
Educational Attainment - Master's degree (%)
Educational Attainment - Professional school degree (%)
Educational Attainment - Doctorate degree (%)
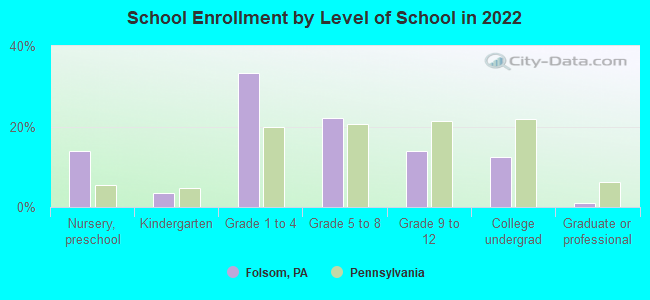
School Enrollment - Nursery, preschool (%)
School Enrollment - Kindergarten (%)
School Enrollment - Grade 1 to 4 (%)
School Enrollment - Grade 5 to 8 (%)
School Enrollment - Grade 9 to 12 (%)
School Enrollment - College undergrad (%)
School Enrollment - Graduate or professional (%)
School Enrollment - Not enrolled in school (%)
School enrollment - Public schools (%)
School enrollment - Private schools (%)
School enrollment - Not enrolled (%)
Median number of rooms in houses and condos
Median number of rooms in apartments
Housing units lacking complete plumbing facilities (%)
Housing units lacking complete kitchen facilities (%)
Density of houses
Urban houses (%)
Rural houses (%)
Households with people 60 years and over (%)
Households with people 65 years and over (%)
Households with people 75 years and over (%)
Households with one or more nonrelatives (%)
Households with no nonrelatives (%)
Population in households (%)
Family households (%)
Nonfamily households (%)
Population in families (%)
Family households with own children (%)
Median number of bedrooms in owner occupied houses
Mean number of bedrooms in owner occupied houses
Median number of bedrooms in renter occupied houses
Mean number of bedrooms in renter occupied houses
Median number of vehichles in owner occupied houses
Mean number of vehichles in owner occupied houses
Median number of vehichles in renter occupied houses
Mean number of vehichles in renter occupied houses
Mortgage status - with mortgage (%)
Mortgage status - with second mortgage (%)
Mortgage status - with home equity loan (%)
Mortgage status - with both second mortgage and home equity loan (%)
Mortgage status - without a mortgage (%)
Average family size
Average family size - White
Average family size - Black or African American
Average family size - Asian
Average family size - Hispanic or Latino
Average family size - American Indian and Alaska Native
Average family size - Multirace
Average family size - Other Race
Geographical mobility - Same house 1 year ago (%)
Geographical mobility - Moved within same county (%)
Geographical mobility - Moved from different county within same state (%)
Geographical mobility - Moved from different state (%)
Geographical mobility - Moved from abroad (%)
Place of birth - Born in state of residence (%)
Place of birth - Born in other state (%)
Place of birth - Native, outside of US (%)
Place of birth - Foreign born (%)
Housing units in structures - 1, detached (%)
Housing units in structures - 1, attached (%)
Housing units in structures - 2 (%)
Housing units in structures - 3 or 4 (%)
Housing units in structures - 5 to 9 (%)
Housing units in structures - 10 to 19 (%)
Housing units in structures - 20 to 49 (%)
Housing units in structures - 50 or more (%)
Housing units in structures - Mobile home (%)
Housing units in structures - Boat, RV, van, etc. (%)
House/condo owner moved in on average (years ago)
Renter moved in on average (years ago)
Year householder moved into unit - Moved in 1999 to March 2000 (%)
Year householder moved into unit - Moved in 1995 to 1998 (%)
Year householder moved into unit - Moved in 1990 to 1994 (%)
Year householder moved into unit - Moved in 1980 to 1989 (%)
Year householder moved into unit - Moved in 1970 to 1979 (%)
Year householder moved into unit - Moved in 1969 or earlier (%)
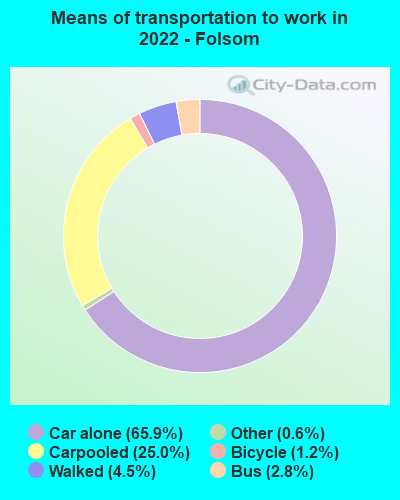
Means of transportation to work - Drove car alone (%)
Means of transportation to work - Carpooled (%)
Means of transportation to work - Public transportation (%)
Means of transportation to work - Bus or trolley bus (%)
Means of transportation to work - Streetcar or trolley car (%)
Means of transportation to work - Subway or elevated (%)
Means of transportation to work - Railroad (%)
Means of transportation to work - Ferryboat (%)
Means of transportation to work - Taxicab (%)
Means of transportation to work - Motorcycle (%)
Means of transportation to work - Bicycle (%)
Means of transportation to work - Walked (%)
Means of transportation to work - Other means (%)
Working at home (%)
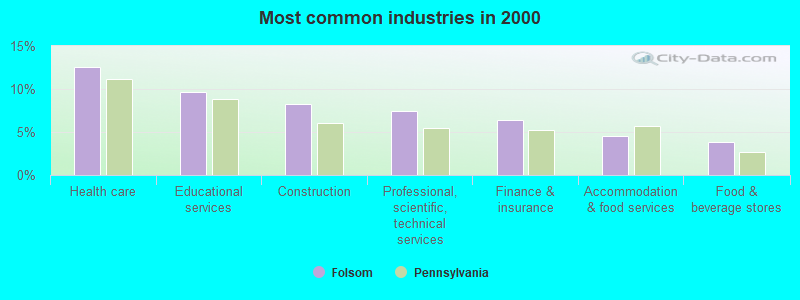
Industry diversity
Most Common Industries - Agriculture, forestry, fishing and hunting, and mining (%)
Most Common Industries - Agriculture, forestry, fishing and hunting (%)
Most Common Industries - Mining, quarrying, and oil and gas extraction (%)
Most Common Industries - Construction (%)
Most Common Industries - Manufacturing (%)
Most Common Industries - Wholesale trade (%)
Most Common Industries - Retail trade (%)
Most Common Industries - Transportation and warehousing, and utilities (%)
Most Common Industries - Transportation and warehousing (%)
Most Common Industries - Utilities (%)
Most Common Industries - Information (%)
Most Common Industries - Finance and insurance, and real estate and rental and leasing (%)
Most Common Industries - Finance and insurance (%)
Most Common Industries - Real estate and rental and leasing (%)
Most Common Industries - Professional, scientific, and management, and administrative and waste management services (%)
Most Common Industries - Professional, scientific, and technical services (%)
Most Common Industries - Management of companies and enterprises (%)
Most Common Industries - Administrative and support and waste management services (%)
Most Common Industries - Educational services, and health care and social assistance (%)
Most Common Industries - Educational services (%)
Most Common Industries - Health care and social assistance (%)
Most Common Industries - Arts, entertainment, and recreation, and accommodation and food services (%)
Most Common Industries - Arts, entertainment, and recreation (%)
Most Common Industries - Accommodation and food services (%)
Most Common Industries - Other services, except public administration (%)
Most Common Industries - Public administration (%)
Occupation diversity
Most Common Occupations - Management, business, science, and arts occupations (%)
Most Common Occupations - Management, business, and financial occupations (%)
Most Common Occupations - Management occupations (%)
Most Common Occupations - Business and financial operations occupations (%)
Most Common Occupations - Computer, engineering, and science occupations (%)
Most Common Occupations - Computer and mathematical occupations (%)
Most Common Occupations - Architecture and engineering occupations (%)
Most Common Occupations - Life, physical, and social science occupations (%)
Most Common Occupations - Education, legal, community service, arts, and media occupations (%)
Most Common Occupations - Community and social service occupations (%)
Most Common Occupations - Legal occupations (%)
Most Common Occupations - Education, training, and library occupations (%)
Most Common Occupations - Arts, design, entertainment, sports, and media occupations (%)
Most Common Occupations - Healthcare practitioners and technical occupations (%)
Most Common Occupations - Health diagnosing and treating practitioners and other technical occupations (%)
Most Common Occupations - Health technologists and technicians (%)
Most Common Occupations - Service occupations (%)
Most Common Occupations - Healthcare support occupations (%)
Most Common Occupations - Protective service occupations (%)
Most Common Occupations - Fire fighting and prevention, and other protective service workers including supervisors (%)
Most Common Occupations - Law enforcement workers including supervisors (%)
Most Common Occupations - Food preparation and serving related occupations (%)
Most Common Occupations - Building and grounds cleaning and maintenance occupations (%)
Most Common Occupations - Personal care and service occupations (%)
Most Common Occupations - Sales and office occupations (%)
Most Common Occupations - Sales and related occupations (%)
Most Common Occupations - Office and administrative support occupations (%)
Most Common Occupations - Natural resources, construction, and maintenance occupations (%)
Most Common Occupations - Farming, fishing, and forestry occupations (%)
Most Common Occupations - Construction and extraction occupations (%)
Most Common Occupations - Installation, maintenance, and repair occupations (%)
Most Common Occupations - Production, transportation, and material moving occupations (%)
Most Common Occupations - Production occupations (%)
Most Common Occupations - Transportation occupations (%)
Most Common Occupations - Material moving occupations (%)
People in Group quarters - Institutionalized population (%)
People in Group quarters - Correctional institutions (%)
People in Group quarters - Federal prisons and detention centers (%)
People in Group quarters - Halfway houses (%)
People in Group quarters - Local jails and other confinement facilities (including police lockups) (%)
People in Group quarters - Military disciplinary barracks (%)
People in Group quarters - State prisons (%)
People in Group quarters - Other types of correctional institutions (%)
People in Group quarters - Nursing homes (%)
People in Group quarters - Hospitals/wards, hospices, and schools for the handicapped (%)
People in Group quarters - Hospitals/wards and hospices for chronically ill (%)
People in Group quarters - Hospices or homes for chronically ill (%)
People in Group quarters - Military hospitals or wards for chronically ill (%)
People in Group quarters - Other hospitals or wards for chronically ill (%)
People in Group quarters - Hospitals or wards for drug/alcohol abuse (%)
People in Group quarters - Mental (Psychiatric) hospitals or wards (%)
People in Group quarters - Schools, hospitals, or wards for the mentally retarded (%)
People in Group quarters - Schools, hospitals, or wards for the physically handicapped (%)
People in Group quarters - Institutions for the deaf (%)
People in Group quarters - Institutions for the blind (%)
People in Group quarters - Orthopedic wards and institutions for the physically handicapped (%)
People in Group quarters - Wards in general hospitals for patients who have no usual home elsewhere (%)
People in Group quarters - Wards in military hospitals for patients who have no usual home elsewhere (%)
People in Group quarters - Juvenile institutions (%)
People in Group quarters - Long-term care (%)
People in Group quarters - Homes for abused, dependent, and neglected children (%)
People in Group quarters - Residential treatment centers for emotionally disturbed children (%)
People in Group quarters - Training schools for juvenile delinquents (%)
People in Group quarters - Short-term care, detention or diagnostic centers for delinquent children (%)
People in Group quarters - Type of juvenile institution unknown (%)
People in Group quarters - Noninstitutionalized population (%)
People in Group quarters - College dormitories (includes college quarters off campus) (%)
People in Group quarters - Military quarters (%)
People in Group quarters - On base (%)
People in Group quarters - Barracks, unaccompanied personnel housing (UPH), (Enlisted/Officer), ;and similar group living quarters for military personnel (%)
People in Group quarters - Transient quarters for temporary residents (%)
People in Group quarters - Military ships (%)
People in Group quarters - Group homes (%)
People in Group quarters - Homes or halfway houses for drug/alcohol abuse (%)
People in Group quarters - Homes for the mentally ill (%)
People in Group quarters - Homes for the mentally retarded (%)
People in Group quarters - Homes for the physically handicapped (%)
People in Group quarters - Other group homes (%)
People in Group quarters - Religious group quarters (%)
People in Group quarters - Dormitories (%)
People in Group quarters - Agriculture workers' dormitories on farms (%)
People in Group quarters - Job Corps and vocational training facilities (%)
People in Group quarters - Other workers' dormitories (%)
People in Group quarters - Crews of maritime vessels (%)
People in Group quarters - Other nonhousehold living situations (%)
People in Group quarters - Other noninstitutional group quarters (%)
Residents speaking English at home (%)
Residents speaking English at home - Born in the United States (%)
Residents speaking English at home - Native, born elsewhere (%)
Residents speaking English at home - Foreign born (%)
Residents speaking Spanish at home (%)
Residents speaking Spanish at home - Born in the United States (%)
Residents speaking Spanish at home - Native, born elsewhere (%)
Residents speaking Spanish at home - Foreign born (%)
Residents speaking other language at home (%)
Residents speaking other language at home - Born in the United States (%)
Residents speaking other language at home - Native, born elsewhere (%)
Residents speaking other language at home - Foreign born (%)
Class of Workers - Employee of private company (%)
Class of Workers - Self-employed in own incorporated business (%)
Class of Workers - Private not-for-profit wage and salary workers (%)
Class of Workers - Local government workers (%)
Class of Workers - State government workers (%)
Class of Workers - Federal government workers (%)
Class of Workers - Self-employed workers in own not incorporated business and Unpaid family workers (%)
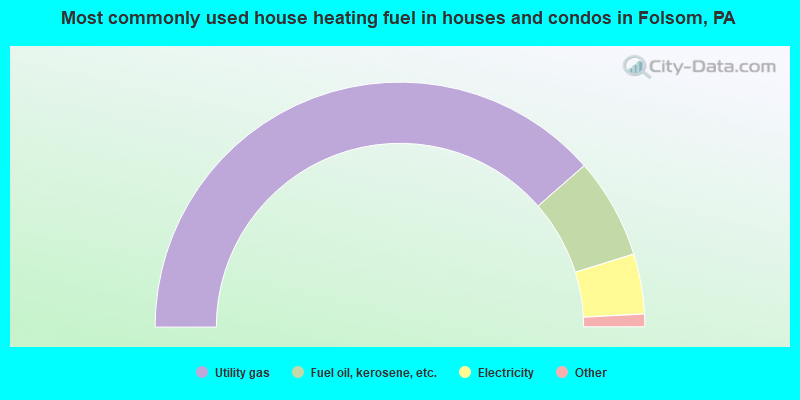
House heating fuel used in houses and condos - Utility gas (%)
House heating fuel used in houses and condos - Bottled, tank, or LP gas (%)
House heating fuel used in houses and condos - Electricity (%)
House heating fuel used in houses and condos - Fuel oil, kerosene, etc. (%)
House heating fuel used in houses and condos - Coal or coke (%)
House heating fuel used in houses and condos - Wood (%)
House heating fuel used in houses and condos - Solar energy (%)
House heating fuel used in houses and condos - Other fuel (%)
House heating fuel used in houses and condos - No fuel used (%)
House heating fuel used in apartments - Utility gas (%)
House heating fuel used in apartments - Bottled, tank, or LP gas (%)
House heating fuel used in apartments - Electricity (%)
House heating fuel used in apartments - Fuel oil, kerosene, etc. (%)
House heating fuel used in apartments - Coal or coke (%)
House heating fuel used in apartments - Wood (%)
House heating fuel used in apartments - Solar energy (%)
House heating fuel used in apartments - Other fuel (%)
House heating fuel used in apartments - No fuel used (%)
Armed forces status - In Armed Forces (%)
Armed forces status - Civilian (%)
Armed forces status - Civilian - Veteran (%)
Armed forces status - Civilian - Nonveteran (%)
Fatal accidents locations in years 2005-2021
Fatal accidents locations in 2005
Fatal accidents locations in 2006
Fatal accidents locations in 2007
Fatal accidents locations in 2008
Fatal accidents locations in 2009
Fatal accidents locations in 2010
Fatal accidents locations in 2011
Fatal accidents locations in 2012
Fatal accidents locations in 2013
Fatal accidents locations in 2014
Fatal accidents locations in 2015
Fatal accidents locations in 2016
Fatal accidents locations in 2017
Fatal accidents locations in 2018
Fatal accidents locations in 2019
Fatal accidents locations in 2020
Fatal accidents locations in 2021
Alcohol use - People drinking some alcohol every month (%)
Alcohol use - People not drinking at all (%)
Alcohol use - Average days/month drinking alcohol
Alcohol use - Average drinks/week
Alcohol use - Average days/year people drink much
Audiometry - Average condition of hearing (%)
Audiometry - People that can hear a whisper from across a quiet room (%)
Audiometry - People that can hear normal voice from across a quiet room (%)
Audiometry - Ears ringing, roaring, buzzing (%)
Audiometry - Had a job exposure to loud noise (%)
Audiometry - Had off-work exposure to loud noise (%)
Blood Pressure & Cholesterol - Has high blood pressure (%)
Blood Pressure & Cholesterol - Checking blood pressure at home (%)
Blood Pressure & Cholesterol - Frequently checking blood cholesterol (%)
Blood Pressure & Cholesterol - Has high cholesterol level (%)
Consumer Behavior - Money monthly spent on food at supermarket/grocery store
Consumer Behavior - Money monthly spent on food at other stores
Consumer Behavior - Money monthly spent on eating out
Consumer Behavior - Money monthly spent on carryout/delivered foods
Consumer Behavior - Income spent on food at supermarket/grocery store (%)
Consumer Behavior - Income spent on food at other stores (%)
Consumer Behavior - Income spent on eating out (%)
Consumer Behavior - Income spent on carryout/delivered foods (%)
Current Health Status - General health condition (%)
Current Health Status - Blood donors (%)
Current Health Status - Has blood ever tested for HIV virus (%)
Current Health Status - Left-handed people (%)
Dermatology - People using sunscreen (%)
Diabetes - Diabetics (%)
Diabetes - Had a blood test for high blood sugar (%)
Diabetes - People taking insulin (%)
Diet Behavior & Nutrition - Diet health (%)
Diet Behavior & Nutrition - Milk product consumption (# of products/month)
Diet Behavior & Nutrition - Meals not home prepared (#/week)
Diet Behavior & Nutrition - Meals from fast food or pizza place (#/week)
Diet Behavior & Nutrition - Ready-to-eat foods (#/month)
Diet Behavior & Nutrition - Frozen meals/pizza (#/month)
Drug Use - People that ever used marijuana or hashish (%)
Drug Use - Ever used hard drugs (%)
Drug Use - Ever used any form of cocaine (%)
Drug Use - Ever used heroin (%)
Drug Use - Ever used methamphetamine (%)
Health Insurance - People covered by health insurance (%)
Kidney Conditions-Urology - Avg. # of times urinating at night
Medical Conditions - People with asthma (%)
Medical Conditions - People with anemia (%)
Medical Conditions - People with psoriasis (%)
Medical Conditions - People with overweight (%)
Medical Conditions - Elderly people having difficulties in thinking or remembering (%)
Medical Conditions - People who ever received blood transfusion (%)
Medical Conditions - People having trouble seeing even with glass/contacts (%)
Medical Conditions - People with arthritis (%)
Medical Conditions - People with gout (%)
Medical Conditions - People with congestive heart failure (%)
Medical Conditions - People with coronary heart disease (%)
Medical Conditions - People with angina pectoris (%)
Medical Conditions - People who ever had heart attack (%)
Medical Conditions - People who ever had stroke (%)
Medical Conditions - People with emphysema (%)
Medical Conditions - People with thyroid problem (%)
Medical Conditions - People with chronic bronchitis (%)
Medical Conditions - People with any liver condition (%)
Medical Conditions - People who ever had cancer or malignancy (%)
Mental Health - People who have little interest in doing things (%)
Mental Health - People feeling down, depressed, or hopeless (%)
Mental Health - People who have trouble sleeping or sleeping too much (%)
Mental Health - People feeling tired or having little energy (%)
Mental Health - People with poor appetite or overeating (%)
Mental Health - People feeling bad about themself (%)
Mental Health - People who have trouble concentrating on things (%)
Mental Health - People moving or speaking slowly or too fast (%)
Mental Health - People having thoughts they would be better off dead (%)
Oral Health - Average years since last visit a dentist
Oral Health - People embarrassed because of mouth (%)
Oral Health - People with gum disease (%)
Oral Health - General health of teeth and gums (%)
Oral Health - Average days a week using dental floss/device
Oral Health - Average days a week using mouthwash for dental problem
Oral Health - Average number of teeth
Pesticide Use - Households using pesticides to control insects (%)
Pesticide Use - Households using pesticides to kill weeds (%)
Physical Activity - People doing vigorous-intensity work activities (%)
Physical Activity - People doing moderate-intensity work activities (%)
Physical Activity - People walking or bicycling (%)
Physical Activity - People doing vigorous-intensity recreational activities (%)
Physical Activity - People doing moderate-intensity recreational activities (%)
Physical Activity - Average hours a day doing sedentary activities
Physical Activity - Average hours a day watching TV or videos
Physical Activity - Average hours a day using computer
Physical Functioning - People having limitations keeping them from working (%)
Physical Functioning - People limited in amount of work they can do (%)
Physical Functioning - People that need special equipment to walk (%)
Physical Functioning - People experiencing confusion/memory problems (%)
Physical Functioning - People requiring special healthcare equipment (%)
Prescription Medications - Average number of prescription medicines taking
Preventive Aspirin Use - Adults 40+ taking low-dose aspirin (%)
Reproductive Health - Vaginal deliveries (%)
Reproductive Health - Cesarean deliveries (%)
Reproductive Health - Deliveries resulted in a live birth (%)
Reproductive Health - Pregnancies resulted in a delivery (%)
Reproductive Health - Women breastfeeding newborns (%)
Reproductive Health - Women that had a hysterectomy (%)
Reproductive Health - Women that had both ovaries removed (%)
Reproductive Health - Women that have ever taken birth control pills (%)
Reproductive Health - Women taking birth control pills (%)
Reproductive Health - Women that have ever used Depo-Provera or injectables (%)
Reproductive Health - Women that have ever used female hormones (%)
Sexual Behavior - People 18+ that ever had sex (vaginal, anal, or oral) (%)
Sexual Behavior - Males 18+ that ever had vaginal sex with a woman (%)
Sexual Behavior - Males 18+ that ever performed oral sex on a woman (%)
Sexual Behavior - Males 18+ that ever had anal sex with a woman (%)
Sexual Behavior - Males 18+ that ever had any sex with a man (%)
Sexual Behavior - Females 18+ that ever had vaginal sex with a man (%)
Sexual Behavior - Females 18+ that ever performed oral sex on a man (%)
Sexual Behavior - Females 18+ that ever had anal sex with a man (%)
Sexual Behavior - Females 18+ that ever had any kind of sex with a woman (%)
Sexual Behavior - Average age people first had sex
Sexual Behavior - Average number of female sex partners in lifetime (males 18+)
Sexual Behavior - Average number of female vaginal sex partners in lifetime (males 18+)
Sexual Behavior - Average age people first performed oral sex on a woman (18+)
Sexual Behavior - Average number of woman performed oral sex on in lifetime (18+)
Sexual Behavior - Average number of male sex partners in lifetime (males 18+)
Sexual Behavior - Average number of male anal sex partners in lifetime (males 18+)
Sexual Behavior - Average age people first performed oral sex on a man (18+)
Sexual Behavior - Average number of male oral sex partners in lifetime (18+)
Sexual Behavior - People using protection when performing oral sex (%)
Sexual Behavior - Average number of times people have vaginal or anal sex a year
Sexual Behavior - People having sex without condom (%)
Sexual Behavior - Average number of male sex partners in lifetime (females 18+)
Sexual Behavior - Average number of male vaginal sex partners in lifetime (females 18+)
Sexual Behavior - Average number of female sex partners in lifetime (females 18+)
Sexual Behavior - Circumcised males 18+ (%)
Sleep Disorders - Average hours sleeping at night
Sleep Disorders - People that has trouble sleeping (%)
Smoking-Cigarette Use - People smoking cigarettes (%)
Taste & Smell - People 40+ having problems with smell (%)
Taste & Smell - People 40+ having problems with taste (%)
Taste & Smell - People 40+ that ever had wisdom teeth removed (%)
Taste & Smell - People 40+ that ever had tonsils teeth removed (%)
Taste & Smell - People 40+ that ever had a loss of consciousness because of a head injury (%)
Taste & Smell - People 40+ that ever had a broken nose or other serious injury to face or skull (%)
Taste & Smell - People 40+ that ever had two or more sinus infections (%)
Weight - Average height (inches)
Weight - Average weight (pounds)
Weight - Average BMI
Weight - People that are obese (%)
Weight - People that ever were obese (%)
Weight - People trying to lose weight (%)
According to our research of Pennsylvania and other state lists, there were 9 registered sex offenders living in Folsom, Pennsylvania as of May 16, 2024 . The ratio of all residents to sex offenders in Folsom is 940 to 1.The ratio of registered sex offenders to all residents in this city is lower than the state average.
Latest news from Folsom, PA collected exclusively by city-data.com from local newspapers, TV, and radio stations
Ancestries: Irish (34.2%), Italian (16.1%), German (10.7%), Jordanian (7.7%), European (4.3%), English (3.9%).
Current Local Time:
Land area: 1.25 square miles.
Population density: 6,656 people per square mile (high).
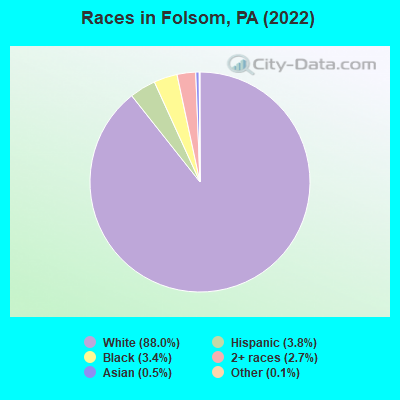
517 residents are foreign born (4.6% Asia , 0.8% Europe ).
This place:
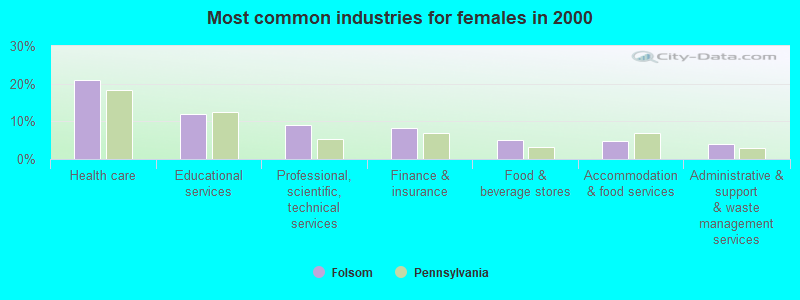
6.1%Pennsylvania:
7.3%
Median real estate property taxes paid for housing units with mortgages in 2022: $6,443 (2.3%)Median real estate property taxes paid for housing units with no mortgage in 2022: $6,071 (2.4%)
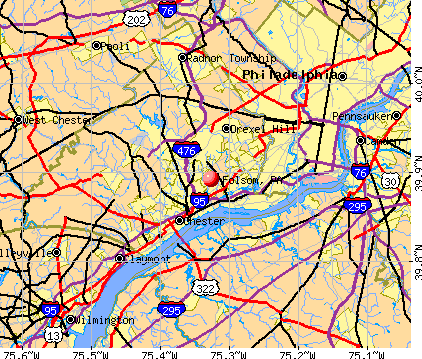
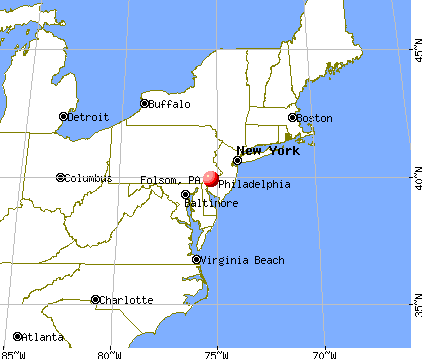
Nearest city with pop. 50,000+: Brandywine, DE (11.5 miles
Nearest city with pop. 200,000+: Philadelphia, PA
Nearest cities:
Latitude: 39.89 N, Longitude: 75.33 W
Daytime population change due to commuting: -1,968 (-23.1%)Workers who live and work in this place: 624 (14.3%)
Unemployment in December 2023: Here:
2.7%Pennsylvania:
2.9%
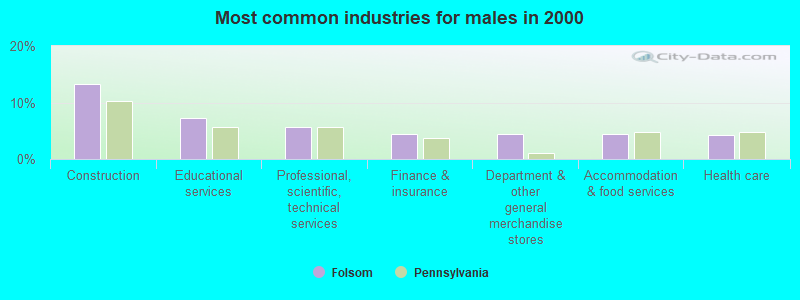
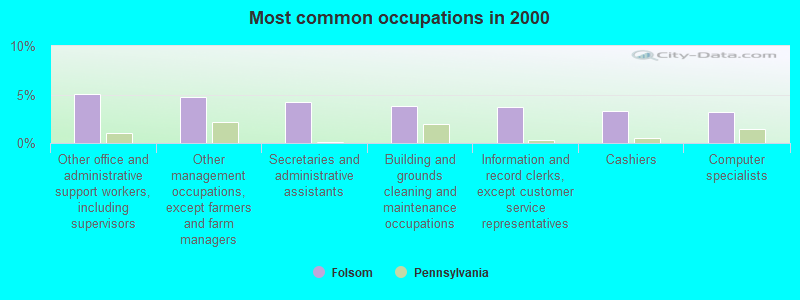
Most common occupations in Folsom, PA (%)
Both Males Females
Other office and administrative support workers, including supervisors (5.1%)
Other management occupations, except farmers and farm managers (4.7%)
Secretaries and administrative assistants (4.2%)
Building and grounds cleaning and maintenance occupations (3.8%)
Information and record clerks, except customer service representatives (3.7%)
Cashiers (3.3%)
Computer specialists (3.2%)
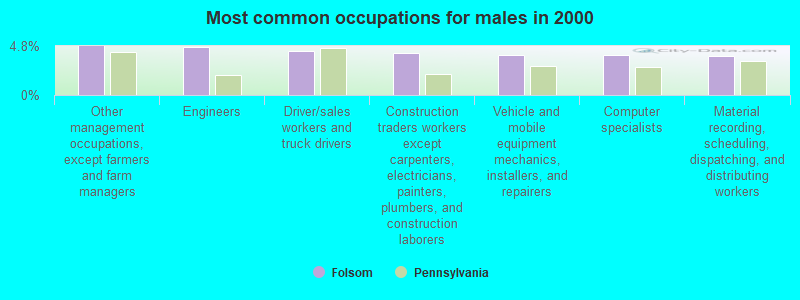
Other management occupations, except farmers and farm managers (4.8%)
Engineers (4.7%)
Driver/sales workers and truck drivers (4.3%)
Construction traders workers except carpenters, electricians, painters, plumbers, and construction laborers (4.2%)
Vehicle and mobile equipment mechanics, installers, and repairers (3.9%)
Computer specialists (3.9%)
Material recording, scheduling, dispatching, and distributing workers (3.8%)
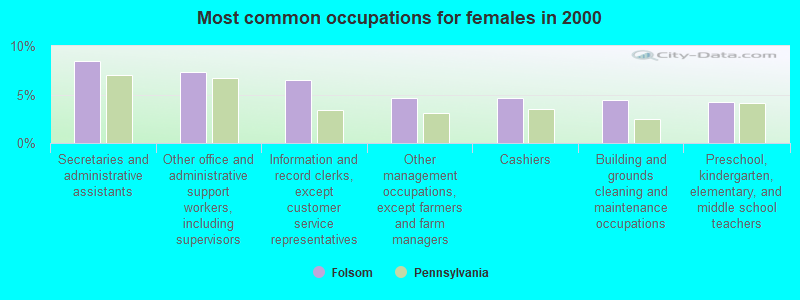
Secretaries and administrative assistants (8.4%)
Other office and administrative support workers, including supervisors (7.3%)
Information and record clerks, except customer service representatives (6.4%)
Other management occupations, except farmers and farm managers (4.6%)
Cashiers (4.6%)
Building and grounds cleaning and maintenance occupations (4.4%)
Preschool, kindergarten, elementary, and middle school teachers (4.2%)
Tornado activity:
Folsom-area historical tornado activity is slightly above Pennsylvania state average. It is 2% greater than the overall U.S. average.
On 3/22/1955, a category F3 (max. wind speeds 158-206 mph) tornado 13.3 miles away from the Folsom place center killed one person and caused between $50,000 and $500,000 in damages.
On 4/28/1961, a category F3 tornado 20.1 miles away from the place center caused between $5000 and $50,000 in damages.
Earthquake activity:
Folsom-area historical earthquake activity is significantly above Pennsylvania state average. It is 65% smaller than the overall U.S. average. On 8/23/2011 at 17:51:04, a magnitude 5.8 (5.8 MW, Depth: 3.7 mi, Class: Moderate, Intensity: VI - VII) earthquake occurred 196.3 miles away from Folsom center On 1/16/1994 at 01:49:16, a magnitude 4.6 (4.6 MB, 4.6 LG, Depth: 3.1 mi, Class: Light, Intensity: IV - V) earthquake occurred 48.3 miles away from Folsom center On 1/16/1994 at 00:42:43, a magnitude 4.2 (4.2 MB, 4.0 LG, Depth: 3.1 mi) earthquake occurred 46.9 miles away from Folsom center On 10/7/1983 at 10:18:46, a magnitude 5.3 (5.1 MB, 5.3 LG, 5.1 ML) earthquake occurred 285.4 miles away from Folsom center On 11/30/2017 at 21:47:31, a magnitude 4.1 (4.1 MW, Depth: 6.1 mi) earthquake occurred 48.4 miles away from Folsom center On 9/25/1998 at 19:52:52, a magnitude 5.2 (4.8 MB, 4.3 MS, 5.2 LG, 4.5 MW, Depth: 3.1 mi) earthquake occurred 287.9 miles away from the city center Magnitude types: regional Lg-wave magnitude (LG), body-wave magnitude (MB), local magnitude (ML), surface-wave magnitude (MS), moment magnitude (MW) Natural disasters: The number of natural disasters in Delaware County (21) is greater than the US average (15).Major Disasters (Presidential) Declared: 15Emergencies Declared: 6Hurricanes: 5, Floods: 4, Winter Storms: 4, Storms: 3, Tropical Storms: 3, Snowstorms: 2, Blizzard: 1, Snowfall: 1, Tropical Depression: 1, Water Shortage: 1, Other: 1 (Note: some incidents may be assigned to more than one category). Hospitals and medical centers in Folsom: RELIANT HOME HEALTH AGENCY, INC (1401 E MACDADE BLVD)
Other hospitals and medical centers near Folsom: CONNER-WILLIAMS NURSING HOME (Nursing Home, about 1 miles away; RIDLEY PARK, PA)
TAYLOR HOSPITAL (Hospital, about 2 miles away; RIDLEY PARK, PA)
TCC AT TAYLOR HOSPITAL (Nursing Home, about 2 miles away; RIDLEY PARK, PA)
TRANSITIONAL CARE UNIT AT TAYLOR HOSP (Nursing Home, about 2 miles away; RIDLEY PARK, PA)
PROSPECT PARK HEALTH AND REHAB (Nursing Home, about 2 miles away; PROSPECT PARK, PA)
PROSPECT PARK NSG HOME (Nursing Home, about 2 miles away; PROSPECT PARK, PA)
ELWYN INC/WOODLYN (Hospital, about 2 miles away; WOODLYN, PA)
Amtrak stations near Folsom: 9 miles: ARDMORE (STATION RD. & LANCASTER AVE.) Services: enclosed waiting area, public restrooms, public payphones, paid short-term parking, call for car rental service, call for taxi service, public transit connection.
9 miles: PHILADELPHIA (30TH & MARKET STS.) Services: ticket office, fully wheelchair accessible, enclosed waiting area, public restrooms, public payphones, snack bar, ATM, paid short-term parking, paid long-term parking, car rental agency, taxi stand, public transit connection.
12 miles: NORTH PHILADELPHIA (PHILADELPHIA, 2900 N. BROAD ST.) Services: ticket office, fully wheelchair accessible, enclosed waiting area, public restrooms, public payphones, paid short-term parking, paid long-term parking, call for taxi service, public transit connection.
Colleges/universities with over 2000 students nearest to Folsom:
Widener University-Main Campus (about 3 miles; Chester, PA ; Full-time enrollment: 4,051)
Neumann University (about 7 miles; Aston, PA ; FT enrollment: 2,622)
Delaware County Community College (about 7 miles; Media, PA ; FT enrollment: 8,419)
University of the Sciences (about 8 miles; Philadelphia, PA ; FT enrollment: 2,464)
University of Pennsylvania (about 9 miles; Philadelphia, PA ; FT enrollment: 25,693)
Saint Joseph's University (about 9 miles; Philadelphia, PA ; FT enrollment: 7,329)
Drexel University (about 9 miles; Philadelphia, PA ; FT enrollment: 22,969)
Public high school in Folsom: RIDLEY HS Students: 2,143, Location: 901 MORTON AVENUE, Grades: 9-12)Public elementary/middle school in Folsom:
See full list of schools located in Folsom Library in Folsom: RIDLEY TOWNSHIP PUBLIC LIBRARY Operating income: $1,166,722; Location: 100 E MACDADE BLVD; 71,220 books ; 4 e-books ; 3,497 audio materials ; 3,128 video materials ; 5 local licensed databases ; 48 state licensed databases ; 32 other licensed databases ; 349 print serial subscriptions )
Birthplace of: Kevin Egee - College basketball player (Pennsylvania Quakers).
Delaware County has a predicted average indoor radon screening level greater than 4 pCi/L (pico curies per liter) - Highest Potential Average household size: This place:
2.6 peoplePennsylvania:
2.5 people
Percentage of family households: This place:
71.8%Whole state:
65.0%
Percentage of households with unmarried partners: This place:
6.3%Whole state:
6.6%
Likely homosexual households (counted as self-reported same-sex unmarried-partner households)
Lesbian couples: 0.4% of all households Gay men: 0.3% of all households
8 people in homes for the mentally retarded in 2000
Banks with branches in Folsom (2011 data):
TD Bank, National Association: Ridley Branch at 131 East Macdade Boulevard, branch established on 2003/07/12. Info updated 2010/10/04: Bank assets: $188,912.6 mil, Deposits: $153,149.8 mil, headquarters in Wilmington, DE, positive income , 1314 total offices , Holding Company: Toronto-Dominion Bank, The
Citizens Bank of Pennsylvania: Folsom Acme Branch at 124 Morton Avenue, branch established on 1999/05/05. Info updated 2010/09/24: Bank assets: $32,316.9 mil, Deposits: $25,297.1 mil, headquarters in Philadelphia, PA, positive income , 396 total offices , Holding Company: Uk Financial Investments Limited
Sovereign Bank, National Association: Folsom Branch at 1917 Mcdade Blvd, branch established on 2002/07/01. Info updated 2012/01/31: Bank assets: $78,146.9 mil, Deposits: $48,042.9 mil, headquarters in Wilmington, DE, positive income , Commercial Lending Specialization, 718 total offices , Holding Company: Banco Santander, S.A.
Bank of America, National Association: Folsom-Pathmark at 420 Mcdade Blvd, branch established on 1999/01/08. Info updated 2009/11/18: Bank assets: $1,451,969.3 mil, Deposits: $1,077,176.8 mil, headquarters in Charlotte, NC, positive income , 5782 total offices , Holding Company: Bank Of America Corporation
Wells Fargo Bank, National Association: Ridley Branch at 220 Macdade Boulevard, branch established on 1960/12/16. Info updated 2011/04/05: Bank assets: $1,161,490.0 mil, Deposits: $905,653.0 mil, headquarters in Sioux Falls, SD, positive income , 6395 total offices , Holding Company: Wells Fargo & Company
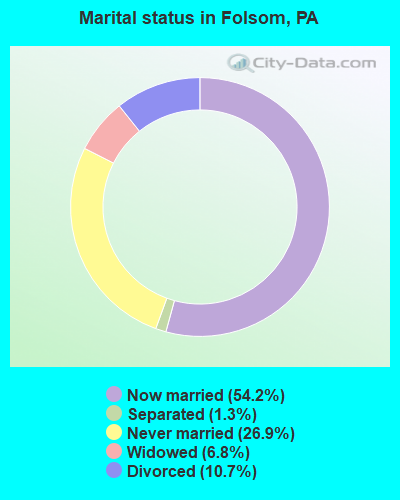
For population 15 years and over in Folsom:
Never married: 26.9%Now married: 54.2%Separated: 1.3%Widowed: 6.8%Divorced: 10.7% For population 25 years and over in Folsom:
High school or higher: 92.0%Bachelor's degree or higher: 30.7%Graduate or professional degree: 7.8%Unemployed: 2.3%Mean travel time to work (commute): 21.1 minutes
Education Gini index (Inequality in education) Here:
11.3Pennsylvania average:
11.4
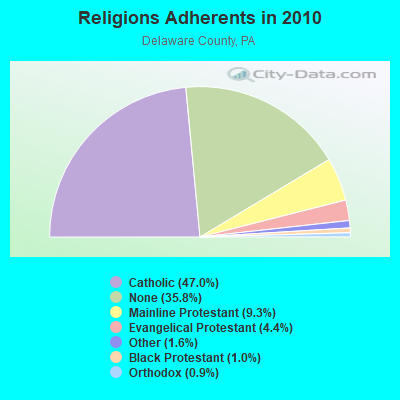
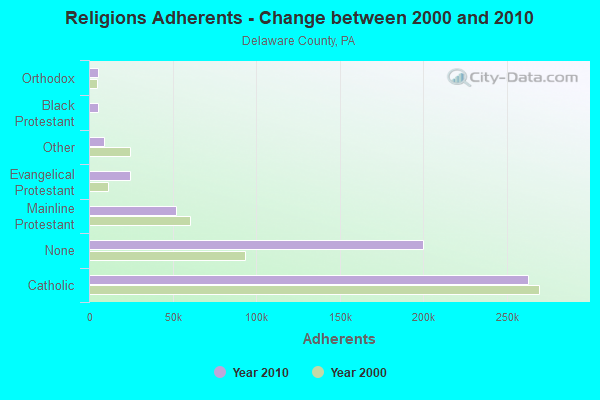
Religion statistics for Folsom, PA (based on Delaware County data)
Religion Adherents Congregations Catholic 262,506 50 Mainline Protestant 52,224 169 Evangelical Protestant 24,456 136 Other 9,009 27 Black Protestant 5,617 39 Orthodox 5,096 8 None 200,071 -
Source: Clifford Grammich, Kirk Hadaway, Richard Houseal, Dale E.Jones, Alexei Krindatch, Richie Stanley and Richard H.Taylor. 2012. 2010 U.S.Religion Census: Religious Congregations & Membership Study. Association of Statisticians of American Religious Bodies. Jones, Dale E., et al. 2002. Congregations and Membership in the United States 2000. Nashville, TN: Glenmary Research Center. Graphs represent county-level data
Food Environment Statistics: Number of grocery stores : 103Delaware County :
1.86 / 10,000 pop.Pennsylvania :
2.04 / 10,000 pop.
Number of supercenters and club stores : 1Here :
0.02 / 10,000 pop.Pennsylvania :
0.09 / 10,000 pop.
Number of convenience stores (no gas) : 83Delaware County :
1.50 / 10,000 pop.Pennsylvania :
0.88 / 10,000 pop.
Number of convenience stores (with gas) : 63Here :
1.14 / 10,000 pop.State :
2.52 / 10,000 pop.
Number of full-service restaurants : 313This county :
5.66 / 10,000 pop.State :
7.12 / 10,000 pop.
Adult diabetes rate : Delaware County :
8.5%Pennsylvania :
9.1%
Adult obesity rate : This county :
25.7%Pennsylvania :
27.2%
Low-income preschool obesity rate : This county :
11.1%Pennsylvania :
11.5%
Health and Nutrition: Healthy diet rate : Here:
50.7%Pennsylvania:
50.2%
Average overall health of teeth and gums : Here:
46.8%Pennsylvania:
47.1%
People feeling badly about themselves : Folsom:
21.8%Pennsylvania:
20.8%
People not drinking alcohol at all : This city:
11.7%Pennsylvania:
10.9%
Average hours sleeping at night : General health condition : Average condition of hearing : This city:
76.7%Pennsylvania:
78.3%
More about Health and Nutrition of Folsom, PA Residents
5.79% of this county's 2021 resident taxpayers lived in other counties in 2020 ($87,801 average adjusted gross income )
Here:
5.79%Pennsylvania average:
5.27%
0.01% of residents moved from foreign countries ($122 average AGI )Delaware County:
0.01%Pennsylvania average:
0.01%
Top counties from which taxpayers relocated into this county between 2020 and 2021:
6.34% of this county's 2020 resident taxpayers moved to other counties in 2021 ($87,816 average adjusted gross income )
Here:
6.34%Pennsylvania average:
5.44%
0.01% of residents moved to foreign countries ($90 average AGI )Delaware County:
0.01%Pennsylvania average:
0.01%
Top counties to which taxpayers relocated from this county between 2020 and 2021:
Businesses in Folsom, PA
Name Count Name Count
Advance Auto Parts 1 MasterBrand Cabinets 1 Applebee's 1 Papa John's Pizza 1 Blockbuster 1 Pathmark 1 Chick-Fil-A 1 Rite Aid 1 Dunkin Donuts 1 Staples 1 GameStop 1 Subway 1 H&R Block 1 T-Mobile 1 Home Depot 1 UPS 2 Lane Furniture 1 Wendy's 1
Strongest AM radio stations in Folsom:
WVCH (740 AM; 50 kW; CHESTER, PA; Owner: WVCH COMMUNICATIONS, INC.)
WPEN (950 AM; 50 kW; PHILADELPHIA, PA; Owner: GREATER PHILADELPHIA RADIO, INC.)
WNWR (1540 AM; 50 kW; PHILADELPHIA, PA)
WZZD (990 AM; 50 kW; PHILADELPHIA, PA; Owner: PENNSYLVANIA MEDIA ASSOCIATES, INC.)
KYW (1060 AM; 50 kW; PHILADELPHIA, PA; Owner: INFINITY BROADCASTING OPERATIONS, INC.)
WPHT (1210 AM; 50 kW; PHILADELPHIA, PA; Owner: INFINITY BROADCASTING OPERATIONS, INC.)
WWJZ (640 AM; 50 kW; MOUNT HOLLY, NJ; Owner: ABC, INC.)
WIP (610 AM; 5 kW; PHILADELPHIA, PA; Owner: INFINITY BROADCASTING CORPORATION OF PHILADELPHIA)
WTMR (800 AM; 5 kW; CAMDEN, NJ; Owner: WTMR LICENSE LIMITED PARTNERSHIP)
WFIL (560 AM; 5 kW; PHILADELPHIA, PA; Owner: PENNSYLVANIA MEDIA ASSOCIATES, INC.)
WDAS (1480 AM; 5 kW; PHILADELPHIA, PA; Owner: AMFM RADIO LICENSES, L.L.C.)
WWDB (860 AM; daytime; 10 kW; PHILADELPHIA, PA)
WPWA (1590 AM; 2 kW; CHESTER, PA; Owner: MOUNT OCEAN MEDIA, L.L.C.)
Strongest FM radio stations in Folsom:
WPLY (100.3 FM; MEDIA, PA; Owner: RADIO ONE LICENSES, LLC)
WSRN-FM (91.5 FM; SWARTHMORE, PA; Owner: SWARTHMORE COLLEGE)
WMGK (102.9 FM; PHILADELPHIA, PA; Owner: GREATER PHILADELPHIA RADIO, INC.)
WMWX (95.7 FM; PHILADELPHIA, PA; Owner: GREATER PHILADELPHIA RADIO, INC.)
WRSD (94.9 FM; FOLSOM, PA; Owner: RIDLEY SCHOOL DISTRICT)
WOGL (98.1 FM; PHILADELPHIA, PA; Owner: INFINITY BROADCASTING OPERATIONS, INC.)
WMMR (93.3 FM; PHILADELPHIA, PA; Owner: GREATER BOSTON RADIO, INC.)
WBEB (101.1 FM; PHILADELPHIA, PA; Owner: WEAZ-FM RADIO, INC.)
WRTI (90.1 FM; PHILADELPHIA, PA; Owner: TEMPLE UNIV. OF THE COMMONWEALTH, ET)
WSNI-FM (104.5 FM; PHILADELPHIA, PA; Owner: AMFM RADIO LICENSES, L.L.C.)
WPHI-FM (103.9 FM; JENKINTOWN, PA; Owner: RADIO ONE LICENSES, LLC)
WHYY-FM (90.9 FM; PHILADELPHIA, PA; Owner: WHYY, INC.)
WXTU (92.5 FM; PHILADELPHIA, PA; Owner: WXTU LICENSE LIMITED PARTNERSHIP)
WXPN (88.5 FM; PHILADELPHIA, PA; Owner: TRUSTEES OF THE UNIVERSITY OF PENNA.)
WPTP (96.5 FM; PHILADELPHIA, PA; Owner: WDAS LICENSE LIMITED PARTNERSHIP)
WDAS-FM (105.3 FM; PHILADELPHIA, PA; Owner: AMFM RADIO LICENSES, L.L.C.)
WUSL (98.9 FM; PHILADELPHIA, PA; Owner: AMFM RADIO LICENSES, L.L.C.)
WYSP (94.1 FM; PHILADELPHIA, PA; Owner: INFINITY BROADCASTING OPERATIONS, INC.)
WIOQ (102.1 FM; PHILADELPHIA, PA; Owner: AMFM RADIO LICENSES, L.L.C.)
WDNR (89.5 FM; CHESTER, PA; Owner: WIDENER COLLEGE)
TV broadcast stations around Folsom:
KYW-TV (Channel 3; PHILADELPHIA, PA; Owner: CBS BROADCASTING INC.)
WWJT-LP (Channel 7; PHILADELPHIA, PA; Owner: PHILADELPHIA TELEVISION NETWORK, INC)
WPHL-TV (Channel 17; PHILADELPHIA, PA; Owner: TRIBUNE TELEVISION COMPANY)
WPVI-TV (Channel 6; PHILADELPHIA, PA; Owner: ABC, INC.)
WPSG (Channel 57; PHILADELPHIA, PA; Owner: VIACOM STATIONS GROUP OF PHILADELPHIA INC.)
WPPX (Channel 61; WILMINGTON, DE; Owner: PAXSON PHILADELPHIA LICENSE, INC.)
WCAU (Channel 10; PHILADELPHIA, PA; Owner: NBC SUBSIDIARY (WCAU-TV), L.P.)
WGTW (Channel 48; BURLINGTON, NJ; Owner: BRUNSON COMMUNICATIONS, INC.)
WYBE (Channel 35; PHILADELPHIA, PA; Owner: INDEPENDENCE PUBLIC MEDIA OF PHILADELPHIA, INC.)
WHYY-TV (Channel 12; WILMINGTON, DE; Owner: WHYY, INC.)
WTXF-TV (Channel 29; PHILADELPHIA, PA; Owner: FOX TV STATIONS OF PHILADELPHIA)
WELL-LP (Channel 8; WILLOW GROVE, ETC., PA; Owner: WORD OF GOD FELLOWSHIP, INC.)
WFPA-CA (Channel 28; PHILADELPHIA, PA; Owner: WXTV LICENSE PARTNERSHIP, G.P.)
WPHA-LP (Channel 63; PHILADELPHIA, PA; Owner: COMMERCIAL BROADCASTING CORP.)
WUVP (Channel 65; VINELAND, NJ; Owner: UNIVISION PHILADELPHIA LLC)
W40AZ (Channel 40; WILMINGTON, DE; Owner: NATIONAL MINORITY T.V., INC.)
W55BT (Channel 55; TALLEYVILLE, DE; Owner: MEDIACASTING LLC)
WMCN-TV (Channel 53; ATLANTIC CITY, NJ; Owner: LENFEST BROADCASTING, LLC)
WTSD-CA (Channel 14; WILMINGTON, DE; Owner: PRIORITY COMMUNICATIONS MINISTRIES, INC.)
WNJS (Channel 23; CAMDEN, NJ; Owner: NEW JERSEY PUBLIC BROADCASTING AUTHORITY)
WPSJ-LP (Channel 8; HAMMONTON, ETC., NJ; Owner: ENGLE BROADCASTING)
W33BT (Channel 33; CAMDEN, NJ; Owner: MEDIACASTING LLC)
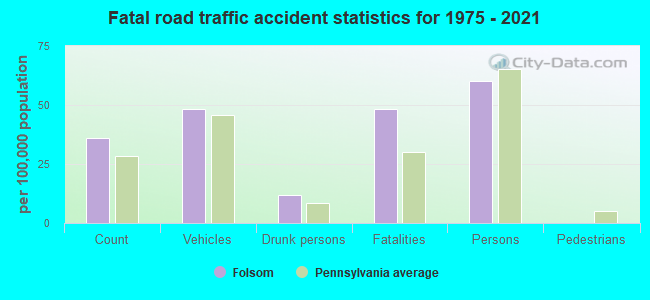
Folsom fatal accident statistics for 1975 - 2021
Folsom fatal accident list:
Dec 24, 2018 01:01 AM, Sr-2006 Macdade Blvd, Lat: 39.886422, Lon: -75.330925, Vehicles: 1, Persons: 2, Fatalities: 2, Drunk persons involved: 1Lat: 39.888139, Lon: -75.328228, Vehicles: 2, Persons: 2, Fatalities: 1Lat: 39.895903, Lon: -75.315242, Vehicles: 1, Persons: 1, Fatalities: 1
National Bridge Inventory (NBI) Statistics 2 Number of bridges7ft / 1.9m Total length $52,000 Total costs18,514 Total average daily traffic978 Total average daily truck traffic23,754 Total future (year 2032) average daily traffic
FCC Registered Antenna Towers: 10 (
See the full list of FCC Registered Antenna Towers in Folsom )
FCC Registered Broadcast Land Mobile Towers: 3
Belmont & Forest Ave (Lat: 39.875944 Lon: -75.341028), Call Sign: KNEA263, Assigned Frequencies: 46.2400 MHz, 46.4200 MHz, Grant Date: 01/03/2003, Expiration Date: 09/16/2012, Cancellation Date: 11/17/2012, Registrant: Federal Licensing Inc, 1588 Fairfield Rd, Gettysburg, PA 17325, Phone: (717) 334-9262, Fax: (717) 334-6440 Mcdade Blvd & Morton Ave (Lat: 39.884000 Lon: -75.333250), Call Sign: KRL236, Assigned Frequencies: 39.4200 MHz, Grant Date: 07/27/2022, Expiration Date: 08/26/2032, Registrant: Metropolitan Communications, 940 Eddystone Ave, Eddystone, PA 19022, Phone: (610) 874-7100, Fax: (610) 874-7511, Email:
310 Macdade Blvd (Lat: 39.888056 Lon: -75.328389), Call Sign: WQJP524, Assigned Frequencies: 469.212 MHz, 469.037 MHz, 469.237 MHz, 469.062 MHz, 469.262 MHz, 469.087 MHz, 469.287 MHz, 469.112 MHz, 469.312 MHz, 469.137 MHz... (+21 more), Grant Date: 11/17/2008, Expiration Date: 11/17/2018, Cancellation Date: 02/16/2019, Certifier: Andrew F Brush, Registrant: Panasonic System Solutions Company, 5201 Tollview Dr, E1-D8, Rolling Meadows, IL 60008-3711, Phone: (847) 637-4738, Fax: (847) 574-7614, Email:
FCC Registered Maritime Coast & Aviation Ground Towers: 1
200 Folsom Ave (Lat: 39.898722 Lon: -75.319083), Type: Tower, Overall height: 21 m, Call Sign: KEB569, Licensee ID: L00025130, Assigned Frequencies: 156.450 MHz, 156.500 MHz, 156.800 MHz, Grant Date: 07/26/1994, Expiration Date: 07/26/1999, Cancellation Date: 05/06/2001, Registrant: John J Celley, 200 Folsom Ave, Folsom, PA 19033 FCC Registered Amateur Radio Licenses: 27 (
See the full list of FCC Registered Amateur Radio Licenses in Folsom )
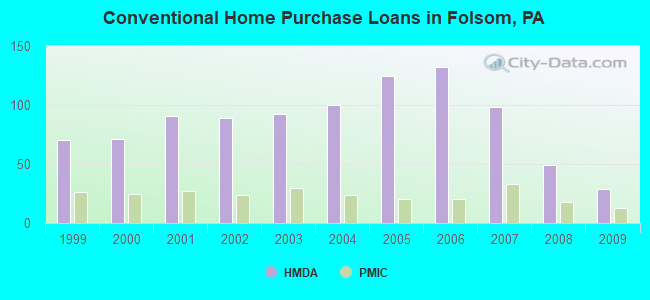
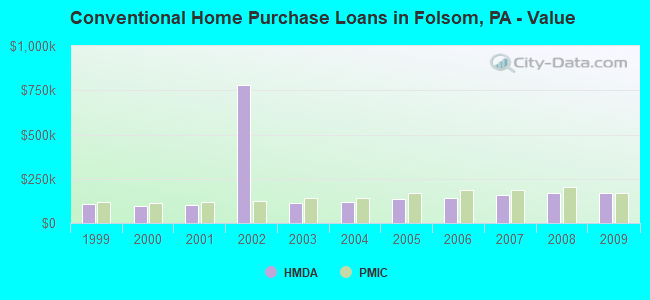
Home Mortgage Disclosure Act Aggregated Statistics For Year 2009(Based on 2 partial tracts) A) FHA, FSA/RHS & VA B) Conventional C) Refinancings D) Home Improvement Loans F) Non-occupant Loans on Number Average Value Number Average Value Number Average Value Number Average Value Number Average Value
LOANS ORIGINATED 49 $190,609 29 $171,019 184 $154,117 19 $65,107 2 $285,295 APPLICATIONS APPROVED, NOT ACCEPTED 0 $0 1 $142,370 16 $166,286 3 $73,133 0 $0 APPLICATIONS DENIED 3 $242,493 2 $146,475 69 $173,035 17 $35,373 2 $92,085 APPLICATIONS WITHDRAWN 3 $176,450 2 $144,180 50 $165,926 3 $52,473 2 $135,260 FILES CLOSED FOR INCOMPLETENESS 0 $0 0 $0 18 $175,059 1 $249,630 1 $180,820
Aggregated Statistics For Year 2008(Based on 2 partial tracts) A) FHA, FSA/RHS & VA B) Conventional C) Refinancings D) Home Improvement Loans E) Loans on Dwellings For 5+ Families F) Non-occupant Loans on G) Loans On Manufactured Number Average Value Number Average Value Number Average Value Number Average Value Number Average Value Number Average Value Number Average Value
LOANS ORIGINATED 24 $205,495 49 $170,202 118 $147,613 32 $54,316 1 $587,650 5 $148,758 0 $0 APPLICATIONS APPROVED, NOT ACCEPTED 0 $0 4 $159,752 26 $126,614 9 $37,978 0 $0 3 $149,257 1 $66,480 APPLICATIONS DENIED 1 $279,550 3 $97,260 74 $181,032 29 $44,187 1 $3,465,640 3 $92,673 1 $127,430 APPLICATIONS WITHDRAWN 1 $159,720 5 $202,654 29 $170,670 5 $64,710 0 $0 2 $228,985 0 $0 FILES CLOSED FOR INCOMPLETENESS 0 $0 2 $206,055 6 $184,783 2 $153,315 0 $0 0 $0 0 $0
Aggregated Statistics For Year 2007(Based on 2 partial tracts) A) FHA, FSA/RHS & VA B) Conventional C) Refinancings D) Home Improvement Loans F) Non-occupant Loans on G) Loans On Manufactured Number Average Value Number Average Value Number Average Value Number Average Value Number Average Value Number Average Value
LOANS ORIGINATED 11 $190,468 98 $158,988 161 $135,556 54 $39,118 12 $138,836 1 $45,200 APPLICATIONS APPROVED, NOT ACCEPTED 2 $158,965 8 $144,374 31 $130,148 8 $43,316 1 $36,690 0 $0 APPLICATIONS DENIED 3 $215,473 9 $158,017 77 $151,177 40 $43,202 5 $118,308 0 $0 APPLICATIONS WITHDRAWN 2 $133,730 6 $207,472 35 $145,867 3 $101,207 1 $184,280 0 $0 FILES CLOSED FOR INCOMPLETENESS 0 $0 4 $147,668 15 $177,291 0 $0 2 $128,920 0 $0
Aggregated Statistics For Year 2006(Based on 2 partial tracts) A) FHA, FSA/RHS & VA B) Conventional C) Refinancings D) Home Improvement Loans F) Non-occupant Loans on G) Loans On Manufactured Number Average Value Number Average Value Number Average Value Number Average Value Number Average Value Number Average Value
LOANS ORIGINATED 10 $197,693 132 $142,008 190 $123,684 55 $54,173 11 $141,140 0 $0 APPLICATIONS APPROVED, NOT ACCEPTED 0 $0 11 $129,170 35 $122,345 7 $45,699 1 $67,220 0 $0 APPLICATIONS DENIED 1 $150,820 21 $114,996 95 $157,119 32 $57,316 5 $95,984 1 $15,070 APPLICATIONS WITHDRAWN 0 $0 8 $187,911 67 $150,037 4 $86,678 2 $105,100 0 $0 FILES CLOSED FOR INCOMPLETENESS 0 $0 1 $216,680 19 $147,023 2 $84,005 1 $126,570 0 $0
Aggregated Statistics For Year 2005(Based on 2 partial tracts) A) FHA, FSA/RHS & VA B) Conventional C) Refinancings D) Home Improvement Loans E) Loans on Dwellings For 5+ Families F) Non-occupant Loans on G) Loans On Manufactured Number Average Value Number Average Value Number Average Value Number Average Value Number Average Value Number Average Value Number Average Value
LOANS ORIGINATED 6 $156,878 125 $137,550 222 $123,741 62 $47,846 2 $1,399,815 15 $98,762 1 $118,280 APPLICATIONS APPROVED, NOT ACCEPTED 1 $228,260 8 $161,016 39 $104,263 11 $59,072 0 $0 2 $114,325 0 $0 APPLICATIONS DENIED 0 $0 16 $119,362 108 $128,613 36 $41,828 0 $0 8 $80,671 1 $17,700 APPLICATIONS WITHDRAWN 1 $174,040 14 $128,696 77 $146,553 11 $141,710 0 $0 3 $156,457 0 $0 FILES CLOSED FOR INCOMPLETENESS 0 $0 4 $124,348 26 $147,969 2 $35,575 0 $0 2 $97,940 0 $0
Aggregated Statistics For Year 2004(Based on 2 partial tracts) A) FHA, FSA/RHS & VA B) Conventional C) Refinancings D) Home Improvement Loans F) Non-occupant Loans on G) Loans On Manufactured Number Average Value Number Average Value Number Average Value Number Average Value Number Average Value Number Average Value
LOANS ORIGINATED 8 $175,321 100 $119,984 242 $115,256 56 $49,034 14 $103,863 1 $100,960 APPLICATIONS APPROVED, NOT ACCEPTED 0 $0 10 $128,856 58 $110,409 7 $48,403 5 $112,086 0 $0 APPLICATIONS DENIED 2 $134,860 9 $119,452 101 $124,957 36 $39,819 4 $85,622 2 $88,525 APPLICATIONS WITHDRAWN 1 $91,160 12 $146,823 66 $188,131 6 $52,692 2 $104,850 1 $105,480 FILES CLOSED FOR INCOMPLETENESS 0 $0 3 $154,503 53 $146,580 1 $50,750 0 $0 0 $0
Aggregated Statistics For Year 2003(Based on 2 partial tracts) A) FHA, FSA/RHS & VA B) Conventional C) Refinancings D) Home Improvement Loans E) Loans on Dwellings For 5+ Families F) Non-occupant Loans on Number Average Value Number Average Value Number Average Value Number Average Value Number Average Value Number Average Value
LOANS ORIGINATED 15 $130,160 92 $112,698 466 $104,430 42 $45,588 1 $534,910 14 $88,218 APPLICATIONS APPROVED, NOT ACCEPTED 1 $114,150 11 $109,447 68 $92,458 16 $39,315 0 $0 3 $74,443 APPLICATIONS DENIED 0 $0 11 $141,370 119 $101,106 26 $28,379 0 $0 2 $93,420 APPLICATIONS WITHDRAWN 1 $94,930 8 $106,948 64 $101,589 4 $50,488 0 $0 2 $78,355 FILES CLOSED FOR INCOMPLETENESS 2 $120,070 6 $109,777 22 $107,895 4 $87,290 0 $0 2 $77,600
Aggregated Statistics For Year 2002(Based on 2 partial tracts) A) FHA, FSA/RHS & VA B) Conventional C) Refinancings D) Home Improvement Loans F) Non-occupant Loans on Number Average Value Number Average Value Number Average Value Number Average Value Number Average Value
LOANS ORIGINATED 26 $114,723 89 $777,206 224 $116,369 36 $28,666 10 $92,744 APPLICATIONS APPROVED, NOT ACCEPTED 2 $94,605 6 $167,843 45 $92,207 11 $40,318 3 $123,270 APPLICATIONS DENIED 1 $125,820 4 $90,680 97 $91,477 28 $28,014 4 $86,858 APPLICATIONS WITHDRAWN 1 $70,150 8 $91,454 49 $110,104 3 $40,020 1 $148,380 FILES CLOSED FOR INCOMPLETENESS 2 $103,215 3 $146,817 18 $103,223 1 $42,460 1 $154,580
Aggregated Statistics For Year 2001(Based on 2 partial tracts) A) FHA, FSA/RHS & VA B) Conventional C) Refinancings D) Home Improvement Loans E) Loans on Dwellings For 5+ Families F) Non-occupant Loans on Number Average Value Number Average Value Number Average Value Number Average Value Number Average Value Number Average Value
LOANS ORIGINATED 40 $114,244 91 $101,637 176 $90,670 49 $26,938 1 $1,280,780 7 $81,586 APPLICATIONS APPROVED, NOT ACCEPTED 1 $74,980 6 $86,647 32 $67,148 8 $29,042 0 $0 2 $16,200 APPLICATIONS DENIED 0 $0 4 $131,610 62 $81,537 18 $27,934 0 $0 2 $100,030 APPLICATIONS WITHDRAWN 1 $115,270 3 $128,877 40 $95,007 4 $40,905 0 $0 3 $60,527 FILES CLOSED FOR INCOMPLETENESS 0 $0 1 $60,270 8 $93,000 0 $0 0 $0 0 $0
Aggregated Statistics For Year 2000(Based on 2 partial tracts) A) FHA, FSA/RHS & VA B) Conventional C) Refinancings D) Home Improvement Loans F) Non-occupant Loans on Number Average Value Number Average Value Number Average Value Number Average Value Number Average Value
LOANS ORIGINATED 33 $104,253 71 $96,293 46 $67,058 43 $24,187 7 $70,433 APPLICATIONS APPROVED, NOT ACCEPTED 1 $140,130 7 $105,904 8 $71,170 6 $23,065 0 $0 APPLICATIONS DENIED 2 $134,480 5 $79,818 39 $64,648 13 $21,614 3 $67,337 APPLICATIONS WITHDRAWN 2 $91,915 6 $92,230 22 $93,058 5 $30,194 0 $0 FILES CLOSED FOR INCOMPLETENESS 1 $64,040 2 $63,395 8 $89,980 1 $13,190 1 $39,180
Aggregated Statistics For Year 1999(Based on 2 partial tracts) A) FHA, FSA/RHS & VA B) Conventional C) Refinancings D) Home Improvement Loans F) Non-occupant Loans on Number Average Value Number Average Value Number Average Value Number Average Value Number Average Value
LOANS ORIGINATED 23 $113,681 70 $104,915 115 $71,652 46 $21,207 5 $67,788 APPLICATIONS APPROVED, NOT ACCEPTED 1 $69,430 4 $92,940 30 $63,579 8 $18,641 2 $28,290 APPLICATIONS DENIED 0 $0 5 $103,182 47 $72,469 22 $25,160 3 $48,140 APPLICATIONS WITHDRAWN 1 $63,520 5 $65,470 41 $70,161 10 $39,515 1 $86,420 FILES CLOSED FOR INCOMPLETENESS 0 $0 0 $0 6 $94,083 1 $63,420 0 $0
Detailed HMDA statistics for the following Tracts:
4040.02
, 4041.01
Private Mortgage Insurance Companies Aggregated Statistics For Year 2009(Based on 2 partial tracts) A) Conventional B) Refinancings Number Average Value Number Average Value
LOANS ORIGINATED 13 $170,353 4 $184,645 APPLICATIONS APPROVED, NOT ACCEPTED 3 $165,127 2 $161,815 APPLICATIONS DENIED 2 $194,705 0 $0 APPLICATIONS WITHDRAWN 0 $0 0 $0 FILES CLOSED FOR INCOMPLETENESS 0 $0 1 $235,060
Aggregated Statistics For Year 2008(Based on 2 partial tracts) A) Conventional B) Refinancings C) Non-occupant Loans on Number Average Value Number Average Value Number Average Value
LOANS ORIGINATED 18 $200,997 10 $207,583 1 $135,610 APPLICATIONS APPROVED, NOT ACCEPTED 4 $214,828 2 $205,935 1 $196,640 APPLICATIONS DENIED 2 $177,145 1 $155,950 1 $159,720 APPLICATIONS WITHDRAWN 0 $0 1 $203,420 0 $0 FILES CLOSED FOR INCOMPLETENESS 0 $0 1 $223,010 0 $0
Aggregated Statistics For Year 2007(Based on 2 partial tracts) A) Conventional B) Refinancings C) Non-occupant Loans on Number Average Value Number Average Value Number Average Value
LOANS ORIGINATED 33 $188,246 14 $222,759 4 $163,110 APPLICATIONS APPROVED, NOT ACCEPTED 5 $174,020 3 $221,873 0 $0 APPLICATIONS DENIED 0 $0 0 $0 0 $0 APPLICATIONS WITHDRAWN 2 $174,625 2 $168,010 0 $0 FILES CLOSED FOR INCOMPLETENESS 0 $0 0 $0 0 $0
Aggregated Statistics For Year 2006(Based on 2 partial tracts) A) Conventional B) Refinancings C) Non-occupant Loans on Number Average Value Number Average Value Number Average Value
LOANS ORIGINATED 20 $184,390 7 $192,014 2 $162,685 APPLICATIONS APPROVED, NOT ACCEPTED 3 $163,753 1 $225,380 2 $125,820 APPLICATIONS DENIED 0 $0 0 $0 0 $0 APPLICATIONS WITHDRAWN 2 $114,560 0 $0 0 $0 FILES CLOSED FOR INCOMPLETENESS 0 $0 0 $0 0 $0
Aggregated Statistics For Year 2005(Based on 2 partial tracts) A) Conventional B) Refinancings C) Non-occupant Loans on Number Average Value Number Average Value Number Average Value
LOANS ORIGINATED 20 $171,616 11 $174,158 1 $42,940 APPLICATIONS APPROVED, NOT ACCEPTED 6 $132,458 3 $164,870 1 $98,700 APPLICATIONS DENIED 0 $0 0 $0 0 $0 APPLICATIONS WITHDRAWN 0 $0 0 $0 0 $0 FILES CLOSED FOR INCOMPLETENESS 0 $0 1 $105,480 0 $0
Aggregated Statistics For Year 2004(Based on 2 partial tracts) A) Conventional B) Refinancings C) Non-occupant Loans on Number Average Value Number Average Value Number Average Value
LOANS ORIGINATED 24 $140,932 13 $145,331 2 $73,455 APPLICATIONS APPROVED, NOT ACCEPTED 4 $142,985 6 $132,183 0 $0 APPLICATIONS DENIED 0 $0 1 $134,860 0 $0 APPLICATIONS WITHDRAWN 2 $166,045 0 $0 0 $0 FILES CLOSED FOR INCOMPLETENESS 0 $0 0 $0 0 $0
Aggregated Statistics For Year 2003(Based on 2 partial tracts) A) Conventional B) Refinancings C) Non-occupant Loans on Number Average Value Number Average Value Number Average Value
LOANS ORIGINATED 30 $139,469 43 $127,222 3 $120,727 APPLICATIONS APPROVED, NOT ACCEPTED 5 $138,026 9 $133,508 1 $51,980 APPLICATIONS DENIED 1 $79,110 0 $0 0 $0 APPLICATIONS WITHDRAWN 2 $141,985 2 $131,995 0 $0 FILES CLOSED FOR INCOMPLETENESS 0 $0 0 $0 0 $0
Aggregated Statistics For Year 2002(Based on 2 partial tracts) A) Conventional B) Refinancings C) Non-occupant Loans on Number Average Value Number Average Value Number Average Value
LOANS ORIGINATED 24 $123,294 26 $118,508 2 $61,780 APPLICATIONS APPROVED, NOT ACCEPTED 1 $157,610 6 $131,860 0 $0 APPLICATIONS DENIED 0 $0 0 $0 0 $0 APPLICATIONS WITHDRAWN 0 $0 0 $0 0 $0 FILES CLOSED FOR INCOMPLETENESS 0 $0 0 $0 0 $0
Aggregated Statistics For Year 2001(Based on 2 partial tracts) A) Conventional B) Refinancings Number Average Value Number Average Value
LOANS ORIGINATED 27 $119,976 16 $129,066 APPLICATIONS APPROVED, NOT ACCEPTED 4 $121,230 4 $103,842 APPLICATIONS DENIED 0 $0 0 $0 APPLICATIONS WITHDRAWN 0 $0 0 $0 FILES CLOSED FOR INCOMPLETENESS 0 $0 0 $0
Aggregated Statistics For Year 2000(Based on 2 partial tracts) A) Conventional B) Refinancings C) Non-occupant Loans on Number Average Value Number Average Value Number Average Value
LOANS ORIGINATED 25 $114,947 4 $100,930 2 $85,135 APPLICATIONS APPROVED, NOT ACCEPTED 2 $119,335 2 $98,590 0 $0 APPLICATIONS DENIED 0 $0 0 $0 0 $0 APPLICATIONS WITHDRAWN 0 $0 0 $0 0 $0 FILES CLOSED FOR INCOMPLETENESS 0 $0 0 $0 0 $0
Aggregated Statistics For Year 1999(Based on 2 partial tracts) A) Conventional B) Refinancings Number Average Value Number Average Value
LOANS ORIGINATED 26 $116,276 6 $115,270 APPLICATIONS APPROVED, NOT ACCEPTED 2 $153,150 1 $131,430 APPLICATIONS DENIED 0 $0 0 $0 APPLICATIONS WITHDRAWN 0 $0 0 $0 FILES CLOSED FOR INCOMPLETENESS 0 $0 0 $0
Detailed PMIC statistics for the following Tracts:
4040.02
, 4041.01
Most common first names in Folsom, PA among deceased individuals Name Count Lived (average)
John 130 73.5 years Mary 98 79.1 years Joseph 88 74.4 years William 86 73.2 years James 60 72.8 years George 59 73.2 years Margaret 54 75.2 years Charles 49 71.8 years Thomas 48 70.4 years Anna 47 80.4 years
Most common last names in Folsom, PA among deceased individuals Last name Count Lived (average)
Smith 29 75.3 years Anderson 12 78.3 years Thompson 12 77.2 years Brown 11 76.1 years Johnson 10 76.4 years Miller 9 74.0 years Mclaughlin 8 77.9 years Jones 8 80.6 years Roberts 8 74.4 years Carroll 7 81.0 years
Folsom compared to Pennsylvania state average:
Unemployed percentage significantly below state average. Black race population percentage below state average. Hispanic race population percentage below state average. Renting percentage below state average. Length of stay since moving in above state average.
#67 on the list of "Top 101 cities with the largest percentage of elementary and middle school students in private schools (1,000+ students)"
#74 on the list of "Top 101 cities with the most residents born in Argentina (population 500+)"
#82 on the list of "Top 101 cities with the most people taking a bus, a trolley bus, a streetcar, or a trolley car to work (population 5,000+)"
#16 (19033) on the list of "Top 101 zip codes with the largest percentage of Irish first ancestries (pop 5,000+)"
#14 on the list of "Top 101 counties with the lowest ground withdrawal of fresh water for public supply (pop. 50,000+)"
#16 on the list of "Top 101 counties with the largest increase in the number of infant deaths per 1000 residents 2000-2006 to 2007-2013 (pop. 50,000+)"
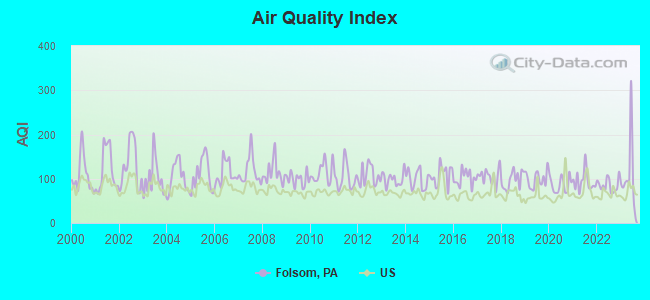
#20 on the list of "Top 101 counties with the highest Particulate Matter (PM2.5 ) Annual air pollution readings in 2012 (µg/m3 )"
#40 on the list of "Top 101 counties with the most Mainline Protestant congregations"
#46 on the list of "Top 101 counties with the highest number of infant deaths per 1000 residents 2007-2013 (pop. 50,000+)"
Top Patent Applicants
Sue Uner (3)
Sharon Marie Hatala (1)
James E. Baumgardner (1)
Anthony Mathew Montalbano (1)
Kevin M. Blattner (1)
Total of 7 patent applications in 2008-2024.


 Recent articles from our blog. Our writers, many of them Ph.D. graduates or candidates, create easy-to-read articles on a wide variety of topics.

 , pop. 78,620).
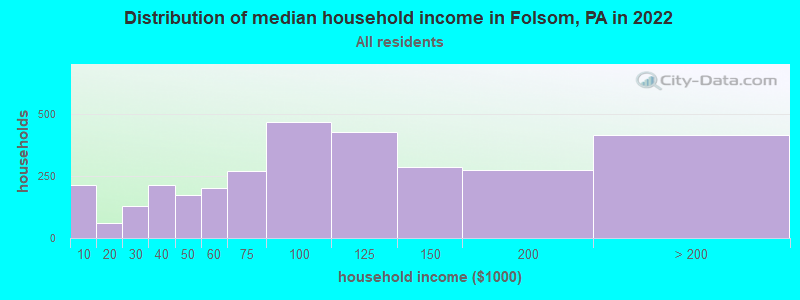


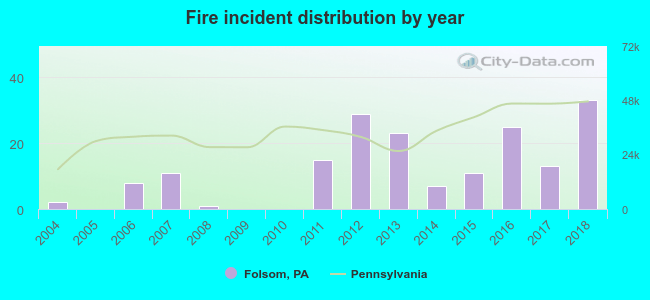 Based on the data from the years 2004 - 2018 the average number of fire incidents per year is 12. The highest number of reported fires - 33 took place in 2018, and the least - 0 in 2005. The data has an increasing trend.
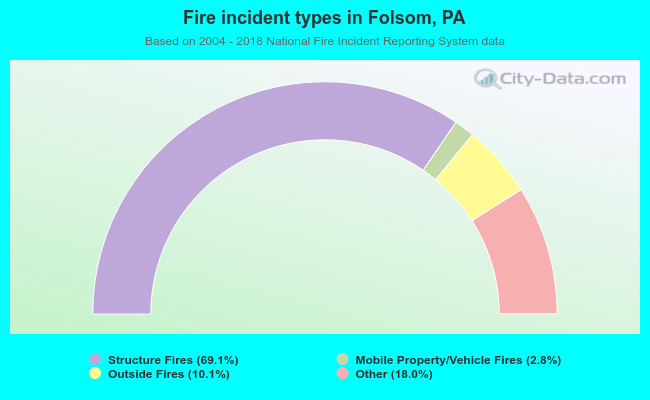 When looking into fire subcategories, the most incidents belonged to: Structure Fires (69.1%), and Other (18.0%).