Chickasaw, Alabama Submit your own pictures of this city and show them to the world
OSM Map
General Map
Google Map
MSN Map
OSM Map
General Map
Google Map
MSN Map
OSM Map
General Map
Google Map
MSN Map
OSM Map
General Map
Google Map
MSN Map
Please wait while loading the map...
Population in 2022: 6,310 (99% urban, 1% rural). Population change since 2000: -0.8%Males: 3,126 Females: 3,184
March 2022 cost of living index in Chickasaw: 82.6 (low, U.S. average is 100) Percentage of residents living in poverty in 2022: 31.5%for White Non-Hispanic residents , 38.7% for Black residents , 43.9% for Hispanic or Latino residents , 28.1% for American Indian residents , 20.8% for other race residents , 31.5% for two or more races residents )Business Search - 14 Million verified businesses
Data:
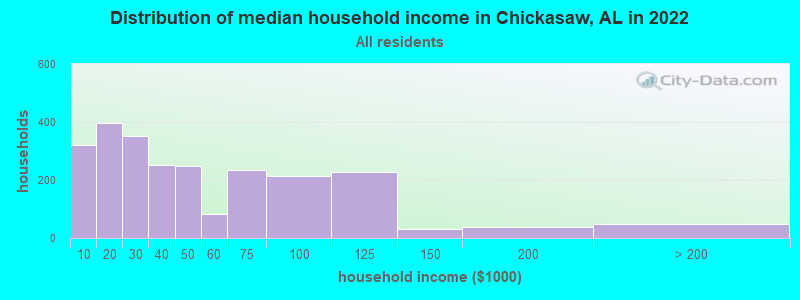
Median household income ($)
Median household income (% change since 2000)
Household income diversity
Ratio of average income to average house value (%)
Ratio of average income to average rent
Median household income ($) - White
Median household income ($) - Black or African American
Median household income ($) - Asian
Median household income ($) - Hispanic or Latino
Median household income ($) - American Indian and Alaska Native
Median household income ($) - Multirace
Median household income ($) - Other Race
Median household income for houses/condos with a mortgage ($)
Median household income for apartments without a mortgage ($)
Races - White alone (%)
Races - White alone (% change since 2000)
Races - Black alone (%)
Races - Black alone (% change since 2000)
Races - American Indian alone (%)
Races - American Indian alone (% change since 2000)
Races - Asian alone (%)
Races - Asian alone (% change since 2000)
Races - Hispanic (%)
Races - Hispanic (% change since 2000)
Races - Native Hawaiian and Other Pacific Islander alone (%)
Races - Native Hawaiian and Other Pacific Islander alone (% change since 2000)
Races - Two or more races (%)
Races - Two or more races (% change since 2000)
Races - Other race alone (%)
Races - Other race alone (% change since 2000)
Racial diversity
Unemployment (%)
Unemployment (% change since 2000)
Unemployment (%) - White
Unemployment (%) - Black or African American
Unemployment (%) - Asian
Unemployment (%) - Hispanic or Latino
Unemployment (%) - American Indian and Alaska Native
Unemployment (%) - Multirace
Unemployment (%) - Other Race
Population density (people per square mile)
Population - Males (%)
Population - Females (%)
Population - Males (%) - White
Population - Males (%) - Black or African American
Population - Males (%) - Asian
Population - Males (%) - Hispanic or Latino
Population - Males (%) - American Indian and Alaska Native
Population - Males (%) - Multirace
Population - Males (%) - Other Race
Population - Females (%) - White
Population - Females (%) - Black or African American
Population - Females (%) - Asian
Population - Females (%) - Hispanic or Latino
Population - Females (%) - American Indian and Alaska Native
Population - Females (%) - Multirace
Population - Females (%) - Other Race
Coronavirus confirmed cases (Jun 04, 2024)
Deaths caused by coronavirus (Jun 04, 2024)
Coronavirus confirmed cases (per 100k population) (Jun 04, 2024)
Deaths caused by coronavirus (per 100k population) (Jun 04, 2024)
Daily increase in number of cases (Jun 04, 2024)
Weekly increase in number of cases (Jun 04, 2024)
Cases doubled (in days) (Jun 04, 2024)
Hospitalized patients (Apr 18, 2022)
Negative test results (Apr 18, 2022)
Total test results (Apr 18, 2022)
COVID Vaccine doses distributed (per 100k population) (Sep 19, 2023)
COVID Vaccine doses administered (per 100k population) (Sep 19, 2023)
COVID Vaccine doses distributed (Sep 19, 2023)
COVID Vaccine doses administered (Sep 19, 2023)
Likely homosexual households (%)
Likely homosexual households (% change since 2000)
Likely homosexual households - Lesbian couples (%)
Likely homosexual households - Lesbian couples (% change since 2000)
Likely homosexual households - Gay men (%)
Likely homosexual households - Gay men (% change since 2000)
Cost of living index
Median gross rent ($)
Median contract rent ($)
Median monthly housing costs ($)
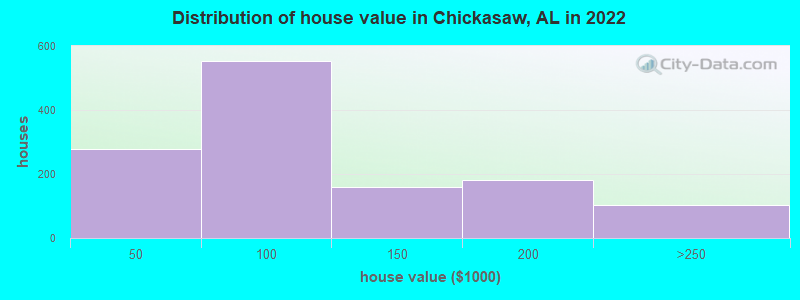
Median house or condo value ($)
Median house or condo value ($ change since 2000)
Mean house or condo value by units in structure - 1, detached ($)
Mean house or condo value by units in structure - 1, attached ($)
Mean house or condo value by units in structure - 2 ($)
Mean house or condo value by units in structure by units in structure - 3 or 4 ($)
Mean house or condo value by units in structure - 5 or more ($)
Mean house or condo value by units in structure - Boat, RV, van, etc. ($)
Mean house or condo value by units in structure - Mobile home ($)
Median house or condo value ($) - White
Median house or condo value ($) - Black or African American
Median house or condo value ($) - Asian
Median house or condo value ($) - Hispanic or Latino
Median house or condo value ($) - American Indian and Alaska Native
Median house or condo value ($) - Multirace
Median house or condo value ($) - Other Race
Median resident age
Resident age diversity
Median resident age - Males
Median resident age - Females
Median resident age - White
Median resident age - Black or African American
Median resident age - Asian
Median resident age - Hispanic or Latino
Median resident age - American Indian and Alaska Native
Median resident age - Multirace
Median resident age - Other Race
Median resident age - Males - White
Median resident age - Males - Black or African American
Median resident age - Males - Asian
Median resident age - Males - Hispanic or Latino
Median resident age - Males - American Indian and Alaska Native
Median resident age - Males - Multirace
Median resident age - Males - Other Race
Median resident age - Females - White
Median resident age - Females - Black or African American
Median resident age - Females - Asian
Median resident age - Females - Hispanic or Latino
Median resident age - Females - American Indian and Alaska Native
Median resident age - Females - Multirace
Median resident age - Females - Other Race
Commute - mean travel time to work (minutes)
Travel time to work - Less than 5 minutes (%)
Travel time to work - Less than 5 minutes (% change since 2000)
Travel time to work - 5 to 9 minutes (%)
Travel time to work - 5 to 9 minutes (% change since 2000)
Travel time to work - 10 to 19 minutes (%)
Travel time to work - 10 to 19 minutes (% change since 2000)
Travel time to work - 20 to 29 minutes (%)
Travel time to work - 20 to 29 minutes (% change since 2000)
Travel time to work - 30 to 39 minutes (%)
Travel time to work - 30 to 39 minutes (% change since 2000)
Travel time to work - 40 to 59 minutes (%)
Travel time to work - 40 to 59 minutes (% change since 2000)
Travel time to work - 60 to 89 minutes (%)
Travel time to work - 60 to 89 minutes (% change since 2000)
Travel time to work - 90 or more minutes (%)
Travel time to work - 90 or more minutes (% change since 2000)
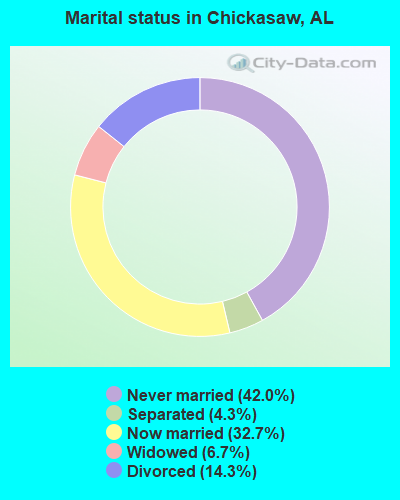
Marital status - Never married (%)
Marital status - Now married (%)
Marital status - Separated (%)
Marital status - Widowed (%)
Marital status - Divorced (%)
Median family income ($)
Median family income (% change since 2000)
Median non-family income ($)
Median non-family income (% change since 2000)
Median per capita income ($)
Median per capita income (% change since 2000)
Median family income ($) - White
Median family income ($) - Black or African American
Median family income ($) - Asian
Median family income ($) - Hispanic or Latino
Median family income ($) - American Indian and Alaska Native
Median family income ($) - Multirace
Median family income ($) - Other Race
Median year house/condo built
Median year apartment built
Year house built - Built 2005 or later (%)
Year house built - Built 2000 to 2004 (%)
Year house built - Built 1990 to 1999 (%)
Year house built - Built 1980 to 1989 (%)
Year house built - Built 1970 to 1979 (%)
Year house built - Built 1960 to 1969 (%)
Year house built - Built 1950 to 1959 (%)
Year house built - Built 1940 to 1949 (%)
Year house built - Built 1939 or earlier (%)
Average household size
Household density (households per square mile)
Average household size - White
Average household size - Black or African American
Average household size - Asian
Average household size - Hispanic or Latino
Average household size - American Indian and Alaska Native
Average household size - Multirace
Average household size - Other Race
Occupied housing units (%)
Vacant housing units (%)
Owner occupied housing units (%)
Renter occupied housing units (%)
Vacancy status - For rent (%)
Vacancy status - For sale only (%)
Vacancy status - Rented or sold, not occupied (%)
Vacancy status - For seasonal, recreational, or occasional use (%)
Vacancy status - For migrant workers (%)
Vacancy status - Other vacant (%)
Residents with income below the poverty level (%)
Residents with income below 50% of the poverty level (%)
Children below poverty level (%)
Poor families by family type - Married-couple family (%)
Poor families by family type - Male, no wife present (%)
Poor families by family type - Female, no husband present (%)
Poverty status for native-born residents (%)
Poverty status for foreign-born residents (%)
Poverty among high school graduates not in families (%)
Poverty among people who did not graduate high school not in families (%)
Residents with income below the poverty level (%) - White
Residents with income below the poverty level (%) - Black or African American
Residents with income below the poverty level (%) - Asian
Residents with income below the poverty level (%) - Hispanic or Latino
Residents with income below the poverty level (%) - American Indian and Alaska Native
Residents with income below the poverty level (%) - Multirace
Residents with income below the poverty level (%) - Other Race
Air pollution - Air Quality Index (AQI)
Air pollution - CO
Air pollution - NO2
Air pollution - SO2
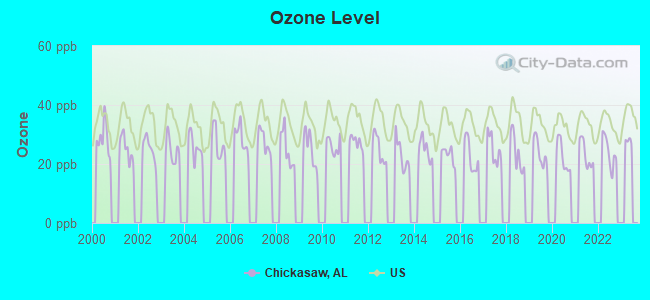
Air pollution - Ozone
Air pollution - PM10
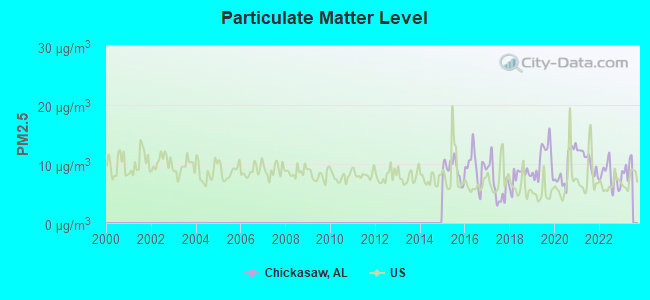
Air pollution - PM25
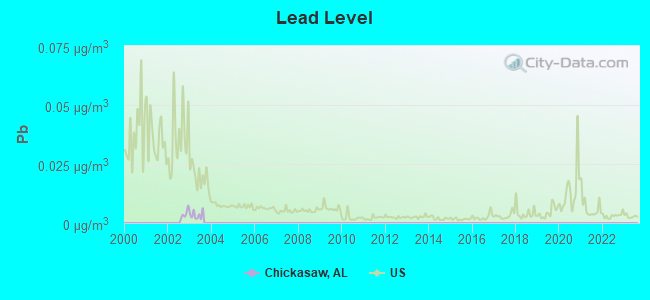
Air pollution - Pb
Crime - Murders per 100,000 population
Crime - Rapes per 100,000 population
Crime - Robberies per 100,000 population
Crime - Assaults per 100,000 population
Crime - Burglaries per 100,000 population
Crime - Thefts per 100,000 population
Crime - Auto thefts per 100,000 population
Crime - Arson per 100,000 population
Crime - City-data.com crime index
Crime - Violent crime index
Crime - Property crime index
Crime - Murders per 100,000 population (5 year average)
Crime - Rapes per 100,000 population (5 year average)
Crime - Robberies per 100,000 population (5 year average)
Crime - Assaults per 100,000 population (5 year average)
Crime - Burglaries per 100,000 population (5 year average)
Crime - Thefts per 100,000 population (5 year average)
Crime - Auto thefts per 100,000 population (5 year average)
Crime - Arson per 100,000 population (5 year average)
Crime - City-data.com crime index (5 year average)
Crime - Violent crime index (5 year average)
Crime - Property crime index (5 year average)
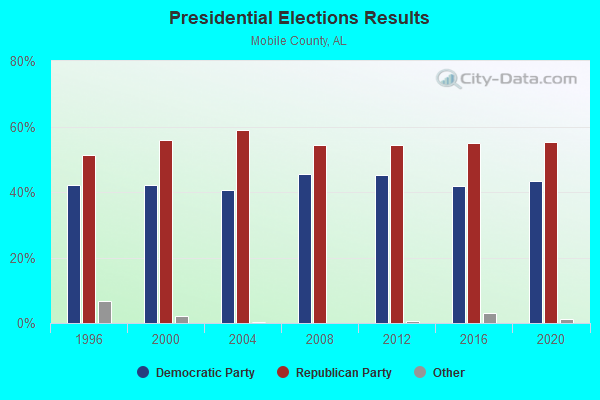
1996 Presidential Elections Results (%) - Democratic Party (Clinton)
1996 Presidential Elections Results (%) - Republican Party (Dole)
1996 Presidential Elections Results (%) - Other
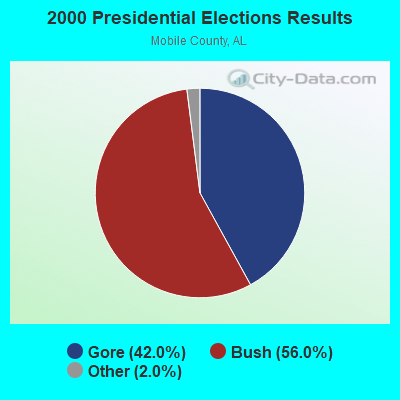
2000 Presidential Elections Results (%) - Democratic Party (Gore)
2000 Presidential Elections Results (%) - Republican Party (Bush)
2000 Presidential Elections Results (%) - Other
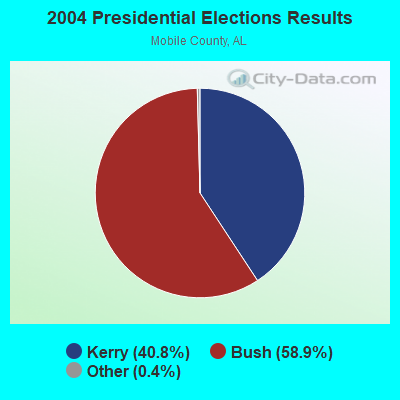
2004 Presidential Elections Results (%) - Democratic Party (Kerry)
2004 Presidential Elections Results (%) - Republican Party (Bush)
2004 Presidential Elections Results (%) - Other
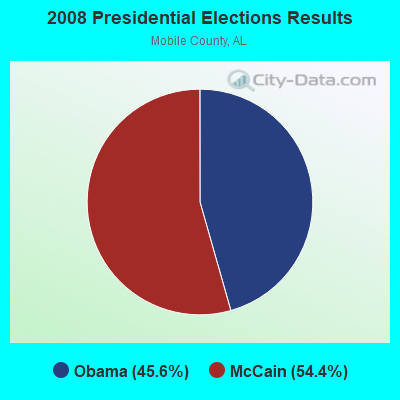
2008 Presidential Elections Results (%) - Democratic Party (Obama)
2008 Presidential Elections Results (%) - Republican Party (McCain)
2008 Presidential Elections Results (%) - Other
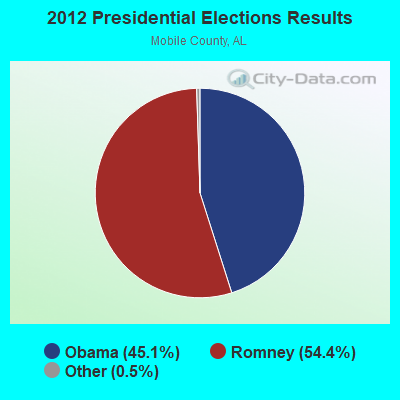
2012 Presidential Elections Results (%) - Democratic Party (Obama)
2012 Presidential Elections Results (%) - Republican Party (Romney)
2012 Presidential Elections Results (%) - Other
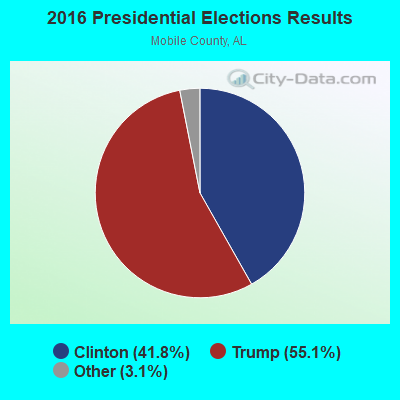
2016 Presidential Elections Results (%) - Democratic Party (Clinton)
2016 Presidential Elections Results (%) - Republican Party (Trump)
2016 Presidential Elections Results (%) - Other
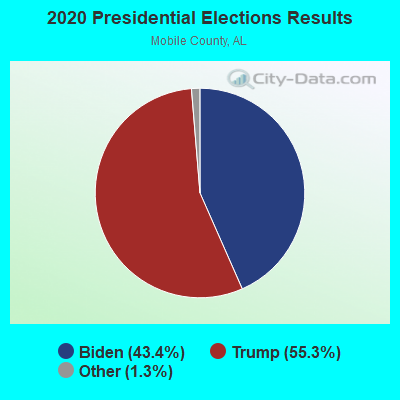
2020 Presidential Elections Results (%) - Democratic Party (Biden)
2020 Presidential Elections Results (%) - Republican Party (Trump)
2020 Presidential Elections Results (%) - Other
Ancestries Reported - Arab (%)
Ancestries Reported - Czech (%)
Ancestries Reported - Danish (%)
Ancestries Reported - Dutch (%)
Ancestries Reported - English (%)
Ancestries Reported - French (%)
Ancestries Reported - French Canadian (%)
Ancestries Reported - German (%)
Ancestries Reported - Greek (%)
Ancestries Reported - Hungarian (%)
Ancestries Reported - Irish (%)
Ancestries Reported - Italian (%)
Ancestries Reported - Lithuanian (%)
Ancestries Reported - Norwegian (%)
Ancestries Reported - Polish (%)
Ancestries Reported - Portuguese (%)
Ancestries Reported - Russian (%)
Ancestries Reported - Scotch-Irish (%)
Ancestries Reported - Scottish (%)
Ancestries Reported - Slovak (%)
Ancestries Reported - Subsaharan African (%)
Ancestries Reported - Swedish (%)
Ancestries Reported - Swiss (%)
Ancestries Reported - Ukrainian (%)
Ancestries Reported - United States (%)
Ancestries Reported - Welsh (%)
Ancestries Reported - West Indian (%)
Ancestries Reported - Other (%)
Educational Attainment - No schooling completed (%)
Educational Attainment - Less than high school (%)
Educational Attainment - High school or equivalent (%)
Educational Attainment - Less than 1 year of college (%)
Educational Attainment - 1 or more years of college (%)
Educational Attainment - Associate degree (%)
Educational Attainment - Bachelor's degree (%)
Educational Attainment - Master's degree (%)
Educational Attainment - Professional school degree (%)
Educational Attainment - Doctorate degree (%)
School Enrollment - Nursery, preschool (%)
School Enrollment - Kindergarten (%)
School Enrollment - Grade 1 to 4 (%)
School Enrollment - Grade 5 to 8 (%)
School Enrollment - Grade 9 to 12 (%)
School Enrollment - College undergrad (%)
School Enrollment - Graduate or professional (%)
School Enrollment - Not enrolled in school (%)
School enrollment - Public schools (%)
School enrollment - Private schools (%)
School enrollment - Not enrolled (%)
Median number of rooms in houses and condos
Median number of rooms in apartments
Housing units lacking complete plumbing facilities (%)
Housing units lacking complete kitchen facilities (%)
Density of houses
Urban houses (%)
Rural houses (%)
Households with people 60 years and over (%)
Households with people 65 years and over (%)
Households with people 75 years and over (%)
Households with one or more nonrelatives (%)
Households with no nonrelatives (%)
Population in households (%)
Family households (%)
Nonfamily households (%)
Population in families (%)
Family households with own children (%)
Median number of bedrooms in owner occupied houses
Mean number of bedrooms in owner occupied houses
Median number of bedrooms in renter occupied houses
Mean number of bedrooms in renter occupied houses
Median number of vehichles in owner occupied houses
Mean number of vehichles in owner occupied houses
Median number of vehichles in renter occupied houses
Mean number of vehichles in renter occupied houses
Mortgage status - with mortgage (%)
Mortgage status - with second mortgage (%)
Mortgage status - with home equity loan (%)
Mortgage status - with both second mortgage and home equity loan (%)
Mortgage status - without a mortgage (%)
Average family size
Average family size - White
Average family size - Black or African American
Average family size - Asian
Average family size - Hispanic or Latino
Average family size - American Indian and Alaska Native
Average family size - Multirace
Average family size - Other Race
Geographical mobility - Same house 1 year ago (%)
Geographical mobility - Moved within same county (%)
Geographical mobility - Moved from different county within same state (%)
Geographical mobility - Moved from different state (%)
Geographical mobility - Moved from abroad (%)
Place of birth - Born in state of residence (%)
Place of birth - Born in other state (%)
Place of birth - Native, outside of US (%)
Place of birth - Foreign born (%)
Housing units in structures - 1, detached (%)
Housing units in structures - 1, attached (%)
Housing units in structures - 2 (%)
Housing units in structures - 3 or 4 (%)
Housing units in structures - 5 to 9 (%)
Housing units in structures - 10 to 19 (%)
Housing units in structures - 20 to 49 (%)
Housing units in structures - 50 or more (%)
Housing units in structures - Mobile home (%)
Housing units in structures - Boat, RV, van, etc. (%)
House/condo owner moved in on average (years ago)
Renter moved in on average (years ago)
Year householder moved into unit - Moved in 1999 to March 2000 (%)
Year householder moved into unit - Moved in 1995 to 1998 (%)
Year householder moved into unit - Moved in 1990 to 1994 (%)
Year householder moved into unit - Moved in 1980 to 1989 (%)
Year householder moved into unit - Moved in 1970 to 1979 (%)
Year householder moved into unit - Moved in 1969 or earlier (%)
Means of transportation to work - Drove car alone (%)
Means of transportation to work - Carpooled (%)
Means of transportation to work - Public transportation (%)
Means of transportation to work - Bus or trolley bus (%)
Means of transportation to work - Streetcar or trolley car (%)
Means of transportation to work - Subway or elevated (%)
Means of transportation to work - Railroad (%)
Means of transportation to work - Ferryboat (%)
Means of transportation to work - Taxicab (%)
Means of transportation to work - Motorcycle (%)
Means of transportation to work - Bicycle (%)
Means of transportation to work - Walked (%)
Means of transportation to work - Other means (%)
Working at home (%)
Industry diversity
Most Common Industries - Agriculture, forestry, fishing and hunting, and mining (%)
Most Common Industries - Agriculture, forestry, fishing and hunting (%)
Most Common Industries - Mining, quarrying, and oil and gas extraction (%)
Most Common Industries - Construction (%)
Most Common Industries - Manufacturing (%)
Most Common Industries - Wholesale trade (%)
Most Common Industries - Retail trade (%)
Most Common Industries - Transportation and warehousing, and utilities (%)
Most Common Industries - Transportation and warehousing (%)
Most Common Industries - Utilities (%)
Most Common Industries - Information (%)
Most Common Industries - Finance and insurance, and real estate and rental and leasing (%)
Most Common Industries - Finance and insurance (%)
Most Common Industries - Real estate and rental and leasing (%)
Most Common Industries - Professional, scientific, and management, and administrative and waste management services (%)
Most Common Industries - Professional, scientific, and technical services (%)
Most Common Industries - Management of companies and enterprises (%)
Most Common Industries - Administrative and support and waste management services (%)
Most Common Industries - Educational services, and health care and social assistance (%)
Most Common Industries - Educational services (%)
Most Common Industries - Health care and social assistance (%)
Most Common Industries - Arts, entertainment, and recreation, and accommodation and food services (%)
Most Common Industries - Arts, entertainment, and recreation (%)
Most Common Industries - Accommodation and food services (%)
Most Common Industries - Other services, except public administration (%)
Most Common Industries - Public administration (%)
Occupation diversity
Most Common Occupations - Management, business, science, and arts occupations (%)
Most Common Occupations - Management, business, and financial occupations (%)
Most Common Occupations - Management occupations (%)
Most Common Occupations - Business and financial operations occupations (%)
Most Common Occupations - Computer, engineering, and science occupations (%)
Most Common Occupations - Computer and mathematical occupations (%)
Most Common Occupations - Architecture and engineering occupations (%)
Most Common Occupations - Life, physical, and social science occupations (%)
Most Common Occupations - Education, legal, community service, arts, and media occupations (%)
Most Common Occupations - Community and social service occupations (%)
Most Common Occupations - Legal occupations (%)
Most Common Occupations - Education, training, and library occupations (%)
Most Common Occupations - Arts, design, entertainment, sports, and media occupations (%)
Most Common Occupations - Healthcare practitioners and technical occupations (%)
Most Common Occupations - Health diagnosing and treating practitioners and other technical occupations (%)
Most Common Occupations - Health technologists and technicians (%)
Most Common Occupations - Service occupations (%)
Most Common Occupations - Healthcare support occupations (%)
Most Common Occupations - Protective service occupations (%)
Most Common Occupations - Fire fighting and prevention, and other protective service workers including supervisors (%)
Most Common Occupations - Law enforcement workers including supervisors (%)
Most Common Occupations - Food preparation and serving related occupations (%)
Most Common Occupations - Building and grounds cleaning and maintenance occupations (%)
Most Common Occupations - Personal care and service occupations (%)
Most Common Occupations - Sales and office occupations (%)
Most Common Occupations - Sales and related occupations (%)
Most Common Occupations - Office and administrative support occupations (%)
Most Common Occupations - Natural resources, construction, and maintenance occupations (%)
Most Common Occupations - Farming, fishing, and forestry occupations (%)
Most Common Occupations - Construction and extraction occupations (%)
Most Common Occupations - Installation, maintenance, and repair occupations (%)
Most Common Occupations - Production, transportation, and material moving occupations (%)
Most Common Occupations - Production occupations (%)
Most Common Occupations - Transportation occupations (%)
Most Common Occupations - Material moving occupations (%)
People in Group quarters - Institutionalized population (%)
People in Group quarters - Correctional institutions (%)
People in Group quarters - Federal prisons and detention centers (%)
People in Group quarters - Halfway houses (%)
People in Group quarters - Local jails and other confinement facilities (including police lockups) (%)
People in Group quarters - Military disciplinary barracks (%)
People in Group quarters - State prisons (%)
People in Group quarters - Other types of correctional institutions (%)
People in Group quarters - Nursing homes (%)
People in Group quarters - Hospitals/wards, hospices, and schools for the handicapped (%)
People in Group quarters - Hospitals/wards and hospices for chronically ill (%)
People in Group quarters - Hospices or homes for chronically ill (%)
People in Group quarters - Military hospitals or wards for chronically ill (%)
People in Group quarters - Other hospitals or wards for chronically ill (%)
People in Group quarters - Hospitals or wards for drug/alcohol abuse (%)
People in Group quarters - Mental (Psychiatric) hospitals or wards (%)
People in Group quarters - Schools, hospitals, or wards for the mentally retarded (%)
People in Group quarters - Schools, hospitals, or wards for the physically handicapped (%)
People in Group quarters - Institutions for the deaf (%)
People in Group quarters - Institutions for the blind (%)
People in Group quarters - Orthopedic wards and institutions for the physically handicapped (%)
People in Group quarters - Wards in general hospitals for patients who have no usual home elsewhere (%)
People in Group quarters - Wards in military hospitals for patients who have no usual home elsewhere (%)
People in Group quarters - Juvenile institutions (%)
People in Group quarters - Long-term care (%)
People in Group quarters - Homes for abused, dependent, and neglected children (%)
People in Group quarters - Residential treatment centers for emotionally disturbed children (%)
People in Group quarters - Training schools for juvenile delinquents (%)
People in Group quarters - Short-term care, detention or diagnostic centers for delinquent children (%)
People in Group quarters - Type of juvenile institution unknown (%)
People in Group quarters - Noninstitutionalized population (%)
People in Group quarters - College dormitories (includes college quarters off campus) (%)
People in Group quarters - Military quarters (%)
People in Group quarters - On base (%)
People in Group quarters - Barracks, unaccompanied personnel housing (UPH), (Enlisted/Officer), ;and similar group living quarters for military personnel (%)
People in Group quarters - Transient quarters for temporary residents (%)
People in Group quarters - Military ships (%)
People in Group quarters - Group homes (%)
People in Group quarters - Homes or halfway houses for drug/alcohol abuse (%)
People in Group quarters - Homes for the mentally ill (%)
People in Group quarters - Homes for the mentally retarded (%)
People in Group quarters - Homes for the physically handicapped (%)
People in Group quarters - Other group homes (%)
People in Group quarters - Religious group quarters (%)
People in Group quarters - Dormitories (%)
People in Group quarters - Agriculture workers' dormitories on farms (%)
People in Group quarters - Job Corps and vocational training facilities (%)
People in Group quarters - Other workers' dormitories (%)
People in Group quarters - Crews of maritime vessels (%)
People in Group quarters - Other nonhousehold living situations (%)
People in Group quarters - Other noninstitutional group quarters (%)
Residents speaking English at home (%)
Residents speaking English at home - Born in the United States (%)
Residents speaking English at home - Native, born elsewhere (%)
Residents speaking English at home - Foreign born (%)
Residents speaking Spanish at home (%)
Residents speaking Spanish at home - Born in the United States (%)
Residents speaking Spanish at home - Native, born elsewhere (%)
Residents speaking Spanish at home - Foreign born (%)
Residents speaking other language at home (%)
Residents speaking other language at home - Born in the United States (%)
Residents speaking other language at home - Native, born elsewhere (%)
Residents speaking other language at home - Foreign born (%)
Class of Workers - Employee of private company (%)
Class of Workers - Self-employed in own incorporated business (%)
Class of Workers - Private not-for-profit wage and salary workers (%)
Class of Workers - Local government workers (%)
Class of Workers - State government workers (%)
Class of Workers - Federal government workers (%)
Class of Workers - Self-employed workers in own not incorporated business and Unpaid family workers (%)
House heating fuel used in houses and condos - Utility gas (%)
House heating fuel used in houses and condos - Bottled, tank, or LP gas (%)
House heating fuel used in houses and condos - Electricity (%)
House heating fuel used in houses and condos - Fuel oil, kerosene, etc. (%)
House heating fuel used in houses and condos - Coal or coke (%)
House heating fuel used in houses and condos - Wood (%)
House heating fuel used in houses and condos - Solar energy (%)
House heating fuel used in houses and condos - Other fuel (%)
House heating fuel used in houses and condos - No fuel used (%)
House heating fuel used in apartments - Utility gas (%)
House heating fuel used in apartments - Bottled, tank, or LP gas (%)
House heating fuel used in apartments - Electricity (%)
House heating fuel used in apartments - Fuel oil, kerosene, etc. (%)
House heating fuel used in apartments - Coal or coke (%)
House heating fuel used in apartments - Wood (%)
House heating fuel used in apartments - Solar energy (%)
House heating fuel used in apartments - Other fuel (%)
House heating fuel used in apartments - No fuel used (%)
Armed forces status - In Armed Forces (%)
Armed forces status - Civilian (%)
Armed forces status - Civilian - Veteran (%)
Armed forces status - Civilian - Nonveteran (%)
Fatal accidents locations in years 2005-2021
Fatal accidents locations in 2005
Fatal accidents locations in 2006
Fatal accidents locations in 2007
Fatal accidents locations in 2008
Fatal accidents locations in 2009
Fatal accidents locations in 2010
Fatal accidents locations in 2011
Fatal accidents locations in 2012
Fatal accidents locations in 2013
Fatal accidents locations in 2014
Fatal accidents locations in 2015
Fatal accidents locations in 2016
Fatal accidents locations in 2017
Fatal accidents locations in 2018
Fatal accidents locations in 2019
Fatal accidents locations in 2020
Fatal accidents locations in 2021
Alcohol use - People drinking some alcohol every month (%)
Alcohol use - People not drinking at all (%)
Alcohol use - Average days/month drinking alcohol
Alcohol use - Average drinks/week
Alcohol use - Average days/year people drink much
Audiometry - Average condition of hearing (%)
Audiometry - People that can hear a whisper from across a quiet room (%)
Audiometry - People that can hear normal voice from across a quiet room (%)
Audiometry - Ears ringing, roaring, buzzing (%)
Audiometry - Had a job exposure to loud noise (%)
Audiometry - Had off-work exposure to loud noise (%)
Blood Pressure & Cholesterol - Has high blood pressure (%)
Blood Pressure & Cholesterol - Checking blood pressure at home (%)
Blood Pressure & Cholesterol - Frequently checking blood cholesterol (%)
Blood Pressure & Cholesterol - Has high cholesterol level (%)
Consumer Behavior - Money monthly spent on food at supermarket/grocery store
Consumer Behavior - Money monthly spent on food at other stores
Consumer Behavior - Money monthly spent on eating out
Consumer Behavior - Money monthly spent on carryout/delivered foods
Consumer Behavior - Income spent on food at supermarket/grocery store (%)
Consumer Behavior - Income spent on food at other stores (%)
Consumer Behavior - Income spent on eating out (%)
Consumer Behavior - Income spent on carryout/delivered foods (%)
Current Health Status - General health condition (%)
Current Health Status - Blood donors (%)
Current Health Status - Has blood ever tested for HIV virus (%)
Current Health Status - Left-handed people (%)
Dermatology - People using sunscreen (%)
Diabetes - Diabetics (%)
Diabetes - Had a blood test for high blood sugar (%)
Diabetes - People taking insulin (%)
Diet Behavior & Nutrition - Diet health (%)
Diet Behavior & Nutrition - Milk product consumption (# of products/month)
Diet Behavior & Nutrition - Meals not home prepared (#/week)
Diet Behavior & Nutrition - Meals from fast food or pizza place (#/week)
Diet Behavior & Nutrition - Ready-to-eat foods (#/month)
Diet Behavior & Nutrition - Frozen meals/pizza (#/month)
Drug Use - People that ever used marijuana or hashish (%)
Drug Use - Ever used hard drugs (%)
Drug Use - Ever used any form of cocaine (%)
Drug Use - Ever used heroin (%)
Drug Use - Ever used methamphetamine (%)
Health Insurance - People covered by health insurance (%)
Kidney Conditions-Urology - Avg. # of times urinating at night
Medical Conditions - People with asthma (%)
Medical Conditions - People with anemia (%)
Medical Conditions - People with psoriasis (%)
Medical Conditions - People with overweight (%)
Medical Conditions - Elderly people having difficulties in thinking or remembering (%)
Medical Conditions - People who ever received blood transfusion (%)
Medical Conditions - People having trouble seeing even with glass/contacts (%)
Medical Conditions - People with arthritis (%)
Medical Conditions - People with gout (%)
Medical Conditions - People with congestive heart failure (%)
Medical Conditions - People with coronary heart disease (%)
Medical Conditions - People with angina pectoris (%)
Medical Conditions - People who ever had heart attack (%)
Medical Conditions - People who ever had stroke (%)
Medical Conditions - People with emphysema (%)
Medical Conditions - People with thyroid problem (%)
Medical Conditions - People with chronic bronchitis (%)
Medical Conditions - People with any liver condition (%)
Medical Conditions - People who ever had cancer or malignancy (%)
Mental Health - People who have little interest in doing things (%)
Mental Health - People feeling down, depressed, or hopeless (%)
Mental Health - People who have trouble sleeping or sleeping too much (%)
Mental Health - People feeling tired or having little energy (%)
Mental Health - People with poor appetite or overeating (%)
Mental Health - People feeling bad about themself (%)
Mental Health - People who have trouble concentrating on things (%)
Mental Health - People moving or speaking slowly or too fast (%)
Mental Health - People having thoughts they would be better off dead (%)
Oral Health - Average years since last visit a dentist
Oral Health - People embarrassed because of mouth (%)
Oral Health - People with gum disease (%)
Oral Health - General health of teeth and gums (%)
Oral Health - Average days a week using dental floss/device
Oral Health - Average days a week using mouthwash for dental problem
Oral Health - Average number of teeth
Pesticide Use - Households using pesticides to control insects (%)
Pesticide Use - Households using pesticides to kill weeds (%)
Physical Activity - People doing vigorous-intensity work activities (%)
Physical Activity - People doing moderate-intensity work activities (%)
Physical Activity - People walking or bicycling (%)
Physical Activity - People doing vigorous-intensity recreational activities (%)
Physical Activity - People doing moderate-intensity recreational activities (%)
Physical Activity - Average hours a day doing sedentary activities
Physical Activity - Average hours a day watching TV or videos
Physical Activity - Average hours a day using computer
Physical Functioning - People having limitations keeping them from working (%)
Physical Functioning - People limited in amount of work they can do (%)
Physical Functioning - People that need special equipment to walk (%)
Physical Functioning - People experiencing confusion/memory problems (%)
Physical Functioning - People requiring special healthcare equipment (%)
Prescription Medications - Average number of prescription medicines taking
Preventive Aspirin Use - Adults 40+ taking low-dose aspirin (%)
Reproductive Health - Vaginal deliveries (%)
Reproductive Health - Cesarean deliveries (%)
Reproductive Health - Deliveries resulted in a live birth (%)
Reproductive Health - Pregnancies resulted in a delivery (%)
Reproductive Health - Women breastfeeding newborns (%)
Reproductive Health - Women that had a hysterectomy (%)
Reproductive Health - Women that had both ovaries removed (%)
Reproductive Health - Women that have ever taken birth control pills (%)
Reproductive Health - Women taking birth control pills (%)
Reproductive Health - Women that have ever used Depo-Provera or injectables (%)
Reproductive Health - Women that have ever used female hormones (%)
Sexual Behavior - People 18+ that ever had sex (vaginal, anal, or oral) (%)
Sexual Behavior - Males 18+ that ever had vaginal sex with a woman (%)
Sexual Behavior - Males 18+ that ever performed oral sex on a woman (%)
Sexual Behavior - Males 18+ that ever had anal sex with a woman (%)
Sexual Behavior - Males 18+ that ever had any sex with a man (%)
Sexual Behavior - Females 18+ that ever had vaginal sex with a man (%)
Sexual Behavior - Females 18+ that ever performed oral sex on a man (%)
Sexual Behavior - Females 18+ that ever had anal sex with a man (%)
Sexual Behavior - Females 18+ that ever had any kind of sex with a woman (%)
Sexual Behavior - Average age people first had sex
Sexual Behavior - Average number of female sex partners in lifetime (males 18+)
Sexual Behavior - Average number of female vaginal sex partners in lifetime (males 18+)
Sexual Behavior - Average age people first performed oral sex on a woman (18+)
Sexual Behavior - Average number of woman performed oral sex on in lifetime (18+)
Sexual Behavior - Average number of male sex partners in lifetime (males 18+)
Sexual Behavior - Average number of male anal sex partners in lifetime (males 18+)
Sexual Behavior - Average age people first performed oral sex on a man (18+)
Sexual Behavior - Average number of male oral sex partners in lifetime (18+)
Sexual Behavior - People using protection when performing oral sex (%)
Sexual Behavior - Average number of times people have vaginal or anal sex a year
Sexual Behavior - People having sex without condom (%)
Sexual Behavior - Average number of male sex partners in lifetime (females 18+)
Sexual Behavior - Average number of male vaginal sex partners in lifetime (females 18+)
Sexual Behavior - Average number of female sex partners in lifetime (females 18+)
Sexual Behavior - Circumcised males 18+ (%)
Sleep Disorders - Average hours sleeping at night
Sleep Disorders - People that has trouble sleeping (%)
Smoking-Cigarette Use - People smoking cigarettes (%)
Taste & Smell - People 40+ having problems with smell (%)
Taste & Smell - People 40+ having problems with taste (%)
Taste & Smell - People 40+ that ever had wisdom teeth removed (%)
Taste & Smell - People 40+ that ever had tonsils teeth removed (%)
Taste & Smell - People 40+ that ever had a loss of consciousness because of a head injury (%)
Taste & Smell - People 40+ that ever had a broken nose or other serious injury to face or skull (%)
Taste & Smell - People 40+ that ever had two or more sinus infections (%)
Weight - Average height (inches)
Weight - Average weight (pounds)
Weight - Average BMI
Weight - People that are obese (%)
Weight - People that ever were obese (%)
Weight - People trying to lose weight (%)
3,088 48.6% Black alone 2,751 43.3% White alone 240 3.8% Two or more races 154 2.4% Hispanic 78 1.2% Asian alone 30 0.5% Other race alone 17 0.3% American Indian alone
Officers per 1,000 residents here:
3.56Alabama average:
2.40
Latest news from Chickasaw, AL collected exclusively by city-data.com from local newspapers, TV, and radio stations
Ancestries: American (8.6%), English (5.5%), German (3.0%), French (1.4%), Irish (1.4%), Scotch-Irish (1.4%).
Current Local Time:
Land area: 4.43 square miles.
Population density: 1,424 people per square mile (low).
169 residents are foreign born (1.2% Asia , 1.1% Latin America ).
This city:
2.7%Alabama:
3.5%
Median real estate property taxes paid for housing units with mortgages in 2022: $364 (0.3%)Median real estate property taxes paid for housing units with no mortgage in 2022: $334 (0.4%)
Nearest city with pop. 50,000+: Mobile, AL
Nearest city with pop. 200,000+: New Orleans, LA
Nearest city with pop. 1,000,000+: Houston, TX
Nearest cities:
Latitude: 30.76 N, Longitude: 88.08 W
Area code commonly used in this area: 251
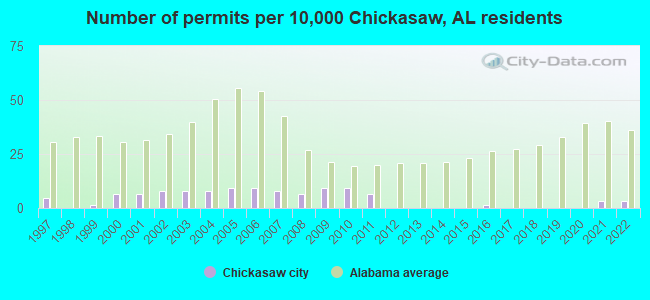
Single-family new house construction building permits:
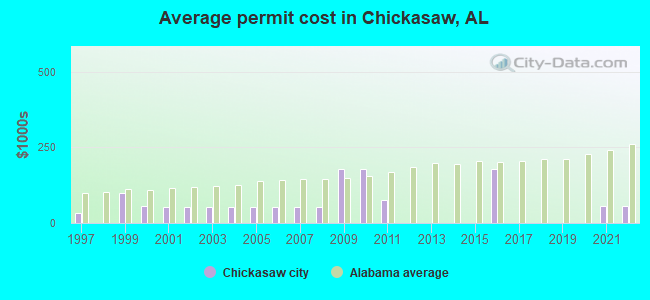
2022: 2 buildings , average cost: $55,0002021: 2 buildings , average cost: $55,0002016: 1 building , cost: $180,0002011: 4 buildings , average cost: $76,5002010: 6 buildings , average cost: $180,1002009: 6 buildings , average cost: $180,1002008: 4 buildings , average cost: $54,3002007: 5 buildings , average cost: $54,3002006: 6 buildings , average cost: $54,3002005: 6 buildings , average cost: $54,3002004: 5 buildings , average cost: $54,3002003: 5 buildings , average cost: $54,3002002: 5 buildings , average cost: $54,3002001: 4 buildings , average cost: $54,3002000: 4 buildings , average cost: $55,6001999: 1 building , cost: $98,0001997: 3 buildings , average cost: $31,700Unemployment in December 2023:
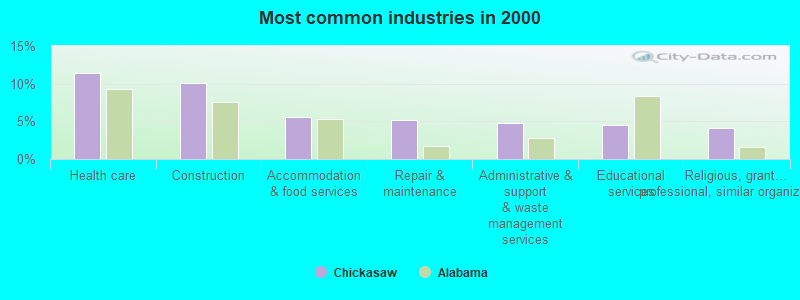
Most common industries in Chickasaw, AL (%)
Both Males Females
Health care (11.4%)
Construction (10.1%)
Accommodation & food services (5.6%)
Repair & maintenance (5.2%)
Administrative & support & waste management services (4.8%)
Educational services (4.5%)
Religious, grantmaking, civic, professional, similar organizations (4.1%)
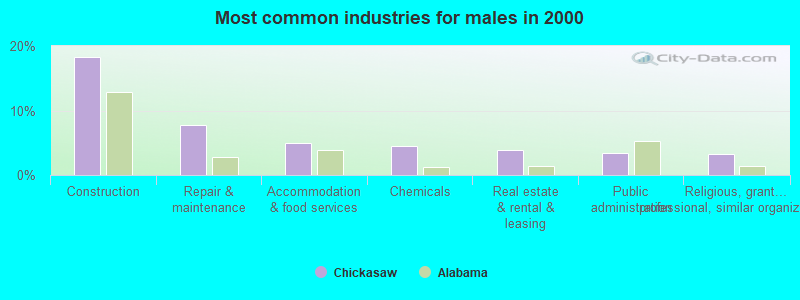
Construction (18.3%)
Repair & maintenance (7.8%)
Accommodation & food services (4.9%)
Chemicals (4.5%)
Real estate & rental & leasing (3.9%)
Public administration (3.4%)
Religious, grantmaking, civic, professional, similar organizations (3.3%)
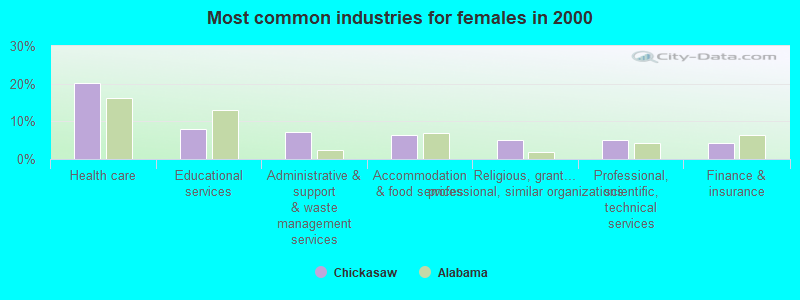
Health care (20.3%)
Educational services (7.8%)
Administrative & support & waste management services (7.1%)
Accommodation & food services (6.3%)
Religious, grantmaking, civic, professional, similar organizations (5.0%)
Professional, scientific, technical services (5.0%)
Finance & insurance (4.3%)
Most common occupations in Chickasaw, AL (%)
Both Males Females
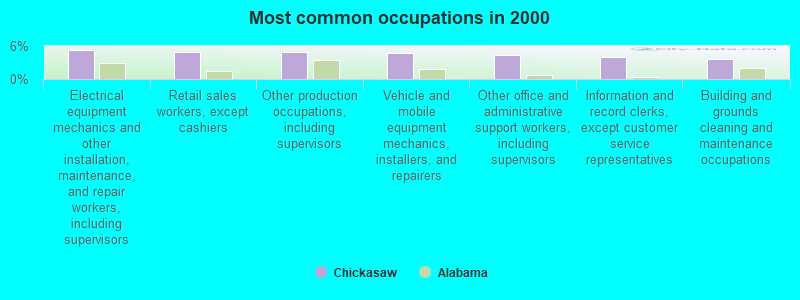
Electrical equipment mechanics and other installation, maintenance, and repair workers, including supervisors (5.2%)
Retail sales workers, except cashiers (4.9%)
Other production occupations, including supervisors (4.9%)
Vehicle and mobile equipment mechanics, installers, and repairers (4.7%)
Other office and administrative support workers, including supervisors (4.4%)
Information and record clerks, except customer service representatives (4.1%)
Building and grounds cleaning and maintenance occupations (3.6%)
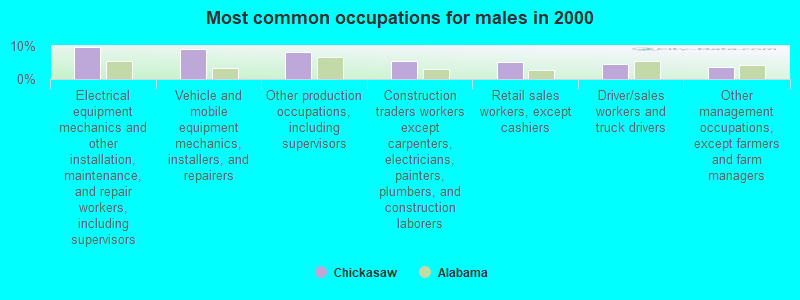
Electrical equipment mechanics and other installation, maintenance, and repair workers, including supervisors (9.6%)
Vehicle and mobile equipment mechanics, installers, and repairers (9.0%)
Other production occupations, including supervisors (8.1%)
Construction traders workers except carpenters, electricians, painters, plumbers, and construction laborers (5.3%)
Retail sales workers, except cashiers (5.1%)
Driver/sales workers and truck drivers (4.4%)
Other management occupations, except farmers and farm managers (3.6%)
Other office and administrative support workers, including supervisors (9.2%)
Information and record clerks, except customer service representatives (8.0%)
Secretaries and administrative assistants (7.0%)
Health technologists and technicians (5.5%)
Building and grounds cleaning and maintenance occupations (4.9%)
Retail sales workers, except cashiers (4.8%)
Registered nurses (3.9%)
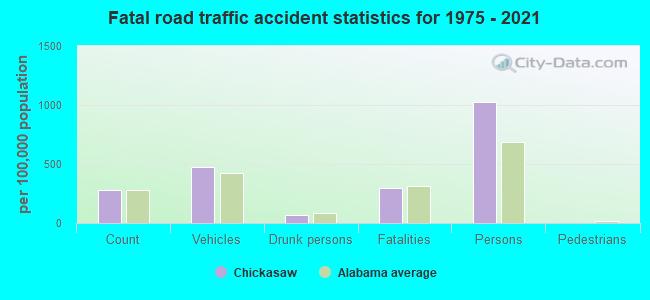
Tornado activity:
Chickasaw-area historical tornado activity is below Alabama state average. It is 33% greater than the overall U.S. average.
On 11/3/1968, a category F3 (max. wind speeds 158-206 mph) tornado 2.2 miles away from the Chickasaw city center injured 18 people and caused between $50,000 and $500,000 in damages.
On 11/21/1997, a category F3 tornado 3.9 miles away from the city center caused $2 million in damages.
Earthquake activity:
Chickasaw-area historical earthquake activity is significantly above Alabama state average. It is 56% smaller than the overall U.S. average. On 10/24/1997 at 08:35:17, a magnitude 4.9 (4.8 MB, 4.2 MS, 4.9 LG, Depth: 6.2 mi, Class: Light, Intensity: IV - V) earthquake occurred 54.1 miles away from the city center On 9/10/2006 at 14:56:08, a magnitude 5.9 (5.9 MB, 5.5 MS, 5.8 MW, Class: Moderate, Intensity: VI - VII) earthquake occurred 324.5 miles away from the city center On 1/18/1999 at 07:00:53, a magnitude 4.8 (4.8 MB, 4.0 LG, Depth: 0.6 mi) earthquake occurred 188.9 miles away from the city center On 11/7/2004 at 11:20:21, a magnitude 4.3 (4.3 MW, Depth: 3.1 mi) earthquake occurred 130.6 miles away from the city center On 5/6/2018 at 16:47:09, a magnitude 4.6 (4.6 MB, Depth: 6.2 mi) earthquake occurred 203.3 miles away from the city center On 9/3/2020 at 15:07:53, a magnitude 3.8 (3.8 MW, Depth: 2.5 mi, Class: Light, Intensity: II - III) earthquake occurred 55.8 miles away from the city center Magnitude types: regional Lg-wave magnitude (LG), body-wave magnitude (MB), surface-wave magnitude (MS), moment magnitude (MW) Natural disasters: The number of natural disasters in Mobile County (31) is a lot greater than the US average (15).Major Disasters (Presidential) Declared: 20Emergencies Declared: 7Hurricanes: 18, Floods: 8, Storms: 8, Tornadoes: 6, Winds: 3, Tropical Storms: 2, Drought: 1, Snowfall: 1, Winter Storm: 1, Other: 1 (Note: some incidents may be assigned to more than one category). Hospitals and medical centers near Chickasaw: NORTH MOBILE NURSING AND REHABILITATION CTR (Nursing Home, about 3 miles away; EIGHT MILE, AL)
COASTAL HOSPICE (Hospital, about 4 miles away; SARALAND, AL)
TWIN OAKS NH INC (Nursing Home, about 4 miles away; MOBILE, AL)
TWIN OAKS NURSING HOME, LLC (Nursing Home, about 4 miles away; MOBILE, AL)
UNIV OF SOUTH ALABAMA MEDICAL CENTER (about 5 miles away; MOBILE, AL)
FMC JAGUAR (Dialysis Facility, about 5 miles away; MOBILE, AL)
MOBILE INFIRMARY (about 5 miles away; MOBILE, AL)
Amtrak station near Chickasaw: 6 miles: MOBILE (11 GOVERNMENT ST.) Services: ticket office, fully wheelchair accessible, enclosed waiting area, public restrooms, public payphones, paid short-term parking, call for taxi service, public transit connection.
Colleges/universities with over 2000 students nearest to Chickasaw:
Bishop State Community College (about 6 miles; Mobile, AL ; Full-time enrollment: 2,822)
University of South Alabama (about 8 miles; Mobile, AL ; FT enrollment: 13,228)
James H Faulkner State Community College (about 20 miles; Bay Minette, AL ; FT enrollment: 3,703)
Columbia Southern University (about 40 miles; Orange Beach, AL ; FT enrollment: 14,996)
The University of West Florida (about 54 miles; Pensacola, FL ; FT enrollment: 10,240)
Pensacola State College (about 57 miles; Pensacola, FL ; FT enrollment: 8,740)
Mississippi Gulf Coast Community College (about 64 miles; Perkinston, MS ; FT enrollment: 8,320)
Public high school in Chickasaw: CHICKASAW CITY HIGH SCHOOL Location: 50 12TH AVE, Grades: 6-12)
Private high school in Chickasaw: WORD OF LIFE INSTITUTE CHRISTIAN SCHOOL Students: 13, Location: 351 S CRAFT HWY, Grades: KG-11)
Public elementary/middle school in Chickasaw: CHICKASAW ELEMENTARY Location: 50 12TH AVE, Grades: PK-5)
See full list of schools located in Chickasaw Library in Chickasaw: CHICKASAW - INA PULLEN SMALLWOOD MEMORIAL LIBRARY Operating income: $52,158; Location: 224 GRANT STREET; 27,838 books ; 1,855 audio materials ; 3,282 video materials ; 3 local licensed databases ; 83 state licensed databases ; 3 other licensed databases ; 91 print serial subscriptions ; 79 electronic serial subscriptions )
Notable locations in Chickasaw: (A) , Chickasaw Fire Prevention Bureau (B) , Chickasaw Fire Department (C) , Ina Pullen Smallwood Memorial Library (D) . Display/hide their locations on the map
Shopping Centers: (1) , Chickasaw Shopping Center (2) , Northgate Shopping Center (3) , Village Square Shopping Center (4) . Display/hide their locations on the map
Churches in Chickasaw include: (A) , Trinity Faith Bible Church (B) , Saint Thomas Church (C) , Saint Michaels Episcopal Church (D) , North Mobile Free Holiness Church (E) , Mount Calvary Baptist Church (F) , First Baptist Church (G) , Consolation Primitive Baptist Church (H) , Church of God of Prophecy (I) . Display/hide their locations on the map
Streams, rivers, and creeks: (A) , Eightmile Creek (B) . Display/hide their locations on the map
Park in Chickasaw: (1) . Display/hide its location on the map
Birthplace of: Ray Sawyer - Male singer.
Mobile County has a predicted average indoor radon screening level less than 2 pCi/L (pico curies per liter) - Low Potential Average household size: This city:
2.5 peopleAlabama:
2.5 people
Percentage of family households: This city:
66.3%Whole state:
67.8%
Percentage of households with unmarried partners: This city:
4.5%Whole state:
4.7%
Likely homosexual households (counted as self-reported same-sex unmarried-partner households)
Lesbian couples: 0.4% of all households Gay men: 0.2% of all households
5 people in local jails and other municipal confinement facilities in 2010people in local jails and other confinement facilities (including police lockups) in 2000people in religious group quarters in 2000
Banks with branches in Chickasaw (2011 data):
Compass Bank: Chickasaw Branch at 365 North Craft Highway, branch established on 1975/05/08. Info updated 2011/02/24: Bank assets: $63,107.0 mil, Deposits: $46,232.4 mil, headquarters in Birmingham, AL, negative income in the last year , Commercial Lending Specialization, 720 total offices , Holding Company: Banco Bilbao Vizcaya Argentaria, S.A.
For population 15 years and over in Chickasaw:
Never married: 42.0%Now married: 32.7%Separated: 4.3%Widowed: 6.7%Divorced: 14.3% For population 25 years and over in Chickasaw:
High school or higher: 88.3%Bachelor's degree or higher: 12.2%Graduate or professional degree: 2.5%Unemployed: 7.7%Mean travel time to work (commute): 20.0 minutes
Education Gini index (Inequality in education) Here:
8.7Alabama average:
11.5
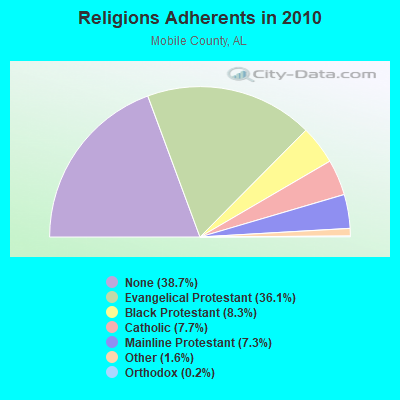
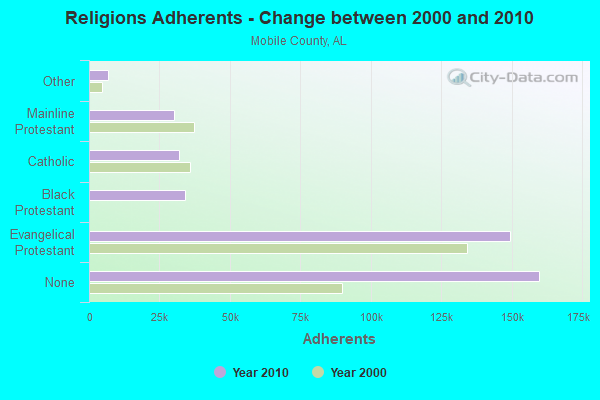
Religion statistics for Chickasaw, AL (based on Mobile County data)
Religion Adherents Congregations Evangelical Protestant 149,286 354 Black Protestant 34,124 99 Catholic 32,003 35 Mainline Protestant 30,312 79 Other 6,684 30 Orthodox 724 2 None 159,859 -
Source: Clifford Grammich, Kirk Hadaway, Richard Houseal, Dale E.Jones, Alexei Krindatch, Richie Stanley and Richard H.Taylor. 2012. 2010 U.S.Religion Census: Religious Congregations & Membership Study. Association of Statisticians of American Religious Bodies. Jones, Dale E., et al. 2002. Congregations and Membership in the United States 2000. Nashville, TN: Glenmary Research Center. Graphs represent county-level data
Food Environment Statistics: Number of grocery stores : 61Mobile County :
1.51 / 10,000 pop.Alabama :
1.89 / 10,000 pop.
Number of supercenters and club stores : 6Here :
0.15 / 10,000 pop.Alabama :
0.20 / 10,000 pop.
Number of convenience stores (no gas) : 18Here :
0.45 / 10,000 pop.Alabama :
0.65 / 10,000 pop.
Number of convenience stores (with gas) : 246This county :
6.09 / 10,000 pop.Alabama :
6.32 / 10,000 pop.
Number of full-service restaurants : 211Here :
5.22 / 10,000 pop.State :
5.75 / 10,000 pop.
Adult diabetes rate : This county :
11.8%State :
11.8%
Low-income preschool obesity rate : Mobile County :
10.9%State :
13.5%
Health and Nutrition: Healthy diet rate : Chickasaw:
54.9%Alabama:
49.0%
Average overall health of teeth and gums : Average BMI : Chickasaw:
28.4Alabama:
28.9
People feeling badly about themselves : Chickasaw:
20.4%Alabama:
20.7%
People not drinking alcohol at all : This city:
9.8%Alabama:
11.0%
Average hours sleeping at night : Overweight people : Chickasaw:
35.1%State:
34.4%
General health condition : This city:
60.7%Alabama:
55.2%
Average condition of hearing : Chickasaw:
78.8%State:
79.3%
More about Health and Nutrition of Chickasaw, AL Residents
Local government employment and payroll (March 2022)
Function
Full-time employees
Monthly full-time payroll
Average yearly full-time wage
Part-time employees
Monthly part-time payroll
Police Protection - Officers
22 $91,787 $50,066 0 $0 Other and Unallocable
16 $39,610 $29,708 7 $3,601 Firefighters
6 $24,371 $48,742 0 $0 Other Government Administration
6 $18,401 $36,802 0 $0 Correction
5 $16,206 $38,894 0 $0 Judicial and Legal
2 $6,299 $37,794 0 $0 Parks and Recreation
2 $7,166 $42,996 0 $0 Solid Waste Management
1 $2,170 $26,040 0 $0 Police - Other
1 $1,204 $14,448 0 $0 Welfare
0 $0 1 $1,563
Totals for Government
61 $207,214 $40,763 8 $5,164
Chickasaw government finances - Expenditure in 2017 (per resident):
Construction - General - Other: $1,553,000 ($246.12)
Current Operations - Police Protection: $2,374,000 ($376.23)
Central Staff Services: $1,237,000 ($196.04)Solid Waste Management: $692,000 ($109.67)Regular Highways: $681,000 ($107.92)Sewerage: $533,000 ($84.47)Parks and Recreation: $352,000 ($55.78)Judicial and Legal Services: $219,000 ($34.71)General - Other: $1,000 ($0.16)General - Interest on Debt: $52,000 ($8.24)
Chickasaw government finances - Revenue in 2017 (per resident):
Charges - Sewerage: $1,053,000 ($166.88)
Other: $314,000 ($49.76)Miscellaneous - General Revenue - Other: $158,000 ($25.04)
State Intergovernmental - General Local Government Support: $1,189,000 ($188.43)
Other: $22,000 ($3.49)Tax - Other License: $2,107,000 ($333.91)
General Sales and Gross Receipts: $1,870,000 ($296.35)Other: $430,000 ($68.15)Motor Fuels Sales: $313,000 ($49.60)Property: $296,000 ($46.91)Motor Vehicle License: $27,000 ($4.28)
Chickasaw government finances - Debt in 2017 (per resident):
Long Term Debt - Beginning Outstanding - Unspecified Public Purpose: $1,029,000 ($163.07)
Outstanding Unspecified Public Purpose: $978,000 ($154.99)Retired Unspecified Public Purpose: $51,000 ($8.08)
Chickasaw government finances - Cash and Securities in 2017 (per resident):
Other Funds - Cash and Securities: $212,000 ($33.60)
4.11% of this county's 2021 resident taxpayers lived in other counties in 2020 ($52,985 average adjusted gross income )
Here:
4.11%Alabama average:
6.87%
0.01% of residents moved from foreign countries ($193 average AGI )Mobile County:
0.01%Alabama average:
0.02%
Top counties from which taxpayers relocated into this county between 2020 and 2021:
Businesses in Chickasaw, AL
Name Count Name Count
AutoZone 1 Rite Aid 1 Church's Chicken 1 Subway 1 Little Caesars Pizza 1 U-Haul 1
Strongest AM radio stations in Chickasaw:
WBHY (840 AM; daytime; 10 kW; MOBILE, AL; Owner: GOFORTH MEDIA, INC.)
WLPR (960 AM; 5 kW; PRICHARD, AL; Owner: GOFORTH MEDIA, INC.)
WKSJ (1270 AM; 5 kW; PRICHARD, AL; Owner: CLEAR CHANNEL BROADCASTING LICENSES, INC.)
WNTM (710 AM; 10 kW; MOBILE, AL; Owner: CLEAR CHANNEL BROADCASTING LICENSES, INC.)
WLVV (1410 AM; 5 kW; MOBILE, AL; Owner: WLVV, INC.)
WABB (1480 AM; 5 kW; MOBILE, AL; Owner: WABB-FM, INC.)
WMOB (1360 AM; 5 kW; MOBILE, AL; Owner: BUDDY TUCKER ASSOCIATION, INC.)
WGOK (900 AM; 1 kW; MOBILE, AL; Owner: CUMULUS LICENSING CORP.)
WDLT (660 AM; 10 kW; FAIRHOPE, AL; Owner: CUMULUS LICENSING CORP.)
WASG (550 AM; 25 kW; ATMORE, AL; Owner: 550 AM, INC)
WBCA (1110 AM; daytime; 10 kW; BAY MINETTE, AL; Owner: SOUTHERN MEDIA COMMUNICATIONS, INC)
WEBY (1330 AM; 25 kW; MILTON, FL; Owner: SPINNAKER LICENSE CORPORATION)
WSJC (810 AM; 50 kW; MAGEE, MS; Owner: FAMILY TALK RADIO)
Strongest FM radio stations in Chickasaw:
WBHY-FM (88.5 FM; MOBILE, AL; Owner: GOFORTH MEDIA, INC.)
WDLT-FM (98.3 FM; CHICKASAW, AL; Owner: CUMULUS LICENSING CORP.)
WZEW (92.1 FM; FAIRHOPE, AL; Owner: BALDWIN BROADCASTING COMPANY, DEBTOR IN POSSESSION)
WRKH (96.1 FM; MOBILE, AL; Owner: CLEAR CHANNEL BROADCASTING LICENSES, INC.)
WMXC (99.9 FM; MOBILE, AL; Owner: CLEAR CHANNEL BROADCASTING LICENSES, INC.)
WABB-FM (97.5 FM; MOBILE, AL; Owner: WABB-FM, INC.)
WHIL-FM (91.3 FM; MOBILE, AL; Owner: SPRING HILL COLLEGE)
WMEZ (94.1 FM; PENSACOLA, FL; Owner: 6 JOHNSON ROAD LICENSES, INC.)
WJLQ (100.7 FM; PENSACOLA, FL; Owner: CUMULUS LICENSING CORP.)
WBLX-FM (92.9 FM; MOBILE, AL; Owner: CUMULUS LICENSING CORP.)
WYOK (104.1 FM; ATMORE, AL; Owner: CUMULUS LICENSING CORP.)
WAVH (106.5 FM; DAPHNE, AL; Owner: BALDWIN BROADCASTING COMPANY, DEBTOR IN POSSESSION)
WKSJ-FM (94.9 FM; MOBILE, AL; Owner: CLEAR CHANNEL BROADCASTING LICENSES, INC.)
WPCS (89.5 FM; PENSACOLA, FL; Owner: PENSACOLA CHRISTIAN COLLEGE, INC)
WNSP (105.5 FM; BAY MINETTE, AL; Owner: COM+, LLC)
WYCL (107.3 FM; PENSACOLA, FL; Owner: CONCORD MEDIA GROUP, INC.)
WOSM (103.1 FM; OCEAN SPRINGS, MS; Owner: CHARLES H. COOPER)
WMAH-FM (90.3 FM; BILOXI, MS; Owner: MISSISSIPPI AUTHORITY FOR EDUCATIONAL TV)
WKNN-FM (99.1 FM; PASCAGOULA, MS; Owner: CHASE RADIO PROPERTIES, L.L.C.)
WMJY (93.7 FM; BILOXI, MS; Owner: CHASE RADIO PROPERTIES, L.L.C.)
TV broadcast stations around Chickasaw:
WRBM-LP (Channel 60; PRICHARD, AL; Owner: UPPER GULF COAST, L.L.C.)
WKRG-TV (Channel 5; MOBILE, AL; Owner: MEDIA GENERAL BROADCASTING OF SOUTH CAROLINA HOLDINGS, INC.)
W52BF (Channel 52; MOBILE, AL; Owner: VENTANA TELEVISION, INC.)
WEAR-TV (Channel 3; PENSACOLA, FL; Owner: WEAR LICENSEE, LLC)
WALA-TV (Channel 10; MOBILE, AL; Owner: EMMIS TELEVISION LICENSE CORPORATION)
WMPV-TV (Channel 21; MOBILE, AL; Owner: TRINITY BROADCASTING NETWORK)
WPMI (Channel 15; MOBILE, AL; Owner: CLEAR CHANNEL BROADCASTING LICENSES, INC.)
W50CF (Channel 50; MOBILE, AL; Owner: FRANKLIN MEDIA, INC.)
WJTC (Channel 44; PENSACOLA, FL; Owner: CLEAR CHANNEL BROADCASTING LICENSES, INC.)
WEIQ (Channel 42; MOBILE, AL; Owner: ALABAMA EDUCATIONAL TELEVISION COMMISSION)
WHBR (Channel 33; PENSACOLA, FL; Owner: CHRISTIAN TELEVISION OF PENSACOLA/MOBILE, INC.)
WBPG (Channel 55; GULF SHORES, AL; Owner: EMMIS TELEVISION LICENSE CORPORATION)
WSRE (Channel 23; PENSACOLA, FL; Owner: DST .BD. OF TRUSTEES PENSACOLA JR. COLLEGE)
WMAH-TV (Channel 19; BILOXI, MS; Owner: MISSISSIPPI AUTHORITY FOR EDUCATIONAL TELEVISION)
WMOE-LP (Channel 12; MOBILE, AL; Owner: TIGER EYE BROADCASTING CORPORATION)
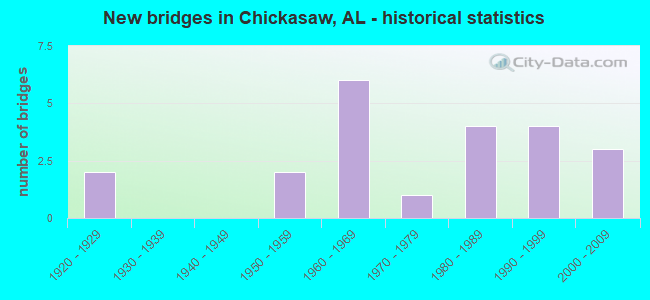
National Bridge Inventory (NBI) Statistics 22 Number of bridges449ft / 137m Total length $73,567,000 Total costs465,101 Total average daily traffic49,976 Total average daily truck traffic
New bridges - historical statistics
2 1920-1929 2 1950-1959 6 1960-1969 1 1970-1979 4 1980-1989 4 1990-1999 3 2000-2009
See full National Bridge Inventory statistics for Chickasaw, AL
FCC Registered Antenna Towers: 10 (
See the full list of FCC Registered Antenna Towers in Chickasaw )
FCC Registered Broadcast Land Mobile Towers: 6
Lat: 30.772500 Lon: -88.084167, Call Sign: WPUS593, Licensee ID: L00470991, Assigned Frequencies: 469.212 MHz, 469.037 MHz, 469.237 MHz, 469.062 MHz, 469.262 MHz, 469.087 MHz, 469.287 MHz, 469.112 MHz, 469.312 MHz, 469.137 MHz... (+21 more), Grant Date: 02/07/2012, Expiration Date: 04/24/2022, Cancellation Date: 06/25/2022, Certifier: Bill Pavelka, Registrant: Pavelka Investments Inc., 100 North Craft Hwy 43, Chickasaw, AL 36611, Phone: (251) 456-7664, Fax: (251) 633-4179, Email:
Lat: 30.763028 Lon: -88.060806, Call Sign: WQHG394, Assigned Frequencies: 451.687 MHz, 456.687 MHz, 452.287 MHz, 457.287 MHz, Grant Date: 07/23/2007, Expiration Date: 07/23/2017, Cancellation Date: 09/23/2017, Certifier: Dwayne Cleveland, Registrant: Team One Communications, Inc., 3550 Pleasent Valley Road, Mobile, AL 36609, Phone: (251) 343-2560, Fax: (251) 343-2842, Email:
200 Viaduct Rd (Lat: 30.829639 Lon: -88.066111), Call Sign: WQMR766, Assigned Frequencies: 152.315 MHz, 157.702 MHz, 159.855 MHz, 159.930 MHz, 160.065 MHz, 160.125 MHz, Grant Date: 11/01/2010, Expiration Date: 11/01/2020, Cancellation Date: 01/02/2021, Certifier: Larry Trotter, Registrant: Pros Rf, 6160 Song Breeze Trace, Duluth, GA 30097-1470, Phone: (270) 908-4402 Lat: 30.763417 Lon: -88.059139, Call Sign: WQZH276, Assigned Frequencies: 3100.00 MHz, 3100.00 MHz, Grant Date: 05/16/2017, Expiration Date: 05/16/2027, Certifier: Larry F Butts, Registrant: Southern Company Services, 600 N. 18th St / Bin 5n-5409, Birmingham, AL 35203, Phone: (205) 257-7600, Fax: (205) 257-2134, Email:
Lat: 30.763028 Lon: -88.060806, Call Sign: WQZV627, Assigned Frequencies: 451.687 MHz, 452.287 MHz, 456.687 MHz, 457.287 MHz, Grant Date: 08/15/2017, Expiration Date: 08/15/2027, Certifier: Allen Rentz, Registrant: Team One Communications, Inc., 3360 Key Street, Mobile, AL 36609, Phone: (251) 343-2560, Fax: (251) 344-9343, Email:
Lat: 30.761111 Lon: -88.081528, Call Sign: WRCL377, Assigned Frequencies: 451.237 MHz, 452.837 MHz, 456.237 MHz, 456.762 MHz, 457.837 MHz, Grant Date: 10/30/2018, Expiration Date: 10/30/2028, Certifier: Kathy Odom, Registrant: Hurricane Electronics, 201 West Lee Street, Mobile, AL 36611, Phone: (251) 476-4000, Fax: (251) 479-8638, Email:
FCC Registered Microwave Towers: 2
STATION, Chickasaw Steam Plant (Lat: 30.764056 Lon: -88.060250), Structure height: 24.4 m, Overall height: 27.4 m, Call Sign: WOP42, Assigned Frequencies: 1875.00 MHz, Grant Date: 08/22/1995, Expiration Date: 08/22/2000, Cancellation Date: 05/28/1997, Phone: (205) 250-2561 Word, AL, 351 South Craft Highway (Lat: 30.757694 Lon: -88.073611), Type: Tower, Structure height: 24.4 m, Call Sign: WPVT506, Assigned Frequencies: 23075.0 MHz, Grant Date: 08/15/2002, Expiration Date: 08/15/2012, Cancellation Date: 05/06/2009, Certifier: John Franklin, Registrant: Consolidated Spectrum Services, 22 Merrill Drive, Atkinson, NH 03811, Phone: (603) 362-5977, Fax: (603) 362-5977, Email:
FCC Registered Maritime Coast & Aviation Ground Towers: 3
Warrior & Gulf Terminals (Lat: 30.758528 Lon: -88.052222), Type: Tower, Overall height: 46 m, Call Sign: KIP929, Licensee ID: L00004622, Assigned Frequencies: 156.450 MHz, 156.500 MHz, 156.800 MHz, Grant Date: 12/23/2003, Expiration Date: 03/10/2014, Cancellation Date: 05/10/2014, Registrant: Warrior & Gulf Navigation Co, Chickasaw, AL 36611 Viaduct Rd (Lat: 30.829639 Lon: -88.066111), Type: Building, Overall height: 3 m, Call Sign: KXR924, Assigned Frequencies: 156.275 MHz, 156.450 MHz, 156.800 MHz, 156.950 MHz, Grant Date: 01/30/2002, Expiration Date: 02/25/2012, Cancellation Date: 04/28/2012, Certifier: Patricia Waters, Registrant: Kraskin, Moorman & Cosson, LLC, 2120 L Street, Nw, Suite 520, Washington, DC 20037, Phone: (202) 296-8890, Fax: (202) 296-8893 250 Vidock Rd (Lat: 30.769639 Lon: -88.058333), Type: Building, Overall height: 7 m, Call Sign: WHU569, Assigned Frequencies: 4.14740 MHz, 6.22840 MHz, 8.29840 MHz, 12.3574 MHz, 16.5324 MHz, 22.1634 MHz, Grant Date: 07/11/1995, Expiration Date: 07/11/2000, Cancellation Date: 05/06/2001, Registrant: Falgout Brothers Inc, Rt 2 Box 309 Buchannan St, Lockport, LA 70374 FCC Registered Amateur Radio Licenses: 9 (
See the full list of FCC Registered Amateur Radio Licenses in Chickasaw )
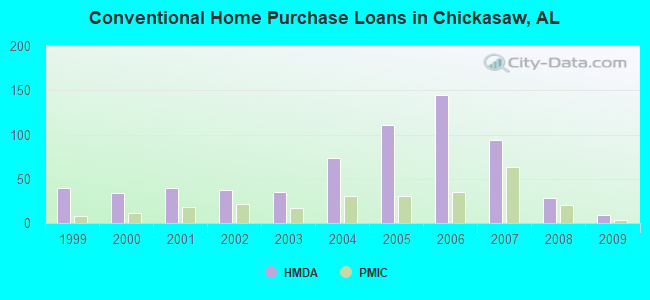
Home Mortgage Disclosure Act Aggregated Statistics For Year 2009(Based on 3 full and 1 partial tracts) A) FHA, FSA/RHS & VA B) Conventional C) Refinancings D) Home Improvement Loans F) Non-occupant Loans on G) Loans On Manufactured Number Average Value Number Average Value Number Average Value Number Average Value Number Average Value Number Average Value
LOANS ORIGINATED 32 $81,415 9 $72,440 52 $75,519 1 $2,970 10 $53,469 0 $0 APPLICATIONS APPROVED, NOT ACCEPTED 1 $87,180 1 $26,000 6 $70,858 0 $0 1 $49,610 1 $26,000 APPLICATIONS DENIED 3 $120,603 6 $59,397 28 $83,432 4 $30,928 2 $57,760 0 $0 APPLICATIONS WITHDRAWN 4 $70,308 4 $50,125 22 $79,746 2 $10,880 3 $38,597 0 $0 FILES CLOSED FOR INCOMPLETENESS 2 $137,340 0 $0 6 $117,062 0 $0 0 $0 0 $0
Aggregated Statistics For Year 2008(Based on 3 full and 1 partial tracts) A) FHA, FSA/RHS & VA B) Conventional C) Refinancings D) Home Improvement Loans F) Non-occupant Loans on G) Loans On Manufactured Number Average Value Number Average Value Number Average Value Number Average Value Number Average Value Number Average Value
LOANS ORIGINATED 32 $94,968 28 $69,162 50 $80,413 16 $29,101 21 $61,385 2 $44,270 APPLICATIONS APPROVED, NOT ACCEPTED 2 $39,000 2 $80,395 6 $82,623 2 $12,625 1 $46,340 2 $39,000 APPLICATIONS DENIED 7 $97,637 12 $75,118 84 $93,146 27 $48,564 6 $37,177 1 $50,750 APPLICATIONS WITHDRAWN 7 $109,573 6 $99,350 19 $100,737 4 $65,060 2 $50,420 0 $0 FILES CLOSED FOR INCOMPLETENESS 1 $207,210 1 $128,800 19 $107,986 1 $9,910 2 $68,000 0 $0
Aggregated Statistics For Year 2007(Based on 3 full and 1 partial tracts) A) FHA, FSA/RHS & VA B) Conventional C) Refinancings D) Home Improvement Loans F) Non-occupant Loans on G) Loans On Manufactured Number Average Value Number Average Value Number Average Value Number Average Value Number Average Value Number Average Value
LOANS ORIGINATED 33 $79,301 94 $71,642 78 $75,166 18 $44,006 32 $57,768 0 $0 APPLICATIONS APPROVED, NOT ACCEPTED 1 $118,290 18 $75,659 14 $93,449 3 $35,493 4 $67,438 1 $68,530 APPLICATIONS DENIED 5 $65,818 28 $71,946 88 $81,152 28 $35,854 19 $56,515 1 $52,000 APPLICATIONS WITHDRAWN 4 $82,250 13 $76,647 26 $84,799 6 $63,125 6 $53,560 0 $0 FILES CLOSED FOR INCOMPLETENESS 0 $0 8 $85,685 11 $120,796 1 $68,270 1 $110,970 0 $0
Aggregated Statistics For Year 2006(Based on 3 full and 1 partial tracts) A) FHA, FSA/RHS & VA B) Conventional C) Refinancings D) Home Improvement Loans F) Non-occupant Loans on G) Loans On Manufactured Number Average Value Number Average Value Number Average Value Number Average Value Number Average Value Number Average Value
LOANS ORIGINATED 21 $80,824 145 $62,551 54 $70,633 16 $44,060 54 $52,633 1 $58,000 APPLICATIONS APPROVED, NOT ACCEPTED 3 $82,623 16 $79,910 7 $81,106 2 $27,500 5 $51,302 1 $7,000 APPLICATIONS DENIED 8 $77,800 54 $65,538 69 $81,680 37 $34,785 16 $60,648 1 $48,360 APPLICATIONS WITHDRAWN 5 $99,824 27 $61,889 31 $83,632 4 $28,350 7 $47,714 0 $0 FILES CLOSED FOR INCOMPLETENESS 0 $0 12 $94,224 6 $422,742 1 $19,690 3 $54,223 0 $0
Aggregated Statistics For Year 2005(Based on 3 full and 1 partial tracts) A) FHA, FSA/RHS & VA B) Conventional C) Refinancings D) Home Improvement Loans F) Non-occupant Loans on G) Loans On Manufactured Number Average Value Number Average Value Number Average Value Number Average Value Number Average Value Number Average Value
LOANS ORIGINATED 24 $76,216 111 $60,547 60 $59,326 7 $99,667 54 $57,547 0 $0 APPLICATIONS APPROVED, NOT ACCEPTED 0 $0 19 $58,503 17 $60,778 3 $52,563 4 $41,922 1 $21,000 APPLICATIONS DENIED 4 $74,228 29 $75,606 72 $67,894 15 $35,111 7 $50,653 0 $0 APPLICATIONS WITHDRAWN 2 $59,320 42 $79,728 30 $76,355 3 $83,080 0 $0 0 $0 FILES CLOSED FOR INCOMPLETENESS 0 $0 3 $66,603 10 $56,965 0 $0 1 $35,000 0 $0
Aggregated Statistics For Year 2004(Based on 3 full and 1 partial tracts) A) FHA, FSA/RHS & VA B) Conventional C) Refinancings D) Home Improvement Loans F) Non-occupant Loans on G) Loans On Manufactured Number Average Value Number Average Value Number Average Value Number Average Value Number Average Value Number Average Value
LOANS ORIGINATED 22 $74,353 73 $58,779 74 $53,353 8 $28,485 37 $50,506 0 $0 APPLICATIONS APPROVED, NOT ACCEPTED 0 $0 12 $70,216 36 $61,989 1 $54,370 7 $44,286 1 $10,230 APPLICATIONS DENIED 3 $78,683 17 $53,621 60 $59,170 10 $40,540 8 $49,642 1 $55,000 APPLICATIONS WITHDRAWN 3 $72,703 10 $60,290 40 $65,362 3 $20,000 6 $57,250 0 $0 FILES CLOSED FOR INCOMPLETENESS 0 $0 3 $60,333 8 $88,684 1 $32,000 1 $21,480 0 $0
Aggregated Statistics For Year 2003(Based on 3 full and 1 partial tracts) A) FHA, FSA/RHS & VA B) Conventional C) Refinancings D) Home Improvement Loans F) Non-occupant Loans on Number Average Value Number Average Value Number Average Value Number Average Value Number Average Value
LOANS ORIGINATED 37 $63,005 35 $54,408 130 $60,948 7 $13,741 29 $46,360 APPLICATIONS APPROVED, NOT ACCEPTED 4 $56,065 5 $69,722 32 $58,594 0 $0 4 $62,470 APPLICATIONS DENIED 8 $68,708 8 $78,225 78 $65,728 11 $18,821 6 $48,900 APPLICATIONS WITHDRAWN 2 $48,950 5 $55,168 41 $67,829 1 $107,010 3 $53,320 FILES CLOSED FOR INCOMPLETENESS 0 $0 4 $70,175 23 $58,413 0 $0 1 $30,180
Aggregated Statistics For Year 2002(Based on 3 full and 1 partial tracts) A) FHA, FSA/RHS & VA B) Conventional C) Refinancings D) Home Improvement Loans E) Loans on Dwellings For 5+ Families F) Non-occupant Loans on Number Average Value Number Average Value Number Average Value Number Average Value Number Average Value Number Average Value
LOANS ORIGINATED 46 $63,831 37 $47,316 92 $54,194 4 $18,720 1 $7,920,000 34 $42,528 APPLICATIONS APPROVED, NOT ACCEPTED 1 $38,640 7 $43,934 20 $63,036 1 $20,000 0 $0 4 $29,658 APPLICATIONS DENIED 7 $60,667 7 $48,766 51 $58,738 17 $13,505 0 $0 8 $22,316 APPLICATIONS WITHDRAWN 1 $65,000 7 $56,451 30 $53,010 2 $53,505 0 $0 3 $41,667 FILES CLOSED FOR INCOMPLETENESS 0 $0 3 $78,687 24 $62,661 1 $32,700 0 $0 0 $0
Aggregated Statistics For Year 2001(Based on 3 full and 1 partial tracts) A) FHA, FSA/RHS & VA B) Conventional C) Refinancings D) Home Improvement Loans F) Non-occupant Loans on Number Average Value Number Average Value Number Average Value Number Average Value Number Average Value
LOANS ORIGINATED 46 $57,527 40 $39,142 81 $55,101 8 $9,102 28 $35,178 APPLICATIONS APPROVED, NOT ACCEPTED 0 $0 6 $44,148 10 $66,265 1 $4,950 0 $0 APPLICATIONS DENIED 4 $64,150 18 $49,922 47 $53,579 7 $12,504 3 $28,207 APPLICATIONS WITHDRAWN 2 $64,165 2 $52,000 23 $49,056 2 $19,815 2 $37,000 FILES CLOSED FOR INCOMPLETENESS 0 $0 2 $43,025 11 $57,748 1 $35,000 0 $0
Aggregated Statistics For Year 2000(Based on 3 full and 1 partial tracts) A) FHA, FSA/RHS & VA B) Conventional C) Refinancings D) Home Improvement Loans F) Non-occupant Loans on Number Average Value Number Average Value Number Average Value Number Average Value Number Average Value
LOANS ORIGINATED 43 $57,923 34 $50,726 41 $48,044 8 $5,628 7 $37,506 APPLICATIONS APPROVED, NOT ACCEPTED 4 $47,620 9 $32,457 8 $48,909 1 $9,300 1 $12,530 APPLICATIONS DENIED 10 $46,349 38 $44,589 32 $45,418 8 $9,260 0 $0 APPLICATIONS WITHDRAWN 3 $54,210 7 $42,870 15 $37,543 1 $16,560 0 $0 FILES CLOSED FOR INCOMPLETENESS 0 $0 0 $0 9 $48,906 0 $0 1 $27,740
Aggregated Statistics For Year 1999(Based on 3 full and 1 partial tracts) A) FHA, FSA/RHS & VA B) Conventional C) Refinancings D) Home Improvement Loans E) Loans on Dwellings For 5+ Families F) Non-occupant Loans on Number Average Value Number Average Value Number Average Value Number Average Value Number Average Value Number Average Value
LOANS ORIGINATED 48 $53,438 40 $45,293 58 $44,667 8 $22,272 1 $132,720 12 $36,630 APPLICATIONS APPROVED, NOT ACCEPTED 0 $0 10 $38,322 7 $48,684 5 $15,952 0 $0 1 $69,800 APPLICATIONS DENIED 10 $54,104 53 $49,262 40 $48,597 11 $17,203 0 $0 3 $20,030 APPLICATIONS WITHDRAWN 5 $57,228 13 $65,208 14 $51,230 0 $0 0 $0 1 $83,560 FILES CLOSED FOR INCOMPLETENESS 0 $0 1 $73,730 9 $48,433 0 $0 0 $0 0 $0
Detailed HMDA statistics for the following Tracts:
0050.00
, 0051.00 , 0052.00 , 0053.00
Private Mortgage Insurance Companies Aggregated Statistics For Year 2009(Based on 2 full tracts) A) Conventional B) Refinancings Number Average Value Number Average Value
LOANS ORIGINATED 3 $65,310 2 $125,275 APPLICATIONS APPROVED, NOT ACCEPTED 2 $54,000 0 $0 APPLICATIONS DENIED 0 $0 0 $0 APPLICATIONS WITHDRAWN 2 $161,875 0 $0 FILES CLOSED FOR INCOMPLETENESS 0 $0 0 $0
Aggregated Statistics For Year 2008(Based on 3 full and 1 partial tracts) A) Conventional B) Refinancings C) Non-occupant Loans on Number Average Value Number Average Value Number Average Value
LOANS ORIGINATED 20 $80,260 5 $102,782 5 $71,230 APPLICATIONS APPROVED, NOT ACCEPTED 17 $81,047 2 $118,895 4 $69,335 APPLICATIONS DENIED 2 $42,000 0 $0 2 $42,000 APPLICATIONS WITHDRAWN 0 $0 0 $0 0 $0 FILES CLOSED FOR INCOMPLETENESS 2 $68,000 1 $124,840 1 $61,000
Aggregated Statistics For Year 2007(Based on 3 full and 1 partial tracts) A) Conventional B) Refinancings C) Non-occupant Loans on Number Average Value Number Average Value Number Average Value
LOANS ORIGINATED 63 $77,661 16 $82,008 17 $57,904 APPLICATIONS APPROVED, NOT ACCEPTED 6 $80,358 2 $77,000 1 $58,000 APPLICATIONS DENIED 2 $46,000 0 $0 1 $50,000 APPLICATIONS WITHDRAWN 2 $82,235 1 $97,000 0 $0 FILES CLOSED FOR INCOMPLETENESS 0 $0 0 $0 0 $0
Aggregated Statistics For Year 2006(Based on 3 full and 1 partial tracts) A) Conventional B) Refinancings C) Non-occupant Loans on Number Average Value Number Average Value Number Average Value
LOANS ORIGINATED 35 $64,317 4 $59,998 12 $56,306 APPLICATIONS APPROVED, NOT ACCEPTED 4 $71,938 2 $79,925 1 $36,000 APPLICATIONS DENIED 0 $0 0 $0 0 $0 APPLICATIONS WITHDRAWN 1 $101,000 0 $0 1 $101,000 FILES CLOSED FOR INCOMPLETENESS 0 $0 0 $0 0 $0
Aggregated Statistics For Year 2005(Based on 3 full and 1 partial tracts) A) Conventional B) Refinancings C) Non-occupant Loans on Number Average Value Number Average Value Number Average Value
LOANS ORIGINATED 31 $75,683 10 $67,395 16 $52,939 APPLICATIONS APPROVED, NOT ACCEPTED 2 $58,640 0 $0 1 $33,000 APPLICATIONS DENIED 0 $0 0 $0 0 $0 APPLICATIONS WITHDRAWN 1 $108,990 1 $41,000 1 $41,000 FILES CLOSED FOR INCOMPLETENESS 0 $0 0 $0 0 $0
Aggregated Statistics For Year 2004(Based on 3 full and 1 partial tracts) A) Conventional B) Refinancings C) Non-occupant Loans on Number Average Value Number Average Value Number Average Value
LOANS ORIGINATED 30 $61,813 14 $56,081 17 $45,909 APPLICATIONS APPROVED, NOT ACCEPTED 3 $126,827 1 $55,040 4 $40,880 APPLICATIONS DENIED 0 $0 0 $0 0 $0 APPLICATIONS WITHDRAWN 1 $57,830 0 $0 1 $57,830 FILES CLOSED FOR INCOMPLETENESS 0 $0 0 $0 0 $0
Aggregated Statistics For Year 2003(Based on 3 full and 1 partial tracts) A) Conventional B) Refinancings C) Non-occupant Loans on Number Average Value Number Average Value Number Average Value
LOANS ORIGINATED 17 $50,354 23 $65,709 10 $42,140 APPLICATIONS APPROVED, NOT ACCEPTED 5 $40,876 5 $63,580 4 $27,750 APPLICATIONS DENIED 0 $0 1 $76,290 0 $0 APPLICATIONS WITHDRAWN 0 $0 0 $0 0 $0 FILES CLOSED FOR INCOMPLETENESS 0 $0 1 $56,000 0 $0
Aggregated Statistics For Year 2002(Based on 3 full and 1 partial tracts) A) Conventional B) Refinancings C) Non-occupant Loans on Number Average Value Number Average Value Number Average Value
LOANS ORIGINATED 21 $56,742 19 $63,474 15 $41,156 APPLICATIONS APPROVED, NOT ACCEPTED 3 $65,550 6 $67,135 1 $50,000 APPLICATIONS DENIED 0 $0 0 $0 0 $0 APPLICATIONS WITHDRAWN 4 $47,065 1 $54,000 2 $28,500 FILES CLOSED FOR INCOMPLETENESS 0 $0 0 $0 0 $0
Aggregated Statistics For Year 2001(Based on 3 full and 1 partial tracts) A) Conventional B) Refinancings C) Non-occupant Loans on Number Average Value Number Average Value Number Average Value
LOANS ORIGINATED 18 $38,286 17 $62,572 13 $32,895 APPLICATIONS APPROVED, NOT ACCEPTED 2 $33,885 0 $0 1 $43,000 APPLICATIONS DENIED 0 $0 2 $48,795 0 $0 APPLICATIONS WITHDRAWN 0 $0 0 $0 0 $0 FILES CLOSED FOR INCOMPLETENESS 0 $0 0 $0 0 $0
Aggregated Statistics For Year 2000(Based on 3 full and 1 partial tracts) A) Conventional B) Refinancings Number Average Value Number Average Value
LOANS ORIGINATED 11 $69,572 2 $56,075 APPLICATIONS APPROVED, NOT ACCEPTED 1 $54,490 2 $53,735 APPLICATIONS DENIED 0 $0 0 $0 APPLICATIONS WITHDRAWN 1 $44,590 0 $0 FILES CLOSED FOR INCOMPLETENESS 0 $0 0 $0
Aggregated Statistics For Year 1999(Based on 3 full and 1 partial tracts) A) Conventional B) Refinancings C) Non-occupant Loans on Number Average Value Number Average Value Number Average Value
LOANS ORIGINATED 8 $53,631 4 $51,372 1 $52,280 APPLICATIONS APPROVED, NOT ACCEPTED 1 $63,900 0 $0 0 $0 APPLICATIONS DENIED 1 $73,980 0 $0 0 $0 APPLICATIONS WITHDRAWN 0 $0 0 $0 0 $0 FILES CLOSED FOR INCOMPLETENESS 0 $0 0 $0 0 $0
Detailed PMIC statistics for the following Tracts:
0050.00
, 0051.00 , 0052.00 , 0053.00 Chickasaw compared to Alabama state average:
Median household income below state average. Median house value below state average. Unemployed percentage below state average. Black race population percentage above state average. Hispanic race population percentage below state average. Median age below state average. Length of stay since moving in above state average. House age above state average. Percentage of population with a bachelor's degree or higher below state average.
#80 on the list of "Top 101 cities with the largest percentage of divorced people (15+ years)(population 5,000+)"
#18 (36610) on the list of "Top 101 zip codes with the smallest percentage of taxpayers reporting taxable interest in 2012 (pop 5,000+)"
#25 (36610) on the list of "Top 101 zip codes with the lowest 2012 average Adjusted Gross Income (AGI) for individuals (pop 5,000+)"
#31 (36610) on the list of "Top 101 zip codes with the largest percentage of Scotch-Irish first ancestries (pop 5,000+)"
#39 (36610) on the list of "Top 101 zip codes with the lowest average reported salary/wage in 2012 (pop 5,000+)"
#6 on the list of "Top 101 counties with the lowest percentage of residents that visited a dentist within the past year"
#15 on the list of "Top 101 counties with the most Black Protestant congregations"
#20 on the list of "Top 101 counties with the lowest percentage of residents that exercised in the past month"
#26 on the list of "Top 101 counties with the highest number of infant deaths per 1000 residents 2007-2013 (pop. 50,000+)"
#27 on the list of "Top 101 counties with the most Black Protestant adherents"
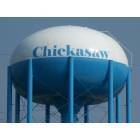
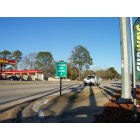
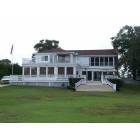
![Chickasaw: flowers. :]](https://pics2.city-data.com/picthumbc/thumbc63589.jpg)
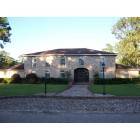
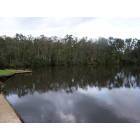
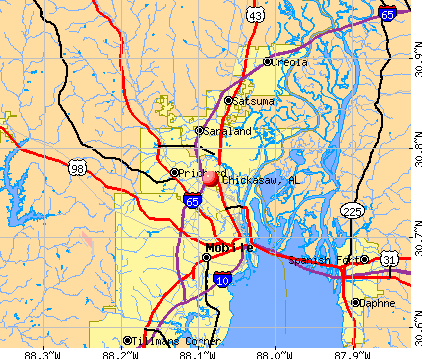


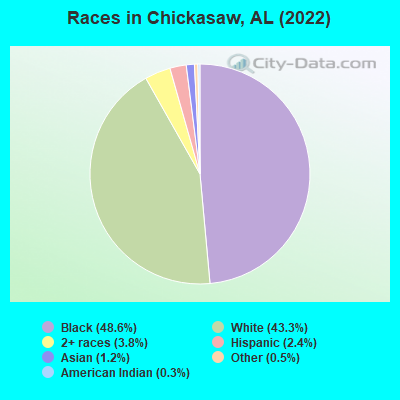
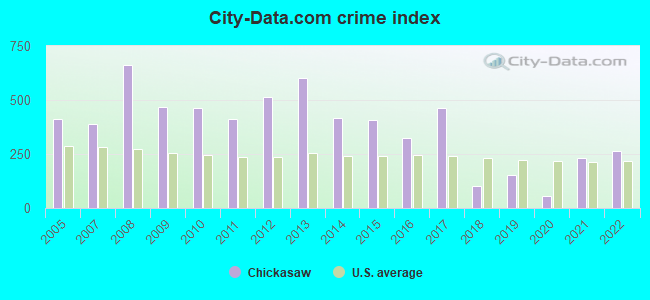
 Recent articles from our blog. Our writers, many of them Ph.D. graduates or candidates, create easy-to-read articles on a wide variety of topics.

 (6.0 miles