Celina, Ohio Submit your own pictures of this city and show them to the world
OSM Map
General Map
Google Map
MSN Map
OSM Map
General Map
Google Map
MSN Map
OSM Map
General Map
Google Map
MSN Map
OSM Map
General Map
Google Map
MSN Map
Please wait while loading the map...
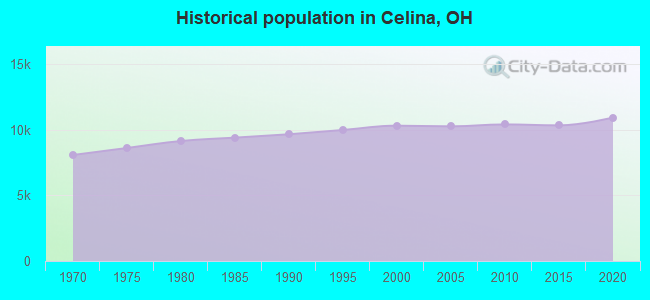
Population in 2022: 10,881 (99% urban, 1% rural). Population change since 2000: +5.6%Males: 5,274 Females: 5,607
March 2022 cost of living index in Celina: 77.2 (low, U.S. average is 100) Percentage of residents living in poverty in 2022: 10.8%for White Non-Hispanic residents , 38.5% for Black residents , 15.1% for Hispanic or Latino residents , 15.5% for Native Hawaiian and other Pacific Islander residents , 25.4% for two or more races residents )
Profiles of local businesses
Business Search - 14 Million verified businesses
Data:
Median household income ($)
Median household income (% change since 2000)
Household income diversity
Ratio of average income to average house value (%)
Ratio of average income to average rent
Median household income ($) - White
Median household income ($) - Black or African American
Median household income ($) - Asian
Median household income ($) - Hispanic or Latino
Median household income ($) - American Indian and Alaska Native
Median household income ($) - Multirace
Median household income ($) - Other Race
Median household income for houses/condos with a mortgage ($)
Median household income for apartments without a mortgage ($)
Races - White alone (%)
Races - White alone (% change since 2000)
Races - Black alone (%)
Races - Black alone (% change since 2000)
Races - American Indian alone (%)
Races - American Indian alone (% change since 2000)
Races - Asian alone (%)
Races - Asian alone (% change since 2000)
Races - Hispanic (%)
Races - Hispanic (% change since 2000)
Races - Native Hawaiian and Other Pacific Islander alone (%)
Races - Native Hawaiian and Other Pacific Islander alone (% change since 2000)
Races - Two or more races (%)
Races - Two or more races (% change since 2000)
Races - Other race alone (%)
Races - Other race alone (% change since 2000)
Racial diversity
Unemployment (%)
Unemployment (% change since 2000)
Unemployment (%) - White
Unemployment (%) - Black or African American
Unemployment (%) - Asian
Unemployment (%) - Hispanic or Latino
Unemployment (%) - American Indian and Alaska Native
Unemployment (%) - Multirace
Unemployment (%) - Other Race
Population density (people per square mile)
Population - Males (%)
Population - Females (%)
Population - Males (%) - White
Population - Males (%) - Black or African American
Population - Males (%) - Asian
Population - Males (%) - Hispanic or Latino
Population - Males (%) - American Indian and Alaska Native
Population - Males (%) - Multirace
Population - Males (%) - Other Race
Population - Females (%) - White
Population - Females (%) - Black or African American
Population - Females (%) - Asian
Population - Females (%) - Hispanic or Latino
Population - Females (%) - American Indian and Alaska Native
Population - Females (%) - Multirace
Population - Females (%) - Other Race
Coronavirus confirmed cases (May 16, 2024)
Deaths caused by coronavirus (May 16, 2024)
Coronavirus confirmed cases (per 100k population) (May 16, 2024)
Deaths caused by coronavirus (per 100k population) (May 16, 2024)
Daily increase in number of cases (May 16, 2024)
Weekly increase in number of cases (May 16, 2024)
Cases doubled (in days) (May 16, 2024)
Hospitalized patients (Apr 18, 2022)
Negative test results (Apr 18, 2022)
Total test results (Apr 18, 2022)
COVID Vaccine doses distributed (per 100k population) (Sep 19, 2023)
COVID Vaccine doses administered (per 100k population) (Sep 19, 2023)
COVID Vaccine doses distributed (Sep 19, 2023)
COVID Vaccine doses administered (Sep 19, 2023)
Likely homosexual households (%)
Likely homosexual households (% change since 2000)
Likely homosexual households - Lesbian couples (%)
Likely homosexual households - Lesbian couples (% change since 2000)
Likely homosexual households - Gay men (%)
Likely homosexual households - Gay men (% change since 2000)
Cost of living index
Median gross rent ($)
Median contract rent ($)
Median monthly housing costs ($)
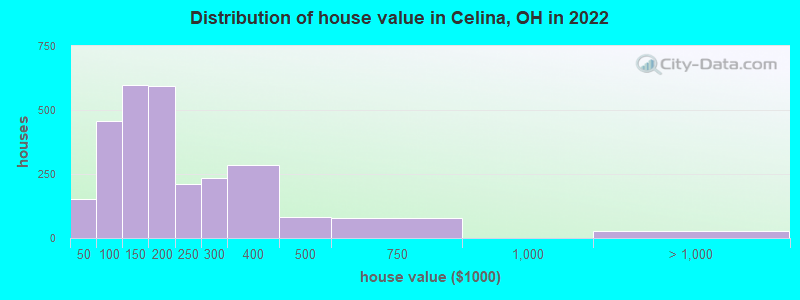
Median house or condo value ($)
Median house or condo value ($ change since 2000)
Mean house or condo value by units in structure - 1, detached ($)
Mean house or condo value by units in structure - 1, attached ($)
Mean house or condo value by units in structure - 2 ($)
Mean house or condo value by units in structure by units in structure - 3 or 4 ($)
Mean house or condo value by units in structure - 5 or more ($)
Mean house or condo value by units in structure - Boat, RV, van, etc. ($)
Mean house or condo value by units in structure - Mobile home ($)
Median house or condo value ($) - White
Median house or condo value ($) - Black or African American
Median house or condo value ($) - Asian
Median house or condo value ($) - Hispanic or Latino
Median house or condo value ($) - American Indian and Alaska Native
Median house or condo value ($) - Multirace
Median house or condo value ($) - Other Race
Median resident age
Resident age diversity
Median resident age - Males
Median resident age - Females
Median resident age - White
Median resident age - Black or African American
Median resident age - Asian
Median resident age - Hispanic or Latino
Median resident age - American Indian and Alaska Native
Median resident age - Multirace
Median resident age - Other Race
Median resident age - Males - White
Median resident age - Males - Black or African American
Median resident age - Males - Asian
Median resident age - Males - Hispanic or Latino
Median resident age - Males - American Indian and Alaska Native
Median resident age - Males - Multirace
Median resident age - Males - Other Race
Median resident age - Females - White
Median resident age - Females - Black or African American
Median resident age - Females - Asian
Median resident age - Females - Hispanic or Latino
Median resident age - Females - American Indian and Alaska Native
Median resident age - Females - Multirace
Median resident age - Females - Other Race
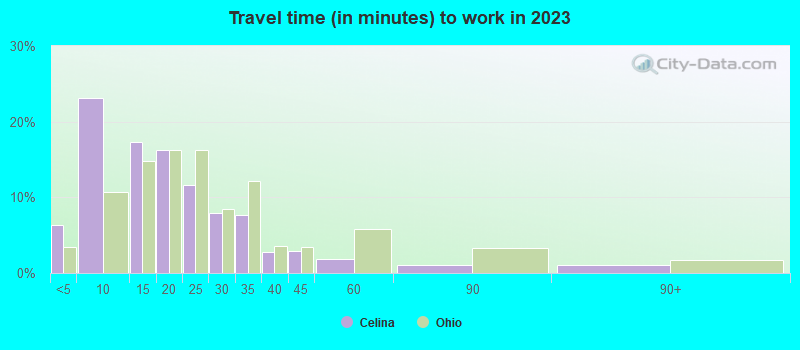
Commute - mean travel time to work (minutes)
Travel time to work - Less than 5 minutes (%)
Travel time to work - Less than 5 minutes (% change since 2000)
Travel time to work - 5 to 9 minutes (%)
Travel time to work - 5 to 9 minutes (% change since 2000)
Travel time to work - 10 to 19 minutes (%)
Travel time to work - 10 to 19 minutes (% change since 2000)
Travel time to work - 20 to 29 minutes (%)
Travel time to work - 20 to 29 minutes (% change since 2000)
Travel time to work - 30 to 39 minutes (%)
Travel time to work - 30 to 39 minutes (% change since 2000)
Travel time to work - 40 to 59 minutes (%)
Travel time to work - 40 to 59 minutes (% change since 2000)
Travel time to work - 60 to 89 minutes (%)
Travel time to work - 60 to 89 minutes (% change since 2000)
Travel time to work - 90 or more minutes (%)
Travel time to work - 90 or more minutes (% change since 2000)
Marital status - Never married (%)
Marital status - Now married (%)
Marital status - Separated (%)
Marital status - Widowed (%)
Marital status - Divorced (%)
Median family income ($)
Median family income (% change since 2000)
Median non-family income ($)
Median non-family income (% change since 2000)
Median per capita income ($)
Median per capita income (% change since 2000)
Median family income ($) - White
Median family income ($) - Black or African American
Median family income ($) - Asian
Median family income ($) - Hispanic or Latino
Median family income ($) - American Indian and Alaska Native
Median family income ($) - Multirace
Median family income ($) - Other Race
Median year house/condo built
Median year apartment built
Year house built - Built 2005 or later (%)
Year house built - Built 2000 to 2004 (%)
Year house built - Built 1990 to 1999 (%)
Year house built - Built 1980 to 1989 (%)
Year house built - Built 1970 to 1979 (%)
Year house built - Built 1960 to 1969 (%)
Year house built - Built 1950 to 1959 (%)
Year house built - Built 1940 to 1949 (%)
Year house built - Built 1939 or earlier (%)
Average household size
Household density (households per square mile)
Average household size - White
Average household size - Black or African American
Average household size - Asian
Average household size - Hispanic or Latino
Average household size - American Indian and Alaska Native
Average household size - Multirace
Average household size - Other Race
Occupied housing units (%)
Vacant housing units (%)
Owner occupied housing units (%)
Renter occupied housing units (%)
Vacancy status - For rent (%)
Vacancy status - For sale only (%)
Vacancy status - Rented or sold, not occupied (%)
Vacancy status - For seasonal, recreational, or occasional use (%)
Vacancy status - For migrant workers (%)
Vacancy status - Other vacant (%)
Residents with income below the poverty level (%)
Residents with income below 50% of the poverty level (%)
Children below poverty level (%)
Poor families by family type - Married-couple family (%)
Poor families by family type - Male, no wife present (%)
Poor families by family type - Female, no husband present (%)
Poverty status for native-born residents (%)
Poverty status for foreign-born residents (%)
Poverty among high school graduates not in families (%)
Poverty among people who did not graduate high school not in families (%)
Residents with income below the poverty level (%) - White
Residents with income below the poverty level (%) - Black or African American
Residents with income below the poverty level (%) - Asian
Residents with income below the poverty level (%) - Hispanic or Latino
Residents with income below the poverty level (%) - American Indian and Alaska Native
Residents with income below the poverty level (%) - Multirace
Residents with income below the poverty level (%) - Other Race
Air pollution - Air Quality Index (AQI)
Air pollution - CO
Air pollution - NO2
Air pollution - SO2
Air pollution - Ozone
Air pollution - PM10
Air pollution - PM25
Air pollution - Pb
Crime - Murders per 100,000 population
Crime - Rapes per 100,000 population
Crime - Robberies per 100,000 population
Crime - Assaults per 100,000 population
Crime - Burglaries per 100,000 population
Crime - Thefts per 100,000 population
Crime - Auto thefts per 100,000 population
Crime - Arson per 100,000 population
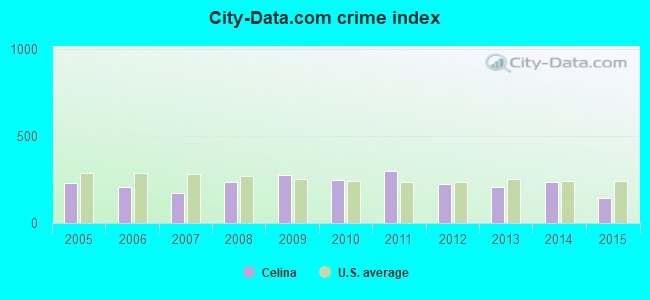
Crime - City-data.com crime index
Crime - Violent crime index
Crime - Property crime index
Crime - Murders per 100,000 population (5 year average)
Crime - Rapes per 100,000 population (5 year average)
Crime - Robberies per 100,000 population (5 year average)
Crime - Assaults per 100,000 population (5 year average)
Crime - Burglaries per 100,000 population (5 year average)
Crime - Thefts per 100,000 population (5 year average)
Crime - Auto thefts per 100,000 population (5 year average)
Crime - Arson per 100,000 population (5 year average)
Crime - City-data.com crime index (5 year average)
Crime - Violent crime index (5 year average)
Crime - Property crime index (5 year average)
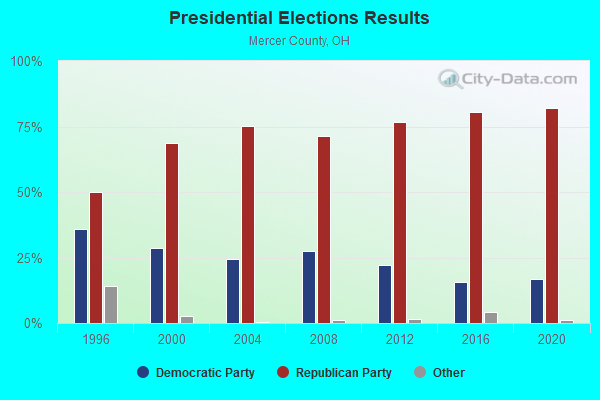
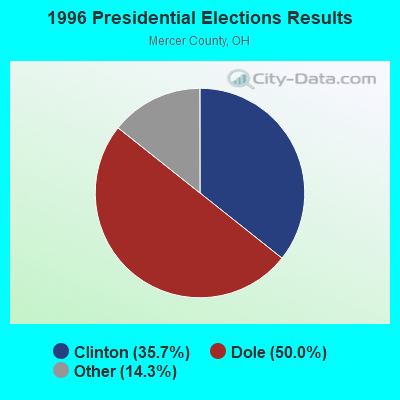
1996 Presidential Elections Results (%) - Democratic Party (Clinton)
1996 Presidential Elections Results (%) - Republican Party (Dole)
1996 Presidential Elections Results (%) - Other
2000 Presidential Elections Results (%) - Democratic Party (Gore)
2000 Presidential Elections Results (%) - Republican Party (Bush)
2000 Presidential Elections Results (%) - Other
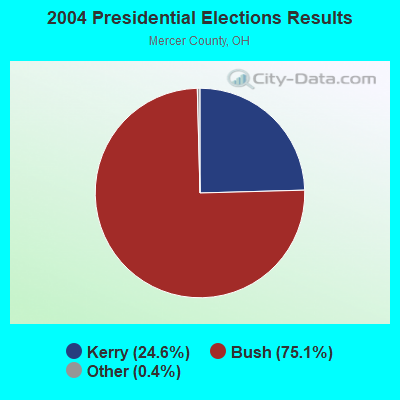
2004 Presidential Elections Results (%) - Democratic Party (Kerry)
2004 Presidential Elections Results (%) - Republican Party (Bush)
2004 Presidential Elections Results (%) - Other
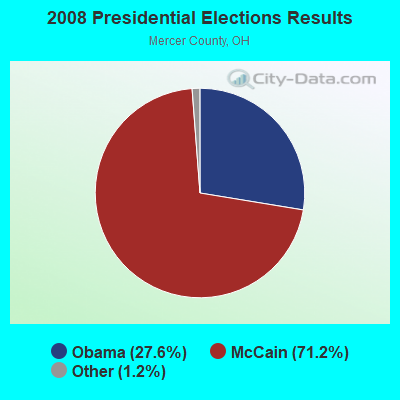
2008 Presidential Elections Results (%) - Democratic Party (Obama)
2008 Presidential Elections Results (%) - Republican Party (McCain)
2008 Presidential Elections Results (%) - Other
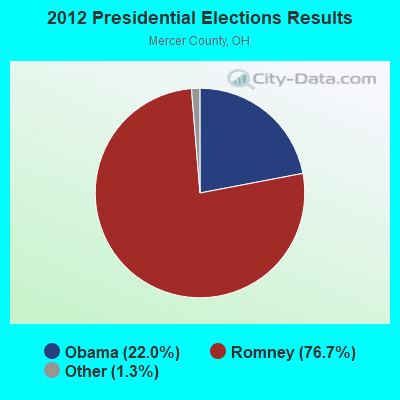
2012 Presidential Elections Results (%) - Democratic Party (Obama)
2012 Presidential Elections Results (%) - Republican Party (Romney)
2012 Presidential Elections Results (%) - Other
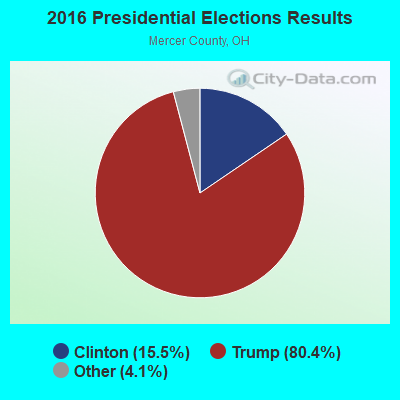
2016 Presidential Elections Results (%) - Democratic Party (Clinton)
2016 Presidential Elections Results (%) - Republican Party (Trump)
2016 Presidential Elections Results (%) - Other
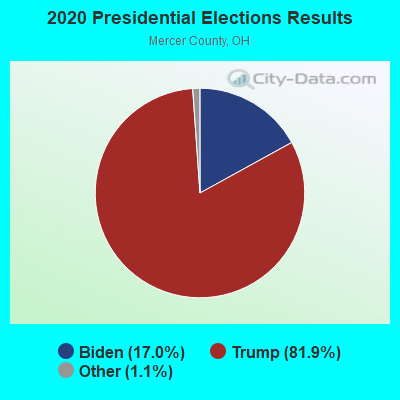
2020 Presidential Elections Results (%) - Democratic Party (Biden)
2020 Presidential Elections Results (%) - Republican Party (Trump)
2020 Presidential Elections Results (%) - Other
Ancestries Reported - Arab (%)
Ancestries Reported - Czech (%)
Ancestries Reported - Danish (%)
Ancestries Reported - Dutch (%)
Ancestries Reported - English (%)
Ancestries Reported - French (%)
Ancestries Reported - French Canadian (%)
Ancestries Reported - German (%)
Ancestries Reported - Greek (%)
Ancestries Reported - Hungarian (%)
Ancestries Reported - Irish (%)
Ancestries Reported - Italian (%)
Ancestries Reported - Lithuanian (%)
Ancestries Reported - Norwegian (%)
Ancestries Reported - Polish (%)
Ancestries Reported - Portuguese (%)
Ancestries Reported - Russian (%)
Ancestries Reported - Scotch-Irish (%)
Ancestries Reported - Scottish (%)
Ancestries Reported - Slovak (%)
Ancestries Reported - Subsaharan African (%)
Ancestries Reported - Swedish (%)
Ancestries Reported - Swiss (%)
Ancestries Reported - Ukrainian (%)
Ancestries Reported - United States (%)
Ancestries Reported - Welsh (%)
Ancestries Reported - West Indian (%)
Ancestries Reported - Other (%)
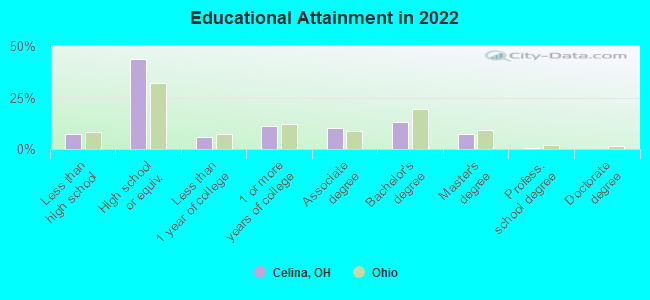
Educational Attainment - No schooling completed (%)
Educational Attainment - Less than high school (%)
Educational Attainment - High school or equivalent (%)
Educational Attainment - Less than 1 year of college (%)
Educational Attainment - 1 or more years of college (%)
Educational Attainment - Associate degree (%)
Educational Attainment - Bachelor's degree (%)
Educational Attainment - Master's degree (%)
Educational Attainment - Professional school degree (%)
Educational Attainment - Doctorate degree (%)
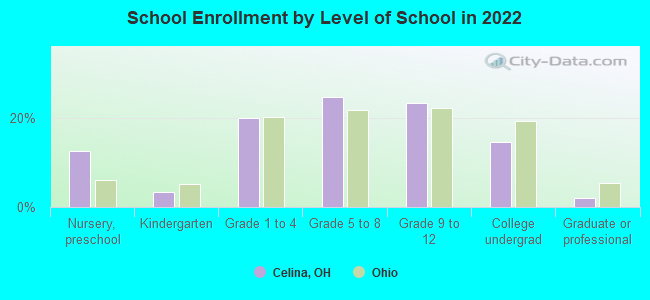
School Enrollment - Nursery, preschool (%)
School Enrollment - Kindergarten (%)
School Enrollment - Grade 1 to 4 (%)
School Enrollment - Grade 5 to 8 (%)
School Enrollment - Grade 9 to 12 (%)
School Enrollment - College undergrad (%)
School Enrollment - Graduate or professional (%)
School Enrollment - Not enrolled in school (%)
School enrollment - Public schools (%)
School enrollment - Private schools (%)
School enrollment - Not enrolled (%)
Median number of rooms in houses and condos
Median number of rooms in apartments
Housing units lacking complete plumbing facilities (%)
Housing units lacking complete kitchen facilities (%)
Density of houses
Urban houses (%)
Rural houses (%)
Households with people 60 years and over (%)
Households with people 65 years and over (%)
Households with people 75 years and over (%)
Households with one or more nonrelatives (%)
Households with no nonrelatives (%)
Population in households (%)
Family households (%)
Nonfamily households (%)
Population in families (%)
Family households with own children (%)
Median number of bedrooms in owner occupied houses
Mean number of bedrooms in owner occupied houses
Median number of bedrooms in renter occupied houses
Mean number of bedrooms in renter occupied houses
Median number of vehichles in owner occupied houses
Mean number of vehichles in owner occupied houses
Median number of vehichles in renter occupied houses
Mean number of vehichles in renter occupied houses
Mortgage status - with mortgage (%)
Mortgage status - with second mortgage (%)
Mortgage status - with home equity loan (%)
Mortgage status - with both second mortgage and home equity loan (%)
Mortgage status - without a mortgage (%)
Average family size
Average family size - White
Average family size - Black or African American
Average family size - Asian
Average family size - Hispanic or Latino
Average family size - American Indian and Alaska Native
Average family size - Multirace
Average family size - Other Race
Geographical mobility - Same house 1 year ago (%)
Geographical mobility - Moved within same county (%)
Geographical mobility - Moved from different county within same state (%)
Geographical mobility - Moved from different state (%)
Geographical mobility - Moved from abroad (%)
Place of birth - Born in state of residence (%)
Place of birth - Born in other state (%)
Place of birth - Native, outside of US (%)
Place of birth - Foreign born (%)
Housing units in structures - 1, detached (%)
Housing units in structures - 1, attached (%)
Housing units in structures - 2 (%)
Housing units in structures - 3 or 4 (%)
Housing units in structures - 5 to 9 (%)
Housing units in structures - 10 to 19 (%)
Housing units in structures - 20 to 49 (%)
Housing units in structures - 50 or more (%)
Housing units in structures - Mobile home (%)
Housing units in structures - Boat, RV, van, etc. (%)
House/condo owner moved in on average (years ago)
Renter moved in on average (years ago)
Year householder moved into unit - Moved in 1999 to March 2000 (%)
Year householder moved into unit - Moved in 1995 to 1998 (%)
Year householder moved into unit - Moved in 1990 to 1994 (%)
Year householder moved into unit - Moved in 1980 to 1989 (%)
Year householder moved into unit - Moved in 1970 to 1979 (%)
Year householder moved into unit - Moved in 1969 or earlier (%)
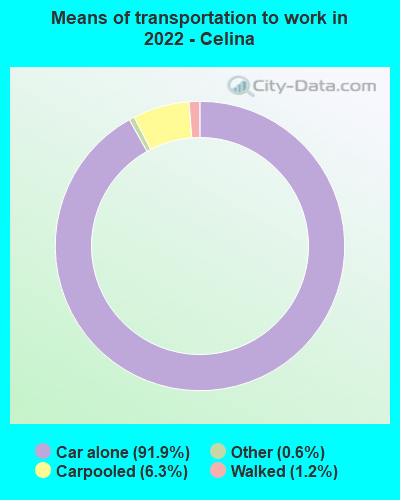
Means of transportation to work - Drove car alone (%)
Means of transportation to work - Carpooled (%)
Means of transportation to work - Public transportation (%)
Means of transportation to work - Bus or trolley bus (%)
Means of transportation to work - Streetcar or trolley car (%)
Means of transportation to work - Subway or elevated (%)
Means of transportation to work - Railroad (%)
Means of transportation to work - Ferryboat (%)
Means of transportation to work - Taxicab (%)
Means of transportation to work - Motorcycle (%)
Means of transportation to work - Bicycle (%)
Means of transportation to work - Walked (%)
Means of transportation to work - Other means (%)
Working at home (%)
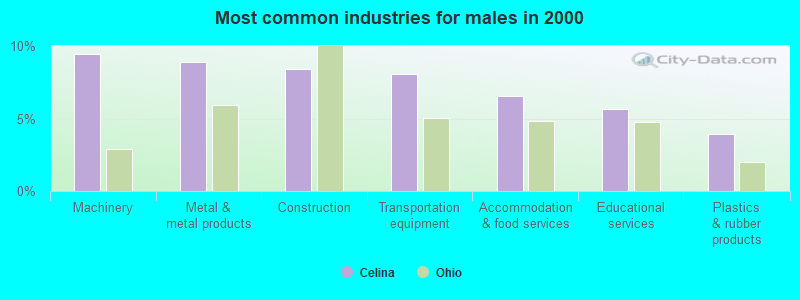
Industry diversity
Most Common Industries - Agriculture, forestry, fishing and hunting, and mining (%)
Most Common Industries - Agriculture, forestry, fishing and hunting (%)
Most Common Industries - Mining, quarrying, and oil and gas extraction (%)
Most Common Industries - Construction (%)
Most Common Industries - Manufacturing (%)
Most Common Industries - Wholesale trade (%)
Most Common Industries - Retail trade (%)
Most Common Industries - Transportation and warehousing, and utilities (%)
Most Common Industries - Transportation and warehousing (%)
Most Common Industries - Utilities (%)
Most Common Industries - Information (%)
Most Common Industries - Finance and insurance, and real estate and rental and leasing (%)
Most Common Industries - Finance and insurance (%)
Most Common Industries - Real estate and rental and leasing (%)
Most Common Industries - Professional, scientific, and management, and administrative and waste management services (%)
Most Common Industries - Professional, scientific, and technical services (%)
Most Common Industries - Management of companies and enterprises (%)
Most Common Industries - Administrative and support and waste management services (%)
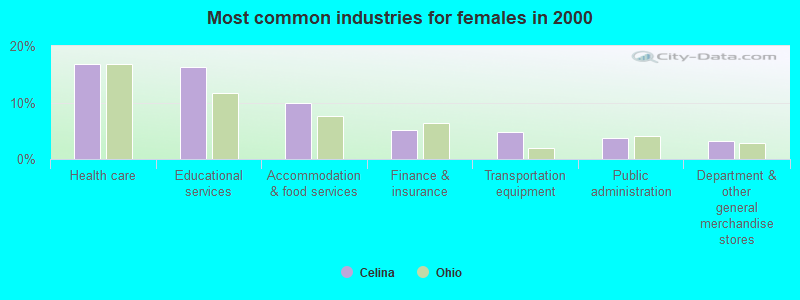
Most Common Industries - Educational services, and health care and social assistance (%)
Most Common Industries - Educational services (%)
Most Common Industries - Health care and social assistance (%)
Most Common Industries - Arts, entertainment, and recreation, and accommodation and food services (%)
Most Common Industries - Arts, entertainment, and recreation (%)
Most Common Industries - Accommodation and food services (%)
Most Common Industries - Other services, except public administration (%)
Most Common Industries - Public administration (%)
Occupation diversity
Most Common Occupations - Management, business, science, and arts occupations (%)
Most Common Occupations - Management, business, and financial occupations (%)
Most Common Occupations - Management occupations (%)
Most Common Occupations - Business and financial operations occupations (%)
Most Common Occupations - Computer, engineering, and science occupations (%)
Most Common Occupations - Computer and mathematical occupations (%)
Most Common Occupations - Architecture and engineering occupations (%)
Most Common Occupations - Life, physical, and social science occupations (%)
Most Common Occupations - Education, legal, community service, arts, and media occupations (%)
Most Common Occupations - Community and social service occupations (%)
Most Common Occupations - Legal occupations (%)
Most Common Occupations - Education, training, and library occupations (%)
Most Common Occupations - Arts, design, entertainment, sports, and media occupations (%)
Most Common Occupations - Healthcare practitioners and technical occupations (%)
Most Common Occupations - Health diagnosing and treating practitioners and other technical occupations (%)
Most Common Occupations - Health technologists and technicians (%)
Most Common Occupations - Service occupations (%)
Most Common Occupations - Healthcare support occupations (%)
Most Common Occupations - Protective service occupations (%)
Most Common Occupations - Fire fighting and prevention, and other protective service workers including supervisors (%)
Most Common Occupations - Law enforcement workers including supervisors (%)
Most Common Occupations - Food preparation and serving related occupations (%)
Most Common Occupations - Building and grounds cleaning and maintenance occupations (%)
Most Common Occupations - Personal care and service occupations (%)
Most Common Occupations - Sales and office occupations (%)
Most Common Occupations - Sales and related occupations (%)
Most Common Occupations - Office and administrative support occupations (%)
Most Common Occupations - Natural resources, construction, and maintenance occupations (%)
Most Common Occupations - Farming, fishing, and forestry occupations (%)
Most Common Occupations - Construction and extraction occupations (%)
Most Common Occupations - Installation, maintenance, and repair occupations (%)
Most Common Occupations - Production, transportation, and material moving occupations (%)
Most Common Occupations - Production occupations (%)
Most Common Occupations - Transportation occupations (%)
Most Common Occupations - Material moving occupations (%)
People in Group quarters - Institutionalized population (%)
People in Group quarters - Correctional institutions (%)
People in Group quarters - Federal prisons and detention centers (%)
People in Group quarters - Halfway houses (%)
People in Group quarters - Local jails and other confinement facilities (including police lockups) (%)
People in Group quarters - Military disciplinary barracks (%)
People in Group quarters - State prisons (%)
People in Group quarters - Other types of correctional institutions (%)
People in Group quarters - Nursing homes (%)
People in Group quarters - Hospitals/wards, hospices, and schools for the handicapped (%)
People in Group quarters - Hospitals/wards and hospices for chronically ill (%)
People in Group quarters - Hospices or homes for chronically ill (%)
People in Group quarters - Military hospitals or wards for chronically ill (%)
People in Group quarters - Other hospitals or wards for chronically ill (%)
People in Group quarters - Hospitals or wards for drug/alcohol abuse (%)
People in Group quarters - Mental (Psychiatric) hospitals or wards (%)
People in Group quarters - Schools, hospitals, or wards for the mentally retarded (%)
People in Group quarters - Schools, hospitals, or wards for the physically handicapped (%)
People in Group quarters - Institutions for the deaf (%)
People in Group quarters - Institutions for the blind (%)
People in Group quarters - Orthopedic wards and institutions for the physically handicapped (%)
People in Group quarters - Wards in general hospitals for patients who have no usual home elsewhere (%)
People in Group quarters - Wards in military hospitals for patients who have no usual home elsewhere (%)
People in Group quarters - Juvenile institutions (%)
People in Group quarters - Long-term care (%)
People in Group quarters - Homes for abused, dependent, and neglected children (%)
People in Group quarters - Residential treatment centers for emotionally disturbed children (%)
People in Group quarters - Training schools for juvenile delinquents (%)
People in Group quarters - Short-term care, detention or diagnostic centers for delinquent children (%)
People in Group quarters - Type of juvenile institution unknown (%)
People in Group quarters - Noninstitutionalized population (%)
People in Group quarters - College dormitories (includes college quarters off campus) (%)
People in Group quarters - Military quarters (%)
People in Group quarters - On base (%)
People in Group quarters - Barracks, unaccompanied personnel housing (UPH), (Enlisted/Officer), ;and similar group living quarters for military personnel (%)
People in Group quarters - Transient quarters for temporary residents (%)
People in Group quarters - Military ships (%)
People in Group quarters - Group homes (%)
People in Group quarters - Homes or halfway houses for drug/alcohol abuse (%)
People in Group quarters - Homes for the mentally ill (%)
People in Group quarters - Homes for the mentally retarded (%)
People in Group quarters - Homes for the physically handicapped (%)
People in Group quarters - Other group homes (%)
People in Group quarters - Religious group quarters (%)
People in Group quarters - Dormitories (%)
People in Group quarters - Agriculture workers' dormitories on farms (%)
People in Group quarters - Job Corps and vocational training facilities (%)
People in Group quarters - Other workers' dormitories (%)
People in Group quarters - Crews of maritime vessels (%)
People in Group quarters - Other nonhousehold living situations (%)
People in Group quarters - Other noninstitutional group quarters (%)
Residents speaking English at home (%)
Residents speaking English at home - Born in the United States (%)
Residents speaking English at home - Native, born elsewhere (%)
Residents speaking English at home - Foreign born (%)
Residents speaking Spanish at home (%)
Residents speaking Spanish at home - Born in the United States (%)
Residents speaking Spanish at home - Native, born elsewhere (%)
Residents speaking Spanish at home - Foreign born (%)
Residents speaking other language at home (%)
Residents speaking other language at home - Born in the United States (%)
Residents speaking other language at home - Native, born elsewhere (%)
Residents speaking other language at home - Foreign born (%)
Class of Workers - Employee of private company (%)
Class of Workers - Self-employed in own incorporated business (%)
Class of Workers - Private not-for-profit wage and salary workers (%)
Class of Workers - Local government workers (%)
Class of Workers - State government workers (%)
Class of Workers - Federal government workers (%)
Class of Workers - Self-employed workers in own not incorporated business and Unpaid family workers (%)
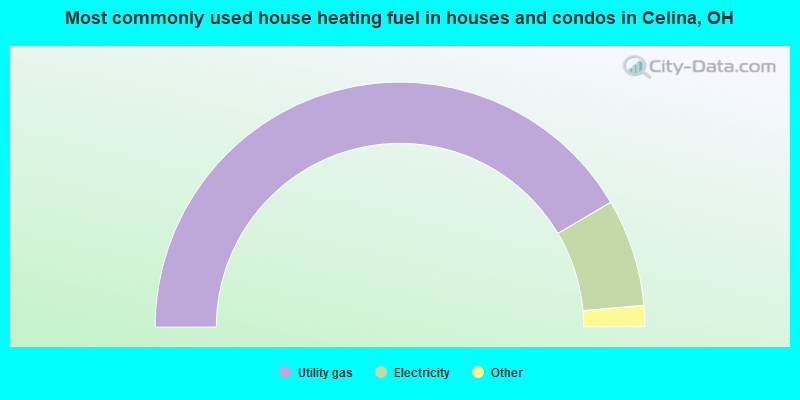
House heating fuel used in houses and condos - Utility gas (%)
House heating fuel used in houses and condos - Bottled, tank, or LP gas (%)
House heating fuel used in houses and condos - Electricity (%)
House heating fuel used in houses and condos - Fuel oil, kerosene, etc. (%)
House heating fuel used in houses and condos - Coal or coke (%)
House heating fuel used in houses and condos - Wood (%)
House heating fuel used in houses and condos - Solar energy (%)
House heating fuel used in houses and condos - Other fuel (%)
House heating fuel used in houses and condos - No fuel used (%)
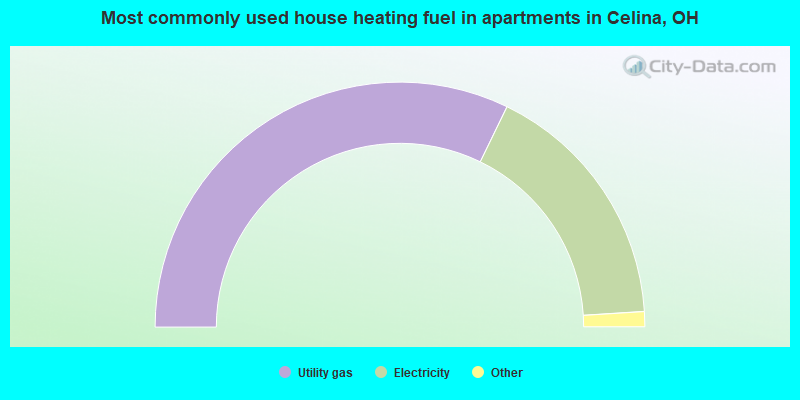
House heating fuel used in apartments - Utility gas (%)
House heating fuel used in apartments - Bottled, tank, or LP gas (%)
House heating fuel used in apartments - Electricity (%)
House heating fuel used in apartments - Fuel oil, kerosene, etc. (%)
House heating fuel used in apartments - Coal or coke (%)
House heating fuel used in apartments - Wood (%)
House heating fuel used in apartments - Solar energy (%)
House heating fuel used in apartments - Other fuel (%)
House heating fuel used in apartments - No fuel used (%)
Armed forces status - In Armed Forces (%)
Armed forces status - Civilian (%)
Armed forces status - Civilian - Veteran (%)
Armed forces status - Civilian - Nonveteran (%)
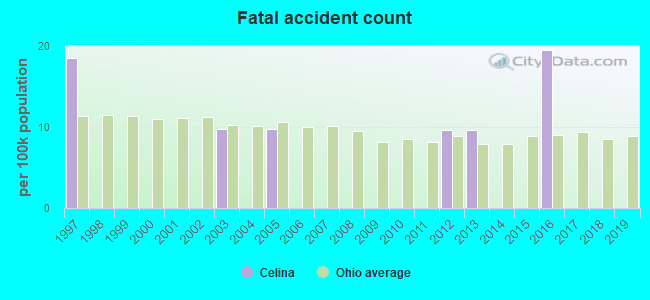
Fatal accidents locations in years 2005-2021
Fatal accidents locations in 2005
Fatal accidents locations in 2006
Fatal accidents locations in 2007
Fatal accidents locations in 2008
Fatal accidents locations in 2009
Fatal accidents locations in 2010
Fatal accidents locations in 2011
Fatal accidents locations in 2012
Fatal accidents locations in 2013
Fatal accidents locations in 2014
Fatal accidents locations in 2015
Fatal accidents locations in 2016
Fatal accidents locations in 2017
Fatal accidents locations in 2018
Fatal accidents locations in 2019
Fatal accidents locations in 2020
Fatal accidents locations in 2021
Alcohol use - People drinking some alcohol every month (%)
Alcohol use - People not drinking at all (%)
Alcohol use - Average days/month drinking alcohol
Alcohol use - Average drinks/week
Alcohol use - Average days/year people drink much
Audiometry - Average condition of hearing (%)
Audiometry - People that can hear a whisper from across a quiet room (%)
Audiometry - People that can hear normal voice from across a quiet room (%)
Audiometry - Ears ringing, roaring, buzzing (%)
Audiometry - Had a job exposure to loud noise (%)
Audiometry - Had off-work exposure to loud noise (%)
Blood Pressure & Cholesterol - Has high blood pressure (%)
Blood Pressure & Cholesterol - Checking blood pressure at home (%)
Blood Pressure & Cholesterol - Frequently checking blood cholesterol (%)
Blood Pressure & Cholesterol - Has high cholesterol level (%)
Consumer Behavior - Money monthly spent on food at supermarket/grocery store
Consumer Behavior - Money monthly spent on food at other stores
Consumer Behavior - Money monthly spent on eating out
Consumer Behavior - Money monthly spent on carryout/delivered foods
Consumer Behavior - Income spent on food at supermarket/grocery store (%)
Consumer Behavior - Income spent on food at other stores (%)
Consumer Behavior - Income spent on eating out (%)
Consumer Behavior - Income spent on carryout/delivered foods (%)
Current Health Status - General health condition (%)
Current Health Status - Blood donors (%)
Current Health Status - Has blood ever tested for HIV virus (%)
Current Health Status - Left-handed people (%)
Dermatology - People using sunscreen (%)
Diabetes - Diabetics (%)
Diabetes - Had a blood test for high blood sugar (%)
Diabetes - People taking insulin (%)
Diet Behavior & Nutrition - Diet health (%)
Diet Behavior & Nutrition - Milk product consumption (# of products/month)
Diet Behavior & Nutrition - Meals not home prepared (#/week)
Diet Behavior & Nutrition - Meals from fast food or pizza place (#/week)
Diet Behavior & Nutrition - Ready-to-eat foods (#/month)
Diet Behavior & Nutrition - Frozen meals/pizza (#/month)
Drug Use - People that ever used marijuana or hashish (%)
Drug Use - Ever used hard drugs (%)
Drug Use - Ever used any form of cocaine (%)
Drug Use - Ever used heroin (%)
Drug Use - Ever used methamphetamine (%)
Health Insurance - People covered by health insurance (%)
Kidney Conditions-Urology - Avg. # of times urinating at night
Medical Conditions - People with asthma (%)
Medical Conditions - People with anemia (%)
Medical Conditions - People with psoriasis (%)
Medical Conditions - People with overweight (%)
Medical Conditions - Elderly people having difficulties in thinking or remembering (%)
Medical Conditions - People who ever received blood transfusion (%)
Medical Conditions - People having trouble seeing even with glass/contacts (%)
Medical Conditions - People with arthritis (%)
Medical Conditions - People with gout (%)
Medical Conditions - People with congestive heart failure (%)
Medical Conditions - People with coronary heart disease (%)
Medical Conditions - People with angina pectoris (%)
Medical Conditions - People who ever had heart attack (%)
Medical Conditions - People who ever had stroke (%)
Medical Conditions - People with emphysema (%)
Medical Conditions - People with thyroid problem (%)
Medical Conditions - People with chronic bronchitis (%)
Medical Conditions - People with any liver condition (%)
Medical Conditions - People who ever had cancer or malignancy (%)
Mental Health - People who have little interest in doing things (%)
Mental Health - People feeling down, depressed, or hopeless (%)
Mental Health - People who have trouble sleeping or sleeping too much (%)
Mental Health - People feeling tired or having little energy (%)
Mental Health - People with poor appetite or overeating (%)
Mental Health - People feeling bad about themself (%)
Mental Health - People who have trouble concentrating on things (%)
Mental Health - People moving or speaking slowly or too fast (%)
Mental Health - People having thoughts they would be better off dead (%)
Oral Health - Average years since last visit a dentist
Oral Health - People embarrassed because of mouth (%)
Oral Health - People with gum disease (%)
Oral Health - General health of teeth and gums (%)
Oral Health - Average days a week using dental floss/device
Oral Health - Average days a week using mouthwash for dental problem
Oral Health - Average number of teeth
Pesticide Use - Households using pesticides to control insects (%)
Pesticide Use - Households using pesticides to kill weeds (%)
Physical Activity - People doing vigorous-intensity work activities (%)
Physical Activity - People doing moderate-intensity work activities (%)
Physical Activity - People walking or bicycling (%)
Physical Activity - People doing vigorous-intensity recreational activities (%)
Physical Activity - People doing moderate-intensity recreational activities (%)
Physical Activity - Average hours a day doing sedentary activities
Physical Activity - Average hours a day watching TV or videos
Physical Activity - Average hours a day using computer
Physical Functioning - People having limitations keeping them from working (%)
Physical Functioning - People limited in amount of work they can do (%)
Physical Functioning - People that need special equipment to walk (%)
Physical Functioning - People experiencing confusion/memory problems (%)
Physical Functioning - People requiring special healthcare equipment (%)
Prescription Medications - Average number of prescription medicines taking
Preventive Aspirin Use - Adults 40+ taking low-dose aspirin (%)
Reproductive Health - Vaginal deliveries (%)
Reproductive Health - Cesarean deliveries (%)
Reproductive Health - Deliveries resulted in a live birth (%)
Reproductive Health - Pregnancies resulted in a delivery (%)
Reproductive Health - Women breastfeeding newborns (%)
Reproductive Health - Women that had a hysterectomy (%)
Reproductive Health - Women that had both ovaries removed (%)
Reproductive Health - Women that have ever taken birth control pills (%)
Reproductive Health - Women taking birth control pills (%)
Reproductive Health - Women that have ever used Depo-Provera or injectables (%)
Reproductive Health - Women that have ever used female hormones (%)
Sexual Behavior - People 18+ that ever had sex (vaginal, anal, or oral) (%)
Sexual Behavior - Males 18+ that ever had vaginal sex with a woman (%)
Sexual Behavior - Males 18+ that ever performed oral sex on a woman (%)
Sexual Behavior - Males 18+ that ever had anal sex with a woman (%)
Sexual Behavior - Males 18+ that ever had any sex with a man (%)
Sexual Behavior - Females 18+ that ever had vaginal sex with a man (%)
Sexual Behavior - Females 18+ that ever performed oral sex on a man (%)
Sexual Behavior - Females 18+ that ever had anal sex with a man (%)
Sexual Behavior - Females 18+ that ever had any kind of sex with a woman (%)
Sexual Behavior - Average age people first had sex
Sexual Behavior - Average number of female sex partners in lifetime (males 18+)
Sexual Behavior - Average number of female vaginal sex partners in lifetime (males 18+)
Sexual Behavior - Average age people first performed oral sex on a woman (18+)
Sexual Behavior - Average number of woman performed oral sex on in lifetime (18+)
Sexual Behavior - Average number of male sex partners in lifetime (males 18+)
Sexual Behavior - Average number of male anal sex partners in lifetime (males 18+)
Sexual Behavior - Average age people first performed oral sex on a man (18+)
Sexual Behavior - Average number of male oral sex partners in lifetime (18+)
Sexual Behavior - People using protection when performing oral sex (%)
Sexual Behavior - Average number of times people have vaginal or anal sex a year
Sexual Behavior - People having sex without condom (%)
Sexual Behavior - Average number of male sex partners in lifetime (females 18+)
Sexual Behavior - Average number of male vaginal sex partners in lifetime (females 18+)
Sexual Behavior - Average number of female sex partners in lifetime (females 18+)
Sexual Behavior - Circumcised males 18+ (%)
Sleep Disorders - Average hours sleeping at night
Sleep Disorders - People that has trouble sleeping (%)
Smoking-Cigarette Use - People smoking cigarettes (%)
Taste & Smell - People 40+ having problems with smell (%)
Taste & Smell - People 40+ having problems with taste (%)
Taste & Smell - People 40+ that ever had wisdom teeth removed (%)
Taste & Smell - People 40+ that ever had tonsils teeth removed (%)
Taste & Smell - People 40+ that ever had a loss of consciousness because of a head injury (%)
Taste & Smell - People 40+ that ever had a broken nose or other serious injury to face or skull (%)
Taste & Smell - People 40+ that ever had two or more sinus infections (%)
Weight - Average height (inches)
Weight - Average weight (pounds)
Weight - Average BMI
Weight - People that are obese (%)
Weight - People that ever were obese (%)
Weight - People trying to lose weight (%)
Officers per 1,000 residents here:
1.72Ohio average:
2.31
Latest news from Celina, OH collected exclusively by city-data.com from local newspapers, TV, and radio stations
Ancestries: German (57.7%), American (16.2%), English (5.0%), Italian (1.1%).
Current Local Time:
Land area: 4.39 square miles.
Population density: 2,479 people per square mile (low).
169 residents are foreign born
Median real estate property taxes paid for housing units with mortgages in 2022: $1,737 (1.0%)Median real estate property taxes paid for housing units with no mortgage in 2022: $1,610 (1.0%)
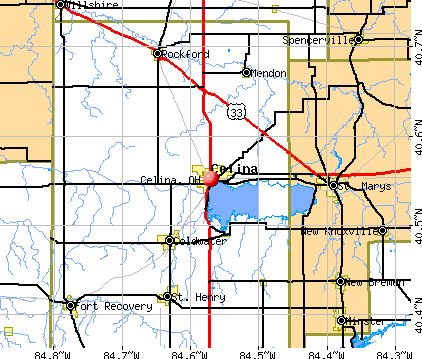
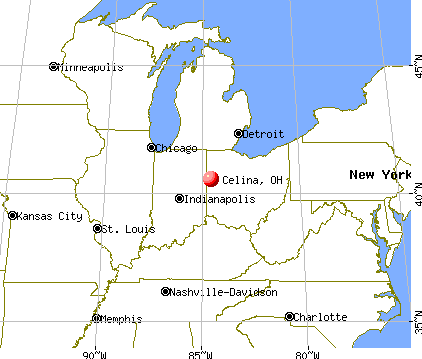
Nearest city with pop. 50,000+: Fort Wayne, IN
Nearest city with pop. 1,000,000+: Chicago, IL
Nearest cities:
Montezuma, OH (2.1 miles),
Latitude: 40.55 N, Longitude: 84.57 W
Daytime population change due to commuting: +2,064 (+18.8%)Workers who live and work in this city: 2,691 (47.7%)
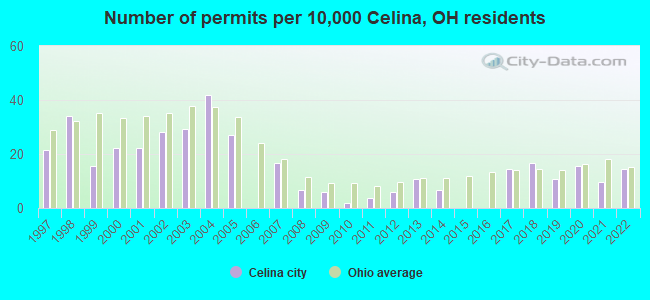
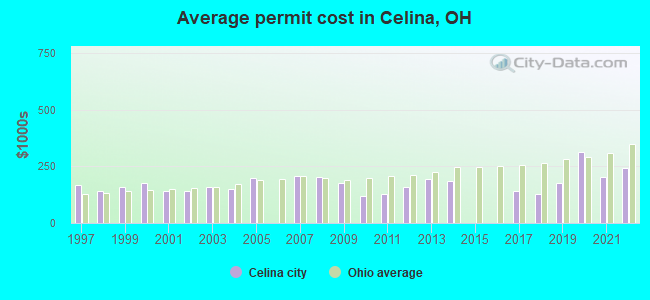
Single-family new house construction building permits:
2022: 15 buildings , average cost: $243,4002021: 10 buildings , average cost: $202,7002020: 16 buildings , average cost: $310,8002019: 11 buildings , average cost: $178,1002018: 17 buildings , average cost: $129,7002017: 15 buildings , average cost: $139,9002014: 7 buildings , average cost: $185,7002013: 11 buildings , average cost: $195,4002012: 6 buildings , average cost: $156,5002011: 4 buildings , average cost: $128,8002010: 2 buildings , average cost: $120,0002009: 6 buildings , average cost: $177,5002008: 7 buildings , average cost: $200,7002007: 17 buildings , average cost: $209,0002005: 28 buildings , average cost: $197,1002004: 43 buildings , average cost: $151,7002003: 30 buildings , average cost: $156,8002002: 29 buildings , average cost: $142,7002001: 23 buildings , average cost: $142,5002000: 23 buildings , average cost: $177,1001999: 16 buildings , average cost: $157,1001998: 35 buildings , average cost: $143,3001997: 22 buildings , average cost: $169,000Unemployment in December 2023:
Population change in the 1990s: +223 (+2.2%).
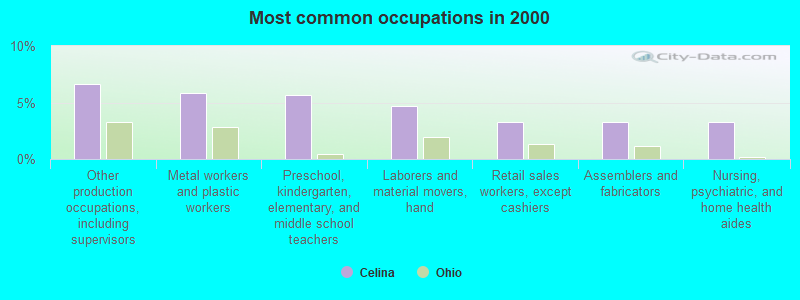
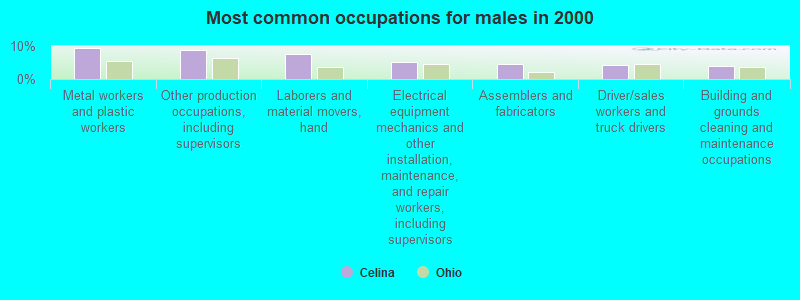
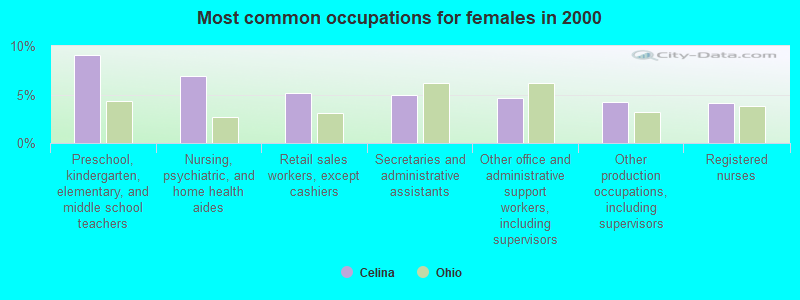
Most common occupations in Celina, OH (%)
Both Males Females
Other production occupations, including supervisors (6.7%)
Metal workers and plastic workers (5.8%)
Preschool, kindergarten, elementary, and middle school teachers (5.7%)
Laborers and material movers, hand (4.7%)
Retail sales workers, except cashiers (3.3%)
Assemblers and fabricators (3.3%)
Nursing, psychiatric, and home health aides (3.2%)
Metal workers and plastic workers (9.4%)
Other production occupations, including supervisors (8.8%)
Laborers and material movers, hand (7.6%)
Electrical equipment mechanics and other installation, maintenance, and repair workers, including supervisors (5.3%)
Assemblers and fabricators (4.5%)
Driver/sales workers and truck drivers (4.4%)
Building and grounds cleaning and maintenance occupations (4.0%)
Preschool, kindergarten, elementary, and middle school teachers (9.1%)
Nursing, psychiatric, and home health aides (7.0%)
Retail sales workers, except cashiers (5.2%)
Secretaries and administrative assistants (5.0%)
Other office and administrative support workers, including supervisors (4.7%)
Other production occupations, including supervisors (4.2%)
Registered nurses (4.2%)
Tornado activity:
Celina-area historical tornado activity is slightly above Ohio state average. It is 66% greater than the overall U.S. average.
On 2/18/1992, a category F4 (max. wind speeds 207-260 mph) tornado 12.3 miles away from the Celina city center injured 6 people and caused between $500,000 and $5,000,000 in damages.
On 4/11/1965, a category F4 tornado 17.2 miles away from the city center killed 3 people and injured 50 people and caused between $500,000 and $5,000,000 in damages.
Earthquake activity:
Celina-area historical earthquake activity is significantly above Ohio state average. It is 1% greater than the overall U.S. average. On 7/12/1986 at 08:19:37, a magnitude 4.5 (4.5 MB, Class: Light, Intensity: IV - V) earthquake occurred 10.5 miles away from Celina center On 7/27/1980 at 18:52:21, a magnitude 5.2 (5.1 MB, 4.7 MS, 5.0 UK, 5.2 UK, Class: Moderate, Intensity: VI - VII) earthquake occurred 165.7 miles away from the city center On 4/18/2008 at 09:36:59, a magnitude 5.4 (5.1 MB, 4.8 MS, 5.4 MW, 5.2 MW) earthquake occurred 228.9 miles away from the city center On 9/25/1998 at 19:52:52, a magnitude 5.2 (4.8 MB, 4.3 MS, 5.2 LG, 4.5 MW, Depth: 3.1 mi) earthquake occurred 227.3 miles away from Celina center On 4/18/2008 at 09:36:59, a magnitude 5.2 (5.2 MW, Depth: 8.9 mi) earthquake occurred 228.9 miles away from Celina center On 1/31/1986 at 16:46:43, a magnitude 5.0 (5.0 MB) earthquake occurred 192.1 miles away from the city center Magnitude types: regional Lg-wave magnitude (LG), body-wave magnitude (MB), surface-wave magnitude (MS), moment magnitude (MW) Natural disasters: The number of natural disasters in Mercer County (10) is smaller than the US average (15).Major Disasters (Presidential) Declared: 6Emergencies Declared: 2Floods: 6, Storms: 6, Tornadoes: 3, Mudslides: 2, Blizzard: 1, Hurricane: 1, Landslide: 1, Snowstorm: 1, Wind: 1, Winter Storm: 1, Other: 1 (Note: some incidents may be assigned to more than one category). Hospitals and medical centers in Celina: MUD PIKE GROUP HOME ("4874 MUD PIKE ROAD, PO BOX 603") ASHTON TERRACE (401 MYER ROAD)
CELINA MANOR (1001 MYERS ROAD)
GARDENS AT CELINA (1301 MYERS ROAD)
KIDNEY SERVICES OF WEST CENTRAL OHIO - MERCER COUNTY (801 PRO DRIVE, STE B)
MERCER HEALTH HOME CARE (1107 NORTH MAIN STREET, SUITE 8)
College/University in Celina: Wright State University-Lake Campus Full-time enrollment: 889; Location: 7600 St. Rt. 703; Public; Website: www.wright.edu; Offers Master's degree )
Colleges/universities with over 2000 students nearest to Celina:
University of Northwestern Ohio (about 27 miles; Lima, OH ; Full-time enrollment: 4,231)
James A Rhodes State College (about 32 miles; Lima, OH ; FT enrollment: 2,689)
Edison State Community College (about 34 miles; Piqua, OH ; FT enrollment: 2,049)
Ohio Northern University (about 42 miles; Ada, OH ; FT enrollment: 2,474)
Indiana Institute of Technology (about 47 miles; Fort Wayne, IN ; FT enrollment: 4,320)
Indiana University-Purdue University-Fort Wayne (about 49 miles; Fort Wayne, IN ; FT enrollment: 10,126)
University of Saint Francis-Fort Wayne (about 49 miles; Fort Wayne, IN ; FT enrollment: 2,075)
Public high schools in Celina: CELINA HIGH SCHOOL Students: 874, Location: 715 E WAYNE ST, Grades: 9-12)ALADDIN ACADEMY Location: 585 E LIVINGSTON ST, Grades: 6-12, Charter school )
Public elementary/middle schools in Celina: CELINA MIDDLE SCHOOL Students: 442, Location: 615 HOLLY ST, Grades: 7-8)CELINA INTERMEDIATE ELEMENTARY SCHOOL Students: 412, Location: 227 PORTLAND ST, Grades: 5-6)CELINA PRIMARY SCHOOL Location: 615 E WAYNE ST, Grades: KG-2)
CELINA ELEMENTARY SCHOOL Location: 1225 W LOGAN ST, Grades: 3-4)
Private elementary/middle school in Celina: IMMACULATE CONCEPTION SCHOOL Students: 153, Location: 200 W WAYNE ST, Grades: PK-6)
See full list of schools located in Celina Library in Celina: MERCER COUNTY DISTRICT PUBLIC LIBRARY Operating income: $977,234; Location: 303 N. MAIN ST.; 116,156 books ; 3,628 audio materials ; 4,745 video materials ; 266 state licensed databases ; 170 print serial subscriptions )
User-submitted facts and corrections:
Add to Hospitals/Medical Centers: Celina Medical Center 801 Pro Drive added by Steve
Notable locations in Celina: (A) , Celina Water Treatment Plant (B) , Celina Sewage Treatment Plant (C) , Grand Lake Mushroom Farm (D) , Mercer County Emergency Medical Services (E) , Celina Fire Department (F) , Celina City Hall (G) , Celina Power Plant (H) , Dwyer-Mercer County Library (I) , Mercer County Courthouse (J) , Mercer County Law Library (K) , Mercer County Jail (L) , Celina Cinema 5 (M) . Display/hide their locations on the map
Shopping Centers: (1) , Harts Shopping Center (2) . Display/hide their locations on the map
Churches in Celina include: (A) , Saint Johns Evangelical Lutheran Church (B) , Pilgrim Holiness Church (C) , Kingdom Hall of Jehovahs Witnesses (D) , Church of God (E) , Celina Friends Church (F) , Bethany Evangelical United Brethren Church (G) , Bethany Evangelical Church (H) , Immaculate Conception Catholic Church (I) . Display/hide their locations on the map
Cemeteries: (1) , North Grove Cemetery (2) , Petrie Cemetery (3) . Display/hide their locations on the map
Parks in Celina include: (1) , Mercelina Park (2) , Celina Main Street Commercial Historic District (3) , Westview Park (4) , Eastview Park (5) . Display/hide their locations on the map
Tourist attraction:
Hotels:
Court:
Birthplace of: Jackie Tavener - Baseball player, Keith Faber - Politician, Shelly Mars - Actor, Cody Reichard - Ice hockey goaltender, Frank Le Blond Kloeb - Politician, Jim Otis - College football player, Mildred Wolfe - Painter, William E. Tou Velle - Politician.
Mercer County has a predicted average indoor radon screening level greater than 4 pCi/L (pico curies per liter) - Highest Potential Drinking water stations with addresses in Celina and their reported violations in the past:
CELINA CITY (Population served: 11,682, Surface water):
Past health violations:
MCL, Average - Between JAN-2009 and MAR-2009, Contaminant: TTHM. Follow-up actions: St Public Notif received (MAR-23-2009), St Compliance achieved (MAY-04-2009), St Public Notif requested (MAY-18-2009), St Violation/Reminder Notice (MAY-18-2009)
MCL, Average - Between OCT-2008 and DEC-2008, Contaminant: TTHM. Follow-up actions: St AO (w/penalty) issued (MAR-06-2008), St Public Notif received (DEC-18-2008), St Public Notif requested (FEB-12-2009), St Violation/Reminder Notice (FEB-12-2009), St Compliance achieved (MAY-04-2009)
MCL, Average - Between JUL-2008 and SEP-2008, Contaminant: TTHM. Follow-up actions: St AO (w/penalty) issued (FEB-01-2008), St Public Notif received (OCT-09-2008), St Public Notif requested (NOV-19-2008), St Violation/Reminder Notice (NOV-19-2008), St Compliance achieved (MAY-04-2009)
MCL, Average - Between APR-2008 and JUN-2008, Contaminant: TTHM. Follow-up actions: St AO (w/penalty) issued (FEB-01-2008), St Public Notif received (JUN-16-2008), St Public Notif requested (AUG-13-2008), St Violation/Reminder Notice (AUG-13-2008), St Compliance achieved (MAY-04-2009)
MCL, Average - Between JAN-2008 and MAR-2008, Contaminant: TTHM. Follow-up actions: St AO (w/penalty) issued (FEB-01-2008), St Public Notif received (MAR-26-2008), St Public Notif requested (MAY-15-2008), St Violation/Reminder Notice (MAY-15-2008), St Compliance achieved (MAY-04-2009)
MCL, Average - Between OCT-2007 and DEC-2007, Contaminant: TTHM. Follow-up actions: St Public Notif received (JAN-02-2008), St AO (w/penalty) issued (FEB-01-2008), St Public Notif requested (FEB-21-2008), St Violation/Reminder Notice (FEB-21-2008), St Compliance achieved (MAY-04-2009)
13 other older health violations
Past monitoring violations:
Monitoring and Reporting (DBP) - Between APR-2013 and JUN-2013, Contaminant: Total Haloacetic Acids (HAA5). Follow-up actions: St Compliance achieved (AUG-12-2013), St Violation/Reminder Notice (AUG-22-2013), St Public Notif requested (AUG-22-2013)
Monitoring and Reporting (DBP) - Between APR-2013 and JUN-2013, Contaminant: TTHM. Follow-up actions: St Compliance achieved (AUG-12-2013), St Violation/Reminder Notice (AUG-22-2013), St Public Notif requested (AUG-22-2013)
Population served: 665, Groundwater):
Past monitoring violations:
One routine major monitoring violation
Population served: 206, Groundwater):
Past health violations:
MCL, Monthly (TCR) - In FEB-2010, Contaminant: Coliform. Follow-up actions: St Public Notif requested (MAR-01-2010), St Violation/Reminder Notice (MAR-01-2010), St Public Notif received (MAR-08-2010), St Compliance achieved (SEP-15-2010)
MCL, Monthly (TCR) - In JAN-2010, Contaminant: Coliform. Follow-up actions: St Public Notif requested (JAN-27-2010), St Violation/Reminder Notice (JAN-27-2010), St Public Notif received (FEB-02-2010), St Compliance achieved (SEP-15-2010)
Past monitoring violations:
One routine major monitoring violation
Population served: 170, Groundwater):
Past health violations:
Public Education - In JAN-01-2008, Contaminant: Lead and Copper Rule. Follow-up actions: St Public Notif requested (JAN-05-2010), St Violation/Reminder Notice (JAN-05-2010), St Compliance achieved (JAN-27-2010)
MCL, Monthly (TCR) - In OCT-2005, Contaminant: Coliform. Follow-up actions: St Public Notif requested (OCT-26-2005), St Violation/Reminder Notice (OCT-26-2005), St Compliance achieved (APR-19-2007)
Past monitoring violations:
Initial Tap Sampling for Pb and Cu - In OCT-01-2005, Contaminant: Lead and Copper Rule. Follow-up actions: St Violation/Reminder Notice (NOV-15-2005), St Public Notif requested (NOV-15-2005), St Compliance achieved (NOV-17-2005)
Follow-up Or Routine LCR Tap M/R - In OCT-01-2005, Contaminant: Lead and Copper Rule. Follow-up actions: St Violation/Reminder Notice (NOV-15-2005), St Public Notif requested (NOV-15-2005), St Compliance achieved (NOV-21-2005)
One routine major monitoring violation
One minor monitoring violation
Population served: 160, Groundwater):
Past health violations:
MCL, Monthly (TCR) - In OCT-2012, Contaminant: Coliform. Follow-up actions: St Public Notif requested (OCT-12-2012), St Violation/Reminder Notice (OCT-12-2012), St Compliance achieved (OCT-30-2012)
MCL, Monthly (TCR) - Between JUL-2012 and SEP-2012, Contaminant: Coliform. Follow-up actions: St Public Notif requested (OCT-10-2012), St Violation/Reminder Notice (OCT-10-2012), St Compliance achieved (NOV-27-2012)
Population served: 155, Groundwater):
Past health violations:
MCL, Monthly (TCR) - Between APR-2009 and JUN-2009, Contaminant: Coliform. Follow-up actions: St Public Notif requested (JUL-06-2009), St Violation/Reminder Notice (JUL-06-2009), St Compliance achieved (SEP-28-2010)
Population served: 132, Groundwater):
Past monitoring violations:
One regular monitoring violation
Population served: 115, Groundwater):
Past monitoring violations:
One routine major monitoring violation
Drinking water stations with addresses in Celina that have no violations reported:
MT TABOR CHURCH OF GOD-CELINA PWS (Population served: 180, Primary Water Source Type: Groundwater)
KOZY KAMP GROUND (Population served: 155, Primary Water Source Type: Groundwater)
NORTHMOOR GOLF LLC (Population served: 87, Primary Water Source Type: Groundwater)
PIT STOP TAVERN (Population served: 75, Primary Water Source Type: Groundwater)
SHINGLE SHACK RESTAURANT (Population served: 74, Primary Water Source Type: Groundwater)
Average household size: This city:
2.4 peopleOhio:
2.4 people
Percentage of family households: This city:
64.5%Whole state:
65.0%
Percentage of households with unmarried partners: This city:
6.7%Whole state:
6.8%
Likely homosexual households (counted as self-reported same-sex unmarried-partner households)
Lesbian couples: 0.3% of all households Gay men: 0.1% of all households
124 people in nursing facilities/skilled-nursing facilities in 2010people in other noninstitutional facilities in 2010People in group quarters in Celina in 2000:
129 people in nursing homes
6 people in other group homes
5 people in local jails and other confinement facilities (including police lockups)
5 people in other noninstitutional group quarters
2 people in religious group quarters
Banks with branches in Celina (2011 data):
First Financial Bank, National Association: Summit Street Branch, Celina Main Branch, Fayette Street Branch. Info updated 2009/09/21: Bank assets: $6,663.4 mil, Deposits: $5,754.9 mil, headquarters in Hamilton, OH, positive income , Commercial Lending Specialization, 101 total offices , Holding Company: First Financial Bancorp
Mercer Savings Bank: at 1100 Irmscher Blvd, branch established on 1888/01/01; Celina Branch at 217 W Market St, branch established on 1999/07/15. Info updated 2012/01/04: Bank assets: $121.8 mil, Deposits: $110.6 mil, local headquarters , positive income , Mortgage Lending Specialization, 6 total offices
The Peoples Bank Co.: West Logan Branch at 309 West Logan Street, branch established on 1986/09/22; East Wayne Street Branch at 818 East Wayne Street, branch established on 1993/11/01. Info updated 2012/01/04: Bank assets: $364.1 mil, Deposits: $326.1 mil, headquarters in Coldwater, OH, positive income , 7 total offices , Holding Company: Peoples Holding Company, Inc.
The Citizens National Bank of Bluffton: Celina Branch at 601 Grand Lake Road, branch established on 2003/11/04. Info updated 2006/11/03: Bank assets: $589.4 mil, Deposits: $423.2 mil, headquarters in Bluffton, OH, positive income , Commercial Lending Specialization, 11 total offices , Holding Company: Citizens Bancshares, Inc.
Woodforest National Bank: Celina Wal-Mart Branch at 1950 Havemann Road, branch established on 2006/08/30. Info updated 2011/05/10: Bank assets: $3,488.9 mil, Deposits: $3,097.6 mil, headquarters in Houston, TX, positive income , Commercial Lending Specialization, 766 total offices , Holding Company: Woodforest Financial Group Employee Stock Ownership Plan (With 401(K) Provisions)
JPMorgan Chase Bank, National Association: Celina Branch at 205 West Market Street, branch established on 1889/01/01. Info updated 2011/11/10: Bank assets: $1,811,678.0 mil, Deposits: $1,190,738.0 mil, headquarters in Columbus, OH, positive income , International Specialization, 5577 total offices , Holding Company: Jpmorgan Chase & Co.
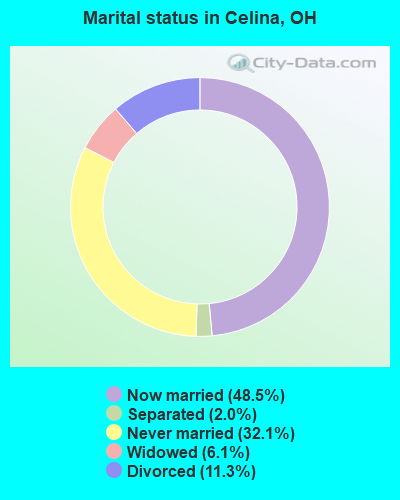
For population 15 years and over in Celina:
Never married: 32.1%Now married: 48.5%Separated: 2.0%Widowed: 6.1%Divorced: 11.3% For population 25 years and over in Celina:
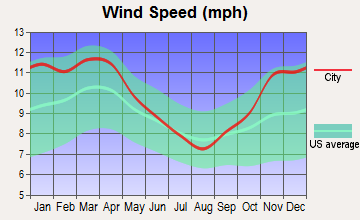
High school or higher: 92.1%Bachelor's degree or higher: 20.1%Graduate or professional degree: 7.4%Unemployed: 5.6%Mean travel time to work (commute): 17.5 minutes
Education Gini index (Inequality in education) Here:
8.9Ohio average:
11.0
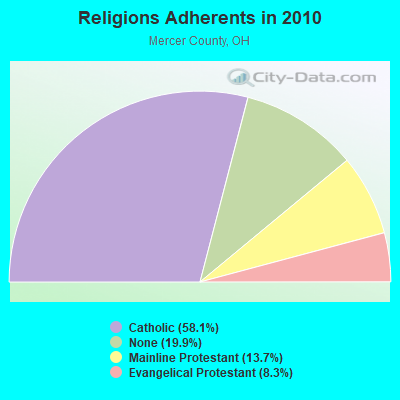
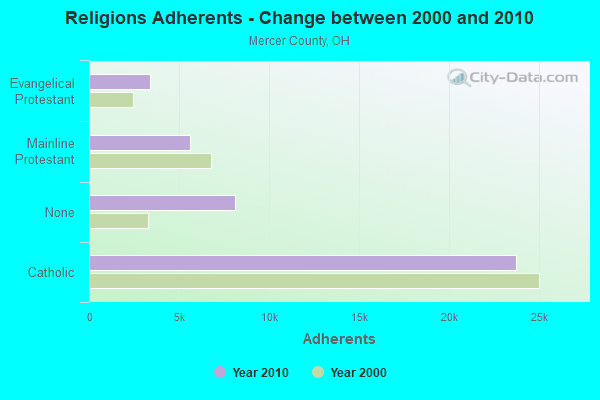
Religion statistics for Celina, OH (based on Mercer County data)
Religion Adherents Congregations Catholic 23,728 20 Mainline Protestant 5,599 22 Evangelical Protestant 3,375 28 Other 1 1 None 8,111 -
Source: Clifford Grammich, Kirk Hadaway, Richard Houseal, Dale E.Jones, Alexei Krindatch, Richie Stanley and Richard H.Taylor. 2012. 2010 U.S.Religion Census: Religious Congregations & Membership Study. Association of Statisticians of American Religious Bodies. Jones, Dale E., et al. 2002. Congregations and Membership in the United States 2000. Nashville, TN: Glenmary Research Center. Graphs represent county-level data
Food Environment Statistics: Number of grocery stores : 8Here :
1.96 / 10,000 pop.Ohio :
1.89 / 10,000 pop.
Number of convenience stores (no gas) : 7This county :
1.72 / 10,000 pop.Ohio :
1.25 / 10,000 pop.
Number of convenience stores (with gas) : 15Mercer County :
3.68 / 10,000 pop.Ohio :
2.93 / 10,000 pop.
Number of full-service restaurants : 29Here :
7.11 / 10,000 pop.Ohio :
6.25 / 10,000 pop.
Adult obesity rate : Mercer County :
29.2%State :
29.1%
Low-income preschool obesity rate : Mercer County :
11.1%Ohio :
11.9%
Health and Nutrition: Healthy diet rate : This city:
49.1%Ohio:
50.4%
Average overall health of teeth and gums : People feeling badly about themselves : This city:
20.7%State:
20.6%
People not drinking alcohol at all : Average hours sleeping at night : Overweight people : This city:
34.7%State:
34.3%
General health condition : Average condition of hearing : More about Health and Nutrition of Celina, OH Residents
Local government employment and payroll (March 2022)
Function
Full-time employees
Monthly full-time payroll
Average yearly full-time wage
Part-time employees
Monthly part-time payroll
Police Protection - Officers
18 $100,240 $66,827 0 $0 Firefighters
16 $100,614 $75,461 3 $169 Financial Administration
14 $64,440 $55,234 2 $3,757 Water Supply
12 $52,439 $52,439 0 $0 Streets and Highways
12 $50,314 $50,314 0 $0 Electric Power
10 $54,908 $65,890 0 $0 Judicial and Legal
9 $39,679 $52,905 0 $0 Police - Other
5 $19,317 $46,361 0 $0 Sewerage
5 $29,976 $71,942 0 $0 Parks and Recreation
2 $7,471 $44,826 2 $2,695 Other Government Administration
1 $1,363 $16,356 13 $8,337
Totals for Government
104 $520,759 $60,088 20 $14,958
Celina government finances - Expenditure in 2021 (per resident):
Construction - Regular Highways: $528,000 ($48.52)
Current Operations - Electric Utilities: $20,488,000 ($1882.92)
Water Utilities: $2,290,000 ($210.46)Police Protection: $1,404,000 ($129.03)Sewerage: $1,298,000 ($119.29)Local Fire Protection: $1,268,000 ($116.53)General - Other: $1,236,000 ($113.59)Judicial and Legal Services: $653,000 ($60.01)Regular Highways: $537,000 ($49.35)Central Staff Services: $394,000 ($36.21)Parks and Recreation: $319,000 ($29.32)Financial Administration: $261,000 ($23.99)General Public Buildings: $65,000 ($5.97)Solid Waste Management: $36,000 ($3.31)General - Interest on Debt: $209,000 ($19.21)
Intergovernmental to Local - Other - Water Utilities: $108,000 ($9.93)
Other - Sewerage: $35,000 ($3.22)Intergovernmental to State - Electric Utilities: $351,000 ($32.26)
Other Capital Outlay - Electric Utilities: $831,000 ($76.37)
Sewerage: $492,000 ($45.22)Police Protection: $366,000 ($33.64)Water Utilities: $256,000 ($23.53)Regular Highways: $136,000 ($12.50)Local Fire Protection: $77,000 ($7.08)Central Staff Services: $51,000 ($4.69)Parks and Recreation: $28,000 ($2.57)General Public Building: $17,000 ($1.56)Judicial and Legal Services: $6,000 ($0.55)Financial Administration: $3,000 ($0.28)Total Salaries and Wages: $5,859,000 ($538.46)
Water Utilities - Interest on Debt: $277,000 ($25.46)
Celina government finances - Revenue in 2021 (per resident):
Charges - Sewerage: $2,862,000 ($263.03)
Parks and Recreation: $72,000 ($6.62)Solid Waste Management: $59,000 ($5.42)Miscellaneous Commercial Activities: $33,000 ($3.03)Local Intergovernmental - Health and Hospitals: $285,000 ($26.19)
Public Welfare: $227,000 ($20.86)General Local Government Support: $220,000 ($20.22)Highways: $28,000 ($2.57)Miscellaneous - General Revenue - Other: $1,438,000 ($132.16)
Interest Earnings: $357,000 ($32.81)Fines and Forfeits: $236,000 ($21.69)Sale of Property: $43,000 ($3.95)Donations From Private Sources: $6,000 ($0.55)Revenue - Electric Utilities: $23,878,000 ($2194.47)
Water Utilities: $3,704,000 ($340.41)State Intergovernmental - General Local Government Support: $88,000 ($8.09)
Tax - Individual Income: $6,439,000 ($591.77)
Property: $253,000 ($23.25)Other Selective Sales: $96,000 ($8.82)Other License: $5,000 ($0.46)Alcoholic Beverage Sales: $4,000 ($0.37)Occupation and Business License - Other: $1,000 ($0.09)
Celina government finances - Debt in 2021 (per resident):
Long Term Debt - Beginning Outstanding - Unspecified Public Purpose: $12,131,000 ($1114.88)
Outstanding Unspecified Public Purpose: $10,994,000 ($1010.39)Retired Unspecified Public Purpose: $1,632,000 ($149.99)Issue, Unspecified Public Purpose: $495,000 ($45.49)Short Term Debt Outstanding - Beginning: $995,000 ($91.44)
End of Fiscal Year: $495,000 ($45.49)
Celina government finances - Cash and Securities in 2021 (per resident):
Other Funds - Cash and Securities: $43,762,000 ($4021.87)
Sinking Funds - Cash and Securities: $56,000 ($5.15)
Businesses in Celina, OH
Name Count Name Count
ALDI 1 Little Caesars Pizza 1 AT&T 1 MasterBrand Cabinets 5 Ace Hardware 1 McDonald's 1 Advance Auto Parts 1 Menards 1 Arby's 1 New Balance 1 AutoZone 1 Nike 2 Burger King 1 Pizza Hut 1 CVS 1 RadioShack 1 Dairy Queen 1 SAS Shoes 1 Domino's Pizza 1 SONIC Drive-In 1 FedEx 1 Subway 2 Ford 1 Taco Bell 1 GameStop 1 U-Haul 1 Goodwill 2 UPS 4 H&R Block 1 Walmart 1 Holiday Inn 1 Wendy's 1 KFC 1 YMCA 1 La-Z-Boy 1
Strongest AM radio stations in Celina:
WCSM (1350 AM; 0 kW; CELINA, OH)
WOWO (1190 AM; 50 kW; FORT WAYNE, IN; Owner: PATHFINDER COMMUNICATIONS CORPORATION)
WLW (700 AM; 50 kW; CINCINNATI, OH; Owner: JACOR BROADCASTING CORPORATION)
WTVN (610 AM; 50 kW; COLUMBUS, OH; Owner: CITICASTERS LICENSES, L.P.)
WIBC (1070 AM; 50 kW; INDIANAPOLIS, IN; Owner: EMMIS RADIO LICENSE CORPORATION)
WFDF (910 AM; 50 kW; FLINT, MI; Owner: ABC, INC.)
WJR (760 AM; 50 kW; DETROIT, MI; Owner: ABC, INC.)
WSAI (1530 AM; 50 kW; CINCINNATI, OH; Owner: JACOR BROADCASTING CORPORATION)
WRFD (880 AM; daytime; 23 kW; COLUMBUS-WORTHINGTON, OH; Owner: SALEM MEDIA OF OHIO, INC.)
WDFN (1130 AM; 50 kW; DETROIT, MI; Owner: AMFM RADIO LICENSES, L.L.C.)
WCHB (1200 AM; 50 kW; TAYLOR, MI; Owner: RADIO ONE OF DETROIT, LLC)
WWJ (950 AM; 50 kW; DETROIT, MI; Owner: INFINITY BROADCASTING OPERATIONS, INC.)
WKNR (850 AM; 50 kW; CLEVELAND, OH; Owner: CARON BROADCASTING, INC.)
Strongest FM radio stations in Celina:
WKKI (94.3 FM; CELINA, OH; Owner: SONSHINE CORP.)
WCSM-FM (96.7 FM; CELINA, OH; Owner: HAYCO BROADCASTING, INC.)
WMLX (103.3 FM; ST. MARYS, OH; Owner: JACOR BROADCASTING CORPORATION)
WIMT (102.1 FM; LIMA, OH; Owner: JACOR BROADCASTING CORPORATION)
WBCJ (88.1 FM; SPENCERVILLE, OH; Owner: TAYLOR UNIVERSITY BROADCASTING, INC)
WZBD (92.7 FM; BERNE, IN; Owner: ADAMS COUNTY RADIO, INC)
WZRX-FM (107.5 FM; FORT SHAWNEE, OH; Owner: JACOR BROADCASTING CORPORATION)
WDJO (106.5 FM; GREENVILLE, OH; Owner: CITICASTERS LICENSES, L.P.)
WDPT (95.7 FM; PIQUA, OH; Owner: CXR HOLDINGS, INC.)
WGLE (90.7 FM; LIMA, OH; Owner: PUBLIC B/C FOUNDATION OF NW OHIO)
WDPG (89.9 FM; GREENVILLE, OH; Owner: DAYTON PUBLIC RADIO, INC.)
WDOH (107.1 FM; DELPHOS, OH; Owner: VOGEL ROACH CORPORATION)
WZOQ (92.1 FM; WAPAKONETA, OH; Owner: FOREVER OF OHIO, LLC)
WFGF (93.1 FM; LIMA, OH; Owner: FOREVER OF OHIO, LLC)
TV broadcast stations around Celina:
WLMO-LP (Channel 65; LIMA, OH; Owner: METRO VIDEO PRODUCTIONS, INC.)
W61CZ (Channel 61; LIMA, OH; Owner: YONEIDE S. DINZEY)
W55CH (Channel 55; HOUGHTON LAKE, MI; Owner: MS COMMUNICATIONS, LLC)
WTLW (Channel 44; LIMA, OH; Owner: AMERICAN CHRISTIAN TELEVISION SERVICES, INC.)
WOHL-CA (Channel 25; LIMA, OH; Owner: TV-67, INC.)
W17AA (Channel 17; CELINA, OH; Owner: UNIVERSITY REGIONAL BROADCASTING., INC.)
WLIO (Channel 35; LIMA, OH; Owner: LIMA COMMUNICATIONS CORPORATION)
National Bridge Inventory (NBI) Statistics 35 Number of bridges210ft / 63.5m Total length $650,993,000 Total costs71,093 Total average daily traffic12,331 Total average daily truck traffic98,676 Total future (year 2022) average daily traffic
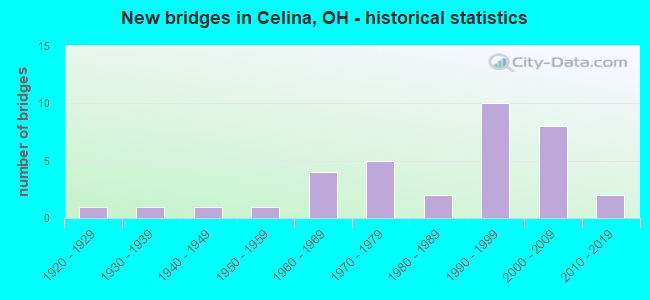
New bridges - historical statistics
1 1920-1929 1 1930-1939 1 1940-1949 1 1950-1959 4 1960-1969 5 1970-1979 2 1980-1989 10 1990-1999 8 2000-2009 2 2010-2019
See full National Bridge Inventory statistics for Celina, OH
Fire-safe hotels and motels in Celina, Ohio:
America's Best Value Inn, 1421 Rt 703 E, Celina, Ohio 45822 Phone: (419) 586-4656, Fax: (419) 386-2665
Best Western Celina, 2020 Holiday Dr, Celina, Ohio 45822 Phone: (419) 586-4919, Fax: (419) 586-4919
Best Western, 2020 Holiday Dr, Celina, Ohio 45822 Phone: (419) 586-4919, Fax: (567) 890-4926
All 3 fire-safe hotels and motels in Celina, Ohio
Most common first names in Celina, OH among deceased individuals Name Count Lived (average)
Mary 163 79.3 years John 140 75.4 years William 109 76.5 years Robert 108 73.4 years James 76 69.6 years Charles 74 74.1 years Ruth 66 79.1 years Paul 63 73.4 years Helen 61 77.9 years Margaret 59 78.6 years
Most common last names in Celina, OH among deceased individuals Last name Count Lived (average)
Miller 60 77.4 years Smith 60 75.7 years Bollenbacher 31 79.0 years Davis 28 78.4 years Hoenie 28 77.9 years Gray 28 72.9 years Brown 25 76.1 years Fisher 24 80.1 years Ellis 23 72.1 years Linn 23 82.5 years
Celina compared to Ohio state average:
Unemployed percentage below state average. Black race population percentage significantly below state average. Foreign-born population percentage significantly below state average. Length of stay since moving in above state average.
#50 on the list of "Top 101 cities with largest percentage of males in industries: manufacturing (population 5,000+)"
#101 on the list of "Top 101 cities with largest percentage of males in occupations: production occupations (population 5,000+)"
#42 (45822) on the list of "Top 101 zip codes with the largest percentage of German first ancestries (pop 5,000+)"
#15 on the list of "Top 101 counties with the lowest percentage of residents relocating from other counties between 2010 and 2011"
#30 on the list of "Top 101 counties with the lowest percentage of residents relocating to other counties in 2011"
Top Patent Applicants
Stephen M. Seibel (15)
Dean E. Winner (6)
Matthew M. Green (5)
Nicholas J. Stein (3)
Michael P. Kovach (2)
Dennis L. Harris (2)
Todd A. Thomas (2)
Jantzen Hinton (2)
Dean Winner (2)
Dyne R. Hoenie (2)
Total of 58 patent applications in 2008-2024.


 Recent articles from our blog. Our writers, many of them Ph.D. graduates or candidates, create easy-to-read articles on a wide variety of topics.

 (46.7 miles
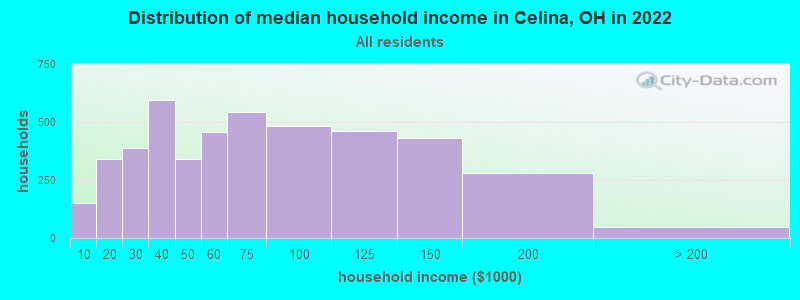


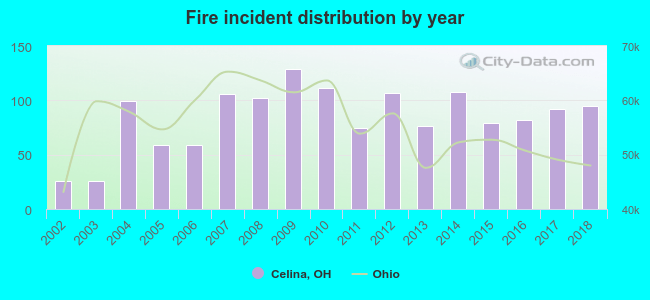 Based on the data from the years 2002 - 2018 the average number of fire incidents per year is 84. The highest number of reported fires - 129 took place in 2009, and the least - 26 in 2002. The data has an increasing trend.
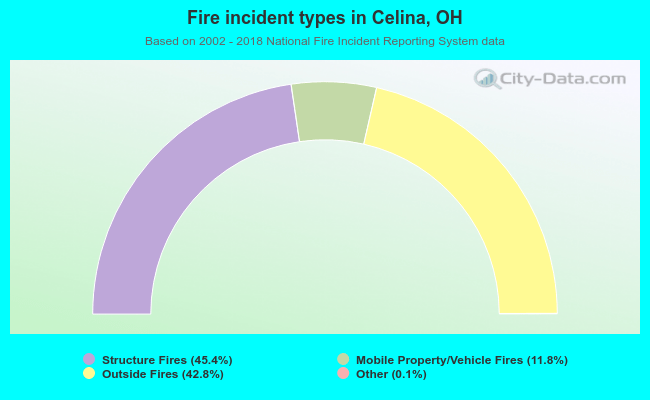 When looking into fire subcategories, the most reports belonged to: Structure Fires (45.4%), and Outside Fires (42.8%).