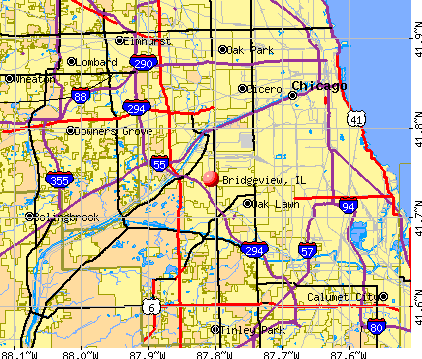
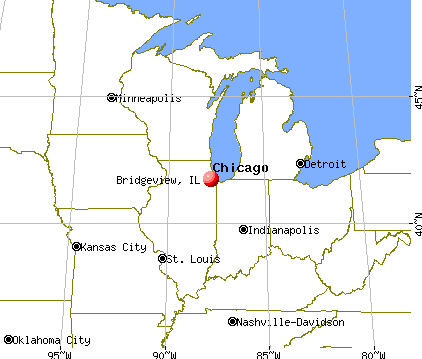
Bridgeview, Illinois
Submit your own pictures of this village and show them to the world
- OSM Map
- General Map
- Google Map
- MSN Map
Population change since 2000: +7.4%
 |
| Males: 7,740 | |
| Females: 8,727 |
| Median resident age: | 39.8 years |
| Illinois median age: | 39.1 years |
Zip codes: 60457.
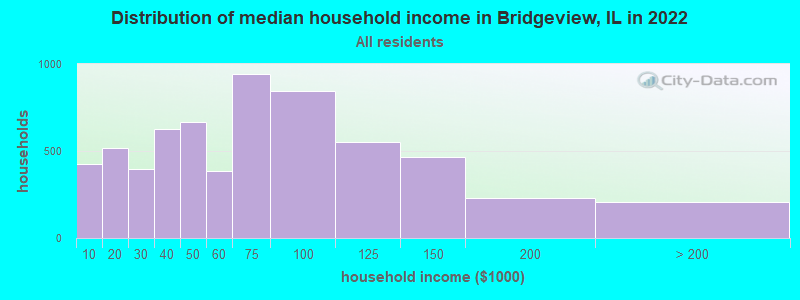
| Bridgeview: | $60,114 |
| IL: | $76,708 |
Estimated per capita income in 2022: $27,281 (it was $18,802 in 2000)
Bridgeview village income, earnings, and wages data
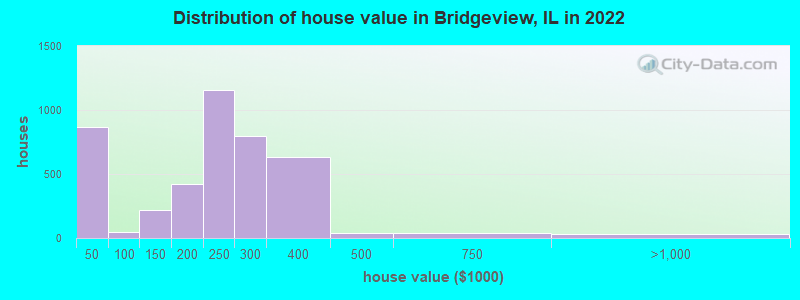
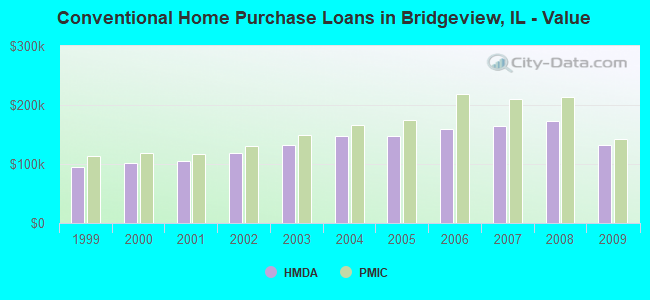
Estimated median house or condo value in 2022: $229,257 (it was $131,500 in 2000)
| Bridgeview: | $229,257 |
| IL: | $251,600 |
Mean prices in 2022: all housing units: $242,984; detached houses: $295,743; townhouses or other attached units: $256,673; in 3-to-4-unit structures: $420,315; in 5-or-more-unit structures: $150,327; mobile homes: $44,621
Median gross rent in 2022: $1,053.
(11.6% for White Non-Hispanic residents, 9.5% for Black residents, 20.1% for Hispanic or Latino residents, 18.0% for other race residents, 18.6% for two or more races residents)
Detailed information about poverty and poor residents in Bridgeview, IL

Compare current foreclosures in Bridgeview, IL:
| Photo | Address | Area | Beds / Baths | Price | Details |
|---|---|---|---|---|---|

|
#1
W 79th Pl
Bridgeview, IL 60455
|
3,675 sq. feet
|
6 baths 6 beds |
show details | |

|
#2
S 78th Ct
Bridgeview, IL 60455
|
1,143 sq. feet
|
1 baths 3 beds |
show details | |

|
#3
S 78th Ave
Bridgeview, IL 60455
|
2,039 sq. feet
|
3 baths 3 beds |
show details | |

|
#4
S Oketo Ave
Bridgeview, IL 60455
|
3,352 sq. feet
|
3 baths 3 beds |
show details | |

|
#5
S 78th Ave
Bridgeview, IL 60455
|
984 sq. feet
|
1 baths 3 beds |
show details | |

|
#6
W 80th St
Bridgeview, IL 60455
|
1,248 sq. feet
|
2 baths 3 beds |
show details | |

|
#7
Sholer Ave
Bridgeview, IL 60455
|
1,096 sq. feet
|
1 baths 3 beds |
show details | |

|
#8
Suburban Ln
Bridgeview, IL 60455
|
1,769 sq. feet
|
2 baths 2 beds |
show details | |

|
#9
S 77th Ct
Bridgeview, IL 60455
|
1,104 sq. feet
|
1 baths 3 beds |
show details | |

|
#10
Sholer Ave
Bridgeview, IL 60455
|
1,135 sq. feet
|
1 baths 3 beds |
show details |
| Photo | Address | Area | Beds / Baths | Price | Details |
|---|---|---|---|---|---|

|
#11
W 85th St
Bridgeview, IL 60455
|
1,311 sq. feet
|
2 baths 3 beds |
show details | |

|
#12
W 71st St # A
Bridgeview, IL 60455
|
1,715 sq. feet
|
2 baths - beds |
show details | |

|
#13
S 78th Ave
Bridgeview, IL 60455
|
1,368 sq. feet
|
1 baths - beds |
show details | |

|
#14
S 78th Ct
Bridgeview, IL 60455
|
1,143 sq. feet
|
1 baths - beds |
show details | |

|
#15
S 78th Ct
Bridgeview, IL 60455
|
1,143 sq. feet
|
1 baths - beds |
show details | |

|
#16
S 77th Ct
Bridgeview, IL 60455
|
1,104 sq. feet
|
1 baths - beds |
show details | |

|
#17
S 78th Ave
Bridgeview, IL 60455
|
1,286 sq. feet
|
2 baths - beds |
show details | |

|
#18
S Oketo Ave
Bridgeview, IL 60455
|
1,923 sq. feet
|
2 baths - beds |
show details | |

|
#19
Circle Ct
Bridgeview, IL 60455
|
1,066 sq. feet
|
1 baths - beds |
show details | |

|
#20
Olympic Dr
Bridgeview, IL 60455
|
1,696 sq. feet
|
1 baths - beds |
show details |
| Photo | Address | Area | Beds / Baths | Price | Details |
|---|---|---|---|---|---|

|
#21
W 82nd Pl
Bridgeview, IL 60455
|
1,332 sq. feet
|
1 baths - beds |
show details | |

|
#22
Odell Ave
Bridgeview, IL 60455
|
3,846 sq. feet
|
3 baths - beds |
show details | |

|
#23
S Thomas Ave
Bridgeview, IL 60455
|
1,266 sq. feet
|
1 baths - beds |
show details | |

|
#24
S 77th Ct
Bridgeview, IL 60455
|
786 sq. feet
|
1 baths - beds |
show details | |

|
#25
S Ferdinand Ave
Bridgeview, IL 60455
|
1,464 sq. feet
|
1 baths - beds |
show details | |

|
#26
S 78th Ave
Bridgeview, IL 60455
|
1,810 sq. feet
|
2 baths - beds |
show details | |

|
#27
S Thomas Ave Unit A
Bridgeview, IL 60455
|
- sq. feet
|
- baths - beds |
show details | |

|
#28
S Harlem Ave
Bridgeview, IL 60455
|
- sq. feet
|
- baths - beds |
show details | |

|
#29
S Harlem Ave Apt 2c
Bridgeview, IL 60455
|
- sq. feet
|
- baths - beds |
show details | |

|
#30
W 7th St
Bridgeview, IL 60455
|
- sq. feet
|
- baths - beds |
show details |
| Photo | Address | Area | Beds / Baths | Price | Details |
|---|---|---|---|---|---|

|
#31
S 78th Ave Apt 3n
Bridgeview, IL 60455
|
- sq. feet
|
- baths - beds |
show details | |

|
#32
S Roberts Rd Apt 1n
Bridgeview, IL 60455
|
- sq. feet
|
- baths - beds |
show details | |

|
#33
W 83rd St
Bridgeview, IL 60455
|
- sq. feet
|
- baths - beds |
show details | |

|
#34
W 71st St Apt 106
Bridgeview, IL 60455
|
- sq. feet
|
- baths - beds |
show details | |

|
#35
S Harlem Ave, Trlr 2369
Bridgeview, IL 60455
|
- sq. feet
|
- baths - beds |
show details | |

|
#36
W 79th St
Bridgeview, IL 60455
|
- sq. feet
|
- baths - beds |
show details | |

|
Check over 1 million property listings on Foreclosure.com!
|
browse all offers | |||


- 9,69058.5%White alone
- 5,39532.6%Hispanic
- 6684.0%Black alone
- 3912.4%Asian alone
- 3792.3%Two or more races
- 300.2%American Indian alone
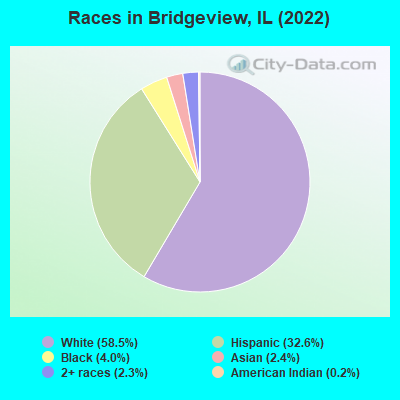
Races in Bridgeview detailed stats: ancestries, foreign born residents, place of birth
According to our research of Illinois and other state lists, there were 22 registered sex offenders living in Bridgeview, Illinois as of June 03, 2024.
The ratio of all residents to sex offenders in Bridgeview is 741 to 1.
The ratio of registered sex offenders to all residents in this city is near the state average.
Type |
2010 |
2011 |
2012 |
2013 |
2014 |
2015 |
2016 |
2017 |
2018 |
2019 |
2020 |
|---|---|---|---|---|---|---|---|---|---|---|---|
| Murders (per 100,000) | 0 (0.0) | 0 (0.0) | 0 (0.0) | 0 (0.0) | 0 (0.0) | 0 (0.0) | 1 (6.1) | 1 (6.2) | 0 (0.0) | 0 (0.0) | 1 (6.2) |
| Rapes (per 100,000) | 6 (36.5) | 2 (12.1) | 3 (18.2) | 2 (12.1) | 1 (6.1) | 3 (18.2) | 3 (18.3) | 9 (55.5) | 3 (18.4) | 6 (37.1) | 3 (18.7) |
| Robberies (per 100,000) | 7 (42.6) | 6 (36.4) | 12 (72.6) | 11 (66.5) | 6 (36.4) | 18 (109.1) | 17 (103.7) | 17 (104.9) | 8 (49.0) | 12 (74.3) | 10 (62.3) |
| Assaults (per 100,000) | 23 (139.9) | 17 (103.1) | 28 (169.4) | 17 (102.8) | 21 (127.5) | 27 (163.6) | 27 (164.7) | 34 (209.7) | 19 (116.4) | 24 (148.6) | 26 (161.9) |
| Burglaries (per 100,000) | 58 (352.7) | 56 (339.5) | 43 (260.2) | 53 (320.4) | 42 (254.9) | 36 (218.2) | 44 (268.3) | 27 (166.5) | 31 (190.0) | 35 (216.7) | 21 (130.8) |
| Thefts (per 100,000) | 368 (2,238) | 396 (2,401) | 452 (2,735) | 434 (2,624) | 389 (2,361) | 346 (2,097) | 372 (2,269) | 291 (1,795) | 270 (1,655) | 272 (1,684) | 311 (1,937) |
| Auto thefts (per 100,000) | 33 (200.7) | 32 (194.0) | 34 (205.7) | 33 (199.5) | 44 (267.1) | 21 (127.3) | 30 (183.0) | 21 (129.5) | 18 (110.3) | 8 (49.5) | 16 (99.7) |
| Arson (per 100,000) | 1 (6.1) | 1 (6.1) | 2 (12.1) | 3 (18.1) | 4 (24.3) | 2 (12.1) | 5 (30.5) | 0 (0.0) | 1 (6.1) | 2 (12.4) | 2 (12.5) |
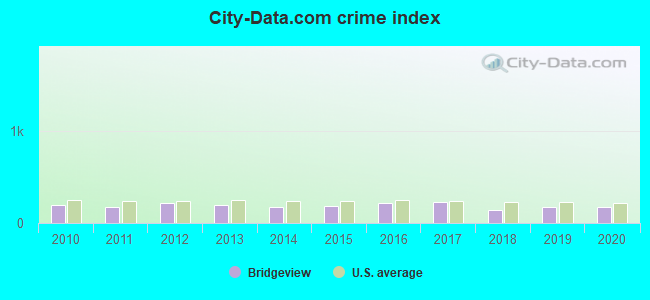
| City-Data.com crime index | 200.2 | 176.5 | 214.3 | 193.5 | 174.9 | 189.3 | 215.0 | 224.0 | 141.0 | 168.2 | 173.1 |
The City-Data.com crime index weighs serious crimes and violent crimes more heavily. Higher means more crime, U.S. average is 246.1. It adjusts for the number of visitors and daily workers commuting into cities.
Crime rate in Bridgeview detailed stats: murders, rapes, robberies, assaults, burglaries, thefts, arson
Full-time law enforcement employees in 2020, including police officers: 32 (32 officers - 31 male; 1 female).
| Officers per 1,000 residents here: | 1.99 |
| Illinois average: | 3.04 |
 Recent articles from our blog. Our writers, many of them Ph.D. graduates or candidates, create easy-to-read articles on a wide variety of topics.

 | Moving to Chicago suburbs 2021 (64 replies) |
| Suburbs that are obscure or little-known (240 replies) |
| Chicago Suburbs to move to from Austin TX (37 replies) |
| Unique Ethnic Enclaves in Chicago Area (16 replies) |
| Muslim community comparison FW,TX vs Chicago suburbs (6 replies) |
| Oak Lawn, Midlothian, Palos [Insert Noun Here], Worth (16 replies) |
Latest news from Bridgeview, IL collected exclusively by city-data.com from local newspapers, TV, and radio stations
Ancestries: Polish (18.1%), Palestinian (10.9%), German (3.2%), Irish (2.3%), American (2.1%), Lithuanian (2.0%).
Current Local Time: CST time zone
Incorporated on 07/16/1947
Elevation: 620 feet
Land area: 4.13 square miles.
Population density: 3,991 people per square mile (average).
3,984 residents are foreign born (10.4% Europe, 6.5% Latin America, 5.3% Asia).
| This village: | 24.1% |
| Illinois: | 14.1% |
Median real estate property taxes paid for housing units with mortgages in 2022: $5,978 (2.6%)
Median real estate property taxes paid for housing units with no mortgage in 2022: $5,111 (2.2%)
Nearest city with pop. 50,000+: Oak Lawn, IL  (3.3 miles , pop. 55,245).
Nearest city with pop. 200,000+: Chicago, IL (9.5 miles , pop. 2,896,016).
Nearest cities:
), ), Latitude: 41.74 N, Longitude: 87.81 W
Daytime population change due to commuting: +3,262 (+19.7%)
Workers who live and work in this village: 1,356 (18.3%)
Bridgeview, Illinois accommodation & food services, waste management - Economy and Business Data
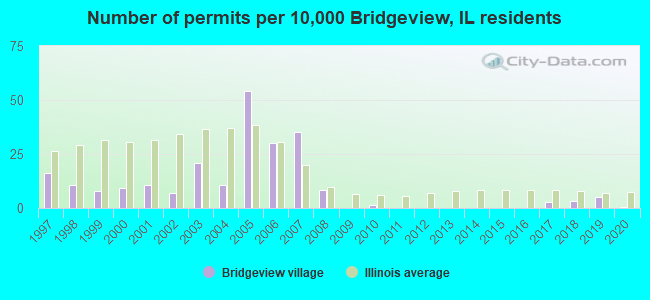
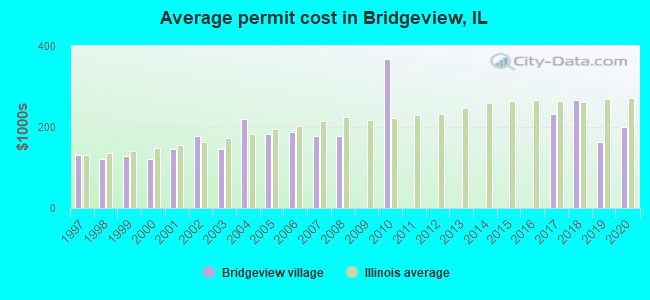
Single-family new house construction building permits:
- 2020: 1 building, cost: $200,000
- 2019: 8 buildings, average cost: $162,500
- 2018: 5 buildings, average cost: $266,000
- 2017: 4 buildings, average cost: $232,500
- 2010: 2 buildings, average cost: $366,900
- 2008: 13 buildings, average cost: $178,600
- 2007: 54 buildings, average cost: $176,900
- 2006: 46 buildings, average cost: $187,700
- 2005: 83 buildings, average cost: $182,100
- 2004: 16 buildings, average cost: $219,800
- 2003: 32 buildings, average cost: $144,800
- 2002: 11 buildings, average cost: $178,700
- 2001: 16 buildings, average cost: $146,400
- 2000: 14 buildings, average cost: $120,600
- 1999: 12 buildings, average cost: $129,000
- 1998: 16 buildings, average cost: $120,500
- 1997: 25 buildings, average cost: $130,000
| Here: | 4.0% |
| Illinois: | 4.2% |
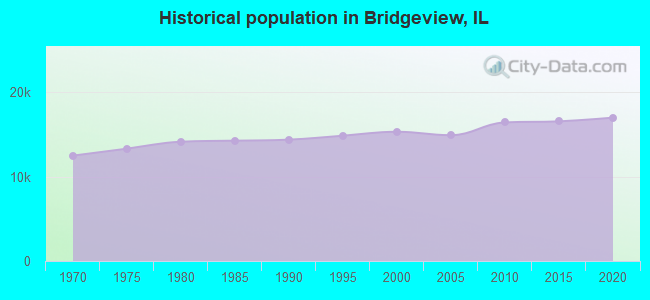
Population change in the 1990s: +858 (+5.9%).
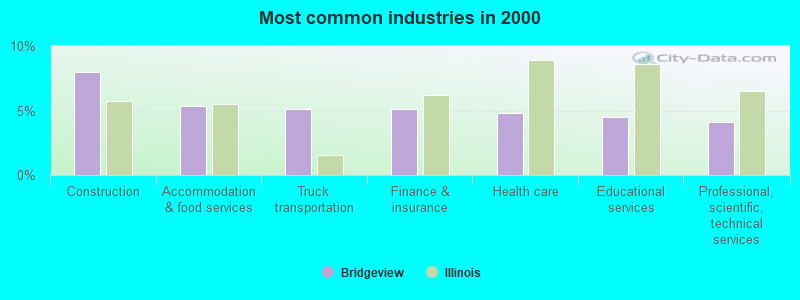
- Construction (8.0%)
- Accommodation & food services (5.4%)
- Truck transportation (5.1%)
- Finance & insurance (5.1%)
- Health care (4.8%)
- Educational services (4.5%)
- Professional, scientific, technical services (4.1%)
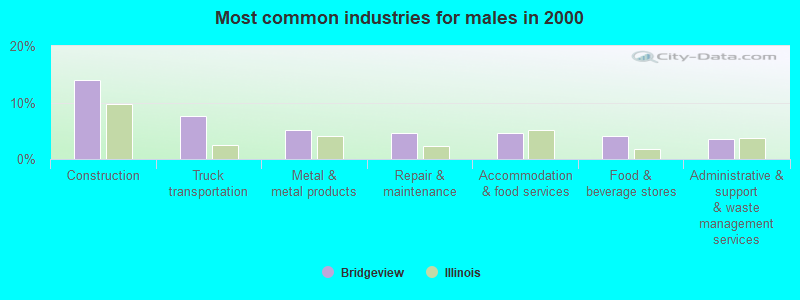
- Construction (13.9%)
- Truck transportation (7.6%)
- Metal & metal products (5.1%)
- Repair & maintenance (4.6%)
- Accommodation & food services (4.6%)
- Food & beverage stores (4.0%)
- Administrative & support & waste management services (3.5%)
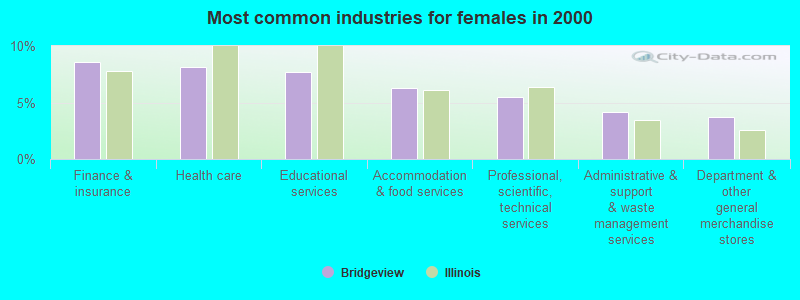
- Finance & insurance (8.6%)
- Health care (8.1%)
- Educational services (7.7%)
- Accommodation & food services (6.3%)
- Professional, scientific, technical services (5.5%)
- Administrative & support & waste management services (4.2%)
- Department & other general merchandise stores (3.8%)
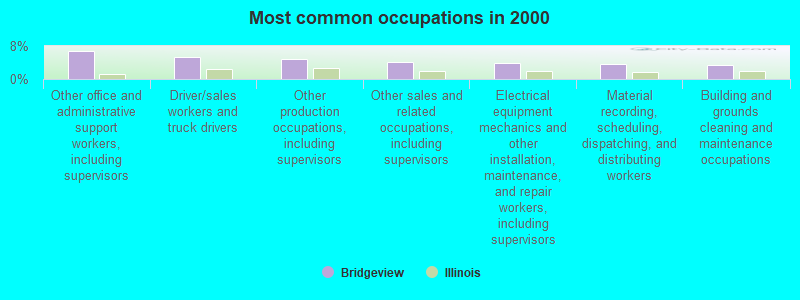
- Other office and administrative support workers, including supervisors (6.7%)
- Driver/sales workers and truck drivers (5.4%)
- Other production occupations, including supervisors (5.0%)
- Other sales and related occupations, including supervisors (4.1%)
- Electrical equipment mechanics and other installation, maintenance, and repair workers, including supervisors (3.8%)
- Material recording, scheduling, dispatching, and distributing workers (3.6%)
- Building and grounds cleaning and maintenance occupations (3.4%)
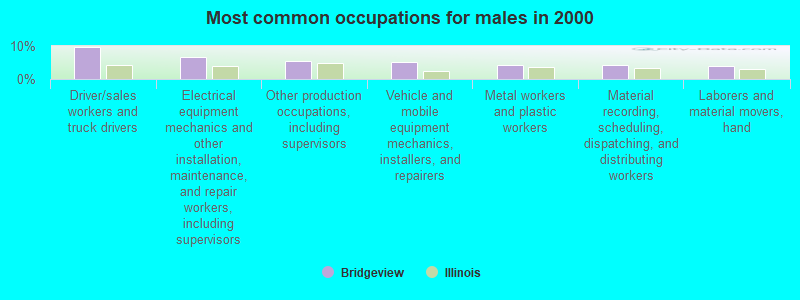
- Driver/sales workers and truck drivers (9.7%)
- Electrical equipment mechanics and other installation, maintenance, and repair workers, including supervisors (6.7%)
- Other production occupations, including supervisors (5.5%)
- Vehicle and mobile equipment mechanics, installers, and repairers (5.2%)
- Metal workers and plastic workers (4.3%)
- Material recording, scheduling, dispatching, and distributing workers (4.1%)
- Laborers and material movers, hand (3.8%)
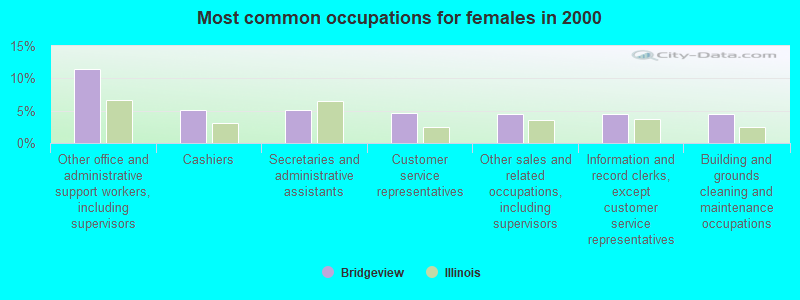
- Other office and administrative support workers, including supervisors (11.5%)
- Cashiers (5.1%)
- Secretaries and administrative assistants (5.0%)
- Customer service representatives (4.6%)
- Other sales and related occupations, including supervisors (4.5%)
- Information and record clerks, except customer service representatives (4.5%)
- Building and grounds cleaning and maintenance occupations (4.5%)
Average climate in Bridgeview, Illinois
Based on data reported by over 4,000 weather stations


|
|

(lower is better)
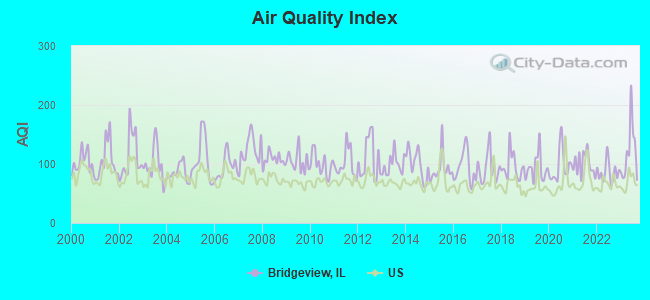
Air Quality Index (AQI) level in 2023 was 119. This is significantly worse than average.
| City: | 119 |
| U.S.: | 73 |
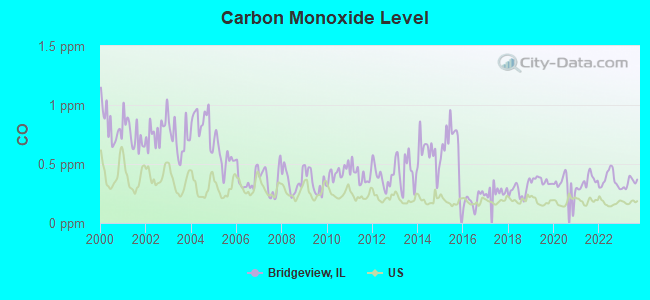
Carbon Monoxide (CO) [ppm] level in 2023 was 0.339. This is worse than average. Closest monitor was 3.9 miles away from the city center.
| City: | 0.339 |
| U.S.: | 0.251 |
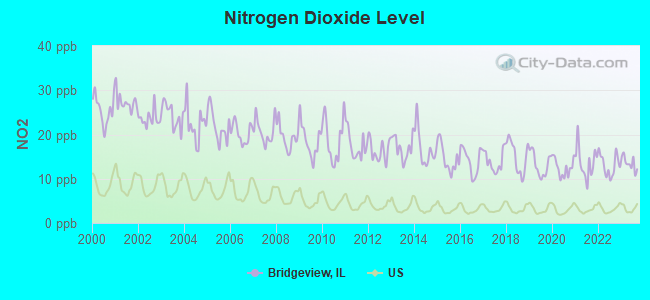
Nitrogen Dioxide (NO2) [ppb] level in 2023 was 13.5. This is significantly worse than average. Closest monitor was 2.8 miles away from the city center.
| City: | 13.5 |
| U.S.: | 5.1 |
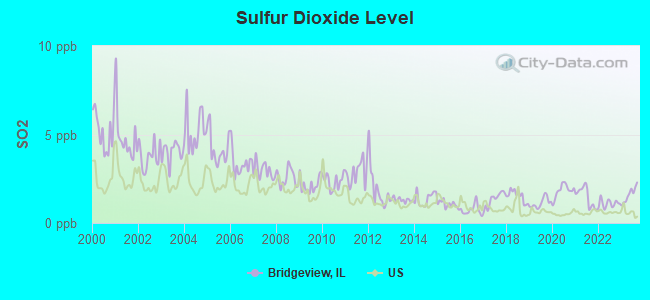
Sulfur Dioxide (SO2) [ppb] level in 2023 was 1.60. This is about average. Closest monitor was 2.0 miles away from the city center.
| City: | 1.60 |
| U.S.: | 1.51 |
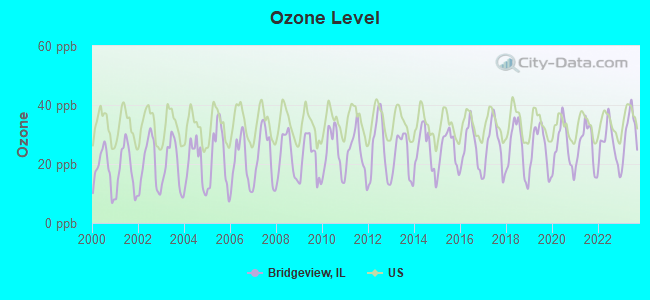
Ozone [ppb] level in 2023 was 30.9. This is about average. Closest monitor was 3.2 miles away from the city center.
| City: | 30.9 |
| U.S.: | 33.3 |
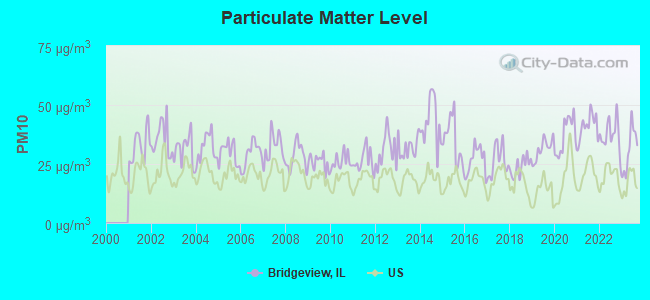
Particulate Matter (PM10) [µg/m3] level in 2023 was 31.1. This is significantly worse than average. Closest monitor was 2.8 miles away from the city center.
| City: | 31.1 |
| U.S.: | 19.2 |
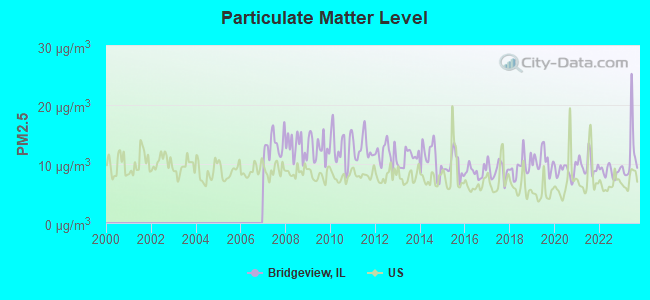
Particulate Matter (PM2.5) [µg/m3] level in 2023 was 11.5. This is significantly worse than average. Closest monitor was 2.8 miles away from the city center.
| City: | 11.5 |
| U.S.: | 8.1 |
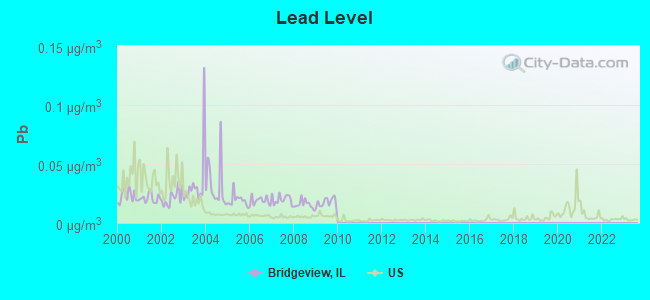
Lead (Pb) [µg/m3] level in 2009 was 0.0175. This is significantly worse than average. Closest monitor was 2.2 miles away from the city center.
| City: | 0.0175 |
| U.S.: | 0.0093 |
Tornado activity:
Bridgeview-area historical tornado activity is near Illinois state average. It is 52% greater than the overall U.S. average.
On 8/28/1990, a category F5 (max. wind speeds 261-318 mph) tornado 21.6 miles away from the Bridgeview village center killed 29 people and injured 350 people and caused between $50,000 and $500,000 in damages.
On 4/21/1967, a category F4 (max. wind speeds 207-260 mph) tornado 5.2 miles away from the village center killed 33 people and injured 500 people and caused between $5,000,000 and $50,000,000 in damages.
Earthquake activity:
Bridgeview-area historical earthquake activity is significantly above Illinois state average. It is 43% greater than the overall U.S. average.On 4/18/2008 at 09:36:59, a magnitude 5.4 (5.1 MB, 4.8 MS, 5.4 MW, 5.2 MW, Class: Moderate, Intensity: VI - VII) earthquake occurred 227.6 miles away from Bridgeview center
On 6/10/1987 at 23:48:54, a magnitude 5.1 (4.9 MB, 4.4 MS, 4.6 MS, 5.1 LG) earthquake occurred 202.1 miles away from Bridgeview center
On 4/18/2008 at 09:36:59, a magnitude 5.2 (5.2 MW, Depth: 8.9 mi) earthquake occurred 227.7 miles away from the city center
On 6/28/2004 at 06:10:52, a magnitude 4.2 (4.2 MW, Depth: 6.2 mi, Class: Light, Intensity: IV - V) earthquake occurred 59.8 miles away from the city center
On 6/18/2002 at 17:37:15, a magnitude 5.0 (4.3 MB, 4.6 MW, 5.0 LG) earthquake occurred 259.8 miles away from Bridgeview center
On 4/18/2008 at 15:14:16, a magnitude 4.8 (4.5 MB, 4.8 MW, 4.6 MW) earthquake occurred 225.9 miles away from the city center
Magnitude types: regional Lg-wave magnitude (LG), body-wave magnitude (MB), surface-wave magnitude (MS), moment magnitude (MW)
Natural disasters:
The number of natural disasters in Cook County (20) is greater than the US average (15).Major Disasters (Presidential) Declared: 15
Emergencies Declared: 4
Causes of natural disasters: Floods: 13, Storms: 12, Tornadoes: 3, Snowstorms: 2, Winter Storms: 2, Blizzard: 1, Hurricane: 1, Snow: 1, Wind: 1, Other: 1 (Note: some incidents may be assigned to more than one category).

Hospitals and medical centers in Bridgeview:
Amtrak stations near Bridgeview:
- 4 miles: SUMMIT (ARCHER & CENTER AVE.) . Services: public payphones, free short-term parking, free long-term parking, call for taxi service, public transit connection.
- 7 miles: LA GRANGE ROAD (LA GRANGE, 25 W. BURLINGTON AVE.) . Services: enclosed waiting area, public payphones, taxi stand, public transit connection.
- 13 miles: CHICAGO (225 S. CANAL ST.) . Services: ticket office, partially wheelchair accessible, enclosed waiting area, public restrooms, public payphones, snack bar, paid short-term parking, paid long-term parking, call for car rental service, taxi stand, public transit connection.
Colleges/Universities in Bridgeview:
- Northwestern College-Southwestern Campus (Full-time enrollment: 614; Location: 7725 South Harlem Avenue; Private, for-profit; Website: www.NorthwesternCollege.edu)
- Tricoci University of Beauty Culture-Bridgeview (Full-time enrollment: 208; Location: 7350 W 87th St; Private, for-profit; Website: www.tricociuniversity.com)
Colleges/universities with over 2000 students nearest to Bridgeview:
- Moraine Valley Community College (about 4 miles; Palos Hills, IL; Full-time enrollment: 12,008)
- City Colleges of Chicago-Richard J Daley College (about 5 miles; Chicago, IL; FT enrollment: 7,497)
- Saint Xavier University (about 6 miles; Chicago, IL; FT enrollment: 3,576)
- Morton College (about 7 miles; Cicero, IL; FT enrollment: 3,236)
- City Colleges of Chicago-Kennedy-King College (about 9 miles; Chicago, IL; FT enrollment: 5,044)
- Chicago State University (about 11 miles; Chicago, IL; FT enrollment: 4,352)
- Concordia University-Chicago (about 11 miles; River Forest, IL; FT enrollment: 3,944)
Private high schools in Bridgeview:
Public elementary/middle schools in Bridgeview:
- BRIDGEVIEW ELEM SCHOOL (Students: 459, Location: 7800 S THOMAS AVE, Grades: KG-6)
- GEORGE W LIEB ELEM SCHOOL (Students: 426, Location: 9101 PEMBROKE LN, Grades: KG-5)
- ROBINA LYLE ELEMENTARY SCHOOL (Location: 7801 W 75TH ST, Grades: KG-6)
Library in Bridgeview:
- BRIDGEVIEW PUBLIC LIBRARY (Operating income: $1,103,268; Location: 7840 WEST 79TH STREET; 82,639 books; 4,256 audio materials; 2,632 video materials; 2 local licensed databases; 18 state licensed databases; 3 other licensed databases; 150 print serial subscriptions; 8 electronic serial subscriptions)
Points of interest:
Notable locations in Bridgeview: Bridgeview Public Library (A), Bridgeview Fire Department Station 2 (B), Bridgeview Fire Department Station 1 (C), Bridgeview Village Hall (D). Display/hide their locations on the map
Shopping Centers: Bridgeview Court Shopping Center (1), Southfield Plaza Shopping Center (2). Display/hide their locations on the map
Churches in Bridgeview include: Saint Fabian Church (A), Church of God (B), First Baptist Church (C), Kingdom Hall of Jehovahs Witnesses (D), Smyra Missionary Baptist Church (E), Calvary Church (F). Display/hide their locations on the map
Parks in Bridgeview include: Millette Memorial Park (1), Wierzba Park (2), Fedor Memorial Park (3), Founders Park (4), Commissioners Park (5). Display/hide their locations on the map
Tourist attraction: Bridgeview Park District Landmark (Cultural Attractions- Events- & Facilities; 7300 West 79th Street).
Hotels: Cloud 9 Motel (8440 South Harlem Avenue), Exel Inn of Bridgeview (9625 South 76th Avenue), Four Seasons Heating & Air Conditioning (9934 South 76th Avenue), Clayton Motel (7240 South Harlem Avenue), Bridgeview Inn (10030 South Harlem Avenue), EXEL Inns of Chicago (9625 South 76th Avenue).
Courts: Cook County - Circuit Courts- Court Clerks District No 5- Civil Proces (10220 South 76th Avenue), Cook County - Circuit Courts- Court Clerks District No 5- Chief Judge's Of (10220 South 76th Avenue), Cook County - Circuit Courts- Court Clerks District No 5- CM & O (10220 South 76th Avenue), Cook County - Circuit Courts- Court Clerks District No 5- Judges (10220 South 76th Avenue), Cook County-Depts - County Clerk- Vital Statistics (10220 South 76th Avenue), Cook County - Circuit Courts- Court Clerks District No 5- Legal Refe (10220 South 76th Avenue), Cook County - Circuit Courts- Court Clerks District No 5- 1st District Crim (10220 South 76th Avenue), Cook County - Circuit Courts- Court Clerks District No 5- Official Court Repor (10220 South 76th Avenue), Cook County - Circuit Courts- Court Clerks District No 5- Poet Presidents OFC of Employment Trai (10220 South 76th Avenue).
Drinking water stations with addresses in Bridgeview that have no violations reported:
- BRIDGEVIEW (Population served: 15,500, Primary Water Source Type: Purch surface water)
| This village: | 2.8 people |
| Illinois: | 2.6 people |
| This village: | 70.4% |
| Whole state: | 65.8% |
| This village: | 5.6% |
| Whole state: | 6.3% |
Likely homosexual households (counted as self-reported same-sex unmarried-partner households)
- Lesbian couples: 0.3% of all households
- Gay men: 0.2% of all households
7 people in group homes intended for adults in 2010
397 people in nursing homes in 2000
Banks with branches in Bridgeview (2011 data):
- Bridgeview Bank Group: Bridgeview Motor Bank Branch, Motor Facility, at 7940 South Harlem Avenue. Info updated 2011/03/16: Bank assets: $1,295.3 mil, Deposits: $1,172.3 mil, local headquarters, negative income in the last year, Commercial Lending Specialization, 19 total offices, Holding Company: Bridgeview Bancorp, Inc.
- Archer Bank: Bridgeview/Harlem Branch at 8601 South Harlem Avenue, branch established on 2004/07/17; Bridgeview Branch at 8267 South Roberts Road, branch established on 1987/11/17. Info updated 2010/04/21: Bank assets: $577.8 mil, Deposits: $525.4 mil, headquarters in Chicago, IL, negative income in the last year, Commercial Lending Specialization, 20 total offices, Holding Company: Metropolitan Bank Group, Inc.
- Marquette Bank: 8020 South Harlem Ave Branch at 8020 South Harlem Avenue, branch established on 1914/01/01. Info updated 2006/11/15: Bank assets: $1,703.1 mil, Deposits: $1,439.1 mil, headquarters in Chicago, IL, positive income, Commercial Lending Specialization, 27 total offices, Holding Company: Marquette National Corporation
- Midland Federal Savings and Loan Association: Midland Federal Savings And Loan Ass at 8929 South Harlem Avenue, branch established on 1914/01/01. Info updated 2011/07/21: Bank assets: $121.6 mil, Deposits: $109.8 mil, local headquarters, negative income in the last year, Mortgage Lending Specialization, 4 total offices
- RBS Citizens, National Association: Bridgeview at 8739 South Harlem, branch established on 1999/10/01. Info updated 2007/09/19: Bank assets: $106,940.6 mil, Deposits: $75,690.2 mil, headquarters in Providence, RI, positive income, 1135 total offices, Holding Company: Uk Financial Investments Limited
For population 15 years and over in Bridgeview:
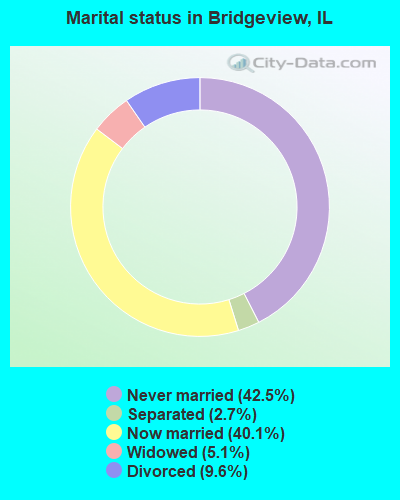
- Never married: 42.5%
- Now married: 40.1%
- Separated: 2.7%
- Widowed: 5.1%
- Divorced: 9.6%
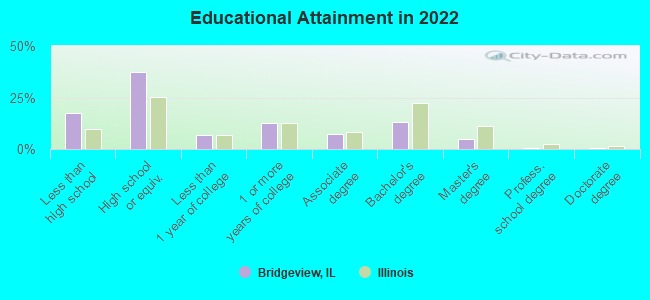
For population 25 years and over in Bridgeview:
- High school or higher: 82.9%
- Bachelor's degree or higher: 17.7%
- Graduate or professional degree: 5.1%
- Unemployed: 3.6%
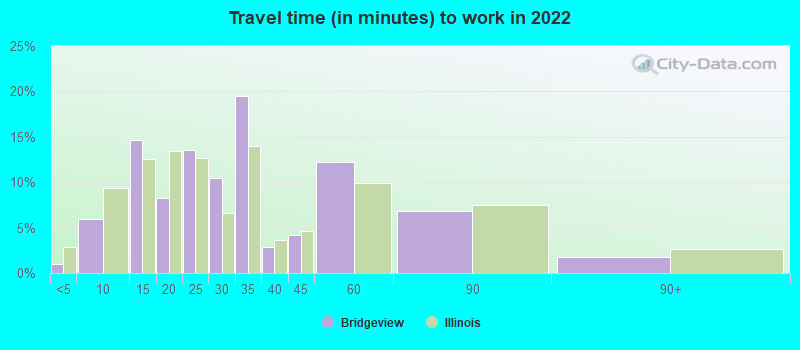
- Mean travel time to work (commute): 27.3 minutes
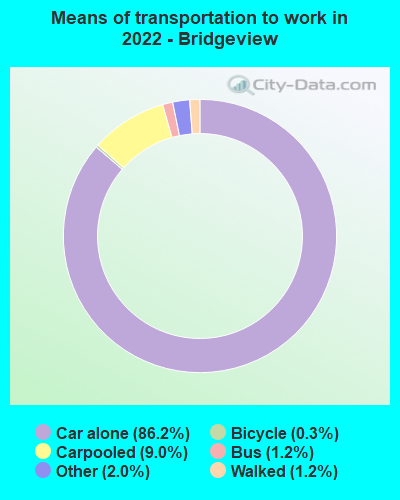
| Here: | 13.8 |
| Illinois average: | 12.5 |


Graphs represent county-level data. Detailed 2008 Election Results
Religion statistics for Bridgeview, IL (based on Cook County data)


| Religion | Adherents | Congregations |
|---|---|---|
| Catholic | 1,947,223 | 376 |
| Evangelical Protestant | 432,975 | 1,484 |
| Other | 312,636 | 403 |
| Mainline Protestant | 202,114 | 630 |
| Black Protestant | 148,895 | 395 |
| Orthodox | 53,276 | 66 |
| None | 2,097,556 | - |
Food Environment Statistics:
| Cook County: | 2.77 / 10,000 pop. |
| Illinois: | 2.24 / 10,000 pop. |
| Here: | 0.04 / 10,000 pop. |
| State: | 0.08 / 10,000 pop. |
| This county: | 0.93 / 10,000 pop. |
| State: | 0.75 / 10,000 pop. |
| Cook County: | 1.53 / 10,000 pop. |
| Illinois: | 2.61 / 10,000 pop. |
| Cook County: | 6.67 / 10,000 pop. |
| Illinois: | 6.86 / 10,000 pop. |
| Cook County: | 8.4% |
| Illinois: | 8.3% |
| This county: | 23.5% |
| Illinois: | 25.2% |
| Here: | 16.3% |
| Illinois: | 14.5% |
Health and Nutrition:
| Bridgeview: | 49.4% |
| State: | 49.5% |
| Bridgeview: | 46.2% |
| Illinois: | 47.2% |
| This city: | 28.7 |
| State: | 28.6 |
| Bridgeview: | 21.0% |
| Illinois: | 20.5% |
| Here: | 10.9% |
| Illinois: | 10.8% |
| Bridgeview: | 6.8 |
| Illinois: | 6.8 |
| Here: | 34.4% |
| Illinois: | 33.4% |
| Bridgeview: | 55.5% |
| Illinois: | 56.4% |
| Bridgeview: | 78.3% |
| Illinois: | 79.9% |
More about Health and Nutrition of Bridgeview, IL Residents
| Local government employment and payroll (March 2022) | |||||
| Function | Full-time employees | Monthly full-time payroll | Average yearly full-time wage | Part-time employees | Monthly part-time payroll |
|---|---|---|---|---|---|
| Police Protection - Officers | 38 | $339,136 | $107,096 | 8 | $16,084 |
| Firefighters | 29 | $269,658 | $111,583 | 0 | $0 |
| Financial Administration | 13 | $72,998 | $67,383 | 4 | $8,248 |
| Parks and Recreation | 10 | $38,926 | $46,711 | 2 | $2,964 |
| Other Government Administration | 10 | $87,232 | $104,678 | 7 | $14,675 |
| Other and Unallocable | 9 | $35,831 | $47,775 | 23 | $39,902 |
| Streets and Highways | 7 | $31,945 | $54,763 | 16 | $21,441 |
| Water Supply | 6 | $37,001 | $74,002 | 0 | $0 |
| Local Libraries | 6 | $24,750 | $49,500 | 6 | $5,324 |
| Sewerage | 6 | $37,001 | $74,002 | 0 | $0 |
| Police - Other | 0 | $0 | 44 | $37,156 | |
| Totals for Government | 134 | $974,478 | $87,267 | 110 | $145,794 |
Bridgeview government finances - Expenditure in 2018 (per resident):
- Construction - Central Staff Services: $771,000 ($46.82)
- Current Operations - Central Staff Services: $12,641,000 ($767.66)
Water Utilities: $4,667,000 ($283.42)
Local Fire Protection: $3,671,000 ($222.93)
Police Protection: $3,620,000 ($219.83)
Parks and Recreation: $2,736,000 ($166.15)
Regular Highways: $1,941,000 ($117.87)
General - Other: $1,364,000 ($82.83)
Libraries: $1,145,000 ($69.53)
Sewerage: $758,000 ($46.03)
- General - Interest on Debt: $14,886,000 ($903.99)
- Other Capital Outlay - Parks and Recreation: $3,141,000 ($190.75)
Police Protection: $232,000 ($14.09)
Central Staff Services: $182,000 ($11.05)
Libraries: $179,000 ($10.87)
- Total Salaries and Wages: $11,702,000 ($710.63)
Bridgeview government finances - Revenue in 2018 (per resident):
- Charges - Other: $6,300,000 ($382.58)
Sewerage: $678,000 ($41.17)
- Local Intergovernmental - Other: $2,435,000 ($147.87)
- Miscellaneous - General Revenue - Other: $1,793,000 ($108.88)
Fines and Forfeits: $609,000 ($36.98)
Interest Earnings: $14,000 ($0.85)
- Revenue - Water Utilities: $5,057,000 ($307.10)
- State Intergovernmental - General Local Government Support: $12,527,000 ($760.73)
Highways: $426,000 ($25.87)
Other: $13,000 ($0.79)
- Tax - Property: $16,397,000 ($995.75)
Other License: $870,000 ($52.83)
Other Selective Sales: $39,000 ($2.37)
Bridgeview government finances - Debt in 2018 (per resident):
- Long Term Debt - Outstanding Unspecified Public Purpose: $317,831,000 ($19301.09)
Beginning Outstanding - Unspecified Public Purpose: $300,625,000 ($18256.21)
Issue, Unspecified Public Purpose: $48,376,000 ($2937.75)
Retired Unspecified Public Purpose: $31,171,000 ($1892.94)
Bridgeview government finances - Cash and Securities in 2018 (per resident):
- Bond Funds - Cash and Securities: $12,700,000 ($771.24)
- Other Funds - Cash and Securities: $24,049,000 ($1460.44)
3.53% of this county's 2021 resident taxpayers lived in other counties in 2020 ($82,405 average adjusted gross income)
| Here: | 3.53% |
| Illinois average: | 5.09% |
0.01% of residents moved from foreign countries ($114 average AGI)
Cook County: 0.01% Illinois average: 0.01%
Top counties from which taxpayers relocated into this county between 2020 and 2021:
| from DuPage County, IL | |
| from Lake County, IL | |
| from Will County, IL |
5.44% of this county's 2020 resident taxpayers moved to other counties in 2021 ($120,340 average adjusted gross income)
| Here: | 5.44% |
| Illinois average: | 6.10% |
0.01% of residents moved to foreign countries ($140 average AGI)
Cook County: 0.01% Illinois average: 0.01%
Top counties to which taxpayers relocated from this county between 2020 and 2021:
| to DuPage County, IL | |
| to Will County, IL | |
| to Lake County, IL |
| Businesses in Bridgeview, IL | ||||
| Name | Count | Name | Count | |
|---|---|---|---|---|
| 7-Eleven | 1 | Menards | 1 | |
| AutoZone | 1 | Payless | 1 | |
| CVS | 1 | Penske | 1 | |
| Chevrolet | 1 | Pizza Hut | 1 | |
| Circle K | 1 | Popeyes | 1 | |
| Cricket Wireless | 1 | Sears | 2 | |
| Fashion Bug | 1 | Subway | 3 | |
| FedEx | 1 | Super 8 | 1 | |
| Firestone Complete Auto Care | 1 | Taco Bell | 1 | |
| Hobby Lobby | 1 | U-Haul | 1 | |
| IHOP | 1 | UPS | 1 | |
| KFC | 1 | Walgreens | 2 | |
| Kmart | 1 | Walmart | 1 | |
| MasterBrand Cabinets | 3 | Wendy's | 1 | |
| McDonald's | 3 | White Castle | 1 | |
Strongest AM radio stations in Bridgeview:
- WMVP (1000 AM; 50 kW; CHICAGO, IL; Owner: ABC, INC.)
- WLS (890 AM; 50 kW; CHICAGO, IL; Owner: WLS, INC.)
- WSCR (670 AM; 50 kW; CHICAGO, IL; Owner: INFINITY BROADCASTING OPERATIONS, INC.)
- WYLL (1160 AM; 50 kW; CHICAGO, IL; Owner: SCA LICENSE CORPORATION)
- WVIV (1200 AM; 20 kW; CHICAGO, IL; Owner: WLXX-AM LICENSE CORP.)
- WBBM (780 AM; 50 kW; CHICAGO, IL; Owner: INFINITY BROADCASTING OPERATIONS, INC.)
- WGN (720 AM; 50 kW; CHICAGO, IL; Owner: WGN CONTINENTAL BROADCASTING CO.)
- WRDZ (1300 AM; 4 kW; LA GRANGE, IL; Owner: ABC, INC.)
- WGCI (1390 AM; 5 kW; CHICAGO, IL; Owner: AMFM RADIO LICENSES, L.L.C.)
- WCSN (820 AM; 5 kW; CHICAGO, IL; Owner: WYPA, INC.)
- WNWI (1080 AM; 3 kW; OAK LAWN, IL; Owner: BIRACH BROADCASTING CORPORATION)
- WNTD (950 AM; 5 kW; CHICAGO, IL; Owner: RADIO UNICA OF CHICAGO LICENSE CORP.)
- WMBI (1110 AM; daytime; 5 kW; CHICAGO, IL; Owner: THE MOODY BIBLE INSTITUTE OF CHICAGO)
Strongest FM radio stations in Bridgeview:
- WCKG (105.9 FM; ELMWOOD PARK, IL; Owner: INFINITY HOLDINGS CORPORATION OF ORLANDO)
- WLIT-FM (93.9 FM; CHICAGO, IL; Owner: AMFM RADIO LICENSES, L.L.C.)
- WJMK (104.3 FM; CHICAGO, IL; Owner: INFINITY BROADCASTING CORP. OF ILLINOIS)
- WNUA (95.5 FM; CHICAGO, IL; Owner: AMFM RADIO LICENSES, L.L.C.)
- WTMX (101.9 FM; SKOKIE, IL; Owner: BONNEVILLE HOLDING COMPANY)
- WBBM-FM (96.3 FM; CHICAGO, IL; Owner: INFINITY BROADCASTING OPERATIONS, INC.)
- WKSC-FM (103.5 FM; CHICAGO, IL; Owner: AMFM RADIO LICENSES, L.L.C.)
- WFMT (98.7 FM; CHICAGO, IL; Owner: WINDOW TO THE WORLD COMMUNICATIONS)
- WZZN (94.7 FM; CHICAGO, IL; Owner: ABC CHICAGO FM RADIO,INC.)
- WGCI-FM (107.5 FM; CHICAGO, IL; Owner: AMFM RADIO LICENSES, L.L.C.)
- WDRV (97.1 FM; CHICAGO, IL; Owner: BONNEVILLE HOLDING COMPANY)
- WBEZ (91.5 FM; CHICAGO, IL; Owner: THE WBEZ ALLIANCE, INC.)
- WKQX (101.1 FM; CHICAGO, IL; Owner: EMMIS RADIO LICENSE CORPORATION)
- WLUP-FM (97.9 FM; CHICAGO, IL; Owner: BONNEVILLE HOLDING COMPANY)
- WNND (100.3 FM; CHICAGO, IL; Owner: BONNEVILLE HOLDING COMPANY)
- WOJO (105.1 FM; EVANSTON, IL; Owner: TICHENOR LICENSE CORPORATION ("TLC"))
- WUSN (99.5 FM; CHICAGO, IL; Owner: INFINITY BROADCASTING CORPORATION OF CHICAGO)
- WVAZ (102.7 FM; OAK PARK, IL; Owner: AMFM RADIO LICENSES, L.L.C.)
- WXRT-FM (93.1 FM; CHICAGO, IL; Owner: INFINITY BROADCASTING OPERATIONS, INC.)
- WLEY-FM (107.9 FM; AURORA, IL; Owner: WLEY LICENSING, INC.)
TV broadcast stations around Bridgeview:
- WLS-TV (Channel 7; CHICAGO, IL; Owner: WLS TELEVISION, INC.)
- WMAQ-TV (Channel 5; CHICAGO, IL; Owner: NBC SUBSIDIARY (WMAQ-TV), INC.)
- WTTW (Channel 11; CHICAGO, IL; Owner: WINDOW TO THE WORLD COMMUNICATIONS, INC.)
- WGN-TV (Channel 9; CHICAGO, IL; Owner: WGN CONTINENTAL BROADCASTING COMPANY)
- WGBO-TV (Channel 66; JOLIET, IL; Owner: WGBO LICENSE PARTNERSHIP, G.P.)
- WPWR-TV (Channel 50; GARY, IN; Owner: FOX TELEVISION STATIONS, INC.)
- WBBM-TV (Channel 2; CHICAGO, IL; Owner: CBS BROADCASTING INC.)
- WXFT (Channel 60; AURORA, IL; Owner: TELEFUTURA CHICAGO LLC)
- WCIU-TV (Channel 26; CHICAGO, IL; Owner: WCIU-TV LIMITED PARTNERSHIP)
- WCPX (Channel 38; CHICAGO, IL; Owner: PAXSON CHICAGO LICENSE, INC.)
- WFLD (Channel 32; CHICAGO, IL; Owner: FOX TELEVISION STATIONS, INC.)
- W68DO (Channel 68; PALATINE, IL; Owner: TRINITY BROADCASTING NETWORK)
- WFBT-CA (Channel 23; CHICAGO, IL; Owner: CHANNEL 23 LIMITED PARTNERSHIP)
- WJYS (Channel 62; HAMMOND, IN; Owner: JOVON BROADCASTING CORPORATION)
- WSNS-TV (Channel 44; CHICAGO, IL; Owner: TELEMUNDO OF CHICAGO, INC.)
- WOCH-LP (Channel 28; CHICAGO, IL; Owner: KM LPTV OF CHICAGO-28, L.L.C.)
- WYCC (Channel 20; CHICAGO, IL; Owner: COLLEGE DIST. #508, COUNTY OF COOK)
- WOCK-CA (Channel 13; CHICAGO, IL; Owner: KM LPTV OF CHICAGO-13, L.L.C.)
- W34CK (Channel 34; ARLINGTON HEIGHTS, IL; Owner: FIRST UNITED, INC.)
- WYIN (Channel 56; GARY, IN; Owner: NORTHWEST INDIANA PUBLIC BROADCASTING, INC.)
- W54AP (Channel 54; BLUE ISLAND, IL; Owner: CATHOLIC VIEWS BROADCASTS, INC.)
- W64CQ (Channel 64; ARLINGTON HEIGHTS, IL; Owner: TRINITY BROADCASTING NETWORK)
- W24AJ (Channel 24; AURORA, IL; Owner: NELSON TV, INC.)
- W57DN (Channel 57; ELGIN, IL; Owner: TRINITY BROADCASTING NETWORK)
- National Bridge Inventory (NBI) Statistics
- 17Number of bridges
- 180ft / 55.1mTotal length
- $3,402,000Total costs
- 499,775Total average daily traffic
- 70,712Total average daily truck traffic
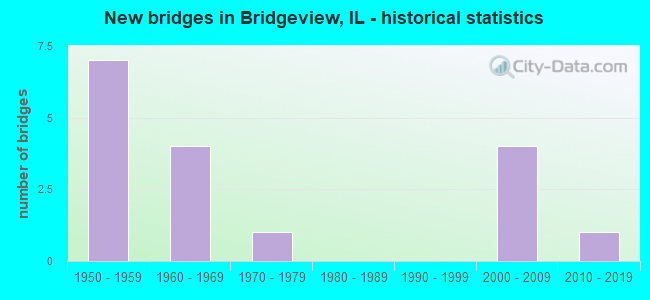
- New bridges - historical statistics
- 71950-1959
- 41960-1969
- 11970-1979
- 42000-2009
- 12010-2019
FCC Registered Antenna Towers:
51 (See the full list of FCC Registered Antenna Towers in Bridgeview)FCC Registered Broadcast Land Mobile Towers:
22 (See the full list of FCC Registered Broadcast Land Mobile Towers in Bridgeview, IL)FCC Registered Microwave Towers:
6- BRIDGEVIEW, 10220 South 76th Avenue (Lat: 41.707806 Lon: -87.811333), Type: Ltower, Structure height: 73.1 m, Overall height: 79.2 m, Call Sign: WQGU464,
Assigned Frequencies: 6226.89 MHz, 6785.00 MHz, 6226.89 MHz, 6226.89 MHz, 6785.00 MHz, 6226.89 MHz, 6785.00 MHz, 6226.89 MHz, 6785.00 MHz, 6226.89 MHz... (+3 more), Grant Date: 01/31/2017, Expiration Date: 04/18/2027, Certifier: William T Mchenry, Registrant: Cook County Sheriffs Police Department, 1401 S. Maybrook Drive, Maywood, IL 60153, Phone: (708) 865-4808, Fax: (708) 865-4899, Email:
- Toyota Park, Lat: 41.742500 Lon: -87.806667, Call Sign: WQHH364,
Assigned Frequencies: 2367.00 MHz, 2384.00 MHz, Grant Date: 07/27/2007, Expiration Date: 07/28/2007, Cancellation Date: 09/29/2007, Certifier: Paul Tobyansen, Registrant: Rf Film, Inc, 3379 Rowena Avenue, Suite 1, Los Angeles, CA 90027, Phone: (818) 713-8649, Fax: (818) 713-8649, Email:
- IL-CHI5550, 9615 S 76th Ave. (Lat: 41.717111 Lon: -87.807333), Type: Pole, Structure height: 30.5 m, Overall height: 31 m, Call Sign: WQKP748,
Assigned Frequencies: 10775.0 MHz, 10895.0 MHz, Grant Date: 08/20/2019, Expiration Date: 08/05/2029, Cancellation Date: 09/08/2021, Certifier: Nadja S Sodos-Wallace, Registrant: T-Mobile Usa, Inc., 12502 Sunrise Valley Drive, M/S: Varesa0209, Bellevue, WA 98006, Phone: (425) 383-8401, Fax: (425) 383-4840, Email:
- BRIDGEVIEW CPE, Lat: 41.738833 Lon: -87.808000, Type: Pole, Structure height: 15.2 m, Call Sign: WQMQ231,
Assigned Frequencies: 3650.00 MHz, Grant Date: 10/20/2010, Expiration Date: 02/14/2021, Cancellation Date: 03/09/2021, Certifier: Michael Pezzano, Registrant: Exelon Energy, 2900 Lord Baltimore Dr, Baltimore, MD 21244, Phone: (410) 470-8561, Fax: (410) 470-8599, Email:
- 91H, 9115 S Harlem Ave (Lat: 41.725833 Lon: -87.798472), Type: Bant, Structure height: 4 m, Overall height: 8 m, Call Sign: WQYT835,
Assigned Frequencies: 22525.0 MHz, Grant Date: 01/18/2017, Expiration Date: 01/18/2027, Cancellation Date: 06/04/2021, Certifier: Christopher W Craven, Registrant: Bob, LLC Dba Business Only Broadband, 999 Oak Creek Dr., Lombard, IL 60148, Phone: (630) 590-6006, Email:
- TS-0000030672, 7577 78th Ave (Lat: 41.754167 Lon: -87.812583), Type: Building, Structure height: 11 m, Call Sign: WRKS646,
Assigned Frequencies: 11645.0 MHz, 11645.0 MHz, 11645.0 MHz, 11645.0 MHz, Grant Date: 02/08/2021, Expiration Date: 02/08/2031, Certifier: Michael Connors, Registrant: Micronet Communications, Inc., 812 Lexington Dr, Plano, TX 75075, Phone: (972) 422-7200, Email:
FCC Registered Amateur Radio Licenses:
28 (See the full list of FCC Registered Amateur Radio Licenses in Bridgeview)FAA Registered Aircraft:
2- Aircraft: PIPER PA46-500TP (Category: Land, Seats: 6, Weight: Up to 12,499 Pounds), Engine: P&W CANADA PT6A-42A (850 HP) (Turbo-prop)
N-Number: 133PK, N133PK, N-133PK, Serial Number: 4697196, Year manufactured: 2004, Airworthiness Date: 12/12/2017, Certificate Issue Date: 09/17/2020
Registrant (Corporation): Finn And Conway Inc, 7524 W 98th Pl, Bridgeview, IL 60455 - Aircraft: BEECH 95-B55 (T42A) (Category: Land, Engines: 2, Seats: 6, Weight: Up to 12,499 Pounds, Speed: 165 mph), Engine: CONT MOTOR I0-470 SERIES (260 HP) (Reciprocating)
N-Number: 628C, N628C, N-628C, Serial Number: TC-2052, Year manufactured: 1977, Airworthiness Date: 03/24/1977, Certificate Issue Date: 09/06/1997
Registrant (Corporation): Midway Charter Inc, 7524 W 98th Pl, Bridgeview, IL 60455
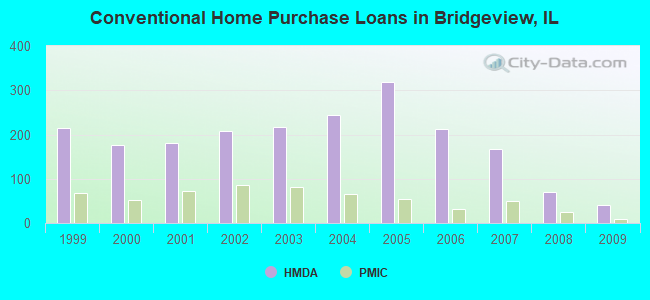
| Home Mortgage Disclosure Act Aggregated Statistics For Year 2009 (Based on 4 partial tracts) | ||||||||||||||
| A) FHA, FSA/RHS & VA Home Purchase Loans | B) Conventional Home Purchase Loans | C) Refinancings | D) Home Improvement Loans | E) Loans on Dwellings For 5+ Families | F) Non-occupant Loans on < 5 Family Dwellings (A B C & D) | G) Loans On Manufactured Home Dwelling (A B C & D) | ||||||||
|---|---|---|---|---|---|---|---|---|---|---|---|---|---|---|
| Number | Average Value | Number | Average Value | Number | Average Value | Number | Average Value | Number | Average Value | Number | Average Value | Number | Average Value | |
| LOANS ORIGINATED | 39 | $177,043 | 40 | $132,663 | 207 | $163,822 | 9 | $77,544 | 6 | $369,262 | 9 | $142,534 | 1 | $30,310 |
| APPLICATIONS APPROVED, NOT ACCEPTED | 4 | $204,920 | 2 | $105,925 | 22 | $173,146 | 3 | $9,203 | 0 | $0 | 1 | $116,560 | 1 | $34,100 |
| APPLICATIONS DENIED | 5 | $193,624 | 17 | $149,941 | 94 | $195,826 | 4 | $73,312 | 0 | $0 | 5 | $152,706 | 7 | $26,027 |
| APPLICATIONS WITHDRAWN | 6 | $180,203 | 5 | $122,080 | 41 | $200,871 | 1 | $106,090 | 0 | $0 | 6 | $168,717 | 1 | $37,260 |
| FILES CLOSED FOR INCOMPLETENESS | 3 | $174,523 | 1 | $211,550 | 20 | $201,172 | 2 | $102,495 | 0 | $0 | 2 | $119,855 | 1 | $28,420 |
Detailed HMDA statistics for the following Tracts: 8205.01 , 8205.02, 8229.00, 8237.03
| Private Mortgage Insurance Companies Aggregated Statistics For Year 2009 (Based on 4 partial tracts) | ||||
| A) Conventional Home Purchase Loans | B) Refinancings | |||
|---|---|---|---|---|
| Number | Average Value | Number | Average Value | |
| LOANS ORIGINATED | 9 | $141,702 | 6 | $230,568 |
| APPLICATIONS APPROVED, NOT ACCEPTED | 4 | $217,118 | 3 | $222,220 |
| APPLICATIONS DENIED | 4 | $181,342 | 5 | $228,988 |
| APPLICATIONS WITHDRAWN | 0 | $0 | 1 | $278,040 |
| FILES CLOSED FOR INCOMPLETENESS | 0 | $0 | 0 | $0 |
Detailed PMIC statistics for the following Tracts: 8205.01 , 8205.02, 8229.00, 8237.03
2002 - 2018 National Fire Incident Reporting System (NFIRS) incidents
- Fire incident types reported to NFIRS in Bridgeview, IL
- 1,26056.7%Structure Fires
- 54324.4%Outside Fires
- 29313.2%Mobile Property/Vehicle Fires
- 1265.7%Other
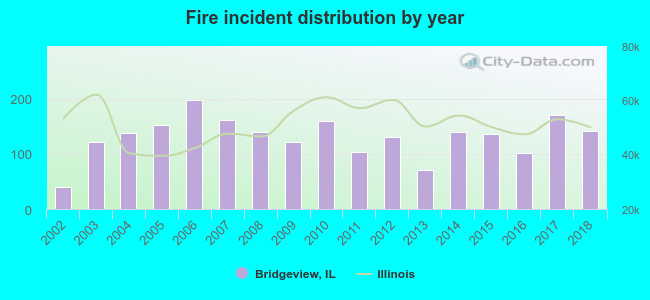 Based on the data from the years 2002 - 2018 the average number of fires per year is 131. The highest number of fire incidents - 197 took place in 2006, and the least - 39 in 2002. The data has a rising trend.
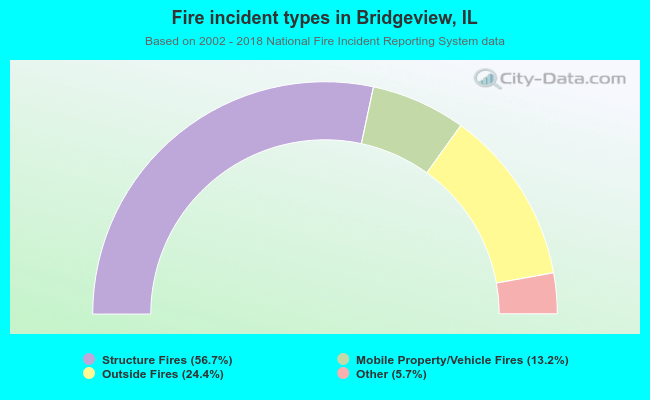 When looking into fire subcategories, the most reports belonged to: Structure Fires (56.7%), and Outside Fires (24.4%).
Fire-safe hotels and motels in Bridgeview, Illinois:
- Days Inn, 9625 S 76TH Ave, Bridgeview, Illinois 60455 , Phone: (708) 430-1818, Fax: (708) 430-1894
- Super 8 Motel, 7887 W 79TH St, Bridgeview, Illinois 60455 , Phone: (708) 458-8008, Fax: (708) 458-9248
- Clayton Motel, 7240 S Harlem Ave, Bridgeview, Illinois 60455 , Phone: (708) 458-5946
- NEW RELAX INN, 7336 S HARLEM Ave, Bridgeview, Illinois 60455 , Phone: (708) 458-1015, Fax: (708) 458-1017
| Most common first names in Bridgeview, IL among deceased individuals | ||
| Name | Count | Lived (average) |
|---|---|---|
| Mary | 187 | 80.3 years |
| John | 180 | 73.5 years |
| Joseph | 109 | 75.0 years |
| Anna | 108 | 83.6 years |
| Helen | 106 | 80.6 years |
| William | 96 | 73.6 years |
| Frank | 96 | 75.1 years |
| James | 90 | 71.7 years |
| Robert | 85 | 66.7 years |
| Charles | 81 | 73.9 years |
| Most common last names in Bridgeview, IL among deceased individuals | ||
| Last name | Count | Lived (average) |
|---|---|---|
| Johnson | 30 | 78.7 years |
| Miller | 26 | 74.3 years |
| Smith | 24 | 78.6 years |
| Thompson | 19 | 70.7 years |
| Brown | 16 | 72.5 years |
| Anderson | 14 | 75.1 years |
| Young | 12 | 81.5 years |
| Wilson | 12 | 73.9 years |
| Martin | 12 | 73.1 years |
| Kelly | 11 | 77.5 years |
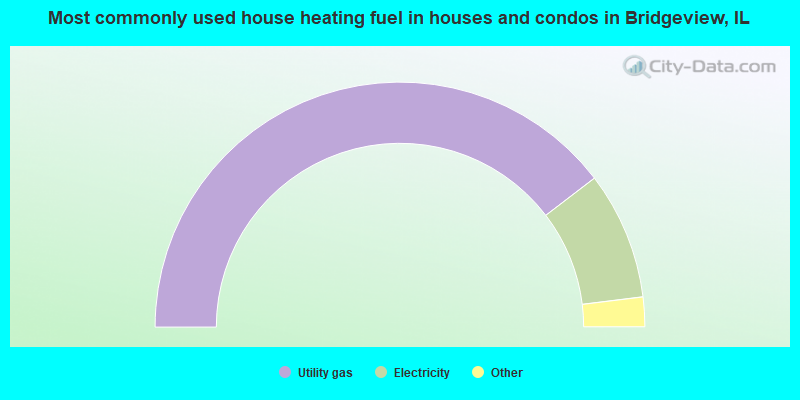
- 79.2%Utility gas
- 16.9%Electricity
- 2.6%Bottled, tank, or LP gas
- 0.8%Fuel oil, kerosene, etc.
- 0.5%Other fuel
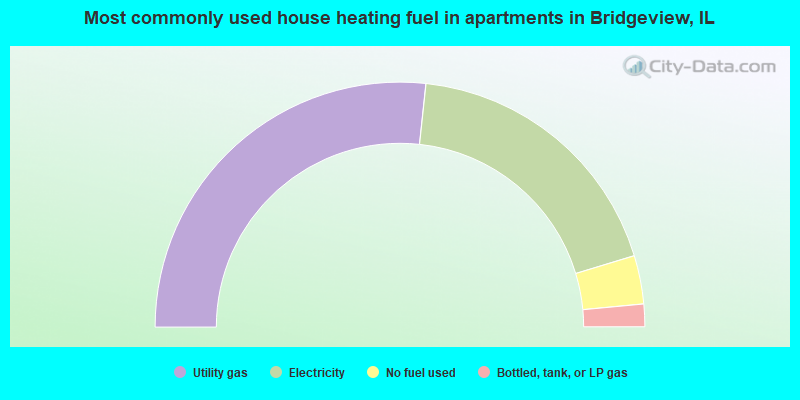
- 53.4%Utility gas
- 37.2%Electricity
- 6.4%No fuel used
- 3.0%Bottled, tank, or LP gas
Bridgeview compared to Illinois state average:
- Unemployed percentage significantly below state average.
- Black race population percentage significantly below state average.
- Hispanic race population percentage above state average.
- Foreign-born population percentage above state average.
- Length of stay since moving in significantly above state average.
- Institutionalized population percentage above state average.
Bridgeview on our top lists:
- #6 on the list of "Top 101 cities with the most residents born in Jordan (population 500+)"
- #12 on the list of "Top 101 cities with the most residents born in Poland (population 500+)"
- #15 on the list of "Top 101 cities with the most residents born in Western Asia (population 500+)"
- #18 on the list of "Top 101 cities with the most residents born in Eastern Europe (population 500+)"
- #26 on the list of "Top 101 cities with the most residents born in Europe (population 500+)"
- #76 on the list of "Top 101 cities with the largest percentage of high school students in private schools (500+ students)"
- #79 on the list of "Top 101 cities with the most residents born in Syria (population 500+)"
- #84 on the list of "Top 101 cities with the most residents born in Other Western Asia (population 500+)"
- #64 (60457) on the list of "Top 101 zip codes with the largest percentage of Arab first ancestries"
- #65 (60457) on the list of "Top 101 zip codes with the largest percentage of Lithuanian first ancestries"
- #77 (60457) on the list of "Top 101 zip codes with the largest percentage of Polish first ancestries"
- #1 on the list of "Top 101 counties with the most Black Protestant congregations"
- #1 on the list of "Top 101 counties with the most Catholic congregations"
- #1 on the list of "Top 101 counties with the highest surface withdrawal of fresh water for public supply"
- #2 on the list of "Top 101 counties with the most Black Protestant adherents"
- #2 on the list of "Top 101 counties with the most Orthodox congregations (pop. 50,000+)"

|
|
Total of 57 patent applications in 2008-2024.