Belton, Missouri Submit your own pictures of this city and show them to the world
OSM Map
General Map
Google Map
MSN Map
OSM Map
General Map
Google Map
MSN Map
OSM Map
General Map
Google Map
MSN Map
OSM Map
General Map
Google Map
MSN Map
Please wait while loading the map...
Population in 2022: 25,420 (98% urban, 2% rural). Population change since 2000: +17.0%Males: 11,907 Females: 13,513
March 2022 cost of living index in Belton: 86.7 (less than average, U.S. average is 100) Percentage of residents living in poverty in 2022: 8.9%for White Non-Hispanic residents , 23.4% for Black residents , 6.7% for Hispanic or Latino residents , 9.3% for Native Hawaiian and other Pacific Islander residents , 3.1% for other race residents , 6.7% for two or more races residents )
Profiles of local businesses
Business Search - 14 Million verified businesses
Data:
Median household income ($)
Median household income (% change since 2000)
Household income diversity
Ratio of average income to average house value (%)
Ratio of average income to average rent
Median household income ($) - White
Median household income ($) - Black or African American
Median household income ($) - Asian
Median household income ($) - Hispanic or Latino
Median household income ($) - American Indian and Alaska Native
Median household income ($) - Multirace
Median household income ($) - Other Race
Median household income for houses/condos with a mortgage ($)
Median household income for apartments without a mortgage ($)
Races - White alone (%)
Races - White alone (% change since 2000)
Races - Black alone (%)
Races - Black alone (% change since 2000)
Races - American Indian alone (%)
Races - American Indian alone (% change since 2000)
Races - Asian alone (%)
Races - Asian alone (% change since 2000)
Races - Hispanic (%)
Races - Hispanic (% change since 2000)
Races - Native Hawaiian and Other Pacific Islander alone (%)
Races - Native Hawaiian and Other Pacific Islander alone (% change since 2000)
Races - Two or more races (%)
Races - Two or more races (% change since 2000)
Races - Other race alone (%)
Races - Other race alone (% change since 2000)
Racial diversity
Unemployment (%)
Unemployment (% change since 2000)
Unemployment (%) - White
Unemployment (%) - Black or African American
Unemployment (%) - Asian
Unemployment (%) - Hispanic or Latino
Unemployment (%) - American Indian and Alaska Native
Unemployment (%) - Multirace
Unemployment (%) - Other Race
Population density (people per square mile)
Population - Males (%)
Population - Females (%)
Population - Males (%) - White
Population - Males (%) - Black or African American
Population - Males (%) - Asian
Population - Males (%) - Hispanic or Latino
Population - Males (%) - American Indian and Alaska Native
Population - Males (%) - Multirace
Population - Males (%) - Other Race
Population - Females (%) - White
Population - Females (%) - Black or African American
Population - Females (%) - Asian
Population - Females (%) - Hispanic or Latino
Population - Females (%) - American Indian and Alaska Native
Population - Females (%) - Multirace
Population - Females (%) - Other Race
Coronavirus confirmed cases (May 16, 2024)
Deaths caused by coronavirus (May 16, 2024)
Coronavirus confirmed cases (per 100k population) (May 16, 2024)
Deaths caused by coronavirus (per 100k population) (May 16, 2024)
Daily increase in number of cases (May 16, 2024)
Weekly increase in number of cases (May 16, 2024)
Cases doubled (in days) (May 16, 2024)
Hospitalized patients (Apr 18, 2022)
Negative test results (Apr 18, 2022)
Total test results (Apr 18, 2022)
COVID Vaccine doses distributed (per 100k population) (Sep 19, 2023)
COVID Vaccine doses administered (per 100k population) (Sep 19, 2023)
COVID Vaccine doses distributed (Sep 19, 2023)
COVID Vaccine doses administered (Sep 19, 2023)
Likely homosexual households (%)
Likely homosexual households (% change since 2000)
Likely homosexual households - Lesbian couples (%)
Likely homosexual households - Lesbian couples (% change since 2000)
Likely homosexual households - Gay men (%)
Likely homosexual households - Gay men (% change since 2000)
Cost of living index
Median gross rent ($)
Median contract rent ($)
Median monthly housing costs ($)
Median house or condo value ($)
Median house or condo value ($ change since 2000)
Mean house or condo value by units in structure - 1, detached ($)
Mean house or condo value by units in structure - 1, attached ($)
Mean house or condo value by units in structure - 2 ($)
Mean house or condo value by units in structure by units in structure - 3 or 4 ($)
Mean house or condo value by units in structure - 5 or more ($)
Mean house or condo value by units in structure - Boat, RV, van, etc. ($)
Mean house or condo value by units in structure - Mobile home ($)
Median house or condo value ($) - White
Median house or condo value ($) - Black or African American
Median house or condo value ($) - Asian
Median house or condo value ($) - Hispanic or Latino
Median house or condo value ($) - American Indian and Alaska Native
Median house or condo value ($) - Multirace
Median house or condo value ($) - Other Race
Median resident age
Resident age diversity
Median resident age - Males
Median resident age - Females
Median resident age - White
Median resident age - Black or African American
Median resident age - Asian
Median resident age - Hispanic or Latino
Median resident age - American Indian and Alaska Native
Median resident age - Multirace
Median resident age - Other Race
Median resident age - Males - White
Median resident age - Males - Black or African American
Median resident age - Males - Asian
Median resident age - Males - Hispanic or Latino
Median resident age - Males - American Indian and Alaska Native
Median resident age - Males - Multirace
Median resident age - Males - Other Race
Median resident age - Females - White
Median resident age - Females - Black or African American
Median resident age - Females - Asian
Median resident age - Females - Hispanic or Latino
Median resident age - Females - American Indian and Alaska Native
Median resident age - Females - Multirace
Median resident age - Females - Other Race
Commute - mean travel time to work (minutes)
Travel time to work - Less than 5 minutes (%)
Travel time to work - Less than 5 minutes (% change since 2000)
Travel time to work - 5 to 9 minutes (%)
Travel time to work - 5 to 9 minutes (% change since 2000)
Travel time to work - 10 to 19 minutes (%)
Travel time to work - 10 to 19 minutes (% change since 2000)
Travel time to work - 20 to 29 minutes (%)
Travel time to work - 20 to 29 minutes (% change since 2000)
Travel time to work - 30 to 39 minutes (%)
Travel time to work - 30 to 39 minutes (% change since 2000)
Travel time to work - 40 to 59 minutes (%)
Travel time to work - 40 to 59 minutes (% change since 2000)
Travel time to work - 60 to 89 minutes (%)
Travel time to work - 60 to 89 minutes (% change since 2000)
Travel time to work - 90 or more minutes (%)
Travel time to work - 90 or more minutes (% change since 2000)
Marital status - Never married (%)
Marital status - Now married (%)
Marital status - Separated (%)
Marital status - Widowed (%)
Marital status - Divorced (%)
Median family income ($)
Median family income (% change since 2000)
Median non-family income ($)
Median non-family income (% change since 2000)
Median per capita income ($)
Median per capita income (% change since 2000)
Median family income ($) - White
Median family income ($) - Black or African American
Median family income ($) - Asian
Median family income ($) - Hispanic or Latino
Median family income ($) - American Indian and Alaska Native
Median family income ($) - Multirace
Median family income ($) - Other Race
Median year house/condo built
Median year apartment built
Year house built - Built 2005 or later (%)
Year house built - Built 2000 to 2004 (%)
Year house built - Built 1990 to 1999 (%)
Year house built - Built 1980 to 1989 (%)
Year house built - Built 1970 to 1979 (%)
Year house built - Built 1960 to 1969 (%)
Year house built - Built 1950 to 1959 (%)
Year house built - Built 1940 to 1949 (%)
Year house built - Built 1939 or earlier (%)
Average household size
Household density (households per square mile)
Average household size - White
Average household size - Black or African American
Average household size - Asian
Average household size - Hispanic or Latino
Average household size - American Indian and Alaska Native
Average household size - Multirace
Average household size - Other Race
Occupied housing units (%)
Vacant housing units (%)
Owner occupied housing units (%)
Renter occupied housing units (%)
Vacancy status - For rent (%)
Vacancy status - For sale only (%)
Vacancy status - Rented or sold, not occupied (%)
Vacancy status - For seasonal, recreational, or occasional use (%)
Vacancy status - For migrant workers (%)
Vacancy status - Other vacant (%)
Residents with income below the poverty level (%)
Residents with income below 50% of the poverty level (%)
Children below poverty level (%)
Poor families by family type - Married-couple family (%)
Poor families by family type - Male, no wife present (%)
Poor families by family type - Female, no husband present (%)
Poverty status for native-born residents (%)
Poverty status for foreign-born residents (%)
Poverty among high school graduates not in families (%)
Poverty among people who did not graduate high school not in families (%)
Residents with income below the poverty level (%) - White
Residents with income below the poverty level (%) - Black or African American
Residents with income below the poverty level (%) - Asian
Residents with income below the poverty level (%) - Hispanic or Latino
Residents with income below the poverty level (%) - American Indian and Alaska Native
Residents with income below the poverty level (%) - Multirace
Residents with income below the poverty level (%) - Other Race
Air pollution - Air Quality Index (AQI)
Air pollution - CO
Air pollution - NO2
Air pollution - SO2
Air pollution - Ozone
Air pollution - PM10
Air pollution - PM25
Air pollution - Pb
Crime - Murders per 100,000 population
Crime - Rapes per 100,000 population
Crime - Robberies per 100,000 population
Crime - Assaults per 100,000 population
Crime - Burglaries per 100,000 population
Crime - Thefts per 100,000 population
Crime - Auto thefts per 100,000 population
Crime - Arson per 100,000 population
Crime - City-data.com crime index
Crime - Violent crime index
Crime - Property crime index
Crime - Murders per 100,000 population (5 year average)
Crime - Rapes per 100,000 population (5 year average)
Crime - Robberies per 100,000 population (5 year average)
Crime - Assaults per 100,000 population (5 year average)
Crime - Burglaries per 100,000 population (5 year average)
Crime - Thefts per 100,000 population (5 year average)
Crime - Auto thefts per 100,000 population (5 year average)
Crime - Arson per 100,000 population (5 year average)
Crime - City-data.com crime index (5 year average)
Crime - Violent crime index (5 year average)
Crime - Property crime index (5 year average)
1996 Presidential Elections Results (%) - Democratic Party (Clinton)
1996 Presidential Elections Results (%) - Republican Party (Dole)
1996 Presidential Elections Results (%) - Other
2000 Presidential Elections Results (%) - Democratic Party (Gore)
2000 Presidential Elections Results (%) - Republican Party (Bush)
2000 Presidential Elections Results (%) - Other
2004 Presidential Elections Results (%) - Democratic Party (Kerry)
2004 Presidential Elections Results (%) - Republican Party (Bush)
2004 Presidential Elections Results (%) - Other
2008 Presidential Elections Results (%) - Democratic Party (Obama)
2008 Presidential Elections Results (%) - Republican Party (McCain)
2008 Presidential Elections Results (%) - Other
2012 Presidential Elections Results (%) - Democratic Party (Obama)
2012 Presidential Elections Results (%) - Republican Party (Romney)
2012 Presidential Elections Results (%) - Other
2016 Presidential Elections Results (%) - Democratic Party (Clinton)
2016 Presidential Elections Results (%) - Republican Party (Trump)
2016 Presidential Elections Results (%) - Other
2020 Presidential Elections Results (%) - Democratic Party (Biden)
2020 Presidential Elections Results (%) - Republican Party (Trump)
2020 Presidential Elections Results (%) - Other
Ancestries Reported - Arab (%)
Ancestries Reported - Czech (%)
Ancestries Reported - Danish (%)
Ancestries Reported - Dutch (%)
Ancestries Reported - English (%)
Ancestries Reported - French (%)
Ancestries Reported - French Canadian (%)
Ancestries Reported - German (%)
Ancestries Reported - Greek (%)
Ancestries Reported - Hungarian (%)
Ancestries Reported - Irish (%)
Ancestries Reported - Italian (%)
Ancestries Reported - Lithuanian (%)
Ancestries Reported - Norwegian (%)
Ancestries Reported - Polish (%)
Ancestries Reported - Portuguese (%)
Ancestries Reported - Russian (%)
Ancestries Reported - Scotch-Irish (%)
Ancestries Reported - Scottish (%)
Ancestries Reported - Slovak (%)
Ancestries Reported - Subsaharan African (%)
Ancestries Reported - Swedish (%)
Ancestries Reported - Swiss (%)
Ancestries Reported - Ukrainian (%)
Ancestries Reported - United States (%)
Ancestries Reported - Welsh (%)
Ancestries Reported - West Indian (%)
Ancestries Reported - Other (%)
Educational Attainment - No schooling completed (%)
Educational Attainment - Less than high school (%)
Educational Attainment - High school or equivalent (%)
Educational Attainment - Less than 1 year of college (%)
Educational Attainment - 1 or more years of college (%)
Educational Attainment - Associate degree (%)
Educational Attainment - Bachelor's degree (%)
Educational Attainment - Master's degree (%)
Educational Attainment - Professional school degree (%)
Educational Attainment - Doctorate degree (%)
School Enrollment - Nursery, preschool (%)
School Enrollment - Kindergarten (%)
School Enrollment - Grade 1 to 4 (%)
School Enrollment - Grade 5 to 8 (%)
School Enrollment - Grade 9 to 12 (%)
School Enrollment - College undergrad (%)
School Enrollment - Graduate or professional (%)
School Enrollment - Not enrolled in school (%)
School enrollment - Public schools (%)
School enrollment - Private schools (%)
School enrollment - Not enrolled (%)
Median number of rooms in houses and condos
Median number of rooms in apartments
Housing units lacking complete plumbing facilities (%)
Housing units lacking complete kitchen facilities (%)
Density of houses
Urban houses (%)
Rural houses (%)
Households with people 60 years and over (%)
Households with people 65 years and over (%)
Households with people 75 years and over (%)
Households with one or more nonrelatives (%)
Households with no nonrelatives (%)
Population in households (%)
Family households (%)
Nonfamily households (%)
Population in families (%)
Family households with own children (%)
Median number of bedrooms in owner occupied houses
Mean number of bedrooms in owner occupied houses
Median number of bedrooms in renter occupied houses
Mean number of bedrooms in renter occupied houses
Median number of vehichles in owner occupied houses
Mean number of vehichles in owner occupied houses
Median number of vehichles in renter occupied houses
Mean number of vehichles in renter occupied houses
Mortgage status - with mortgage (%)
Mortgage status - with second mortgage (%)
Mortgage status - with home equity loan (%)
Mortgage status - with both second mortgage and home equity loan (%)
Mortgage status - without a mortgage (%)
Average family size
Average family size - White
Average family size - Black or African American
Average family size - Asian
Average family size - Hispanic or Latino
Average family size - American Indian and Alaska Native
Average family size - Multirace
Average family size - Other Race
Geographical mobility - Same house 1 year ago (%)
Geographical mobility - Moved within same county (%)
Geographical mobility - Moved from different county within same state (%)
Geographical mobility - Moved from different state (%)
Geographical mobility - Moved from abroad (%)
Place of birth - Born in state of residence (%)
Place of birth - Born in other state (%)
Place of birth - Native, outside of US (%)
Place of birth - Foreign born (%)
Housing units in structures - 1, detached (%)
Housing units in structures - 1, attached (%)
Housing units in structures - 2 (%)
Housing units in structures - 3 or 4 (%)
Housing units in structures - 5 to 9 (%)
Housing units in structures - 10 to 19 (%)
Housing units in structures - 20 to 49 (%)
Housing units in structures - 50 or more (%)
Housing units in structures - Mobile home (%)
Housing units in structures - Boat, RV, van, etc. (%)
House/condo owner moved in on average (years ago)
Renter moved in on average (years ago)
Year householder moved into unit - Moved in 1999 to March 2000 (%)
Year householder moved into unit - Moved in 1995 to 1998 (%)
Year householder moved into unit - Moved in 1990 to 1994 (%)
Year householder moved into unit - Moved in 1980 to 1989 (%)
Year householder moved into unit - Moved in 1970 to 1979 (%)
Year householder moved into unit - Moved in 1969 or earlier (%)
Means of transportation to work - Drove car alone (%)
Means of transportation to work - Carpooled (%)
Means of transportation to work - Public transportation (%)
Means of transportation to work - Bus or trolley bus (%)
Means of transportation to work - Streetcar or trolley car (%)
Means of transportation to work - Subway or elevated (%)
Means of transportation to work - Railroad (%)
Means of transportation to work - Ferryboat (%)
Means of transportation to work - Taxicab (%)
Means of transportation to work - Motorcycle (%)
Means of transportation to work - Bicycle (%)
Means of transportation to work - Walked (%)
Means of transportation to work - Other means (%)
Working at home (%)
Industry diversity
Most Common Industries - Agriculture, forestry, fishing and hunting, and mining (%)
Most Common Industries - Agriculture, forestry, fishing and hunting (%)
Most Common Industries - Mining, quarrying, and oil and gas extraction (%)
Most Common Industries - Construction (%)
Most Common Industries - Manufacturing (%)
Most Common Industries - Wholesale trade (%)
Most Common Industries - Retail trade (%)
Most Common Industries - Transportation and warehousing, and utilities (%)
Most Common Industries - Transportation and warehousing (%)
Most Common Industries - Utilities (%)
Most Common Industries - Information (%)
Most Common Industries - Finance and insurance, and real estate and rental and leasing (%)
Most Common Industries - Finance and insurance (%)
Most Common Industries - Real estate and rental and leasing (%)
Most Common Industries - Professional, scientific, and management, and administrative and waste management services (%)
Most Common Industries - Professional, scientific, and technical services (%)
Most Common Industries - Management of companies and enterprises (%)
Most Common Industries - Administrative and support and waste management services (%)
Most Common Industries - Educational services, and health care and social assistance (%)
Most Common Industries - Educational services (%)
Most Common Industries - Health care and social assistance (%)
Most Common Industries - Arts, entertainment, and recreation, and accommodation and food services (%)
Most Common Industries - Arts, entertainment, and recreation (%)
Most Common Industries - Accommodation and food services (%)
Most Common Industries - Other services, except public administration (%)
Most Common Industries - Public administration (%)
Occupation diversity
Most Common Occupations - Management, business, science, and arts occupations (%)
Most Common Occupations - Management, business, and financial occupations (%)
Most Common Occupations - Management occupations (%)
Most Common Occupations - Business and financial operations occupations (%)
Most Common Occupations - Computer, engineering, and science occupations (%)
Most Common Occupations - Computer and mathematical occupations (%)
Most Common Occupations - Architecture and engineering occupations (%)
Most Common Occupations - Life, physical, and social science occupations (%)
Most Common Occupations - Education, legal, community service, arts, and media occupations (%)
Most Common Occupations - Community and social service occupations (%)
Most Common Occupations - Legal occupations (%)
Most Common Occupations - Education, training, and library occupations (%)
Most Common Occupations - Arts, design, entertainment, sports, and media occupations (%)
Most Common Occupations - Healthcare practitioners and technical occupations (%)
Most Common Occupations - Health diagnosing and treating practitioners and other technical occupations (%)
Most Common Occupations - Health technologists and technicians (%)
Most Common Occupations - Service occupations (%)
Most Common Occupations - Healthcare support occupations (%)
Most Common Occupations - Protective service occupations (%)
Most Common Occupations - Fire fighting and prevention, and other protective service workers including supervisors (%)
Most Common Occupations - Law enforcement workers including supervisors (%)
Most Common Occupations - Food preparation and serving related occupations (%)
Most Common Occupations - Building and grounds cleaning and maintenance occupations (%)
Most Common Occupations - Personal care and service occupations (%)
Most Common Occupations - Sales and office occupations (%)
Most Common Occupations - Sales and related occupations (%)
Most Common Occupations - Office and administrative support occupations (%)
Most Common Occupations - Natural resources, construction, and maintenance occupations (%)
Most Common Occupations - Farming, fishing, and forestry occupations (%)
Most Common Occupations - Construction and extraction occupations (%)
Most Common Occupations - Installation, maintenance, and repair occupations (%)
Most Common Occupations - Production, transportation, and material moving occupations (%)
Most Common Occupations - Production occupations (%)
Most Common Occupations - Transportation occupations (%)
Most Common Occupations - Material moving occupations (%)
People in Group quarters - Institutionalized population (%)
People in Group quarters - Correctional institutions (%)
People in Group quarters - Federal prisons and detention centers (%)
People in Group quarters - Halfway houses (%)
People in Group quarters - Local jails and other confinement facilities (including police lockups) (%)
People in Group quarters - Military disciplinary barracks (%)
People in Group quarters - State prisons (%)
People in Group quarters - Other types of correctional institutions (%)
People in Group quarters - Nursing homes (%)
People in Group quarters - Hospitals/wards, hospices, and schools for the handicapped (%)
People in Group quarters - Hospitals/wards and hospices for chronically ill (%)
People in Group quarters - Hospices or homes for chronically ill (%)
People in Group quarters - Military hospitals or wards for chronically ill (%)
People in Group quarters - Other hospitals or wards for chronically ill (%)
People in Group quarters - Hospitals or wards for drug/alcohol abuse (%)
People in Group quarters - Mental (Psychiatric) hospitals or wards (%)
People in Group quarters - Schools, hospitals, or wards for the mentally retarded (%)
People in Group quarters - Schools, hospitals, or wards for the physically handicapped (%)
People in Group quarters - Institutions for the deaf (%)
People in Group quarters - Institutions for the blind (%)
People in Group quarters - Orthopedic wards and institutions for the physically handicapped (%)
People in Group quarters - Wards in general hospitals for patients who have no usual home elsewhere (%)
People in Group quarters - Wards in military hospitals for patients who have no usual home elsewhere (%)
People in Group quarters - Juvenile institutions (%)
People in Group quarters - Long-term care (%)
People in Group quarters - Homes for abused, dependent, and neglected children (%)
People in Group quarters - Residential treatment centers for emotionally disturbed children (%)
People in Group quarters - Training schools for juvenile delinquents (%)
People in Group quarters - Short-term care, detention or diagnostic centers for delinquent children (%)
People in Group quarters - Type of juvenile institution unknown (%)
People in Group quarters - Noninstitutionalized population (%)
People in Group quarters - College dormitories (includes college quarters off campus) (%)
People in Group quarters - Military quarters (%)
People in Group quarters - On base (%)
People in Group quarters - Barracks, unaccompanied personnel housing (UPH), (Enlisted/Officer), ;and similar group living quarters for military personnel (%)
People in Group quarters - Transient quarters for temporary residents (%)
People in Group quarters - Military ships (%)
People in Group quarters - Group homes (%)
People in Group quarters - Homes or halfway houses for drug/alcohol abuse (%)
People in Group quarters - Homes for the mentally ill (%)
People in Group quarters - Homes for the mentally retarded (%)
People in Group quarters - Homes for the physically handicapped (%)
People in Group quarters - Other group homes (%)
People in Group quarters - Religious group quarters (%)
People in Group quarters - Dormitories (%)
People in Group quarters - Agriculture workers' dormitories on farms (%)
People in Group quarters - Job Corps and vocational training facilities (%)
People in Group quarters - Other workers' dormitories (%)
People in Group quarters - Crews of maritime vessels (%)
People in Group quarters - Other nonhousehold living situations (%)
People in Group quarters - Other noninstitutional group quarters (%)
Residents speaking English at home (%)
Residents speaking English at home - Born in the United States (%)
Residents speaking English at home - Native, born elsewhere (%)
Residents speaking English at home - Foreign born (%)
Residents speaking Spanish at home (%)
Residents speaking Spanish at home - Born in the United States (%)
Residents speaking Spanish at home - Native, born elsewhere (%)
Residents speaking Spanish at home - Foreign born (%)
Residents speaking other language at home (%)
Residents speaking other language at home - Born in the United States (%)
Residents speaking other language at home - Native, born elsewhere (%)
Residents speaking other language at home - Foreign born (%)
Class of Workers - Employee of private company (%)
Class of Workers - Self-employed in own incorporated business (%)
Class of Workers - Private not-for-profit wage and salary workers (%)
Class of Workers - Local government workers (%)
Class of Workers - State government workers (%)
Class of Workers - Federal government workers (%)
Class of Workers - Self-employed workers in own not incorporated business and Unpaid family workers (%)
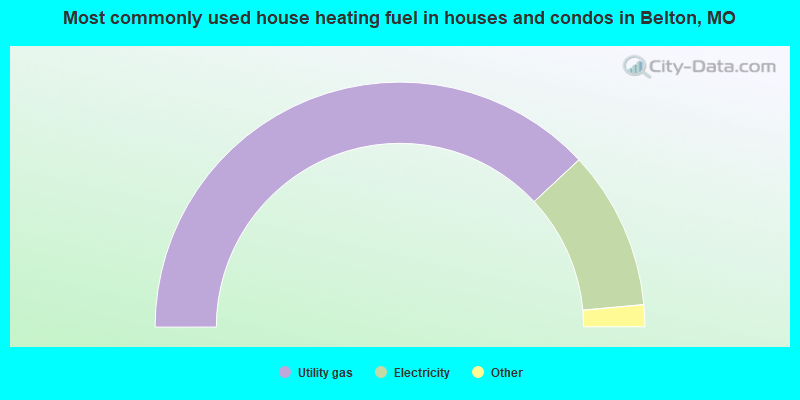
House heating fuel used in houses and condos - Utility gas (%)
House heating fuel used in houses and condos - Bottled, tank, or LP gas (%)
House heating fuel used in houses and condos - Electricity (%)
House heating fuel used in houses and condos - Fuel oil, kerosene, etc. (%)
House heating fuel used in houses and condos - Coal or coke (%)
House heating fuel used in houses and condos - Wood (%)
House heating fuel used in houses and condos - Solar energy (%)
House heating fuel used in houses and condos - Other fuel (%)
House heating fuel used in houses and condos - No fuel used (%)
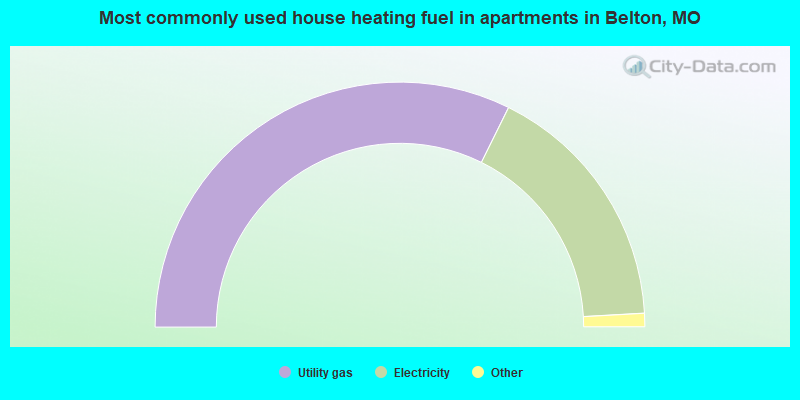
House heating fuel used in apartments - Utility gas (%)
House heating fuel used in apartments - Bottled, tank, or LP gas (%)
House heating fuel used in apartments - Electricity (%)
House heating fuel used in apartments - Fuel oil, kerosene, etc. (%)
House heating fuel used in apartments - Coal or coke (%)
House heating fuel used in apartments - Wood (%)
House heating fuel used in apartments - Solar energy (%)
House heating fuel used in apartments - Other fuel (%)
House heating fuel used in apartments - No fuel used (%)
Armed forces status - In Armed Forces (%)
Armed forces status - Civilian (%)
Armed forces status - Civilian - Veteran (%)
Armed forces status - Civilian - Nonveteran (%)
Fatal accidents locations in years 2005-2021
Fatal accidents locations in 2005
Fatal accidents locations in 2006
Fatal accidents locations in 2007
Fatal accidents locations in 2008
Fatal accidents locations in 2009
Fatal accidents locations in 2010
Fatal accidents locations in 2011
Fatal accidents locations in 2012
Fatal accidents locations in 2013
Fatal accidents locations in 2014
Fatal accidents locations in 2015
Fatal accidents locations in 2016
Fatal accidents locations in 2017
Fatal accidents locations in 2018
Fatal accidents locations in 2019
Fatal accidents locations in 2020
Fatal accidents locations in 2021
Alcohol use - People drinking some alcohol every month (%)
Alcohol use - People not drinking at all (%)
Alcohol use - Average days/month drinking alcohol
Alcohol use - Average drinks/week
Alcohol use - Average days/year people drink much
Audiometry - Average condition of hearing (%)
Audiometry - People that can hear a whisper from across a quiet room (%)
Audiometry - People that can hear normal voice from across a quiet room (%)
Audiometry - Ears ringing, roaring, buzzing (%)
Audiometry - Had a job exposure to loud noise (%)
Audiometry - Had off-work exposure to loud noise (%)
Blood Pressure & Cholesterol - Has high blood pressure (%)
Blood Pressure & Cholesterol - Checking blood pressure at home (%)
Blood Pressure & Cholesterol - Frequently checking blood cholesterol (%)
Blood Pressure & Cholesterol - Has high cholesterol level (%)
Consumer Behavior - Money monthly spent on food at supermarket/grocery store
Consumer Behavior - Money monthly spent on food at other stores
Consumer Behavior - Money monthly spent on eating out
Consumer Behavior - Money monthly spent on carryout/delivered foods
Consumer Behavior - Income spent on food at supermarket/grocery store (%)
Consumer Behavior - Income spent on food at other stores (%)
Consumer Behavior - Income spent on eating out (%)
Consumer Behavior - Income spent on carryout/delivered foods (%)
Current Health Status - General health condition (%)
Current Health Status - Blood donors (%)
Current Health Status - Has blood ever tested for HIV virus (%)
Current Health Status - Left-handed people (%)
Dermatology - People using sunscreen (%)
Diabetes - Diabetics (%)
Diabetes - Had a blood test for high blood sugar (%)
Diabetes - People taking insulin (%)
Diet Behavior & Nutrition - Diet health (%)
Diet Behavior & Nutrition - Milk product consumption (# of products/month)
Diet Behavior & Nutrition - Meals not home prepared (#/week)
Diet Behavior & Nutrition - Meals from fast food or pizza place (#/week)
Diet Behavior & Nutrition - Ready-to-eat foods (#/month)
Diet Behavior & Nutrition - Frozen meals/pizza (#/month)
Drug Use - People that ever used marijuana or hashish (%)
Drug Use - Ever used hard drugs (%)
Drug Use - Ever used any form of cocaine (%)
Drug Use - Ever used heroin (%)
Drug Use - Ever used methamphetamine (%)
Health Insurance - People covered by health insurance (%)
Kidney Conditions-Urology - Avg. # of times urinating at night
Medical Conditions - People with asthma (%)
Medical Conditions - People with anemia (%)
Medical Conditions - People with psoriasis (%)
Medical Conditions - People with overweight (%)
Medical Conditions - Elderly people having difficulties in thinking or remembering (%)
Medical Conditions - People who ever received blood transfusion (%)
Medical Conditions - People having trouble seeing even with glass/contacts (%)
Medical Conditions - People with arthritis (%)
Medical Conditions - People with gout (%)
Medical Conditions - People with congestive heart failure (%)
Medical Conditions - People with coronary heart disease (%)
Medical Conditions - People with angina pectoris (%)
Medical Conditions - People who ever had heart attack (%)
Medical Conditions - People who ever had stroke (%)
Medical Conditions - People with emphysema (%)
Medical Conditions - People with thyroid problem (%)
Medical Conditions - People with chronic bronchitis (%)
Medical Conditions - People with any liver condition (%)
Medical Conditions - People who ever had cancer or malignancy (%)
Mental Health - People who have little interest in doing things (%)
Mental Health - People feeling down, depressed, or hopeless (%)
Mental Health - People who have trouble sleeping or sleeping too much (%)
Mental Health - People feeling tired or having little energy (%)
Mental Health - People with poor appetite or overeating (%)
Mental Health - People feeling bad about themself (%)
Mental Health - People who have trouble concentrating on things (%)
Mental Health - People moving or speaking slowly or too fast (%)
Mental Health - People having thoughts they would be better off dead (%)
Oral Health - Average years since last visit a dentist
Oral Health - People embarrassed because of mouth (%)
Oral Health - People with gum disease (%)
Oral Health - General health of teeth and gums (%)
Oral Health - Average days a week using dental floss/device
Oral Health - Average days a week using mouthwash for dental problem
Oral Health - Average number of teeth
Pesticide Use - Households using pesticides to control insects (%)
Pesticide Use - Households using pesticides to kill weeds (%)
Physical Activity - People doing vigorous-intensity work activities (%)
Physical Activity - People doing moderate-intensity work activities (%)
Physical Activity - People walking or bicycling (%)
Physical Activity - People doing vigorous-intensity recreational activities (%)
Physical Activity - People doing moderate-intensity recreational activities (%)
Physical Activity - Average hours a day doing sedentary activities
Physical Activity - Average hours a day watching TV or videos
Physical Activity - Average hours a day using computer
Physical Functioning - People having limitations keeping them from working (%)
Physical Functioning - People limited in amount of work they can do (%)
Physical Functioning - People that need special equipment to walk (%)
Physical Functioning - People experiencing confusion/memory problems (%)
Physical Functioning - People requiring special healthcare equipment (%)
Prescription Medications - Average number of prescription medicines taking
Preventive Aspirin Use - Adults 40+ taking low-dose aspirin (%)
Reproductive Health - Vaginal deliveries (%)
Reproductive Health - Cesarean deliveries (%)
Reproductive Health - Deliveries resulted in a live birth (%)
Reproductive Health - Pregnancies resulted in a delivery (%)
Reproductive Health - Women breastfeeding newborns (%)
Reproductive Health - Women that had a hysterectomy (%)
Reproductive Health - Women that had both ovaries removed (%)
Reproductive Health - Women that have ever taken birth control pills (%)
Reproductive Health - Women taking birth control pills (%)
Reproductive Health - Women that have ever used Depo-Provera or injectables (%)
Reproductive Health - Women that have ever used female hormones (%)
Sexual Behavior - People 18+ that ever had sex (vaginal, anal, or oral) (%)
Sexual Behavior - Males 18+ that ever had vaginal sex with a woman (%)
Sexual Behavior - Males 18+ that ever performed oral sex on a woman (%)
Sexual Behavior - Males 18+ that ever had anal sex with a woman (%)
Sexual Behavior - Males 18+ that ever had any sex with a man (%)
Sexual Behavior - Females 18+ that ever had vaginal sex with a man (%)
Sexual Behavior - Females 18+ that ever performed oral sex on a man (%)
Sexual Behavior - Females 18+ that ever had anal sex with a man (%)
Sexual Behavior - Females 18+ that ever had any kind of sex with a woman (%)
Sexual Behavior - Average age people first had sex
Sexual Behavior - Average number of female sex partners in lifetime (males 18+)
Sexual Behavior - Average number of female vaginal sex partners in lifetime (males 18+)
Sexual Behavior - Average age people first performed oral sex on a woman (18+)
Sexual Behavior - Average number of woman performed oral sex on in lifetime (18+)
Sexual Behavior - Average number of male sex partners in lifetime (males 18+)
Sexual Behavior - Average number of male anal sex partners in lifetime (males 18+)
Sexual Behavior - Average age people first performed oral sex on a man (18+)
Sexual Behavior - Average number of male oral sex partners in lifetime (18+)
Sexual Behavior - People using protection when performing oral sex (%)
Sexual Behavior - Average number of times people have vaginal or anal sex a year
Sexual Behavior - People having sex without condom (%)
Sexual Behavior - Average number of male sex partners in lifetime (females 18+)
Sexual Behavior - Average number of male vaginal sex partners in lifetime (females 18+)
Sexual Behavior - Average number of female sex partners in lifetime (females 18+)
Sexual Behavior - Circumcised males 18+ (%)
Sleep Disorders - Average hours sleeping at night
Sleep Disorders - People that has trouble sleeping (%)
Smoking-Cigarette Use - People smoking cigarettes (%)
Taste & Smell - People 40+ having problems with smell (%)
Taste & Smell - People 40+ having problems with taste (%)
Taste & Smell - People 40+ that ever had wisdom teeth removed (%)
Taste & Smell - People 40+ that ever had tonsils teeth removed (%)
Taste & Smell - People 40+ that ever had a loss of consciousness because of a head injury (%)
Taste & Smell - People 40+ that ever had a broken nose or other serious injury to face or skull (%)
Taste & Smell - People 40+ that ever had two or more sinus infections (%)
Weight - Average height (inches)
Weight - Average weight (pounds)
Weight - Average BMI
Weight - People that are obese (%)
Weight - People that ever were obese (%)
Weight - People trying to lose weight (%)
According to our research of Missouri and other state lists, there were 50 registered sex offenders living in Belton, Missouri as of May 16, 2024 . The ratio of all residents to sex offenders in Belton is 472 to 1.The ratio of registered sex offenders to all residents in this city is lower than the state average.
Officers per 1,000 residents here:
2.05Missouri average:
2.54
Latest news from Belton, MO collected exclusively by city-data.com from local newspapers, TV, and radio stations
Ancestries: German (15.9%), English (14.0%), American (10.7%), Irish (8.6%), European (4.2%), Norwegian (3.6%).
Current Local Time:
Land area: 13.4 square miles.
Population density: 1,898 people per square mile (low).
186 residents are foreign born
This city:
0.8%Missouri:
4.2%
Median real estate property taxes paid for housing units with mortgages in 2022: $1,810 (0.8%)Median real estate property taxes paid for housing units with no mortgage in 2022: $1,868 (1.0%)
Nearest city with pop. 50,000+: Lee's Summit, MO
Nearest city with pop. 200,000+: Kansas City, MO
Nearest city with pop. 1,000,000+: Chicago, IL
Nearest cities:
Riverview Estates, MO (2.2 miles),
Latitude: 38.82 N, Longitude: 94.53 W
Daytime population change due to commuting: -3,368 (-13.6%)Workers who live and work in this city: 3,631 (29.5%)
Single-family new house construction building permits:
2022: 117 buildings , average cost: $250,1002021: 43 buildings , average cost: $253,2002020: 52 buildings , average cost: $230,3002019: 50 buildings , average cost: $207,8002018: 44 buildings , average cost: $220,2002017: 39 buildings , average cost: $263,0002016: 71 buildings , average cost: $198,4002015: 15 buildings , average cost: $122,8002014: 13 buildings , average cost: $200,2002013: 16 buildings , average cost: $220,6002012: 4 buildings , average cost: $211,5002011: 23 buildings , average cost: $186,1002010: 51 buildings , average cost: $168,3002009: 6 buildings , average cost: $240,6002008: 17 buildings , average cost: $204,4002007: 70 buildings , average cost: $182,5002006: 251 buildings , average cost: $178,0002005: 147 buildings , average cost: $184,1002004: 142 buildings , average cost: $172,7002003: 80 buildings , average cost: $121,4002002: 58 buildings , average cost: $112,4002001: 86 buildings , average cost: $96,9002000: 147 buildings , average cost: $91,8001999: 173 buildings , average cost: $92,0001998: 150 buildings , average cost: $84,9001997: 103 buildings , average cost: $120,300Unemployment in December 2023:
Population change in the 1990s: +3,460 (+18.9%).
Most common occupations in Belton, MO (%)
Both Males Females
Other office and administrative support workers, including supervisors (4.4%)
Driver/sales workers and truck drivers (4.2%)
Computer specialists (3.8%)
Building and grounds cleaning and maintenance occupations (3.7%)
Other sales and related occupations, including supervisors (3.7%)
Material recording, scheduling, dispatching, and distributing workers (3.7%)
Other management occupations, except farmers and farm managers (3.5%)
Driver/sales workers and truck drivers (7.9%)
Computer specialists (5.1%)
Electrical equipment mechanics and other installation, maintenance, and repair workers, including supervisors (5.1%)
Construction traders workers except carpenters, electricians, painters, plumbers, and construction laborers (4.7%)
Other production occupations, including supervisors (4.4%)
Other management occupations, except farmers and farm managers (4.1%)
Material recording, scheduling, dispatching, and distributing workers (4.0%)
Other office and administrative support workers, including supervisors (7.2%)
Secretaries and administrative assistants (6.2%)
Bookkeeping, accounting, and auditing clerks (4.9%)
Building and grounds cleaning and maintenance occupations (4.4%)
Child care workers (4.4%)
Cashiers (4.0%)
Registered nurses (3.7%)
Tornado activity:
Belton-area historical tornado activity is slightly above Missouri state average. It is 93% greater than the overall U.S. average.
On 5/20/1957, a category F5 (max. wind speeds 261-318 mph) tornado 13.2 miles away from the Belton city center killed 44 people and injured 207 people and caused between $500,000 and $5,000,000 in damages.
On 5/22/1952, a category F4 (max. wind speeds 207-260 mph) tornado 20.2 miles away from the city center injured 3 people and caused between $50,000 and $500,000 in damages.
Earthquake activity:
Belton-area historical earthquake activity is significantly above Missouri state average. It is 522% greater than the overall U.S. average. On 9/3/2016 at 12:02:44, a magnitude 5.8 (5.8 MW, Depth: 3.5 mi, Class: Moderate, Intensity: VI - VII) earthquake occurred 211.3 miles away from Belton center On 11/6/2011 at 03:53:10, a magnitude 5.7 (5.7 MW, Depth: 3.2 mi) earthquake occurred 258.5 miles away from the city center On 11/12/2014 at 21:40:00, a magnitude 4.9 (4.9 MW, Depth: 2.5 mi, Class: Light, Intensity: IV - V) earthquake occurred 199.5 miles away from the city center On 11/7/2016 at 01:44:24, a magnitude 5.0 (5.0 MW, Depth: 2.8 mi) earthquake occurred 232.0 miles away from the city center On 2/13/2016 at 17:07:06, a magnitude 5.1 (5.1 MW, Depth: 5.2 mi) earthquake occurred 279.8 miles away from Belton center On 1/19/2020 at 19:08:42, a magnitude 4.5 (4.5 MW, Depth: 3.1 mi) earthquake occurred 194.5 miles away from the city center Magnitude types: moment magnitude (MW) Natural disasters: The number of natural disasters in Cass County (20) is greater than the US average (15).Major Disasters (Presidential) Declared: 14Emergencies Declared: 5Floods: 12, Storms: 10, Tornadoes: 7, Winter Storms: 4, Drought: 1, Heavy Rain: 1, Hurricane: 1, Ice Storm: 1, Snowstorm: 1, Other: 1 (Note: some incidents may be assigned to more than one category). Hospitals and medical centers in Belton: BELTON REGIONAL MEDICAL CENTER (Voluntary non-profit - Private, provides emergency services, 17065 S 71 HIGHWAY) BEAUTIFUL SAVIOR HOME (1003 SOUTH CEDAR STREET)
DIALYSIS CLINICS, INC - BELTON (17045 S 71 HWY)
Amtrak stations near Belton: 11 miles: LEE'S SUMMIT (220 S. MAIN ST.) Services: enclosed waiting area, public payphones, free short-term parking, free long-term parking, call for taxi service.
19 miles: KANSAS CITY (2200 MAIN ST.) Services: ticket office, fully wheelchair accessible, enclosed waiting area, public restrooms, public payphones, snack bar, free short-term parking, paid long-term parking, call for car rental service, taxi stand, public transit connection.
20 miles: INDEPENDENCE (600 S. GRAND AVE.) Services: free short-term parking, call for taxi service.
Colleges/universities with over 2000 students nearest to Belton:
Wright Career College (about 11 miles; Overland Park, KS ; Full-time enrollment: 3,107)
Johnson County Community College (about 14 miles; Overland Park, KS ; FT enrollment: 11,976)
MidAmerica Nazarene University (about 15 miles; Olathe, KS ; FT enrollment: 2,158)
Rockhurst University (about 15 miles; Kansas City, MO ; FT enrollment: 2,013)
University of Missouri-Kansas City (about 16 miles; Kansas City, MO ; FT enrollment: 10,544)
Metropolitan Community College-Kansas City (about 18 miles; Kansas City, MO ; FT enrollment: 12,834)
Kansas City Kansas Community College (about 25 miles; Kansas City, KS ; FT enrollment: 4,718)
Public high schools in Belton: BELTON HIGH Students: 1,049, Location: 801 W. NORTH AVENUE, Grades: 10-12)BELTON MIDDLE SCHOOL/FC Location: 107 W. PIRATE PARKWAY, Grades: 7-9)
Private high school in Belton: HEARTLAND HIGH SCHOOL AND ACADEMY Students: 128, Location: 810 S CEDAR ST, Grades: PK-12)
Public elementary/middle schools in Belton: MILL CREEK UPPER ELEM. Students: 670, Location: 308 S CLEVELAND, Grades: 5-6)CAMBRIDGE ELEM. Students: 508, Location: 109 W CAMBRIDGE, Grades: KG-4)HILLCREST ELEM. Students: 477, Location: 106 S HILLCREST RD, Grades: KG-4)GLADDEN ELEM. Students: 380, Location: 405 WESTOVER RD, Grades: KG-4)SCOTT ELEM. Location: 310 S SCOTT, Grades: KG-4)
KENTUCKY TRAIL ELEM. Location: 8301 E 163RD ST, Grades: KG-4)See full list of schools located in Belton User-submitted facts and corrections:
Belton High School now grades 10-12
Belton High School now grades 10-12
Birthplace of: Brad St. Louis - Football player.
Cass County has a predicted average indoor radon screening level greater than 4 pCi/L (pico curies per liter) - Highest Potential Drinking water stations with addresses in Belton and their reported violations in the past:
BELTON (Population served: 23,116, Purch surface water):
Past health violations:
MCL, Monthly (TCR) - In OCT-2010, Contaminant: Coliform. Follow-up actions: St Public Notif requested (NOV-16-2010), St Violation/Reminder Notice (NOV-16-2010), St Public Notif received (DEC-06-2010), St Compliance achieved (AUG-12-2011)
Population served: 88, Groundwater):
Past health violations:
MCL, Monthly (TCR) - In JUN-2010, Contaminant: Coliform. Follow-up actions: St Public Notif requested (JUL-01-2010), St Violation/Reminder Notice (JUL-01-2010), St Public Notif received (JUL-19-2010), St Compliance achieved (AUG-05-2011)
MCL, Monthly (TCR) - In JUL-2005, Contaminant: Coliform. Follow-up actions: St Public Notif requested (JUL-25-2005), St Violation/Reminder Notice (JUL-25-2005), St Compliance achieved (JAN-22-2014)
Past monitoring violations:
Monitoring, Source Water (GWR) - In JUN-01-2014, Contaminant: E. COLI
3 routine major monitoring violations
4 minor monitoring violations
Drinking water stations with addresses in Belton that have no violations reported:
CASS CO PWSD 2 (Population served: 4,230, Primary Water Source Type: Purch surface water)
CROWN MOBILE HOME PARK (Population served: 450, Primary Water Source Type: Purch surface water)
Average household size: This city:
2.7 peopleMissouri:
2.5 people
Percentage of family households: This city:
70.5%Whole state:
65.3%
Percentage of households with unmarried partners: This city:
7.2%Whole state:
6.7%
Likely homosexual households (counted as self-reported same-sex unmarried-partner households)
Lesbian couples: 0.3% of all households Gay men: 0.2% of all households
109 people in nursing facilities/skilled-nursing facilities in 2010people in group homes intended for adults in 2010People in group quarters in Belton in 2000:
300 people in nursing homes
11 people in other noninstitutional group quarters
7 people in homes for the mentally retarded
Banks with branches in Belton (2011 data):
Bank of America, National Association: Belton Branch at 1818 East North Avenue, branch established on 1908/06/23. Info updated 2009/11/18: Bank assets: $1,451,969.3 mil, Deposits: $1,077,176.8 mil, headquarters in Charlotte, NC, positive income , 5782 total offices , Holding Company: Bank Of America Corporation
Bank Midwest, National Association: Carnegie Village at Bernard Drive, branch established on 2008/11/25. Info updated 2012/03/19: Bank assets: $6,237.6 mil, Deposits: $5,064.6 mil, headquarters in Kansas City, MO, positive income , 138 total offices , Holding Company: Nbh Holdings Corp.
Hawthorn Bank: Belton Branch at 8127 East 171st Street, branch established on 1910/03/10. Info updated 2011/03/16: Bank assets: $1,152.2 mil, Deposits: $971.8 mil, headquarters in Jefferson City, MO, positive income , Commercial Lending Specialization, 24 total offices , Holding Company: Hawthorn Bancshares, Inc
Bank of Belton: Bank Of Belton at 204 Main Street, branch established on 1884/08/19. Info updated 2010/08/12: Bank assets: $47.3 mil, Deposits: $44.0 mil, local headquarters , negative income in the last year , Commercial Lending Specialization, 1 total offices , Holding Company: Overland Bancorp, Inc.
Country Club Bank: Belton Branch at 202 East North Avenue, branch established on 1998/01/20. Info updated 2011/11/18: Bank assets: $1,042.5 mil, Deposits: $860.6 mil, headquarters in Kansas City, MO, positive income , Commercial Lending Specialization, 26 total offices , Holding Company: Ccb Financial Corporation
Commerce Bank: Belray Branch at 8200 E 171st St, branch established on 2000/02/08. Info updated 2011/07/07: Bank assets: $20,493.6 mil, Deposits: $16,805.3 mil, headquarters in Kansas City, MO, positive income , 206 total offices , Holding Company: Commerce Bancshares, Inc.
Bank of the West: Belton Branch at 1307 East North Avenue, branch established on 1999/06/08. Info updated 2009/11/16: Bank assets: $62,408.3 mil, Deposits: $43,995.2 mil, headquarters in San Francisco, CA, positive income , 647 total offices , Holding Company: Bnp Paribas
For population 15 years and over in Belton:
Never married: 30.1%Now married: 49.1%Separated: 1.9%Widowed: 5.1%Divorced: 13.8% For population 25 years and over in Belton:
High school or higher: 94.5%Bachelor's degree or higher: 25.5%Graduate or professional degree: 7.8%Unemployed: 3.8%Mean travel time to work (commute): 20.6 minutes
Education Gini index (Inequality in education) Here:
9.1Missouri average:
11.1
Religion statistics for Belton, MO (based on Cass County data)
Religion Adherents Congregations Evangelical Protestant 22,842 76 Mainline Protestant 6,661 21 Catholic 6,301 3 Other 363 5 Black Protestant 8 1 None 63,303 -
Source: Clifford Grammich, Kirk Hadaway, Richard Houseal, Dale E.Jones, Alexei Krindatch, Richie Stanley and Richard H.Taylor. 2012. 2010 U.S.Religion Census: Religious Congregations & Membership Study. Association of Statisticians of American Religious Bodies. Jones, Dale E., et al. 2002. Congregations and Membership in the United States 2000. Nashville, TN: Glenmary Research Center. Graphs represent county-level data
Food Environment Statistics: Number of grocery stores : 11Here :
1.13 / 10,000 pop.Missouri :
1.88 / 10,000 pop.
Number of supercenters and club stores : 2Cass County :
0.21 / 10,000 pop.Missouri :
0.18 / 10,000 pop.
Number of convenience stores (no gas) : 3Cass County :
0.31 / 10,000 pop.Missouri :
0.60 / 10,000 pop.
Number of convenience stores (with gas) : 40Cass County :
4.13 / 10,000 pop.Missouri :
4.34 / 10,000 pop.
Number of full-service restaurants : 63Cass County :
6.50 / 10,000 pop.Missouri :
7.37 / 10,000 pop.
Adult diabetes rate : This county :
8.6%Missouri :
8.8%
Adult obesity rate : Cass County :
30.6%Missouri :
29.6%
Low-income preschool obesity rate : Cass County :
10.1%Missouri :
13.5%
Health and Nutrition:
Average overall health of teeth and gums : Average BMI : This city:
29.0Missouri:
28.7
People feeling badly about themselves : This city:
22.4%State:
20.6%
People not drinking alcohol at all : Average hours sleeping at night : This city:
6.8Missouri:
6.8
General health condition : Average condition of hearing : More about Health and Nutrition of Belton, MO Residents
Local government employment and payroll (March 2022)
Function
Full-time employees
Monthly full-time payroll
Average yearly full-time wage
Part-time employees
Monthly part-time payroll
Firefighters
46 $254,596 $66,416 0 $0 Police Protection - Officers
41 $210,171 $61,513 1 $432 Police - Other
19 $105,179 $66,429 1 $1,262 Parks and Recreation
16 $60,787 $45,590 110 $124,937 Streets and Highways
13 $48,466 $44,738 0 $0 Sewerage
11 $42,986 $46,894 0 $0 Water Supply
10 $41,161 $49,393 0 $0 Financial Administration
10 $47,248 $56,698 2 $3,773 Other and Unallocable
10 $63,862 $76,634 0 $0 Correction
6 $23,241 $46,482 0 $0 Judicial and Legal
6 $24,623 $49,246 0 $0 Other Government Administration
5 $33,396 $80,150 11 $9,497 Fire - Other
2 $15,024 $90,144 0 $0
Totals for Government
195 $970,741 $59,738 125 $139,901
Belton government finances - Expenditure in 2021 (per resident):
Construction - Regular Highways: $8,850,000 ($348.15)
Sewerage: $1,655,000 ($65.11)Water Utilities: $1,341,000 ($52.75)Parks and Recreation: $234,000 ($9.21)General - Other: $149,000 ($5.86)Current Operations - Police Protection: $5,666,000 ($222.90)
Local Fire Protection: $5,529,000 ($217.51)Water Utilities: $4,066,000 ($159.95)Sewerage: $3,962,000 ($155.86)Parks and Recreation: $3,831,000 ($150.71)Regular Highways: $3,017,000 ($118.69)General - Other: $2,041,000 ($80.29)Judicial and Legal Services: $1,252,000 ($49.25)Solid Waste Management: $1,232,000 ($48.47)Central Staff Services: $798,000 ($31.39)Financial Administration: $610,000 ($24.00)General Public Buildings: $550,000 ($21.64)Correctional Institutions: $453,000 ($17.82)General - Interest on Debt: $3,407,000 ($134.03)
Other Capital Outlay - Sewerage: $1,065,000 ($41.90)
General - Other: $845,000 ($33.24)Parks and Recreation: $186,000 ($7.32)Water Utilities - Interest on Debt: $156,000 ($6.14)
Belton government finances - Revenue in 2021 (per resident):
Charges - Sewerage: $7,962,000 ($313.22)
Parks and Recreation: $2,803,000 ($110.27)Other: $2,426,000 ($95.44)Solid Waste Management: $1,493,000 ($58.73)Federal Intergovernmental - Health and Hospitals: $1,443,000 ($56.77)
Miscellaneous - General Revenue - Other: $1,590,000 ($62.55)
Fines and Forfeits: $531,000 ($20.89)Interest Earnings: $516,000 ($20.30)Revenue - Water Utilities: $7,601,000 ($299.02)
State Intergovernmental - General Local Government Support: $2,048,000 ($80.57)
Highways: $1,981,000 ($77.93)Other: $762,000 ($29.98)Sewerage: $2,000 ($0.08)Tax - General Sales and Gross Receipts: $14,337,000 ($564.00)
Property: $6,879,000 ($270.61)Public Utilities Sales: $3,444,000 ($135.48)Other License: $929,000 ($36.55)Other Selective Sales: $283,000 ($11.13)
Belton government finances - Debt in 2021 (per resident):
Long Term Debt - Beginning Outstanding - Unspecified Public Purpose: $101,095,000 ($3976.99)
Outstanding Unspecified Public Purpose: $86,959,000 ($3420.89)Beginning Outstanding - Public Debt for Private Purpose: $23,929,000 ($941.35)Outstanding Nonguaranteed - Industrial Revenue: $22,580,000 ($888.28)Retired Unspecified Public Purpose: $19,888,000 ($782.38)Issue, Unspecified Public Purpose: $5,752,000 ($226.28)Retired Nonguaranteed - Public Debt for Private Purpose: $1,571,000 ($61.80)Issue, Nonguaranteed - Public Debt for Private Purpose: $222,000 ($8.73)
Belton government finances - Cash and Securities in 2021 (per resident):
Bond Funds - Cash and Securities: $9,740,000 ($383.16)
Other Funds - Cash and Securities: $43,180,000 ($1698.66)
Sinking Funds - Cash and Securities: $4,096,000 ($161.13)
Businesses in Belton, MO
Name Count Name Count
AT&T 1 Little Caesars Pizza 1 Ace Hardware 1 Long John Silver's 1 Advance Auto Parts 1 Maurices 1 Applebee's 1 McDonald's 1 Arby's 1 Nike 1 AutoZone 1 Papa John's Pizza 1 Blockbuster 1 Payless 1 Burger King 1 PetSmart 1 CVS 1 Popeyes 1 Church's Chicken 1 RadioShack 1 Comfort Inn 1 Ruby Tuesday 1 Cricket Wireless 1 SONIC Drive-In 1 Curves 1 Sears 1 Domino's Pizza 1 Sprint Nextel 1 Econo Lodge 1 Starbucks 1 Famous Footwear 1 Subway 1 FedEx 3 T-Mobile 1 GNC 1 Taco Bell 1 GameStop 1 Target 1 H&R Block 2 U-Haul 1 Home Depot 1 UPS 3 IHOP 1 Verizon Wireless 1 Jimmy John's 1 Waffle House 1 KFC 1 Walgreens 1 Kohl's 1
Strongest AM radio stations in Belton:
WHB (810 AM; 50 kW; KANSAS CITY, MO; Owner: UNION BROADCASTING, INC.)
KCSP (610 AM; 5 kW; KANSAS CITY, MO; Owner: ENTERCOM KANSAS CITY LICENSE, LLC)
KCCV (760 AM; daytime; 6 kW; OVERLAND PARK, KS; Owner: BOTT BROADCASTING COMPANY)
KKHK (1250 AM; 25 kW; KANSAS CITY, KS)
KXTR (1660 AM; 10 kW; KANSAS CITY, KS; Owner: ENTERCOM KANSAS CITY LICENSE, LLC)
KCTE (1510 AM; daytime; 10 kW; INDEPENDENCE, MO; Owner: UNION BROADCASTING, INC.)
KMBZ (980 AM; 5 kW; KANSAS CITY, MO; Owner: ENTERCOM KANSAS CITY LICENSE, LLC)
KPHN (1190 AM; 5 kW; KANSAS CITY, MO; Owner: ABC, INC.)
KCMO (710 AM; 10 kW; KANSAS CITY, MO; Owner: SUSQUEHANNA KANSAS CITY PARTNERSHIP)
KCNW (1380 AM; 2 kW; FAIRWAY, KS; Owner: KANSAS CITY RADIO, INC.)
KKLO (1410 AM; 5 kW; LEAVENWORTH, KS; Owner: CHARA COMMUNICATIONS, INC.)
KPRT (1590 AM; 1 kW; KANSAS CITY, MO; Owner: CARTER BROADCAST GROUP, INC.)
KCWJ (1030 AM; 1 kW; BLUE SPRINGS, MO; Owner: CHRISTIAN BROADCASTING ASSOCIATES, LP)
Strongest FM radio stations in Belton:
KCFX (101.1 FM; HARRISONVILLE, MO; Owner: SUSQUEHANNA KANSAS CITY PARTNERSHIP)
KMXV (93.3 FM; KANSAS CITY, MO; Owner: INFINITY RADIO OPERATIONS INC.)
KQRC-FM (98.9 FM; LEAVENWORTH, KS; Owner: ENTERCOM KANSAS CITY LICENSE, LLC)
KRBZ (96.5 FM; KANSAS CITY, MO; Owner: ENTERCOM KANSAS CITY LICENSE, LLC)
KYYS (99.7 FM; KANSAS CITY, MO; Owner: ENTERCOM KANSAS CITY LICENSE, LLC)
KPRS (103.3 FM; KANSAS CITY, MO; Owner: CARTER BROADCAST GROUP, INC.)
KZPL (97.3 FM; LEE'S SUMMIT, MO; Owner: UNION FIRST BROADCASTING, LLC)
KCMO-FM (94.9 FM; KANSAS CITY, MO; Owner: SUSQUEHANNA KANSAS CITY PARTNERSHIP)
WDAF-FM (106.5 FM; LIBERTY, MO; Owner: ENTERCOM KANSAS CITY LICENSE, LLC)
KUDL (98.1 FM; KANSAS CITY, KS; Owner: ENTERCOM KANSAS CITY LICENSE, LLC)
KSRC (102.1 FM; KANSAS CITY, MO; Owner: INFINITY RADIO OPERATIONS INC.)
KBEQ-FM (104.3 FM; KANSAS CITY, MO; Owner: INFINITY RADIO SUBSIDIARY OPERATIONS INC.)
KCUR-FM (89.3 FM; KANSAS CITY, MO; Owner: CURATORS OF UNIVERSITY OF MISSOURI)
KFKF-FM (94.1 FM; KANSAS CITY, KS; Owner: INFINITY RADIO SUBSIDIARY OPERATIONS INC.)
KLJC (88.5 FM; KANSAS CITY, MO; Owner: CALVARY BIBLE COLLEGE)
KCCV-FM (92.3 FM; OLATHE, KS; Owner: BOTT BROADCASTING COMPANY)
KKFI (90.1 FM; KANSAS CITY, MO; Owner: MID-COAST RADIO PROJECT, INC.)
KMJK (107.3 FM; LEXINGTON, MO; Owner: ALLUR-KANSAS CITY, INC.)
TV broadcast stations around Belton:
KMCI (Channel 38; LAWRENCE, KS; Owner: SCRIPPS HOWARD BROADCASTING COMPANY)
KPXE (Channel 50; KANSAS CITY, MO; Owner: PAXSON KANSAS CITY LICENSE, INC.)
KMBC-TV (Channel 9; KANSAS CITY, MO; Owner: KMBC HEARST-ARGYLE TELEVISION, INC.)
KCTV (Channel 5; KANSAS CITY, MO; Owner: MEREDITH CORPORATION)
K35CT (Channel 35; KANSAS CITY, MO; Owner: WORD OF GOD FELLOWSHIP, INC.)
KCPT (Channel 19; KANSAS CITY, MO; Owner: PUBLIC TELEVISION 19, INC.)
KSMO-TV (Channel 62; KANSAS CITY, MO; Owner: KSMO LICENSEE, INC.)
KSHB-TV (Channel 41; KANSAS CITY, MO; Owner: SCRIPPS HOWARD BROADCASTING COMPANY)
KCWE (Channel 29; KANSAS CITY, MO; Owner: KCWE-TV, INC.)
WDAF-TV (Channel 4; KANSAS CITY, MO; Owner: WDAF LICENSE, INC.)
K48FS (Channel 48; KANSAS CITY, MO; Owner: WORD OF GOD FELLOWSHIP, INC.)
K26CR (Channel 26; KANSAS CITY, MO; Owner: VENTANA TELEVISION, INC.)
K27FR (Channel 27; OVERLAND PARK, KS; Owner: UNIVERSITY OF KANSAS)
National Bridge Inventory (NBI) Statistics 32 Number of bridges236ft / 72.1m Total length $858,000 Total costs175,670 Total average daily traffic24,172 Total average daily truck traffic
New bridges - historical statistics
1 1910-1919 1 1940-1949 2 1950-1959 6 1960-1969 2 1980-1989 3 1990-1999 11 2000-2009 6 2010-2019
See full National Bridge Inventory statistics for Belton, MO
Home Mortgage Disclosure Act Aggregated Statistics For Year 2009(Based on 1 full and 3 partial tracts) A) FHA, FSA/RHS & VA B) Conventional C) Refinancings D) Home Improvement Loans F) Non-occupant Loans on G) Loans On Manufactured Number Average Value Number Average Value Number Average Value Number Average Value Number Average Value Number Average Value
LOANS ORIGINATED 101 $119,727 63 $112,798 317 $143,581 17 $66,621 14 $111,989 16 $24,712 APPLICATIONS APPROVED, NOT ACCEPTED 6 $100,380 14 $82,939 33 $131,599 2 $51,080 1 $60,820 8 $30,936 APPLICATIONS DENIED 10 $122,935 13 $150,915 107 $147,235 11 $15,260 5 $88,564 4 $27,775 APPLICATIONS WITHDRAWN 8 $125,652 6 $114,120 95 $149,043 6 $73,662 2 $126,840 0 $0 FILES CLOSED FOR INCOMPLETENESS 1 $72,750 2 $112,890 18 $170,680 0 $0 0 $0 0 $0
Aggregated Statistics For Year 2008(Based on 1 full and 3 partial tracts) A) FHA, FSA/RHS & VA B) Conventional C) Refinancings D) Home Improvement Loans E) Loans on Dwellings For 5+ Families F) Non-occupant Loans on G) Loans On Manufactured Number Average Value Number Average Value Number Average Value Number Average Value Number Average Value Number Average Value Number Average Value
LOANS ORIGINATED 94 $123,224 118 $119,738 202 $141,150 28 $35,221 5 $1,130,400 29 $104,114 36 $23,945 APPLICATIONS APPROVED, NOT ACCEPTED 8 $128,985 19 $95,149 28 $127,791 2 $50,400 0 $0 5 $105,948 7 $29,390 APPLICATIONS DENIED 5 $106,990 18 $80,885 155 $139,552 40 $27,315 0 $0 12 $89,462 11 $29,345 APPLICATIONS WITHDRAWN 5 $119,102 12 $149,132 71 $140,526 4 $110,318 0 $0 3 $128,897 2 $37,930 FILES CLOSED FOR INCOMPLETENESS 1 $194,000 3 $156,930 18 $142,332 0 $0 0 $0 1 $102,170 0 $0
Aggregated Statistics For Year 2007(Based on 1 full and 3 partial tracts) A) FHA, FSA/RHS & VA B) Conventional C) Refinancings D) Home Improvement Loans E) Loans on Dwellings For 5+ Families F) Non-occupant Loans on G) Loans On Manufactured Number Average Value Number Average Value Number Average Value Number Average Value Number Average Value Number Average Value Number Average Value
LOANS ORIGINATED 39 $131,423 210 $137,677 287 $135,745 47 $44,351 7 $2,393,476 56 $114,677 14 $25,686 APPLICATIONS APPROVED, NOT ACCEPTED 1 $97,240 24 $120,962 58 $117,297 9 $40,248 0 $0 5 $120,718 4 $21,030 APPLICATIONS DENIED 4 $131,632 39 $127,620 192 $137,962 46 $67,008 1 $3,200,000 12 $115,208 9 $19,374 APPLICATIONS WITHDRAWN 2 $91,235 18 $162,498 93 $134,025 8 $55,889 0 $0 9 $155,869 1 $29,000 FILES CLOSED FOR INCOMPLETENESS 0 $0 7 $118,221 32 $154,058 1 $20,000 0 $0 2 $92,860 0 $0
Aggregated Statistics For Year 2006(Based on 1 full and 3 partial tracts) A) FHA, FSA/RHS & VA B) Conventional C) Refinancings D) Home Improvement Loans E) Loans on Dwellings For 5+ Families F) Non-occupant Loans on G) Loans On Manufactured Number Average Value Number Average Value Number Average Value Number Average Value Number Average Value Number Average Value Number Average Value
LOANS ORIGINATED 55 $134,203 303 $127,275 304 $121,960 46 $103,913 0 $0 64 $155,435 10 $27,621 APPLICATIONS APPROVED, NOT ACCEPTED 3 $138,597 51 $115,838 72 $121,387 10 $28,679 0 $0 6 $143,170 4 $32,038 APPLICATIONS DENIED 7 $102,569 59 $126,084 255 $122,807 47 $47,482 1 $150,000 16 $97,910 16 $30,743 APPLICATIONS WITHDRAWN 3 $92,130 37 $124,645 138 $122,623 15 $64,233 0 $0 8 $88,411 0 $0 FILES CLOSED FOR INCOMPLETENESS 1 $137,000 12 $144,868 38 $131,304 1 $25,000 0 $0 3 $152,777 0 $0
Aggregated Statistics For Year 2005(Based on 1 full and 3 partial tracts) A) FHA, FSA/RHS & VA B) Conventional C) Refinancings D) Home Improvement Loans E) Loans on Dwellings For 5+ Families F) Non-occupant Loans on G) Loans On Manufactured Number Average Value Number Average Value Number Average Value Number Average Value Number Average Value Number Average Value Number Average Value
LOANS ORIGINATED 56 $129,711 341 $113,655 403 $112,380 41 $36,739 2 $912,455 59 $83,126 17 $22,881 APPLICATIONS APPROVED, NOT ACCEPTED 5 $107,240 49 $93,506 61 $119,234 11 $45,684 0 $0 3 $139,197 12 $35,142 APPLICATIONS DENIED 5 $106,726 60 $77,271 270 $104,790 51 $40,125 1 $603,900 12 $75,391 25 $23,664 APPLICATIONS WITHDRAWN 2 $121,410 40 $118,640 164 $116,359 25 $99,218 0 $0 9 $76,780 3 $43,327 FILES CLOSED FOR INCOMPLETENESS 1 $110,000 14 $90,335 24 $126,039 1 $67,220 0 $0 0 $0 0 $0
Aggregated Statistics For Year 2004(Based on 1 full and 3 partial tracts) A) FHA, FSA/RHS & VA B) Conventional C) Refinancings D) Home Improvement Loans E) Loans on Dwellings For 5+ Families F) Non-occupant Loans on G) Loans On Manufactured Number Average Value Number Average Value Number Average Value Number Average Value Number Average Value Number Average Value Number Average Value
LOANS ORIGINATED 80 $120,908 277 $112,135 437 $112,058 38 $45,725 2 $2,835,500 49 $85,553 17 $28,852 APPLICATIONS APPROVED, NOT ACCEPTED 3 $124,513 40 $95,112 76 $101,131 6 $52,788 0 $0 2 $75,635 8 $36,534 APPLICATIONS DENIED 4 $124,195 85 $89,290 249 $109,345 43 $41,230 0 $0 16 $70,244 40 $36,783 APPLICATIONS WITHDRAWN 4 $127,905 30 $90,187 208 $107,779 9 $38,693 0 $0 5 $111,388 3 $52,667 FILES CLOSED FOR INCOMPLETENESS 0 $0 8 $124,220 52 $123,441 3 $45,167 0 $0 2 $113,415 0 $0
Aggregated Statistics For Year 2003(Based on 1 full and 3 partial tracts) A) FHA, FSA/RHS & VA B) Conventional C) Refinancings D) Home Improvement Loans F) Non-occupant Loans on Number Average Value Number Average Value Number Average Value Number Average Value Number Average Value
LOANS ORIGINATED 69 $113,470 172 $111,384 877 $105,219 21 $22,731 61 $117,269 APPLICATIONS APPROVED, NOT ACCEPTED 1 $128,300 21 $84,429 85 $98,218 8 $18,960 5 $98,568 APPLICATIONS DENIED 6 $114,698 53 $77,695 296 $97,253 33 $13,581 4 $118,448 APPLICATIONS WITHDRAWN 3 $96,933 33 $95,876 188 $108,675 5 $14,030 4 $78,845 FILES CLOSED FOR INCOMPLETENESS 2 $82,940 16 $78,125 37 $117,574 0 $0 3 $60,393
Aggregated Statistics For Year 2002(Based on 2 partial tracts) A) FHA, FSA/RHS & VA B) Conventional C) Refinancings D) Home Improvement Loans F) Non-occupant Loans on Number Average Value Number Average Value Number Average Value Number Average Value Number Average Value
LOANS ORIGINATED 30 $99,798 64 $101,805 171 $94,292 7 $12,357 26 $98,215 APPLICATIONS APPROVED, NOT ACCEPTED 1 $121,180 9 $63,392 25 $82,725 2 $16,235 7 $78,531 APPLICATIONS DENIED 2 $54,840 13 $65,071 66 $84,258 8 $12,249 8 $65,450 APPLICATIONS WITHDRAWN 2 $59,810 9 $84,494 57 $88,338 1 $51,480 3 $43,823 FILES CLOSED FOR INCOMPLETENESS 1 $63,220 4 $94,742 12 $91,927 0 $0 2 $63,560
Aggregated Statistics For Year 2001(Based on 2 partial tracts) A) FHA, FSA/RHS & VA B) Conventional C) Refinancings D) Home Improvement Loans F) Non-occupant Loans on Number Average Value Number Average Value Number Average Value Number Average Value Number Average Value
LOANS ORIGINATED 38 $90,372 54 $79,650 168 $82,951 12 $22,667 56 $65,226 APPLICATIONS APPROVED, NOT ACCEPTED 0 $0 8 $53,120 19 $73,830 2 $23,365 2 $86,725 APPLICATIONS DENIED 2 $85,930 20 $68,044 62 $67,810 8 $19,892 5 $40,574 APPLICATIONS WITHDRAWN 3 $87,253 6 $80,475 44 $93,991 4 $26,080 0 $0 FILES CLOSED FOR INCOMPLETENESS 0 $0 2 $77,615 9 $72,441 0 $0 0 $0
Aggregated Statistics For Year 2000(Based on 2 partial tracts) A) FHA, FSA/RHS & VA B) Conventional C) Refinancings D) Home Improvement Loans F) Non-occupant Loans on Number Average Value Number Average Value Number Average Value Number Average Value Number Average Value
LOANS ORIGINATED 47 $92,065 57 $80,203 72 $88,117 9 $13,684 29 $77,970 APPLICATIONS APPROVED, NOT ACCEPTED 0 $0 9 $44,860 16 $55,848 3 $14,093 1 $125,140 APPLICATIONS DENIED 1 $119,800 35 $39,858 45 $59,760 16 $14,370 4 $60,290 APPLICATIONS WITHDRAWN 4 $80,715 5 $88,804 18 $52,374 2 $54,845 1 $69,300 FILES CLOSED FOR INCOMPLETENESS 1 $90,680 1 $64,550 6 $108,958 0 $0 0 $0
Aggregated Statistics For Year 1999(Based on 3 partial tracts) A) FHA, FSA/RHS & VA B) Conventional C) Refinancings D) Home Improvement Loans E) Loans on Dwellings For 5+ Families F) Non-occupant Loans on Number Average Value Number Average Value Number Average Value Number Average Value Number Average Value Number Average Value
LOANS ORIGINATED 119 $90,620 204 $71,586 237 $79,022 34 $13,492 1 $44,100 26 $67,712 APPLICATIONS APPROVED, NOT ACCEPTED 1 $135,860 41 $48,647 46 $58,351 10 $15,552 0 $0 6 $43,318 APPLICATIONS DENIED 6 $83,558 177 $36,526 110 $61,783 24 $12,023 0 $0 11 $47,676 APPLICATIONS WITHDRAWN 6 $77,808 18 $77,981 65 $60,035 8 $21,768 1 $61,060 3 $54,290 FILES CLOSED FOR INCOMPLETENESS 2 $79,570 3 $59,913 20 $69,997 1 $84,120 0 $0 1 $57,230
Detailed HMDA statistics for the following Tracts:
0600.01
, 0600.02 , 0601.00 , 0602.00
Private Mortgage Insurance Companies Aggregated Statistics For Year 2009(Based on 1 full and 3 partial tracts) A) Conventional B) Refinancings C) Non-occupant Loans on Number Average Value Number Average Value Number Average Value
LOANS ORIGINATED 8 $99,386 9 $147,304 0 $0 APPLICATIONS APPROVED, NOT ACCEPTED 4 $242,210 6 $185,727 1 $68,000 APPLICATIONS DENIED 1 $174,670 1 $139,950 0 $0 APPLICATIONS WITHDRAWN 2 $130,465 0 $0 0 $0 FILES CLOSED FOR INCOMPLETENESS 0 $0 0 $0 0 $0
Aggregated Statistics For Year 2008(Based on 1 full and 3 partial tracts) A) Conventional B) Refinancings C) Non-occupant Loans on Number Average Value Number Average Value Number Average Value
LOANS ORIGINATED 43 $130,729 27 $154,348 3 $92,920 APPLICATIONS APPROVED, NOT ACCEPTED 12 $118,624 8 $165,980 1 $67,000 APPLICATIONS DENIED 4 $96,862 3 $188,140 1 $74,020 APPLICATIONS WITHDRAWN 2 $104,500 2 $182,500 0 $0 FILES CLOSED FOR INCOMPLETENESS 2 $159,990 0 $0 0 $0
Aggregated Statistics For Year 2007(Based on 1 full and 3 partial tracts) A) Conventional B) Refinancings C) Non-occupant Loans on Number Average Value Number Average Value Number Average Value
LOANS ORIGINATED 76 $134,442 41 $145,050 5 $87,854 APPLICATIONS APPROVED, NOT ACCEPTED 8 $191,165 9 $171,934 0 $0 APPLICATIONS DENIED 1 $133,000 0 $0 0 $0 APPLICATIONS WITHDRAWN 2 $184,945 5 $131,382 0 $0 FILES CLOSED FOR INCOMPLETENESS 0 $0 0 $0 0 $0
Aggregated Statistics For Year 2006(Based on 1 full and 3 partial tracts) A) Conventional B) Refinancings C) Non-occupant Loans on Number Average Value Number Average Value Number Average Value
LOANS ORIGINATED 57 $125,419 25 $137,384 4 $76,792 APPLICATIONS APPROVED, NOT ACCEPTED 6 $146,807 7 $192,754 0 $0 APPLICATIONS DENIED 0 $0 1 $121,000 0 $0 APPLICATIONS WITHDRAWN 3 $129,523 1 $177,570 0 $0 FILES CLOSED FOR INCOMPLETENESS 0 $0 0 $0 0 $0
Aggregated Statistics For Year 2005(Based on 1 full and 3 partial tracts) A) Conventional B) Refinancings C) Non-occupant Loans on Number Average Value Number Average Value Number Average Value
LOANS ORIGINATED 51 $127,172 38 $128,626 5 $61,632 APPLICATIONS APPROVED, NOT ACCEPTED 7 $164,063 8 $123,304 0 $0 APPLICATIONS DENIED 0 $0 0 $0 0 $0 APPLICATIONS WITHDRAWN 2 $147,930 2 $153,360 0 $0 FILES CLOSED FOR INCOMPLETENESS 0 $0 0 $0 0 $0
Aggregated Statistics For Year 2004(Based on 1 full and 3 partial tracts) A) Conventional B) Refinancings C) Non-occupant Loans on Number Average Value Number Average Value Number Average Value
LOANS ORIGINATED 63 $121,655 60 $116,472 6 $83,208 APPLICATIONS APPROVED, NOT ACCEPTED 11 $119,903 23 $116,253 1 $153,720 APPLICATIONS DENIED 2 $86,725 0 $0 0 $0 APPLICATIONS WITHDRAWN 4 $74,870 12 $114,582 1 $92,250 FILES CLOSED FOR INCOMPLETENESS 0 $0 0 $0 0 $0
Aggregated Statistics For Year 2003(Based on 1 full and 3 partial tracts) A) Conventional B) Refinancings C) Non-occupant Loans on Number Average Value Number Average Value Number Average Value
LOANS ORIGINATED 57 $106,752 119 $119,178 11 $101,188 APPLICATIONS APPROVED, NOT ACCEPTED 5 $117,784 25 $110,848 1 $89,100 APPLICATIONS DENIED 0 $0 4 $117,030 1 $98,600 APPLICATIONS WITHDRAWN 2 $70,730 8 $109,368 4 $100,500 FILES CLOSED FOR INCOMPLETENESS 0 $0 0 $0 0 $0
Aggregated Statistics For Year 2002(Based on 2 partial tracts) A) Conventional B) Refinancings C) Non-occupant Loans on Number Average Value Number Average Value Number Average Value
LOANS ORIGINATED 22 $93,358 17 $98,477 4 $64,838 APPLICATIONS APPROVED, NOT ACCEPTED 2 $66,530 6 $84,637 2 $90,685 APPLICATIONS DENIED 0 $0 0 $0 0 $0 APPLICATIONS WITHDRAWN 1 $80,780 2 $155,360 0 $0 FILES CLOSED FOR INCOMPLETENESS 0 $0 0 $0 0 $0
Aggregated Statistics For Year 2001(Based on 2 partial tracts) A) Conventional B) Refinancings C) Non-occupant Loans on Number Average Value Number Average Value Number Average Value
LOANS ORIGINATED 22 $91,722 21 $96,158 6 $77,603 APPLICATIONS APPROVED, NOT ACCEPTED 2 $98,210 3 $87,253 3 $73,523 APPLICATIONS DENIED 0 $0 2 $89,890 2 $69,695 APPLICATIONS WITHDRAWN 0 $0 0 $0 0 $0 FILES CLOSED FOR INCOMPLETENESS 0 $0 0 $0 0 $0
Aggregated Statistics For Year 2000(Based on 2 partial tracts) A) Conventional B) Refinancings C) Non-occupant Loans on Number Average Value Number Average Value Number Average Value
LOANS ORIGINATED 21 $86,426 7 $72,770 4 $78,928 APPLICATIONS APPROVED, NOT ACCEPTED 1 $106,130 0 $0 0 $0 APPLICATIONS DENIED 0 $0 0 $0 0 $0 APPLICATIONS WITHDRAWN 0 $0 1 $126,320 0 $0 FILES CLOSED FOR INCOMPLETENESS 0 $0 0 $0 0 $0
Aggregated Statistics For Year 1999(Based on 3 partial tracts) A) Conventional B) Refinancings C) Non-occupant Loans on Number Average Value Number Average Value Number Average Value
LOANS ORIGINATED 40 $94,830 25 $83,581 5 $86,302 APPLICATIONS APPROVED, NOT ACCEPTED 3 $162,553 1 $324,280 1 $73,090 APPLICATIONS DENIED 0 $0 0 $0 0 $0 APPLICATIONS WITHDRAWN 3 $80,050 1 $157,030 0 $0 FILES CLOSED FOR INCOMPLETENESS 0 $0 0 $0 0 $0
Detailed PMIC statistics for the following Tracts:
0600.01
, 0600.02 , 0601.00 , 0602.00 Fire-safe hotels and motels in Belton, Missouri:
Comfort Inn, 17205 S 71 Hwy, Belton, Missouri 64012 Phone: (816) 322-8700, Fax: (816) 318-1532
Econo Lodge, 222 Peculiar Dr, Belton, Missouri 64012 Phone: (816) 322-1222, Fax: (816) 322-2232
Hampton Inn Belton Mo, 16410 Cornerstone Dr, Belton, Missouri 64012 Phone: (816) 415-4400
All 3 fire-safe hotels and motels in Belton, Missouri
Most common first names in Belton, MO among deceased individuals Name Count Lived (average)
Mary 109 79.4 years Robert 97 69.8 years James 93 72.3 years John 90 74.1 years Charles 75 71.8 years William 72 72.8 years George 47 73.8 years Richard 45 68.6 years Margaret 41 78.0 years Helen 40 80.5 years
Most common last names in Belton, MO among deceased individuals Last name Count Lived (average)
Smith 43 71.0 years Miller 32 76.2 years Anderson 26 81.5 years Brown 24 72.2 years Johnson 24 78.5 years Davis 23 73.9 years Taylor 20 71.2 years Jones 15 78.7 years Cox 14 75.8 years Harrison 14 78.9 years
Belton compared to Missouri state average:
Unemployed percentage significantly below state average. Hispanic race population percentage above state average. Foreign-born population percentage significantly below state average. Length of stay since moving in above state average. House age below state average.
Top Patent Applicants
Cooper N. Tracy (7)
Steven A. Sell (6)
Jason Alexander Roberts (4)
Lisa K. Mclellan (4)
Amy Charlene Wilson (3)
Edward Darlington, Iii (2)
Dan W. Schwartz (2)
Neal L. Patterson (2)
Jerehmiah Jessee-Lantz (2)
Bernard G. Huff (2)
Total of 58 patent applications in 2008-2024.
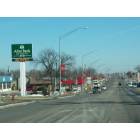
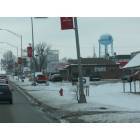
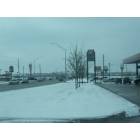
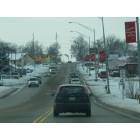
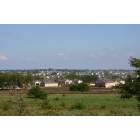
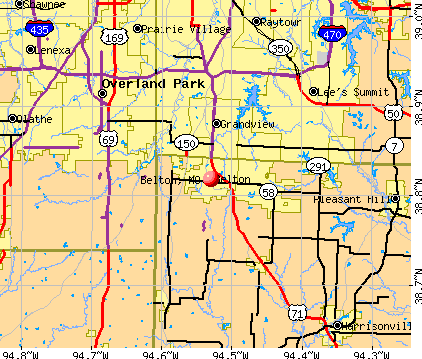


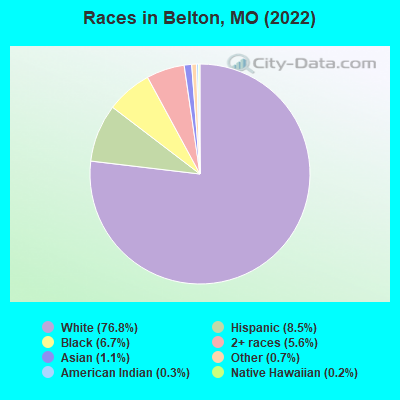
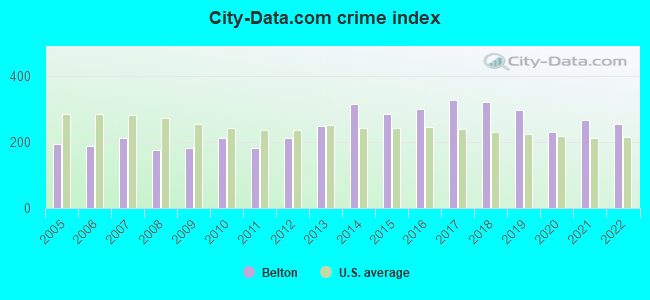
 Recent articles from our blog. Our writers, many of them Ph.D. graduates or candidates, create easy-to-read articles on a wide variety of topics.

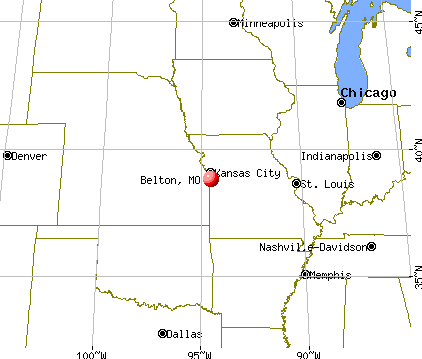
 (11.1 miles
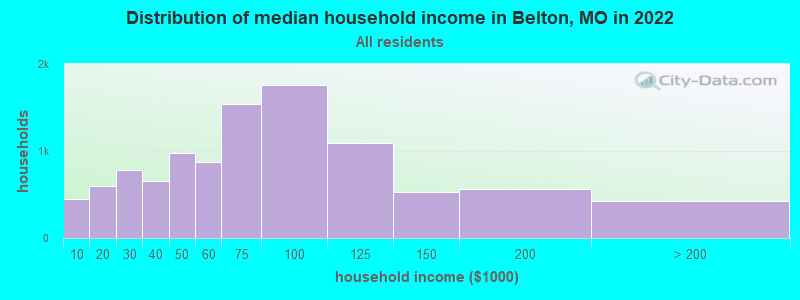
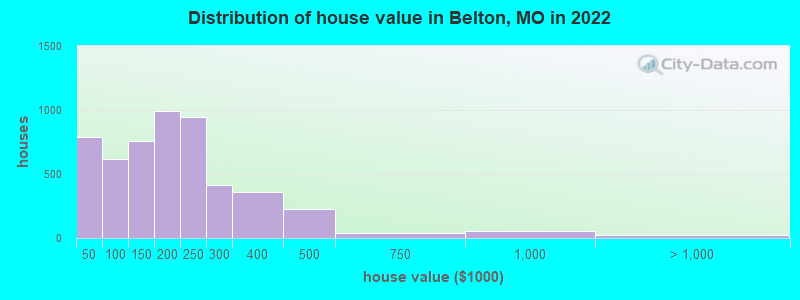

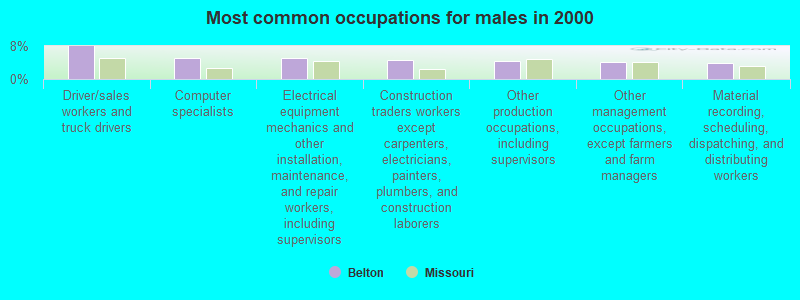
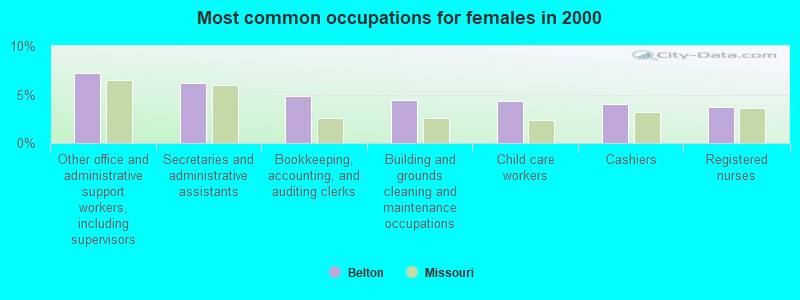
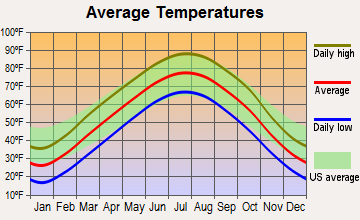
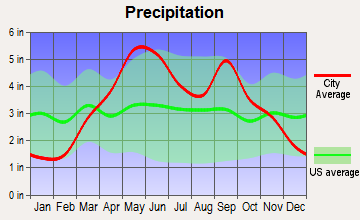
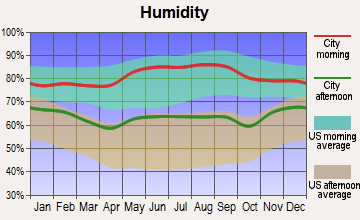
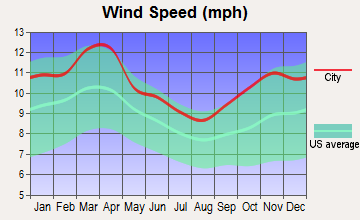
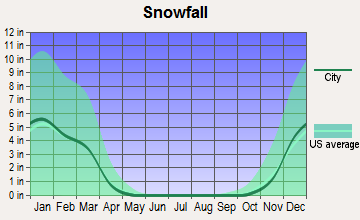
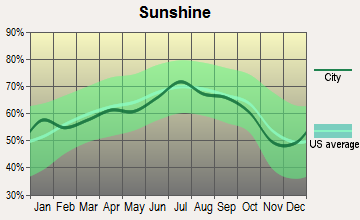
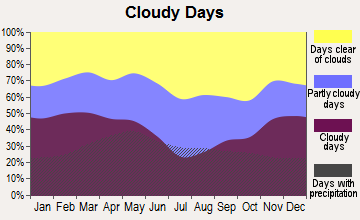


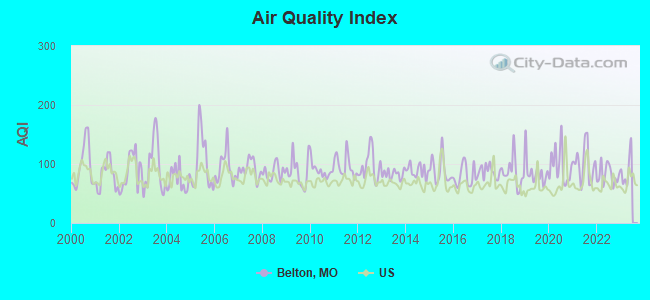
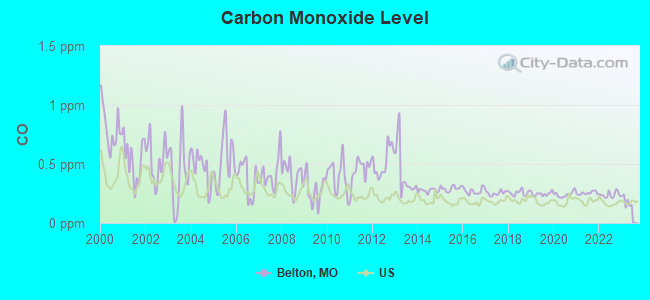
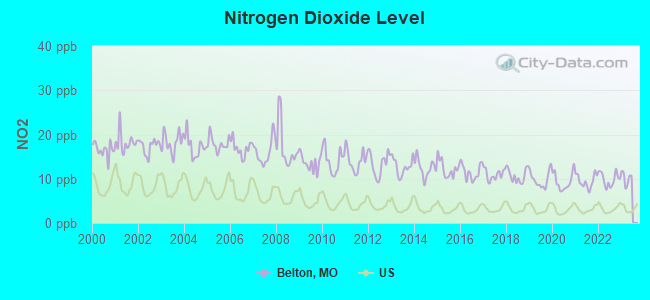
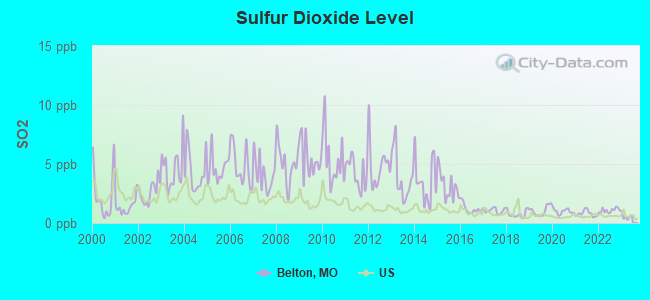
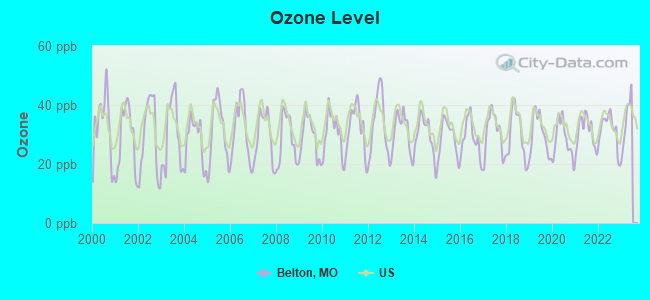
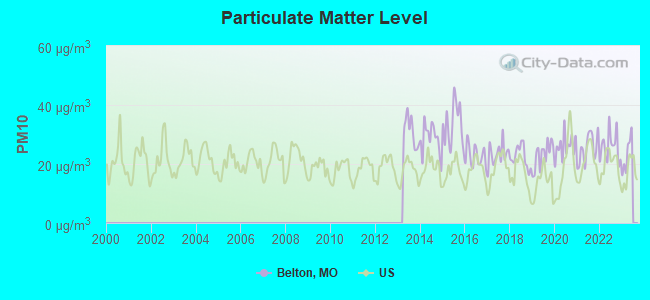
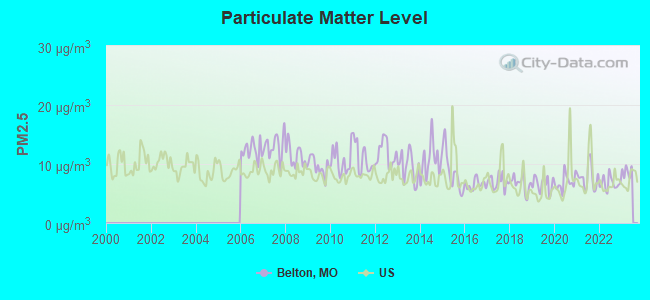

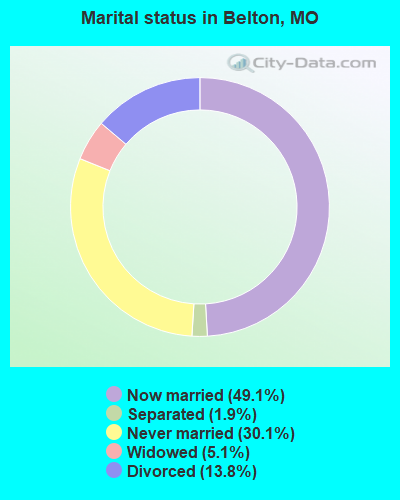
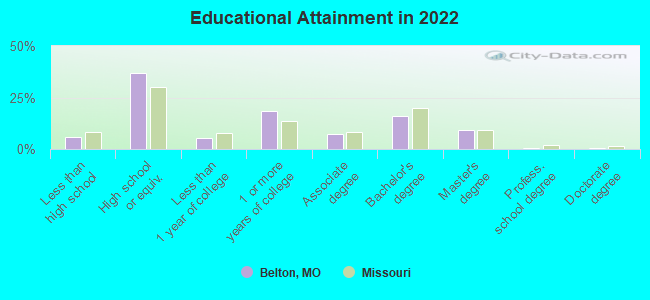
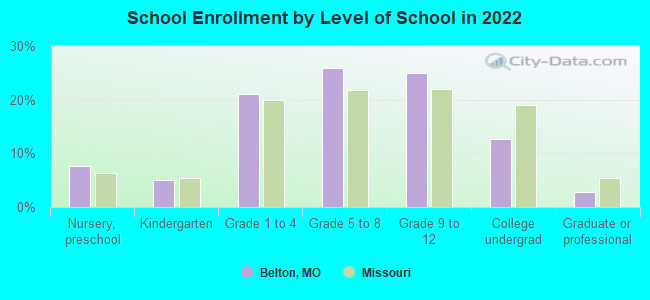
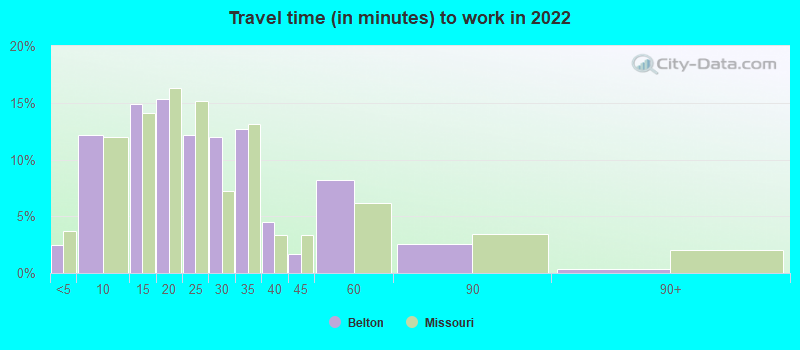
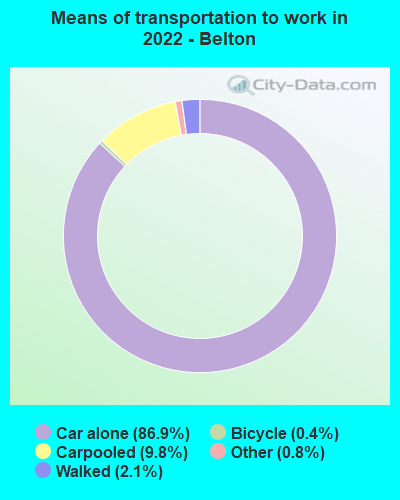
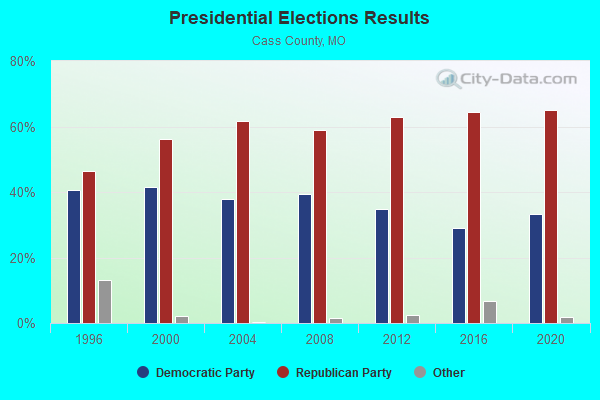
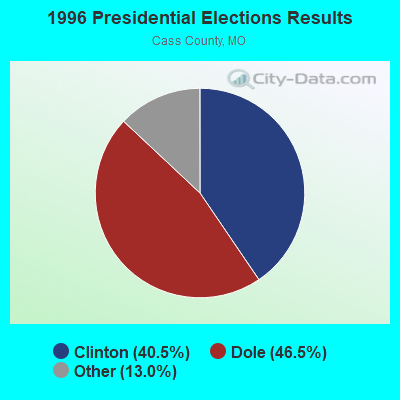
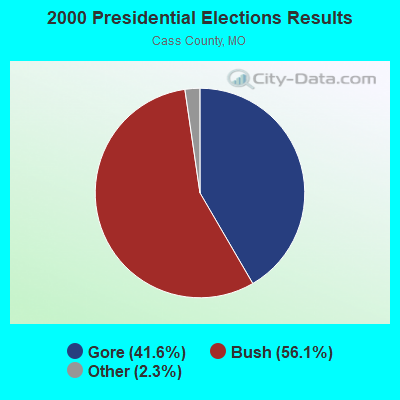
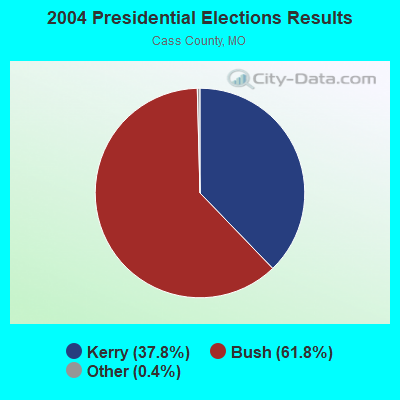
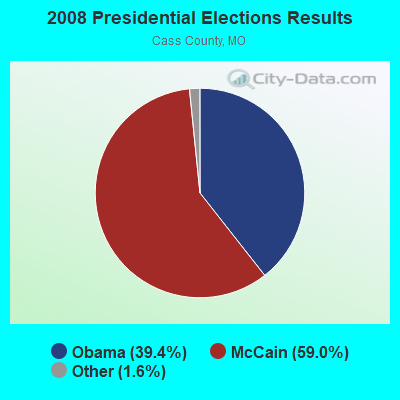
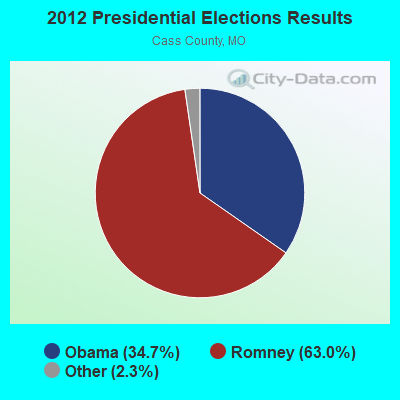
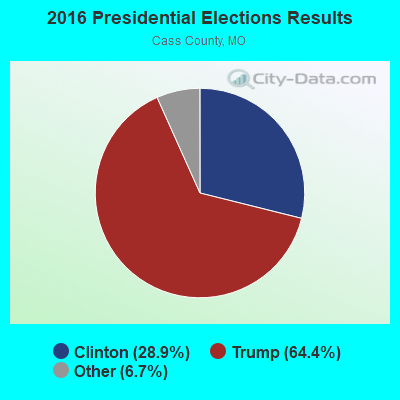

 Based on the data from the years 2002 - 2018 the average number of fires per year is 118. The highest number of reported fire incidents - 170 took place in 2002, and the least - 14 in 2016. The data has a decreasing trend.
 When looking into fire subcategories, the most reports belonged to: Structure Fires (43.0%), and Outside Fires (39.1%).