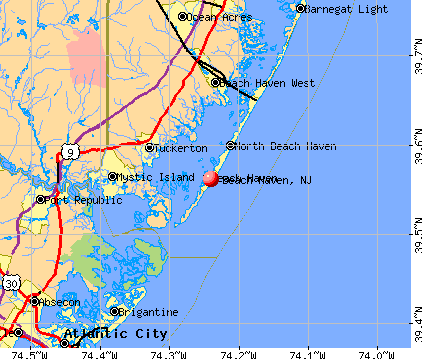
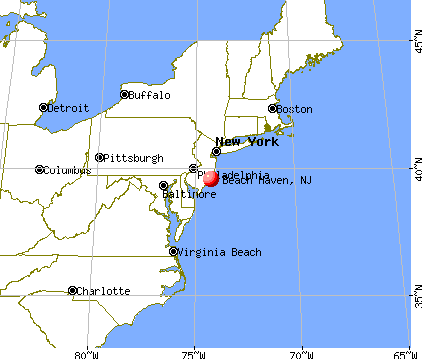
Beach Haven, New Jersey
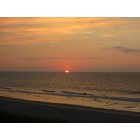
Beach Haven: the beginning of another Haven day
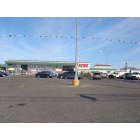
Beach Haven: ACME Markets, Beach Haven
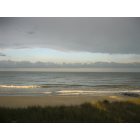
Beach Haven: after the rain
- add
your
Submit your own pictures of this borough and show them to the world
- OSM Map
- General Map
- Google Map
- MSN Map
Population change since 2000: -16.7%
 |
| Males: 514 | |
| Females: 551 |
| Median resident age: | 58.1 years |
| New Jersey median age: | 40.4 years |
Zip codes: 08008.
| Beach Haven: | $109,096 |
| NJ: | $96,346 |
Estimated per capita income in 2022: $80,346 (it was $30,267 in 2000)
Beach Haven borough income, earnings, and wages data
Estimated median house or condo value in 2022: over $1,000,000 (it was $281,300 in 2000)
| Beach Haven: | over $1,000,000 |
| NJ: | $428,900 |
Mean prices in 2022: all housing units: over $1,000,000; detached houses: over $1,000,000; townhouses or other attached units: over $1,000,000; in 2-unit structures: $858,735; in 3-to-4-unit structures: $573,241; in 5-or-more-unit structures: $801,629
Median gross rent in 2022: $1,798.
Detailed information about poverty and poor residents in Beach Haven, NJ


Compare current foreclosures near Beach Haven, NJ:
| Photo | Address | Area | Beds / Baths | Price | Details |
|---|---|---|---|---|---|

|
#1
E 22nd St
Beach Haven, NJ 08008
|
1,685 sq. feet
|
3 baths 7 beds |
show details | |

|
#2
W 16th St
Beach Haven, NJ 08008
|
3,333 sq. feet
|
- baths - beds |
show details | |

|
#3
N 1st St
Beach Haven, NJ 08008
|
1,224 sq. feet
|
- baths - beds |
show details | |

|
#4
N 10th St
Beach Haven, NJ 08008
|
672 sq. feet
|
- baths - beds |
show details | |

|
#5
W 16th St
Beach Haven, NJ 08008
|
3,333 sq. feet
|
- baths - beds |
show details | |

|
#6
W 10th St
Beach Haven, NJ 08008
|
2,006 sq. feet
|
- baths - beds |
show details | |

|
#7
Long Beach Blvd
Beach Haven, NJ 08008
|
- sq. feet
|
- baths - beds |
show details | |

|
#8
Long Beach Blvd
Beach Haven, NJ 08008
|
1,671 sq. feet
|
- baths - beds |
show details | |

|
#9
E Mariners Ln
Beach Haven, NJ 08008
|
- sq. feet
|
- baths - beds |
show details | |

|
#10
W 30th St
Beach Haven, NJ 08008
|
2,172 sq. feet
|
- baths - beds |
show details |
| Photo | Address | Area | Beds / Baths | Price | Details |
|---|---|---|---|---|---|

|
#11
Bay Ter
Beach Haven, NJ 08008
|
- sq. feet
|
- baths - beds |
show details | |

|
#12
Central Ave
Beach Haven, NJ 08008
|
576 sq. feet
|
- baths - beds |
show details | |

|
#13
E 22nd St
Beach Haven, NJ 08008
|
1,685 sq. feet
|
- baths - beds |
show details | |

|
#14
Long Beach Blvd # A
Beach Haven, NJ 08008
|
2,689 sq. feet
|
- baths - beds |
show details | |

|
#15
Long Beach Blvd
Beach Haven, NJ 08008
|
2,689 sq. feet
|
- baths - beds |
show details | |

|
#16
E 21st St
Beach Haven, NJ 08008
|
- sq. feet
|
- baths - beds |
show details | |

|
#17
E California Ave
Beach Haven, NJ 08008
|
- sq. feet
|
- baths - beds |
show details | |

|
#18
W 29th St
Beach Haven, NJ 08008
|
2,760 sq. feet
|
- baths - beds |
show details | |

|
#19
W Harding Ave
Beach Haven, NJ 08008
|
- sq. feet
|
- baths - beds |
show details | |

|
#20
W 4th St
Beach Haven, NJ 08008
|
- sq. feet
|
- baths - beds |
show details |
| Photo | Address | Area | Beds / Baths | Price | Details |
|---|---|---|---|---|---|

|
#21
N Connecticut Ave
Atlantic City, NJ 08401
|
1,200 sq. feet
|
1 baths 3 beds |
$139,900
|
show details |

|
#22
W 30th St
Beach Haven, NJ 08008
|
- sq. feet
|
- baths - beds |
show details | |

|
#23
Long Beach Blvd
Beach Haven, NJ 08008
|
- sq. feet
|
- baths - beds |
show details | |

|
#24
Lake Medford Ln
Tuckerton, NJ 08087
|
1,488 sq. feet
|
3 baths 3 beds |
show details | |

|
#25
Hawser Ave
Manahawkin, NJ 08050
|
1,641 sq. feet
|
2 baths 3 beds |
show details | |

|
#26
Bristol Ter
Tuckerton, NJ 08087
|
2,192 sq. feet
|
3 baths 3 beds |
show details | |

|
#27
Coral Ln
Manahawkin, NJ 08050
|
1,767 sq. feet
|
2 baths 4 beds |
show details | |

|
#28
Cannonball Dr
Barnegat, NJ 08005
|
2,080 sq. feet
|
3 baths 3 beds |
show details | |

|
#29
Drexel Ave
Atlantic City, NJ 08401
|
- sq. feet
|
- baths - beds |
$6,900
|
show details |

|
#30
4th St
Barnegat, NJ 08005
|
908 sq. feet
|
1 baths 3 beds |
show details |
| Photo | Address | Area | Beds / Baths | Price | Details |
|---|---|---|---|---|---|

|
#31
Oakleaf Dr
Tuckerton, NJ 08087
|
1,520 sq. feet
|
2 baths 3 beds |
show details | |

|
#32
Oakleaf Dr
Tuckerton, NJ 08087
|
1,224 sq. feet
|
2 baths 3 beds |
show details | |

|
#33
N Burgee Dr
Tuckerton, NJ 08087
|
1,000 sq. feet
|
1 baths 2 beds |
show details | |

|
#34
Country Club Blvd
Tuckerton, NJ 08087
|
1,740 sq. feet
|
2 baths 3 beds |
show details | |

|
#35
Valley Forge Dr
Tuckerton, NJ 08087
|
969 sq. feet
|
1 baths 2 beds |
show details | |

|
#36
W Mullica Rd
Tuckerton, NJ 08087
|
1,024 sq. feet
|
1 baths 3 beds |
show details | |

|
#37
Windward Dr
Barnegat, NJ 08005
|
975 sq. feet
|
1 baths 3 beds |
show details | |

|
#38
Harold Ln
Manahawkin, NJ 08050
|
1,000 sq. feet
|
1 baths 3 beds |
show details | |

|
#39
Center St
Tuckerton, NJ 08087
|
1,214 sq. feet
|
2 baths 3 beds |
show details | |

|
#40
Osbourn Ct
Tuckerton, NJ 08087
|
1,992 sq. feet
|
3 baths 4 beds |
show details |
| Photo | Address | Area | Beds / Baths | Price | Details |
|---|---|---|---|---|---|

|
#41
Golf View Dr
Tuckerton, NJ 08087
|
1,945 sq. feet
|
2 baths 2 beds |
show details | |

|
#42
National Union Blvd
Tuckerton, NJ 08087
|
1,584 sq. feet
|
2 baths 4 beds |
show details | |

|
#43
Chestnut Way Cir
Barnegat, NJ 08005
|
1,305 sq. feet
|
2 baths 3 beds |
show details | |

|
#44
Lighthouse Dr
Tuckerton, NJ 08087
|
1,989 sq. feet
|
2 baths 3 beds |
show details | |

|
#45
Stage Rd
Tuckerton, NJ 08087
|
1,144 sq. feet
|
2 baths 2 beds |
show details | |

|
#46
Marine Rd
Waretown, NJ 08758
|
1,068 sq. feet
|
2 baths 3 beds |
show details | |

|
#47
Greenwood Lake Rd
Tuckerton, NJ 08087
|
1,890 sq. feet
|
3 baths 3 beds |
show details | |

|
#48
Lake George Ct
Tuckerton, NJ 08087
|
1,512 sq. feet
|
2 baths 3 beds |
show details | |

|
#49
Kadlubeck Way
Tuckerton, NJ 08087
|
2,336 sq. feet
|
2 baths 5 beds |
show details | |

|
Check over 1 million property listings on Foreclosure.com!
|
browse all offers | |||


- 91383.8%White alone
- 14112.9%Hispanic
- 131.2%Two or more races
- 70.6%Asian alone
- 10.09%Black alone

Races in Beach Haven detailed stats: ancestries, foreign born residents, place of birth
According to our research of New Jersey and other state lists, there were 2 registered sex offenders living in Beach Haven, New Jersey as of June 04, 2024.
The ratio of all residents to sex offenders in Beach Haven is 517 to 1.
Type |
2009 |
2010 |
2011 |
2012 |
2013 |
2014 |
2015 |
2016 |
2017 |
2018 |
2019 |
2020 |
2022 |
|---|---|---|---|---|---|---|---|---|---|---|---|---|---|
| Murders (per 100,000) | 0 (0.0) | 0 (0.0) | 0 (0.0) | 0 (0.0) | 0 (0.0) | 0 (0.0) | 0 (0.0) | 0 (0.0) | 0 (0.0) | 0 (0.0) | 0 (0.0) | 0 (0.0) | 0 (0.0) |
| Rapes (per 100,000) | 0 (0.0) | 0 (0.0) | 0 (0.0) | 1 (84.4) | 0 (0.0) | 0 (0.0) | 0 (0.0) | 0 (0.0) | 1 (84.7) | 0 (0.0) | 0 (0.0) | 0 (0.0) | 0 (0.0) |
| Robberies (per 100,000) | 0 (0.0) | 0 (0.0) | 0 (0.0) | 0 (0.0) | 0 (0.0) | 1 (84.9) | 0 (0.0) | 0 (0.0) | 0 (0.0) | 0 (0.0) | 0 (0.0) | 0 (0.0) | 0 (0.0) |
| Assaults (per 100,000) | 1 (71.2) | 3 (256.4) | 4 (340.7) | 2 (168.8) | 0 (0.0) | 0 (0.0) | 3 (253.8) | 1 (85.6) | 1 (84.7) | 0 (0.0) | 0 (0.0) | 0 (0.0) | 0 (0.0) |
| Burglaries (per 100,000) | 6 (427.4) | 18 (1,538) | 12 (1,022) | 19 (1,603) | 12 (1,019) | 15 (1,273) | 7 (592.2) | 4 (342.5) | 5 (423.4) | 3 (256.6) | 5 (419.8) | 5 (413.2) | 0 (0.0) |
| Thefts (per 100,000) | 115 (8,191) | 117 (10,000) | 150 (12,777) | 106 (8,945) | 103 (8,744) | 77 (6,537) | 64 (5,415) | 82 (7,021) | 104 (8,806) | 114 (9,752) | 136 (11,419) | 89 (7,355) | 112 (10,351) |
| Auto thefts (per 100,000) | 0 (0.0) | 1 (85.5) | 0 (0.0) | 0 (0.0) | 2 (169.8) | 1 (84.9) | 1 (84.6) | 0 (0.0) | 1 (84.7) | 1 (85.5) | 0 (0.0) | 0 (0.0) | 0 (0.0) |
| Arson (per 100,000) | 0 (0.0) | 0 (0.0) | 0 (0.0) | 0 (0.0) | 0 (0.0) | 0 (0.0) | 0 (0.0) | 0 (0.0) | 0 (0.0) | 0 (0.0) | 0 (0.0) | 0 (0.0) | 1 (92.4) |
| City-Data.com crime index | 371.8 | 565.8 | 650.8 | 571.3 | 434.6 | 382.9 | 315.6 | 321.9 | 473.3 | 414.9 | 486.1 | 323.1 | 414.0 |
The City-Data.com crime index weighs serious crimes and violent crimes more heavily. Higher means more crime, U.S. average is 246.1. It adjusts for the number of visitors and daily workers commuting into cities.
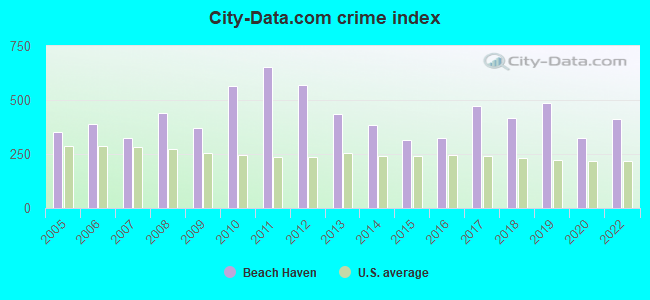
Crime rate in Beach Haven detailed stats: murders, rapes, robberies, assaults, burglaries, thefts, arson
Full-time law enforcement employees in 2021, including police officers: 14 (13 officers - 10 male; 3 female).
| Officers per 1,000 residents here: | 10.20 |
| New Jersey average: | 5.53 |
 Recent articles from our blog. Our writers, many of them Ph.D. graduates or candidates, create easy-to-read articles on a wide variety of topics.

 | Do locals go to Coney Island? (67 replies) |
| I’ve lived in N.J. for 6 months. Here’s the 10 things I love about this weird state. (92 replies) |
| All 44 NJ Beaches, Ranked Worst to Best (Summer 2021) (143 replies) |
| Is the shore (LBI, etc) busier the week of July 4th? (16 replies) |
| 2022 list of 44 beaches ranked by NJ.com (33 replies) |
| NJ Shore (61 replies) |
Latest news from Beach Haven, NJ collected exclusively by city-data.com from local newspapers, TV, and radio stations
Ancestries: Irish (16.6%), European (10.4%), English (7.6%), German (7.4%), Italian (7.2%), Polish (4.8%).
Current Local Time: EST time zone
Elevation: 10 feet
Land area: 0.98 square miles.
Population density: 1,085 people per square mile (low).
93 residents are foreign born (3.4% Latin America, 1.6% North America, 1.5% Europe, 1.1% Asia, 0.9% Africa).
| This borough: | 8.5% |
| New Jersey: | 23.2% |
Median real estate property taxes paid for housing units with mortgages in 2022: $9,166 (0.7%)
Median real estate property taxes paid for housing units with no mortgage in 2022: $9,653 (0.8%)
Nearest city with pop. 50,000+: Toms River, NJ  (29.2 miles , pop. 86,327).
Nearest city with pop. 200,000+: Philadelphia, PA (56.8 miles , pop. 1,517,550).
Nearest cities:
), ), )Latitude: 39.56 N, Longitude: 74.24 W
Area code: 609


Beach Haven tourist attractions:
| Here: | 4.3% |
| New Jersey: | 4.5% |

- Construction (11.2%)
- Public administration (10.8%)
- Educational services (9.1%)
- Health care (8.5%)
- Accommodation & food services (8.5%)
- Professional, scientific, technical services (6.4%)
- Real estate & rental & leasing (4.6%)

- Construction (19.1%)
- Public administration (13.4%)
- Accommodation & food services (9.1%)
- Professional, scientific, technical services (8.7%)
- Arts, entertainment, recreation (4.7%)
- Educational services (4.4%)
- Repair & maintenance (4.0%)

- Educational services (15.5%)
- Health care (15.0%)
- Accommodation & food services (7.7%)
- Public administration (7.3%)
- Real estate & rental & leasing (6.4%)
- Religious, grantmaking, civic, professional, similar organizations (5.5%)
- Department & other general merchandise stores (3.6%)

- Other sales and related occupations, including supervisors (7.5%)
- Other management occupations, except farmers and farm managers (6.4%)
- Other office and administrative support workers, including supervisors (4.6%)
- Preschool, kindergarten, elementary, and middle school teachers (3.3%)
- Law enforcement workers, including supervisors (2.9%)
- Sales representatives, services, wholesale and manufacturing (2.9%)
- Building and grounds cleaning and maintenance occupations (2.7%)

- Other management occupations, except farmers and farm managers (7.0%)
- Law enforcement workers, including supervisors (5.0%)
- Other sales and related occupations, including supervisors (5.0%)
- Supervisors, construction and extraction workers (4.4%)
- Carpenters (4.4%)
- Food and beverage serving workers, except waiters and waitresses (4.0%)
- Other office and administrative support workers, including supervisors (3.4%)

- Other sales and related occupations, including supervisors (10.9%)
- Preschool, kindergarten, elementary, and middle school teachers (6.8%)
- Other office and administrative support workers, including supervisors (6.4%)
- Information and record clerks, except customer service representatives (5.9%)
- Other management occupations, except farmers and farm managers (5.5%)
- Registered nurses (5.5%)
- Religious workers (4.5%)
Average climate in Beach Haven, New Jersey
Based on data reported by over 4,000 weather stations


(lower is better)

Air Quality Index (AQI) level in 2022 was 63.8. This is about average.
| City: | 63.8 |
| U.S.: | 72.6 |

Sulfur Dioxide (SO2) [ppb] level in 2022 was 0.00369. This is significantly better than average. Closest monitor was 6.2 miles away from the city center.
| City: | 0.00369 |
| U.S.: | 1.51465 |

Ozone [ppb] level in 2022 was 28.0. This is about average. Closest monitor was 11.9 miles away from the city center.
| City: | 28.0 |
| U.S.: | 33.3 |

Particulate Matter (PM2.5) [µg/m3] level in 2022 was 5.85. This is better than average. Closest monitor was 13.0 miles away from the city center.
| City: | 5.85 |
| U.S.: | 8.11 |
Tornado activity:
Beach Haven-area historical tornado activity is below New Jersey state average. It is 62% smaller than the overall U.S. average.
On 7/21/1983, a category F3 (max. wind speeds 158-206 mph) tornado 7.8 miles away from the Beach Haven borough center caused between $500,000 and $5,000,000 in damages.
On 8/20/1999, a category F2 (max. wind speeds 113-157 mph) tornado 0.9 miles away from the borough center injured one person and caused $4 million in damages.
Earthquake activity:
Beach Haven-area historical earthquake activity is significantly above New Jersey state average. It is 70% smaller than the overall U.S. average.On 8/23/2011 at 17:51:04, a magnitude 5.8 (5.8 MW, Depth: 3.7 mi, Class: Moderate, Intensity: VI - VII) earthquake occurred 229.8 miles away from the city center
On 1/16/1994 at 01:49:16, a magnitude 4.6 (4.6 MB, 4.6 LG, Depth: 3.1 mi, Class: Light, Intensity: IV - V) earthquake occurred 109.1 miles away from the city center
On 11/30/2017 at 21:47:31, a magnitude 4.1 (4.1 MW, Depth: 6.1 mi) earthquake occurred 68.5 miles away from Beach Haven center
On 10/7/1983 at 10:18:46, a magnitude 5.3 (5.1 MB, 5.3 LG, 5.1 ML) earthquake occurred 303.8 miles away from Beach Haven center
On 8/22/1992 at 12:20:32, a magnitude 4.8 (4.8 MB, 3.8 MS, 4.7 LG, Depth: 6.2 mi) earthquake occurred 212.1 miles away from the city center
On 1/15/2019 at 23:30:48, a magnitude 4.6 (4.6 MW, Depth: 6.2 mi) earthquake occurred 174.4 miles away from Beach Haven center
Magnitude types: regional Lg-wave magnitude (LG), body-wave magnitude (MB), local magnitude (ML), surface-wave magnitude (MS), moment magnitude (MW)
Natural disasters:
The number of natural disasters in Ocean County (27) is a lot greater than the US average (15).Major Disasters (Presidential) Declared: 16
Emergencies Declared: 9
Causes of natural disasters: Storms: 7, Floods: 6, Hurricanes: 6, Snowstorms: 4, Blizzards: 2, Fires: 2, Heavy Rains: 2, Water Shortages: 2, Winter Storms: 2, Tropical Depression: 1, Wind: 1, Other: 3 (Note: some incidents may be assigned to more than one category).

Hospitals and medical centers near Beach Haven:
- SEACREST VILLAGE (Nursing Home, about 8 miles away; LITTLE EGG HARBOR TW, NJ)
- SOUTHERN OCEAN SURGERY CENTER (Hospital, about 11 miles away; MANAHAWKIN, NJ)
- RCG SO OCEAN CO (Dialysis Facility, about 11 miles away; MANAHAWKIN, NJ)
- SOUTHERN OCEAN CENTER (Nursing Home, about 11 miles away; MANAHAWKIN, NJ)
- SOUTHERN OCEAN HOSPICE (Hospital, about 12 miles away; MANAHAWKIN, NJ)
- BARNEGAT NURSING CENTER (Nursing Home, about 14 miles away; BARNEGAT, NJ)
- ABSECON MANOR NURS/REHAB CNTR (Nursing Home, about 16 miles away; ABSECON, NJ)
Operable nuclear power plant near Beach Haven:
- 19 miles: Oyster Creek in Forked River, NJ.
Colleges/universities with over 2000 students nearest to Beach Haven:
- The Richard Stockton College of New Jersey (about 17 miles; Galloway, NJ; Full-time enrollment: 8,360)
- Atlantic Cape Community College (about 25 miles; Mays Landing, NJ; FT enrollment: 5,392)
- Ocean County College (about 32 miles; Toms River, NJ; FT enrollment: 7,471)
- Burlington County College (about 36 miles; Pemberton, NJ; FT enrollment: 7,928)
- Beth Medrash Govoha (about 37 miles; Lakewood, NJ; FT enrollment: 6,700)
- Cumberland County College (about 45 miles; Vineland, NJ; FT enrollment: 2,898)
- Camden County College (about 46 miles; Blackwood, NJ; FT enrollment: 9,901)
Public elementary/middle school in Beach Haven:
- BEACH HAVEN SCHOOL (Students: 65, Location: 8TH STREET & BEACH AVENUE, Grades: PK-6)
Points of interest:
Notable locations in Beach Haven: Beach Haven First Aid Squad (A), Beach Haven Volunteer Fire Company 1 (B). Display/hide their locations on the map
Tourist attractions: Long Beach Island Historical Association Museum (Engelside Avenue & B), Fantasy Island Amusement Park (Amusement & Theme Parks; 320 W 7th St), Settler's Mill Adventure Golf (806 North Bay Avenue), Crystal Queen (Tours & Charters; Centre Street), Black Whale Cruises (Tours & Charters; Centre & Bay Frnt).
Hotels: Long Beach Inn (East Herbert Avenue), Lorry's Island End Motel & Efficiency Apartments (23 Washington Avenue), Brighton Beach Manor Motel (New Jersey Avenue), Engleside Inn (30 Engleside Avenue), Mariner Motor Inn (33 Long Beach Boulevard), Hurley's At Holgate Motel (4804 South Long Beach Blvd), Ella's Motel (18th & Boulevard), Magnolia House (215 Centre Street), Buccaneer Motel (2600 South Bay Avenue).
Courts: Harvey Cedars Borough - Court Clerk (76th Street & Long Beach), Beach Haven Borough - Court Clerk (Bay Avenue Englesd), Surf City Borough - Municipal Court (9th Boulevard).
Birthplace of: Doc Cramer - Baseball player and coach.
Drinking water stations with addresses in Beach Haven and their reported violations in the past:
BEACH HAVEN WATER DEPT (Population served: 20,000, Groundwater):Past health violations:Past monitoring violations:
- MCL, Monthly (TCR) - In AUG-2013, Contaminant: Coliform. Follow-up actions: St Public Notif requested (AUG-12-2013), St Formal NOV issued (AUG-12-2013), St Compliance achieved (SEP-05-2013), St Public Notif received (SEP-26-2013)
- Follow-up Or Routine LCR Tap M/R - In OCT-01-2010, Contaminant: Lead and Copper Rule. Follow-up actions: St Formal NOV issued (MAR-30-2011), St Compliance achieved (JUN-06-2011), St Public Notif received (JUN-30-2011), St Admin Penalty assessed (MAY-11-2012)
- One minor monitoring violation
| This borough: | 2.2 people |
| New Jersey: | 2.7 people |
| This borough: | 56.7% |
| Whole state: | 69.3% |
| This borough: | 6.0% |
| Whole state: | 5.9% |
Likely homosexual households (counted as self-reported same-sex unmarried-partner households)
- Lesbian couples: 0.4% of all households
- Gay men: 0.6% of all households
4 people in religious group quarters in 2000
Banks with branches in Beach Haven (2011 data):
- Bank of America, National Association: Beach Haven Branch at 401 North Bay Avenue, branch established on 1980/03/25. Info updated 2009/11/18: Bank assets: $1,451,969.3 mil, Deposits: $1,077,176.8 mil, headquarters in Charlotte, NC, positive income, 5782 total offices, Holding Company: Bank Of America Corporation
For population 15 years and over in Beach Haven:

- Never married: 22.3%
- Now married: 63.4%
- Separated: 0.4%
- Widowed: 3.4%
- Divorced: 10.5%
For population 25 years and over in Beach Haven:
- High school or higher: 89.9%
- Bachelor's degree or higher: 63.6%
- Graduate or professional degree: 25.6%
- Unemployed: 7.0%
- Mean travel time to work (commute): 29.0 minutes


| Here: | 14.4 |
| New Jersey average: | 12.8 |


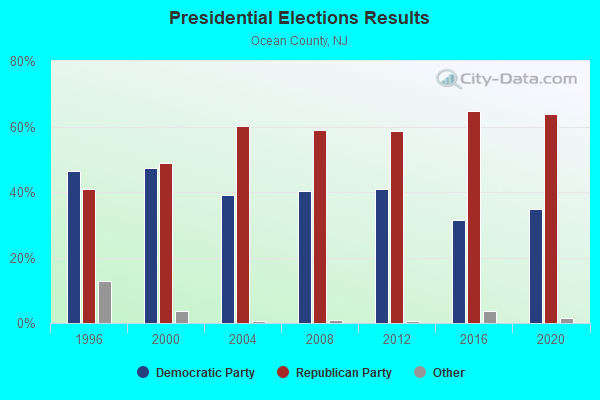
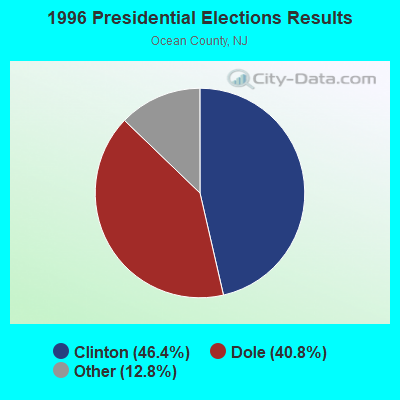
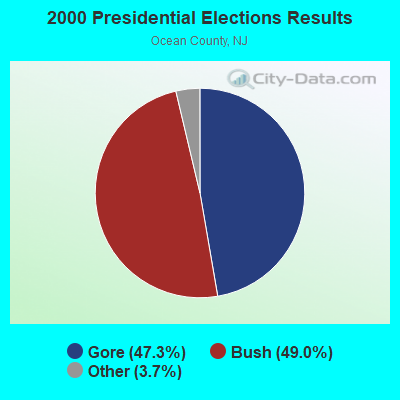
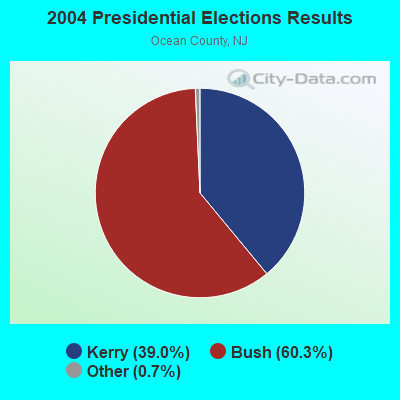
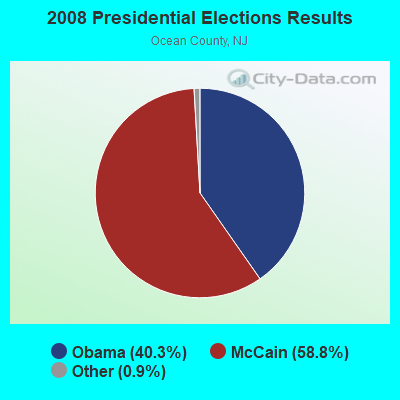
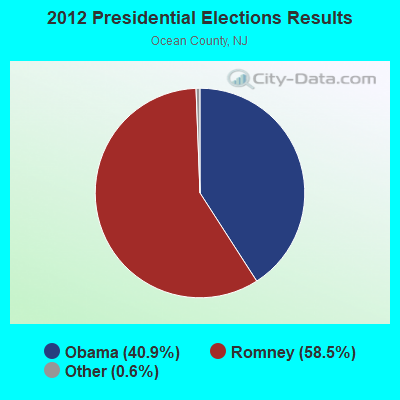
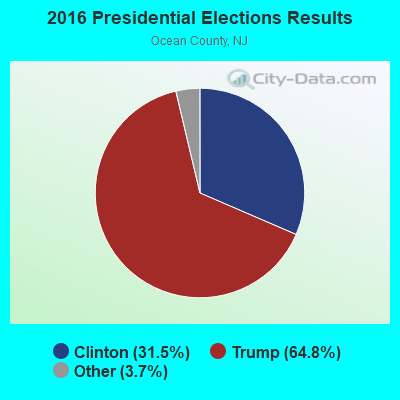
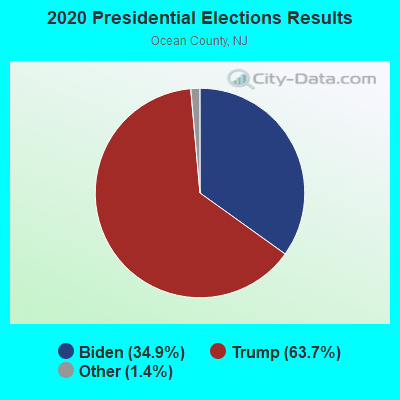
Graphs represent county-level data. Detailed 2008 Election Results
Religion statistics for Beach Haven, NJ (based on Ocean County data)
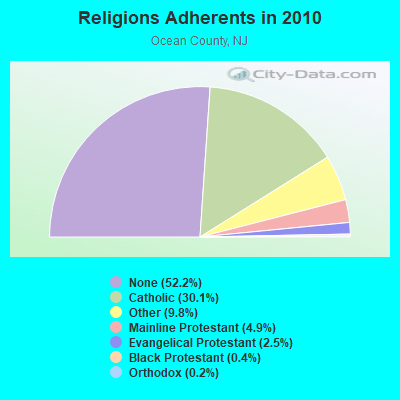
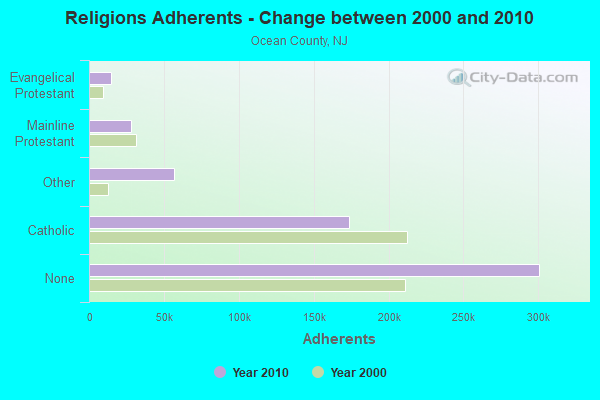
| Religion | Adherents | Congregations |
|---|---|---|
| Catholic | 173,318 | 26 |
| Other | 56,416 | 108 |
| Mainline Protestant | 28,029 | 74 |
| Evangelical Protestant | 14,510 | 79 |
| Black Protestant | 2,303 | 11 |
| Orthodox | 1,280 | 4 |
| None | 300,711 | - |
Food Environment Statistics:
| Ocean County: | 1.59 / 10,000 pop. |
| State: | 2.90 / 10,000 pop. |
| Ocean County: | 0.04 / 10,000 pop. |
| New Jersey: | 0.06 / 10,000 pop. |
| Ocean County: | 1.95 / 10,000 pop. |
| State: | 1.76 / 10,000 pop. |
| Ocean County: | 0.87 / 10,000 pop. |
| New Jersey: | 0.81 / 10,000 pop. |
| Ocean County: | 6.36 / 10,000 pop. |
| New Jersey: | 7.15 / 10,000 pop. |
| This county: | 9.2% |
| State: | 8.3% |
| Ocean County: | 26.4% |
| New Jersey: | 23.3% |
| This county: | 13.2% |
| State: | 18.0% |
Health and Nutrition:
| Beach Haven: | 49.4% |
| State: | 50.6% |
| Beach Haven: | 55.1% |
| New Jersey: | 48.5% |
| Here: | 27.3 |
| State: | 28.5 |
| Beach Haven: | 14.3% |
| New Jersey: | 20.0% |
| Beach Haven: | 9.7% |
| New Jersey: | 11.1% |
| This city: | 6.8 |
| State: | 6.8 |
| Here: | 30.3% |
| New Jersey: | 33.6% |
| This city: | 61.0% |
| State: | 56.9% |
| Here: | 84.9% |
| New Jersey: | 80.0% |
More about Health and Nutrition of Beach Haven, NJ Residents
| Local government employment and payroll (March 2022) | |||||
| Function | Full-time employees | Monthly full-time payroll | Average yearly full-time wage | Part-time employees | Monthly part-time payroll |
|---|---|---|---|---|---|
| Solid Waste Management | 15 | $96,670 | $77,336 | 0 | $0 |
| Police Protection - Officers | 12 | $138,039 | $138,039 | 3 | $1,595 |
| Sewerage | 9 | $18,910 | $25,213 | 1 | $870 |
| Other Government Administration | 8 | $33,439 | $50,159 | 0 | $0 |
| Financial Administration | 7 | $56,906 | $97,553 | 1 | $3,532 |
| Water Supply | 3 | $13,324 | $53,296 | 0 | $0 |
| Police - Other | 2 | $13,370 | $80,220 | 0 | $0 |
| Local Libraries | 2 | $5,673 | $34,038 | 2 | $1,842 |
| Judicial and Legal | 0 | $0 | 4 | $13,237 | |
| Totals for Government | 58 | $376,331 | $77,862 | 11 | $21,076 |
Beach Haven government finances - Expenditure in 2017 (per resident):
- Construction - Water Utilities: $3,709,000 ($3482.63)
General - Other: $765,000 ($718.31)
Sewerage: $350,000 ($328.64)
- Current Operations - General - Other: $2,805,000 ($2633.80)
Police Protection: $1,753,000 ($1646.01)
Solid Waste Management: $865,000 ($812.21)
Water Utilities: $636,000 ($597.18)
Regular Highways: $482,000 ($452.58)
Parks and Recreation: $482,000 ($452.58)
Central Staff Services: $463,000 ($434.74)
Financial Administration: $311,000 ($292.02)
Sewerage: $262,000 ($246.01)
Judicial and Legal Services: $251,000 ($235.68)
General Public Buildings: $202,000 ($189.67)
Libraries: $169,000 ($158.69)
Health - Other: $133,000 ($124.88)
Local Fire Protection: $55,000 ($51.64)
Protective Inspection and Regulation - Other: $39,000 ($36.62)
Public Welfare - Other: $4,000 ($3.76)
- General - Interest on Debt: $20,000 ($18.78)
- Intergovernmental to Local - Other - Sewerage: $1,252,000 ($1175.59)
Other - Protective Inspection and Regulations: $97,000 ($91.08)
Other - General - Other: $70,000 ($65.73)
- Total Salaries and Wages: $3,667,000 ($3443.19)
- Water Utilities - Interest on Debt: $135,000 ($126.76)
Beach Haven government finances - Revenue in 2017 (per resident):
- Charges - Sewerage: $1,203,000 ($1129.58)
Parks and Recreation: $522,000 ($490.14)
Other: $39,000 ($36.62)
- Local Intergovernmental - Other: $1,000 ($0.94)
- Miscellaneous - Fines and Forfeits: $208,000 ($195.31)
General Revenue - Other: $126,000 ($118.31)
Rents: $23,000 ($21.60)
Interest Earnings: $23,000 ($21.60)
- Revenue - Water Utilities: $964,000 ($905.16)
- State Intergovernmental - General Local Government Support: $275,000 ($258.22)
Other: $26,000 ($24.41)
Public Welfare: $1,000 ($0.94)
- Tax - Property: $7,899,000 ($7416.90)
Other Selective Sales: $206,000 ($193.43)
Public Utilities Sales: $187,000 ($175.59)
Other License: $149,000 ($139.91)
Alcoholic Beverage License: $26,000 ($24.41)
Beach Haven government finances - Debt in 2017 (per resident):
- Long Term Debt - Beginning Outstanding - Unspecified Public Purpose: $6,194,000 ($5815.96)
Outstanding Unspecified Public Purpose: $6,004,000 ($5637.56)
Retired Unspecified Public Purpose: $190,000 ($178.40)
Beach Haven government finances - Cash and Securities in 2017 (per resident):
- Bond Funds - Cash and Securities: $1,959,000 ($1839.44)
- Other Funds - Cash and Securities: $7,128,000 ($6692.96)
6.12% of this county's 2021 resident taxpayers lived in other counties in 2020 ($95,565 average adjusted gross income)
| Here: | 6.12% |
| New Jersey average: | 6.70% |
0.01% of residents moved from foreign countries ($88 average AGI)
Ocean County: 0.01% New Jersey average: 0.01%
Top counties from which taxpayers relocated into this county between 2020 and 2021:
| from Monmouth County, NJ | |
| from Middlesex County, NJ | |
| from Bergen County, NJ |
5.03% of this county's 2020 resident taxpayers moved to other counties in 2021 ($85,282 average adjusted gross income)
| Here: | 5.03% |
| New Jersey average: | 7.02% |
0.01% of residents moved to foreign countries ($90 average AGI)
Ocean County: 0.01% New Jersey average: 0.02%
Top counties to which taxpayers relocated from this county between 2020 and 2021:
| to Monmouth County, NJ | |
| to Burlington County, NJ | |
| to Middlesex County, NJ |
| Businesses in Beach Haven, NJ | ||||
| Name | Count | Name | Count | |
|---|---|---|---|---|
| 7-Eleven | 1 | Nike | 1 | |
| Ben & Jerry's | 1 | UPS | 1 | |
| MasterBrand Cabinets | 1 | |||
Strongest AM radio stations in Beach Haven:
- WPHT (1210 AM; 50 kW; PHILADELPHIA, PA; Owner: INFINITY BROADCASTING OPERATIONS, INC.)
- WVCH (740 AM; 50 kW; CHESTER, PA; Owner: WVCH COMMUNICATIONS, INC.)
- WPEN (950 AM; 50 kW; PHILADELPHIA, PA; Owner: GREATER PHILADELPHIA RADIO, INC.)
- WWJZ (640 AM; 50 kW; MOUNT HOLLY, NJ; Owner: ABC, INC.)
- WMCA (570 AM; 50 kW; NEW YORK, NY; Owner: SALEM MEDIA OF NEW YORK, LLC)
- WZZD (990 AM; 50 kW; PHILADELPHIA, PA; Owner: PENNSYLVANIA MEDIA ASSOCIATES, INC.)
- KYW (1060 AM; 50 kW; PHILADELPHIA, PA; Owner: INFINITY BROADCASTING OPERATIONS, INC.)
- WOR (710 AM; 50 kW; NEW YORK, NY; Owner: BUCKLEY BROADCASTING CORPORATION)
- WNWR (1540 AM; 50 kW; PHILADELPHIA, PA)
- WFAN (660 AM; 50 kW; NEW YORK, NY; Owner: INFINITY BROADCASTING OPERATIONS, INC.)
- WABC (770 AM; 50 kW; NEW YORK, NY; Owner: WABC-AM RADIO, INC.)
- WINS (1010 AM; 50 kW; NEW YORK, NY; Owner: INFINITY BROADCASTING OPERATIONS, INC.)
- WCBS (880 AM; 50 kW; NEW YORK, NY; Owner: INFINITY BROADCASTING OPERATIONS, INC.)
Strongest FM radio stations in Beach Haven:
- WCHR-FM (105.7 FM; MANAHAWKIN, NJ; Owner: NASSAU BROADCASTING II, L.L.C.)
- WNJM (89.9 FM; MANAHAWKIN, NJ; Owner: NEW JERSEY PUBLIC BROADCASTING AUTH.)
- WBHX (99.7 FM; TUCKERTON, NJ; Owner: PRESS COMMUNICATIONS, L.L.C.)
- W300AO (107.9 FM; MANAHAWKIN, NJ; Owner: JERSEY SHORE BROADCASTING CORPORATION)
- WBBO (98.5 FM; OCEAN ACRES, NJ; Owner: MILLENNIUM SHORE LICENSE HOLDCO, LLC)
- WPUR (107.3 FM; ATLANTIC CITY, NJ; Owner: MILLENNIUM ATLANTIC CITY LICENSE HOLDCO, LLC)
- WYRS (90.7 FM; MANAHAWKIN, NJ; Owner: PENN JERSEY EDUCATIONAL RADIO CORP.)
- WJRZ-FM (100.1 FM; MANAHAWKIN, NJ; Owner: JERSEY SHORE BROADCASTING CORPORATION)
- WOJZ (104.9 FM; EGG HARBOR CITY, NJ; Owner: MEGA COMMUNICATIONS OF EGG HARBOR LICENSEE, L.L.C.)
- WFPG-FM (96.9 FM; ATLANTIC CITY, NJ; Owner: MILLENNIUM ATLANTIC CITY LICENSE HOLDCO, LLC)
- WTTH (96.1 FM; MARGATE CITY, NJ; Owner: EQUITY COMMUNICATIONS, L.P.)
- WOBM-FM (92.7 FM; TOMS RIVER, NJ; Owner: SEASHORE BROADCASTING CORP.)
- WAYV (95.1 FM; ATLANTIC CITY, NJ; Owner: EQUITY COMMUNICATIONS, L.P.)
- WZBZ (99.3 FM; PLEASANTVILLE, NJ; Owner: EQUITY COMMUNICATIONS, L.P.)
- WNJS-FM (88.1 FM; BERLIN, NJ; Owner: NEW JERSEY PUBLIC BROADCASTING AUTHORITY)
- WMGM (103.7 FM; ATLANTIC CITY, NJ; Owner: SOUTH JERSEY RADIO, INC.)
- WXXY-FM (88.7 FM; PORT REPUBLIC, NJ; Owner: IN HIS NAME BROADCASTING, INC.)
- WLFR (91.7 FM; POMONA, NJ; Owner: STOCKTON STATE COLLEGE)
TV broadcast stations around Beach Haven:
- WWSI (Channel 62; ATLANTIC CITY, NJ; Owner: HISPANIC BROADCASTERS OF PHILADELPHIA, L.L.C.)
- WUVP (Channel 65; VINELAND, NJ; Owner: UNIVISION PHILADELPHIA LLC)
- W60CX (Channel 60; ATLANTIC CITY, NJ; Owner: TRINITY BROADCASTING NETWORK)
- WQAV-LP (Channel 34; ATLANTIC CITY, NJ; Owner: ASIAVISION, INC.)
- WNJS (Channel 23; CAMDEN, NJ; Owner: NEW JERSEY PUBLIC BROADCASTING AUTHORITY)
- WPSJ-LP (Channel 8; HAMMONTON, ETC., NJ; Owner: ENGLE BROADCASTING)
- W07CE (Channel 7; ATLANTIC CITY, ETC., NJ; Owner: SOUTH JERSEY RADIO, INC.)
Beach Haven fatal accident list:
Dec 7, 1998 09:55 AM, 607, Vehicles: 1, Persons: 2, Pedestrians: 1, Fatalities: 1
Jul 9, 1990 10:52 PM, 607, Vehicles: 1, Persons: 2, Fatalities: 1, Drunk persons involved: 1
Jul 7, 1983 11:11 PM, Cr607, Vehicles: 1, Persons: 2, Fatalities: 1
Jul 4, 1979 04:09 PM, Vehicles: 1, Persons: 2, Fatalities: 1
FCC Registered Cell Phone Towers:
2- 6805 Long Beach Haven (77421) (Lat: 39.604111 Lon: -74.210306), Type: Tank, Structure height: 35.4 m, Overall height: 38.4 m, Call Sign: KNKN836
Assigned Frequencies: 869.040 MHz, 869.040 MHz, 824.040 MHz, 824.040 MHz, 890.010 MHz, 890.010 MHz, 845.010 MHz, 845.010 MHzGrant Date: 09/01/2020, Expiration Date: 10/01/2030, Certifier: David C JatlowRegistrant: At&t Services, Inc., 208 S Akard St, 20f, Dallas, TX 75202, Phone: (855) 699-7073, Fax: (214) 746-6410, Email:
- 300 Eagleside Avenue (Lat: 39.563167 Lon: -74.244028), Type: Tank, Structure height: 38.1 m, Overall height: 44.2 m, Call Sign: KNKN648
Assigned Frequencies: 880.020 MHz, 880.020 MHz, 880.020 MHz, 835.020 MHz, 835.020 MHz, 835.020 MHz, 891.510 MHz, 891.510 MHz, 891.510 MHz, 846.510 MHz, 846.510 MHz, 846.510 MHzGrant Date: 09/01/2020, Expiration Date: 10/01/2030Registrant: Verizon Wireless, 5055 North Point Pkwy, Np2ne Network Engineering, Alpharetta, GA 30022, Phone: (770) 797-1070, Fax: (770) 797-1036, Email:
FCC Registered Broadcast Land Mobile Towers:
10 (See the full list of FCC Registered Broadcast Land Mobile Towers in Beach Haven, NJ)FCC Registered Microwave Towers:
6 (See the full list of FCC Registered Microwave Towers in this town)FCC Registered Maritime Coast & Aviation Ground Towers:
8 (See the full list of FCC Registered Maritime Coast & Aviation Ground Towers)FCC Registered Amateur Radio Licenses:
38 (See the full list of FCC Registered Amateur Radio Licenses in Beach Haven)FAA Registered Aircraft:
4- Aircraft: PIPER PA-28-180 (Category: Land, Seats: 4, Weight: Up to 12,499 Pounds, Speed: 107 mph), Engine: LYCOMING O&VO-360 SER (180 HP) (Reciprocating)
N-Number: 6416J, N6416J, N-6416J, Serial Number: 28-4833, Year manufactured: 1968, Airworthiness Date: 04/08/1968, Certificate Issue Date: 07/26/2016
Registrant (Individual): Kenneth R Gallant, 218 S Bay Ave, Beach Haven, NJ 08008 - Aircraft: CESSNA 182N (Category: Land, Seats: 4, Weight: Up to 12,499 Pounds, Speed: 119 mph), Engine: CONT MOTOR O-470 SERIES (230 HP) (Reciprocating)
N-Number: 9228G, N9228G, N-9228G, Serial Number: 18260768, Year manufactured: 1971, Airworthiness Date: 09/02/1971, Certificate Issue Date: 01/12/1999
Registrant (Individual): Kevin S Douthitt, 330 Coral St, Beach Haven, NJ 08008 - Aircraft: J&J ULTRALIGHTS SEAWING (Category: Land, Seats: 2, Weight: Up to 12,499 Pounds), Engine: ROTAX 582UL DCDI (65 HP) (2 Cycle)
N-Number: 947MH, N947MH, N-947MH, Serial Number: SWJ582103035, Year manufactured: 2003, Airworthiness Date: 03/25/2008, Certificate Issue Date: 12/18/2015
Registrant (Individual): Robert W Chambers, 326 4th St, Beach Haven, NJ 08008
Deregistered: Cancel Date: 05/04/2019 - Aircraft: GLASFLUGEL STANDARD LIBELLE (Category: Land, Weight: Up to 12,499 Pounds, Speed: 60 mph), Engine: None
N-Number: 3943, N3943, N-3943, Serial Number: 214, Year manufactured: 1971, Airworthiness Date: 06/18/1971, Certificate Issue Date: 05/25/1976
Registrant (Individual): Thomas R Luck, 107 E 23rd St, Beach Haven, NJ 08008
| Home Mortgage Disclosure Act Aggregated Statistics For Year 2009 (Based on 1 partial tract) | ||||||||
| B) Conventional Home Purchase Loans | C) Refinancings | D) Home Improvement Loans | F) Non-occupant Loans on < 5 Family Dwellings (A B C & D) | |||||
|---|---|---|---|---|---|---|---|---|
| Number | Average Value | Number | Average Value | Number | Average Value | Number | Average Value | |
| LOANS ORIGINATED | 27 | $490,417 | 77 | $356,358 | 3 | $144,857 | 84 | $385,870 |
| APPLICATIONS APPROVED, NOT ACCEPTED | 1 | $458,040 | 7 | $381,190 | 0 | $0 | 5 | $423,676 |
| APPLICATIONS DENIED | 4 | $527,348 | 26 | $401,944 | 1 | $37,460 | 21 | $401,527 |
| APPLICATIONS WITHDRAWN | 1 | $606,390 | 12 | $386,113 | 0 | $0 | 9 | $408,702 |
| FILES CLOSED FOR INCOMPLETENESS | 0 | $0 | 4 | $368,505 | 0 | $0 | 3 | $387,613 |
Detailed HMDA statistics for the following Tracts: 7380.02
| Private Mortgage Insurance Companies Aggregated Statistics For Year 2008 (Based on 1 partial tract) | ||||
| A) Conventional Home Purchase Loans | C) Non-occupant Loans on < 5 Family Dwellings (A & B) | |||
|---|---|---|---|---|
| Number | Average Value | Number | Average Value | |
| LOANS ORIGINATED | 3 | $540,460 | 2 | $453,295 |
| APPLICATIONS APPROVED, NOT ACCEPTED | 0 | $0 | 0 | $0 |
| APPLICATIONS DENIED | 1 | $578,920 | 1 | $578,920 |
| APPLICATIONS WITHDRAWN | 0 | $0 | 0 | $0 |
| FILES CLOSED FOR INCOMPLETENESS | 0 | $0 | 0 | $0 |
Detailed PMIC statistics for the following Tracts: 7380.02


2004 - 2018 National Fire Incident Reporting System (NFIRS) incidents
- Fire incident types reported to NFIRS in Beach Haven, NJ
- 13269.5%Structure Fires
- 3317.4%Outside Fires
- 136.8%Mobile Property/Vehicle Fires
- 126.3%Other
 According to the data from the years 2004 - 2018 the average number of fires per year is 13. The highest number of fire incidents - 26 took place in 2005, and the least - 1 in 2004. The data has a constant trend.
 When looking into fire subcategories, the most reports belonged to: Structure Fires (69.5%), and Outside Fires (17.4%).
- 83.3%Utility gas
- 15.2%Electricity
- 0.7%Fuel oil, kerosene, etc.
- 0.7%No fuel used

- 74.6%Utility gas
- 21.1%Electricity
- 4.2%Bottled, tank, or LP gas
Beach Haven compared to New Jersey state average:
- Median house value significantly above state average.
- Unemployed percentage below state average.
- Black race population percentage significantly below state average.
- Hispanic race population percentage below state average.
- Median age significantly above state average.
- Foreign-born population percentage significantly below state average.
- Length of stay since moving in above state average.
- Percentage of population with a bachelor's degree or higher above state average.

|
|
Total of 6 patent applications in 2008-2024.