Ballston Spa, New York Submit your own pictures of this village and show them to the world
OSM Map
General Map
Google Map
MSN Map
OSM Map
General Map
Google Map
MSN Map
OSM Map
General Map
Google Map
MSN Map
OSM Map
General Map
Google Map
MSN Map
Please wait while loading the map...
Population in 2022: 4,979 (100% urban, 0% rural). Population change since 2000: -10.4%Males: 2,355 Females: 2,624
March 2022 cost of living index in Ballston Spa: 106.6 (more than average, U.S. average is 100) Percentage of residents living in poverty in 2022: 6.4%for White Non-Hispanic residents , 44.4% for Black residents , 48.8% for Hispanic or Latino residents , 1.1% for other race residents , 24.7% for two or more races residents )
Profiles of local businesses
Business Search - 14 Million verified businesses
Data:
Median household income ($)
Median household income (% change since 2000)
Household income diversity
Ratio of average income to average house value (%)
Ratio of average income to average rent
Median household income ($) - White
Median household income ($) - Black or African American
Median household income ($) - Asian
Median household income ($) - Hispanic or Latino
Median household income ($) - American Indian and Alaska Native
Median household income ($) - Multirace
Median household income ($) - Other Race
Median household income for houses/condos with a mortgage ($)
Median household income for apartments without a mortgage ($)
Races - White alone (%)
Races - White alone (% change since 2000)
Races - Black alone (%)
Races - Black alone (% change since 2000)
Races - American Indian alone (%)
Races - American Indian alone (% change since 2000)
Races - Asian alone (%)
Races - Asian alone (% change since 2000)
Races - Hispanic (%)
Races - Hispanic (% change since 2000)
Races - Native Hawaiian and Other Pacific Islander alone (%)
Races - Native Hawaiian and Other Pacific Islander alone (% change since 2000)
Races - Two or more races (%)
Races - Two or more races (% change since 2000)
Races - Other race alone (%)
Races - Other race alone (% change since 2000)
Racial diversity
Unemployment (%)
Unemployment (% change since 2000)
Unemployment (%) - White
Unemployment (%) - Black or African American
Unemployment (%) - Asian
Unemployment (%) - Hispanic or Latino
Unemployment (%) - American Indian and Alaska Native
Unemployment (%) - Multirace
Unemployment (%) - Other Race
Population density (people per square mile)
Population - Males (%)
Population - Females (%)
Population - Males (%) - White
Population - Males (%) - Black or African American
Population - Males (%) - Asian
Population - Males (%) - Hispanic or Latino
Population - Males (%) - American Indian and Alaska Native
Population - Males (%) - Multirace
Population - Males (%) - Other Race
Population - Females (%) - White
Population - Females (%) - Black or African American
Population - Females (%) - Asian
Population - Females (%) - Hispanic or Latino
Population - Females (%) - American Indian and Alaska Native
Population - Females (%) - Multirace
Population - Females (%) - Other Race
Coronavirus confirmed cases (Jun 04, 2024)
Deaths caused by coronavirus (Jun 04, 2024)
Coronavirus confirmed cases (per 100k population) (Jun 04, 2024)
Deaths caused by coronavirus (per 100k population) (Jun 04, 2024)
Daily increase in number of cases (Jun 04, 2024)
Weekly increase in number of cases (Jun 04, 2024)
Cases doubled (in days) (Jun 04, 2024)
Hospitalized patients (Apr 18, 2022)
Negative test results (Apr 18, 2022)
Total test results (Apr 18, 2022)
COVID Vaccine doses distributed (per 100k population) (Sep 19, 2023)
COVID Vaccine doses administered (per 100k population) (Sep 19, 2023)
COVID Vaccine doses distributed (Sep 19, 2023)
COVID Vaccine doses administered (Sep 19, 2023)
Likely homosexual households (%)
Likely homosexual households (% change since 2000)
Likely homosexual households - Lesbian couples (%)
Likely homosexual households - Lesbian couples (% change since 2000)
Likely homosexual households - Gay men (%)
Likely homosexual households - Gay men (% change since 2000)
Cost of living index
Median gross rent ($)
Median contract rent ($)
Median monthly housing costs ($)
Median house or condo value ($)
Median house or condo value ($ change since 2000)
Mean house or condo value by units in structure - 1, detached ($)
Mean house or condo value by units in structure - 1, attached ($)
Mean house or condo value by units in structure - 2 ($)
Mean house or condo value by units in structure by units in structure - 3 or 4 ($)
Mean house or condo value by units in structure - 5 or more ($)
Mean house or condo value by units in structure - Boat, RV, van, etc. ($)
Mean house or condo value by units in structure - Mobile home ($)
Median house or condo value ($) - White
Median house or condo value ($) - Black or African American
Median house or condo value ($) - Asian
Median house or condo value ($) - Hispanic or Latino
Median house or condo value ($) - American Indian and Alaska Native
Median house or condo value ($) - Multirace
Median house or condo value ($) - Other Race
Median resident age
Resident age diversity
Median resident age - Males
Median resident age - Females
Median resident age - White
Median resident age - Black or African American
Median resident age - Asian
Median resident age - Hispanic or Latino
Median resident age - American Indian and Alaska Native
Median resident age - Multirace
Median resident age - Other Race
Median resident age - Males - White
Median resident age - Males - Black or African American
Median resident age - Males - Asian
Median resident age - Males - Hispanic or Latino
Median resident age - Males - American Indian and Alaska Native
Median resident age - Males - Multirace
Median resident age - Males - Other Race
Median resident age - Females - White
Median resident age - Females - Black or African American
Median resident age - Females - Asian
Median resident age - Females - Hispanic or Latino
Median resident age - Females - American Indian and Alaska Native
Median resident age - Females - Multirace
Median resident age - Females - Other Race
Commute - mean travel time to work (minutes)
Travel time to work - Less than 5 minutes (%)
Travel time to work - Less than 5 minutes (% change since 2000)
Travel time to work - 5 to 9 minutes (%)
Travel time to work - 5 to 9 minutes (% change since 2000)
Travel time to work - 10 to 19 minutes (%)
Travel time to work - 10 to 19 minutes (% change since 2000)
Travel time to work - 20 to 29 minutes (%)
Travel time to work - 20 to 29 minutes (% change since 2000)
Travel time to work - 30 to 39 minutes (%)
Travel time to work - 30 to 39 minutes (% change since 2000)
Travel time to work - 40 to 59 minutes (%)
Travel time to work - 40 to 59 minutes (% change since 2000)
Travel time to work - 60 to 89 minutes (%)
Travel time to work - 60 to 89 minutes (% change since 2000)
Travel time to work - 90 or more minutes (%)
Travel time to work - 90 or more minutes (% change since 2000)
Marital status - Never married (%)
Marital status - Now married (%)
Marital status - Separated (%)
Marital status - Widowed (%)
Marital status - Divorced (%)
Median family income ($)
Median family income (% change since 2000)
Median non-family income ($)
Median non-family income (% change since 2000)
Median per capita income ($)
Median per capita income (% change since 2000)
Median family income ($) - White
Median family income ($) - Black or African American
Median family income ($) - Asian
Median family income ($) - Hispanic or Latino
Median family income ($) - American Indian and Alaska Native
Median family income ($) - Multirace
Median family income ($) - Other Race
Median year house/condo built
Median year apartment built
Year house built - Built 2005 or later (%)
Year house built - Built 2000 to 2004 (%)
Year house built - Built 1990 to 1999 (%)
Year house built - Built 1980 to 1989 (%)
Year house built - Built 1970 to 1979 (%)
Year house built - Built 1960 to 1969 (%)
Year house built - Built 1950 to 1959 (%)
Year house built - Built 1940 to 1949 (%)
Year house built - Built 1939 or earlier (%)
Average household size
Household density (households per square mile)
Average household size - White
Average household size - Black or African American
Average household size - Asian
Average household size - Hispanic or Latino
Average household size - American Indian and Alaska Native
Average household size - Multirace
Average household size - Other Race
Occupied housing units (%)
Vacant housing units (%)
Owner occupied housing units (%)
Renter occupied housing units (%)
Vacancy status - For rent (%)
Vacancy status - For sale only (%)
Vacancy status - Rented or sold, not occupied (%)
Vacancy status - For seasonal, recreational, or occasional use (%)
Vacancy status - For migrant workers (%)
Vacancy status - Other vacant (%)
Residents with income below the poverty level (%)
Residents with income below 50% of the poverty level (%)
Children below poverty level (%)
Poor families by family type - Married-couple family (%)
Poor families by family type - Male, no wife present (%)
Poor families by family type - Female, no husband present (%)
Poverty status for native-born residents (%)
Poverty status for foreign-born residents (%)
Poverty among high school graduates not in families (%)
Poverty among people who did not graduate high school not in families (%)
Residents with income below the poverty level (%) - White
Residents with income below the poverty level (%) - Black or African American
Residents with income below the poverty level (%) - Asian
Residents with income below the poverty level (%) - Hispanic or Latino
Residents with income below the poverty level (%) - American Indian and Alaska Native
Residents with income below the poverty level (%) - Multirace
Residents with income below the poverty level (%) - Other Race
Air pollution - Air Quality Index (AQI)
Air pollution - CO
Air pollution - NO2
Air pollution - SO2
Air pollution - Ozone
Air pollution - PM10
Air pollution - PM25
Air pollution - Pb
Crime - Murders per 100,000 population
Crime - Rapes per 100,000 population
Crime - Robberies per 100,000 population
Crime - Assaults per 100,000 population
Crime - Burglaries per 100,000 population
Crime - Thefts per 100,000 population
Crime - Auto thefts per 100,000 population
Crime - Arson per 100,000 population
Crime - City-data.com crime index
Crime - Violent crime index
Crime - Property crime index
Crime - Murders per 100,000 population (5 year average)
Crime - Rapes per 100,000 population (5 year average)
Crime - Robberies per 100,000 population (5 year average)
Crime - Assaults per 100,000 population (5 year average)
Crime - Burglaries per 100,000 population (5 year average)
Crime - Thefts per 100,000 population (5 year average)
Crime - Auto thefts per 100,000 population (5 year average)
Crime - Arson per 100,000 population (5 year average)
Crime - City-data.com crime index (5 year average)
Crime - Violent crime index (5 year average)
Crime - Property crime index (5 year average)
1996 Presidential Elections Results (%) - Democratic Party (Clinton)
1996 Presidential Elections Results (%) - Republican Party (Dole)
1996 Presidential Elections Results (%) - Other
2000 Presidential Elections Results (%) - Democratic Party (Gore)
2000 Presidential Elections Results (%) - Republican Party (Bush)
2000 Presidential Elections Results (%) - Other
2004 Presidential Elections Results (%) - Democratic Party (Kerry)
2004 Presidential Elections Results (%) - Republican Party (Bush)
2004 Presidential Elections Results (%) - Other
2008 Presidential Elections Results (%) - Democratic Party (Obama)
2008 Presidential Elections Results (%) - Republican Party (McCain)
2008 Presidential Elections Results (%) - Other
2012 Presidential Elections Results (%) - Democratic Party (Obama)
2012 Presidential Elections Results (%) - Republican Party (Romney)
2012 Presidential Elections Results (%) - Other
2016 Presidential Elections Results (%) - Democratic Party (Clinton)
2016 Presidential Elections Results (%) - Republican Party (Trump)
2016 Presidential Elections Results (%) - Other
2020 Presidential Elections Results (%) - Democratic Party (Biden)
2020 Presidential Elections Results (%) - Republican Party (Trump)
2020 Presidential Elections Results (%) - Other
Ancestries Reported - Arab (%)
Ancestries Reported - Czech (%)
Ancestries Reported - Danish (%)
Ancestries Reported - Dutch (%)
Ancestries Reported - English (%)
Ancestries Reported - French (%)
Ancestries Reported - French Canadian (%)
Ancestries Reported - German (%)
Ancestries Reported - Greek (%)
Ancestries Reported - Hungarian (%)
Ancestries Reported - Irish (%)
Ancestries Reported - Italian (%)
Ancestries Reported - Lithuanian (%)
Ancestries Reported - Norwegian (%)
Ancestries Reported - Polish (%)
Ancestries Reported - Portuguese (%)
Ancestries Reported - Russian (%)
Ancestries Reported - Scotch-Irish (%)
Ancestries Reported - Scottish (%)
Ancestries Reported - Slovak (%)
Ancestries Reported - Subsaharan African (%)
Ancestries Reported - Swedish (%)
Ancestries Reported - Swiss (%)
Ancestries Reported - Ukrainian (%)
Ancestries Reported - United States (%)
Ancestries Reported - Welsh (%)
Ancestries Reported - West Indian (%)
Ancestries Reported - Other (%)
Educational Attainment - No schooling completed (%)
Educational Attainment - Less than high school (%)
Educational Attainment - High school or equivalent (%)
Educational Attainment - Less than 1 year of college (%)
Educational Attainment - 1 or more years of college (%)
Educational Attainment - Associate degree (%)
Educational Attainment - Bachelor's degree (%)
Educational Attainment - Master's degree (%)
Educational Attainment - Professional school degree (%)
Educational Attainment - Doctorate degree (%)
School Enrollment - Nursery, preschool (%)
School Enrollment - Kindergarten (%)
School Enrollment - Grade 1 to 4 (%)
School Enrollment - Grade 5 to 8 (%)
School Enrollment - Grade 9 to 12 (%)
School Enrollment - College undergrad (%)
School Enrollment - Graduate or professional (%)
School Enrollment - Not enrolled in school (%)
School enrollment - Public schools (%)
School enrollment - Private schools (%)
School enrollment - Not enrolled (%)
Median number of rooms in houses and condos
Median number of rooms in apartments
Housing units lacking complete plumbing facilities (%)
Housing units lacking complete kitchen facilities (%)
Density of houses
Urban houses (%)
Rural houses (%)
Households with people 60 years and over (%)
Households with people 65 years and over (%)
Households with people 75 years and over (%)
Households with one or more nonrelatives (%)
Households with no nonrelatives (%)
Population in households (%)
Family households (%)
Nonfamily households (%)
Population in families (%)
Family households with own children (%)
Median number of bedrooms in owner occupied houses
Mean number of bedrooms in owner occupied houses
Median number of bedrooms in renter occupied houses
Mean number of bedrooms in renter occupied houses
Median number of vehichles in owner occupied houses
Mean number of vehichles in owner occupied houses
Median number of vehichles in renter occupied houses
Mean number of vehichles in renter occupied houses
Mortgage status - with mortgage (%)
Mortgage status - with second mortgage (%)
Mortgage status - with home equity loan (%)
Mortgage status - with both second mortgage and home equity loan (%)
Mortgage status - without a mortgage (%)
Average family size
Average family size - White
Average family size - Black or African American
Average family size - Asian
Average family size - Hispanic or Latino
Average family size - American Indian and Alaska Native
Average family size - Multirace
Average family size - Other Race
Geographical mobility - Same house 1 year ago (%)
Geographical mobility - Moved within same county (%)
Geographical mobility - Moved from different county within same state (%)
Geographical mobility - Moved from different state (%)
Geographical mobility - Moved from abroad (%)
Place of birth - Born in state of residence (%)
Place of birth - Born in other state (%)
Place of birth - Native, outside of US (%)
Place of birth - Foreign born (%)
Housing units in structures - 1, detached (%)
Housing units in structures - 1, attached (%)
Housing units in structures - 2 (%)
Housing units in structures - 3 or 4 (%)
Housing units in structures - 5 to 9 (%)
Housing units in structures - 10 to 19 (%)
Housing units in structures - 20 to 49 (%)
Housing units in structures - 50 or more (%)
Housing units in structures - Mobile home (%)
Housing units in structures - Boat, RV, van, etc. (%)
House/condo owner moved in on average (years ago)
Renter moved in on average (years ago)
Year householder moved into unit - Moved in 1999 to March 2000 (%)
Year householder moved into unit - Moved in 1995 to 1998 (%)
Year householder moved into unit - Moved in 1990 to 1994 (%)
Year householder moved into unit - Moved in 1980 to 1989 (%)
Year householder moved into unit - Moved in 1970 to 1979 (%)
Year householder moved into unit - Moved in 1969 or earlier (%)
Means of transportation to work - Drove car alone (%)
Means of transportation to work - Carpooled (%)
Means of transportation to work - Public transportation (%)
Means of transportation to work - Bus or trolley bus (%)
Means of transportation to work - Streetcar or trolley car (%)
Means of transportation to work - Subway or elevated (%)
Means of transportation to work - Railroad (%)
Means of transportation to work - Ferryboat (%)
Means of transportation to work - Taxicab (%)
Means of transportation to work - Motorcycle (%)
Means of transportation to work - Bicycle (%)
Means of transportation to work - Walked (%)
Means of transportation to work - Other means (%)
Working at home (%)
Industry diversity
Most Common Industries - Agriculture, forestry, fishing and hunting, and mining (%)
Most Common Industries - Agriculture, forestry, fishing and hunting (%)
Most Common Industries - Mining, quarrying, and oil and gas extraction (%)
Most Common Industries - Construction (%)
Most Common Industries - Manufacturing (%)
Most Common Industries - Wholesale trade (%)
Most Common Industries - Retail trade (%)
Most Common Industries - Transportation and warehousing, and utilities (%)
Most Common Industries - Transportation and warehousing (%)
Most Common Industries - Utilities (%)
Most Common Industries - Information (%)
Most Common Industries - Finance and insurance, and real estate and rental and leasing (%)
Most Common Industries - Finance and insurance (%)
Most Common Industries - Real estate and rental and leasing (%)
Most Common Industries - Professional, scientific, and management, and administrative and waste management services (%)
Most Common Industries - Professional, scientific, and technical services (%)
Most Common Industries - Management of companies and enterprises (%)
Most Common Industries - Administrative and support and waste management services (%)
Most Common Industries - Educational services, and health care and social assistance (%)
Most Common Industries - Educational services (%)
Most Common Industries - Health care and social assistance (%)
Most Common Industries - Arts, entertainment, and recreation, and accommodation and food services (%)
Most Common Industries - Arts, entertainment, and recreation (%)
Most Common Industries - Accommodation and food services (%)
Most Common Industries - Other services, except public administration (%)
Most Common Industries - Public administration (%)
Occupation diversity
Most Common Occupations - Management, business, science, and arts occupations (%)
Most Common Occupations - Management, business, and financial occupations (%)
Most Common Occupations - Management occupations (%)
Most Common Occupations - Business and financial operations occupations (%)
Most Common Occupations - Computer, engineering, and science occupations (%)
Most Common Occupations - Computer and mathematical occupations (%)
Most Common Occupations - Architecture and engineering occupations (%)
Most Common Occupations - Life, physical, and social science occupations (%)
Most Common Occupations - Education, legal, community service, arts, and media occupations (%)
Most Common Occupations - Community and social service occupations (%)
Most Common Occupations - Legal occupations (%)
Most Common Occupations - Education, training, and library occupations (%)
Most Common Occupations - Arts, design, entertainment, sports, and media occupations (%)
Most Common Occupations - Healthcare practitioners and technical occupations (%)
Most Common Occupations - Health diagnosing and treating practitioners and other technical occupations (%)
Most Common Occupations - Health technologists and technicians (%)
Most Common Occupations - Service occupations (%)
Most Common Occupations - Healthcare support occupations (%)
Most Common Occupations - Protective service occupations (%)
Most Common Occupations - Fire fighting and prevention, and other protective service workers including supervisors (%)
Most Common Occupations - Law enforcement workers including supervisors (%)
Most Common Occupations - Food preparation and serving related occupations (%)
Most Common Occupations - Building and grounds cleaning and maintenance occupations (%)
Most Common Occupations - Personal care and service occupations (%)
Most Common Occupations - Sales and office occupations (%)
Most Common Occupations - Sales and related occupations (%)
Most Common Occupations - Office and administrative support occupations (%)
Most Common Occupations - Natural resources, construction, and maintenance occupations (%)
Most Common Occupations - Farming, fishing, and forestry occupations (%)
Most Common Occupations - Construction and extraction occupations (%)
Most Common Occupations - Installation, maintenance, and repair occupations (%)
Most Common Occupations - Production, transportation, and material moving occupations (%)
Most Common Occupations - Production occupations (%)
Most Common Occupations - Transportation occupations (%)
Most Common Occupations - Material moving occupations (%)
People in Group quarters - Institutionalized population (%)
People in Group quarters - Correctional institutions (%)
People in Group quarters - Federal prisons and detention centers (%)
People in Group quarters - Halfway houses (%)
People in Group quarters - Local jails and other confinement facilities (including police lockups) (%)
People in Group quarters - Military disciplinary barracks (%)
People in Group quarters - State prisons (%)
People in Group quarters - Other types of correctional institutions (%)
People in Group quarters - Nursing homes (%)
People in Group quarters - Hospitals/wards, hospices, and schools for the handicapped (%)
People in Group quarters - Hospitals/wards and hospices for chronically ill (%)
People in Group quarters - Hospices or homes for chronically ill (%)
People in Group quarters - Military hospitals or wards for chronically ill (%)
People in Group quarters - Other hospitals or wards for chronically ill (%)
People in Group quarters - Hospitals or wards for drug/alcohol abuse (%)
People in Group quarters - Mental (Psychiatric) hospitals or wards (%)
People in Group quarters - Schools, hospitals, or wards for the mentally retarded (%)
People in Group quarters - Schools, hospitals, or wards for the physically handicapped (%)
People in Group quarters - Institutions for the deaf (%)
People in Group quarters - Institutions for the blind (%)
People in Group quarters - Orthopedic wards and institutions for the physically handicapped (%)
People in Group quarters - Wards in general hospitals for patients who have no usual home elsewhere (%)
People in Group quarters - Wards in military hospitals for patients who have no usual home elsewhere (%)
People in Group quarters - Juvenile institutions (%)
People in Group quarters - Long-term care (%)
People in Group quarters - Homes for abused, dependent, and neglected children (%)
People in Group quarters - Residential treatment centers for emotionally disturbed children (%)
People in Group quarters - Training schools for juvenile delinquents (%)
People in Group quarters - Short-term care, detention or diagnostic centers for delinquent children (%)
People in Group quarters - Type of juvenile institution unknown (%)
People in Group quarters - Noninstitutionalized population (%)
People in Group quarters - College dormitories (includes college quarters off campus) (%)
People in Group quarters - Military quarters (%)
People in Group quarters - On base (%)
People in Group quarters - Barracks, unaccompanied personnel housing (UPH), (Enlisted/Officer), ;and similar group living quarters for military personnel (%)
People in Group quarters - Transient quarters for temporary residents (%)
People in Group quarters - Military ships (%)
People in Group quarters - Group homes (%)
People in Group quarters - Homes or halfway houses for drug/alcohol abuse (%)
People in Group quarters - Homes for the mentally ill (%)
People in Group quarters - Homes for the mentally retarded (%)
People in Group quarters - Homes for the physically handicapped (%)
People in Group quarters - Other group homes (%)
People in Group quarters - Religious group quarters (%)
People in Group quarters - Dormitories (%)
People in Group quarters - Agriculture workers' dormitories on farms (%)
People in Group quarters - Job Corps and vocational training facilities (%)
People in Group quarters - Other workers' dormitories (%)
People in Group quarters - Crews of maritime vessels (%)
People in Group quarters - Other nonhousehold living situations (%)
People in Group quarters - Other noninstitutional group quarters (%)
Residents speaking English at home (%)
Residents speaking English at home - Born in the United States (%)
Residents speaking English at home - Native, born elsewhere (%)
Residents speaking English at home - Foreign born (%)
Residents speaking Spanish at home (%)
Residents speaking Spanish at home - Born in the United States (%)
Residents speaking Spanish at home - Native, born elsewhere (%)
Residents speaking Spanish at home - Foreign born (%)
Residents speaking other language at home (%)
Residents speaking other language at home - Born in the United States (%)
Residents speaking other language at home - Native, born elsewhere (%)
Residents speaking other language at home - Foreign born (%)
Class of Workers - Employee of private company (%)
Class of Workers - Self-employed in own incorporated business (%)
Class of Workers - Private not-for-profit wage and salary workers (%)
Class of Workers - Local government workers (%)
Class of Workers - State government workers (%)
Class of Workers - Federal government workers (%)
Class of Workers - Self-employed workers in own not incorporated business and Unpaid family workers (%)
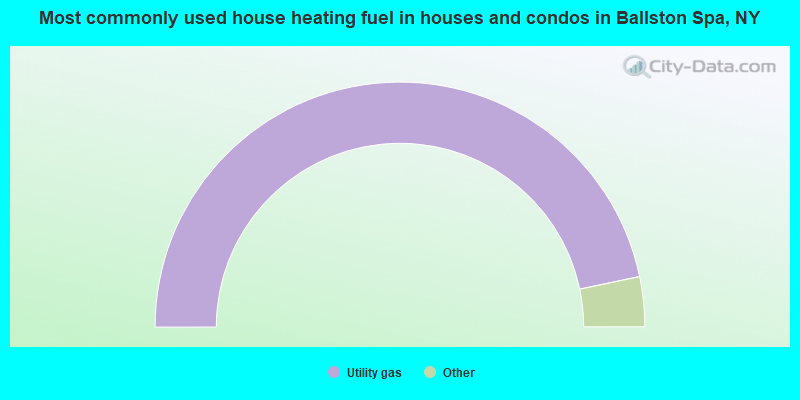
House heating fuel used in houses and condos - Utility gas (%)
House heating fuel used in houses and condos - Bottled, tank, or LP gas (%)
House heating fuel used in houses and condos - Electricity (%)
House heating fuel used in houses and condos - Fuel oil, kerosene, etc. (%)
House heating fuel used in houses and condos - Coal or coke (%)
House heating fuel used in houses and condos - Wood (%)
House heating fuel used in houses and condos - Solar energy (%)
House heating fuel used in houses and condos - Other fuel (%)
House heating fuel used in houses and condos - No fuel used (%)
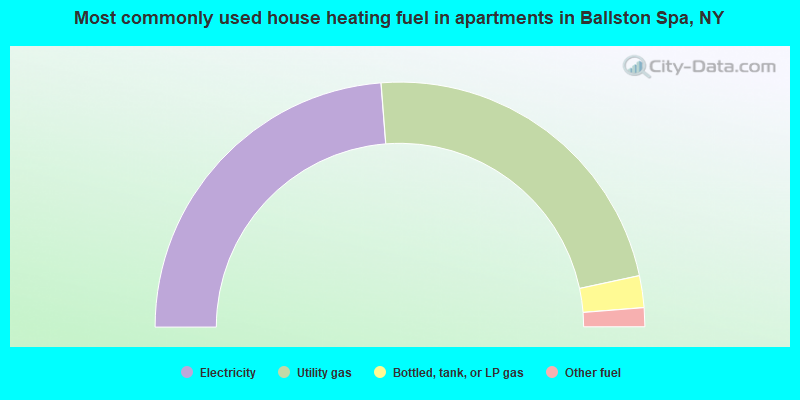
House heating fuel used in apartments - Utility gas (%)
House heating fuel used in apartments - Bottled, tank, or LP gas (%)
House heating fuel used in apartments - Electricity (%)
House heating fuel used in apartments - Fuel oil, kerosene, etc. (%)
House heating fuel used in apartments - Coal or coke (%)
House heating fuel used in apartments - Wood (%)
House heating fuel used in apartments - Solar energy (%)
House heating fuel used in apartments - Other fuel (%)
House heating fuel used in apartments - No fuel used (%)
Armed forces status - In Armed Forces (%)
Armed forces status - Civilian (%)
Armed forces status - Civilian - Veteran (%)
Armed forces status - Civilian - Nonveteran (%)
Fatal accidents locations in years 2005-2021
Fatal accidents locations in 2005
Fatal accidents locations in 2006
Fatal accidents locations in 2007
Fatal accidents locations in 2008
Fatal accidents locations in 2009
Fatal accidents locations in 2010
Fatal accidents locations in 2011
Fatal accidents locations in 2012
Fatal accidents locations in 2013
Fatal accidents locations in 2014
Fatal accidents locations in 2015
Fatal accidents locations in 2016
Fatal accidents locations in 2017
Fatal accidents locations in 2018
Fatal accidents locations in 2019
Fatal accidents locations in 2020
Fatal accidents locations in 2021
Alcohol use - People drinking some alcohol every month (%)
Alcohol use - People not drinking at all (%)
Alcohol use - Average days/month drinking alcohol
Alcohol use - Average drinks/week
Alcohol use - Average days/year people drink much
Audiometry - Average condition of hearing (%)
Audiometry - People that can hear a whisper from across a quiet room (%)
Audiometry - People that can hear normal voice from across a quiet room (%)
Audiometry - Ears ringing, roaring, buzzing (%)
Audiometry - Had a job exposure to loud noise (%)
Audiometry - Had off-work exposure to loud noise (%)
Blood Pressure & Cholesterol - Has high blood pressure (%)
Blood Pressure & Cholesterol - Checking blood pressure at home (%)
Blood Pressure & Cholesterol - Frequently checking blood cholesterol (%)
Blood Pressure & Cholesterol - Has high cholesterol level (%)
Consumer Behavior - Money monthly spent on food at supermarket/grocery store
Consumer Behavior - Money monthly spent on food at other stores
Consumer Behavior - Money monthly spent on eating out
Consumer Behavior - Money monthly spent on carryout/delivered foods
Consumer Behavior - Income spent on food at supermarket/grocery store (%)
Consumer Behavior - Income spent on food at other stores (%)
Consumer Behavior - Income spent on eating out (%)
Consumer Behavior - Income spent on carryout/delivered foods (%)
Current Health Status - General health condition (%)
Current Health Status - Blood donors (%)
Current Health Status - Has blood ever tested for HIV virus (%)
Current Health Status - Left-handed people (%)
Dermatology - People using sunscreen (%)
Diabetes - Diabetics (%)
Diabetes - Had a blood test for high blood sugar (%)
Diabetes - People taking insulin (%)
Diet Behavior & Nutrition - Diet health (%)
Diet Behavior & Nutrition - Milk product consumption (# of products/month)
Diet Behavior & Nutrition - Meals not home prepared (#/week)
Diet Behavior & Nutrition - Meals from fast food or pizza place (#/week)
Diet Behavior & Nutrition - Ready-to-eat foods (#/month)
Diet Behavior & Nutrition - Frozen meals/pizza (#/month)
Drug Use - People that ever used marijuana or hashish (%)
Drug Use - Ever used hard drugs (%)
Drug Use - Ever used any form of cocaine (%)
Drug Use - Ever used heroin (%)
Drug Use - Ever used methamphetamine (%)
Health Insurance - People covered by health insurance (%)
Kidney Conditions-Urology - Avg. # of times urinating at night
Medical Conditions - People with asthma (%)
Medical Conditions - People with anemia (%)
Medical Conditions - People with psoriasis (%)
Medical Conditions - People with overweight (%)
Medical Conditions - Elderly people having difficulties in thinking or remembering (%)
Medical Conditions - People who ever received blood transfusion (%)
Medical Conditions - People having trouble seeing even with glass/contacts (%)
Medical Conditions - People with arthritis (%)
Medical Conditions - People with gout (%)
Medical Conditions - People with congestive heart failure (%)
Medical Conditions - People with coronary heart disease (%)
Medical Conditions - People with angina pectoris (%)
Medical Conditions - People who ever had heart attack (%)
Medical Conditions - People who ever had stroke (%)
Medical Conditions - People with emphysema (%)
Medical Conditions - People with thyroid problem (%)
Medical Conditions - People with chronic bronchitis (%)
Medical Conditions - People with any liver condition (%)
Medical Conditions - People who ever had cancer or malignancy (%)
Mental Health - People who have little interest in doing things (%)
Mental Health - People feeling down, depressed, or hopeless (%)
Mental Health - People who have trouble sleeping or sleeping too much (%)
Mental Health - People feeling tired or having little energy (%)
Mental Health - People with poor appetite or overeating (%)
Mental Health - People feeling bad about themself (%)
Mental Health - People who have trouble concentrating on things (%)
Mental Health - People moving or speaking slowly or too fast (%)
Mental Health - People having thoughts they would be better off dead (%)
Oral Health - Average years since last visit a dentist
Oral Health - People embarrassed because of mouth (%)
Oral Health - People with gum disease (%)
Oral Health - General health of teeth and gums (%)
Oral Health - Average days a week using dental floss/device
Oral Health - Average days a week using mouthwash for dental problem
Oral Health - Average number of teeth
Pesticide Use - Households using pesticides to control insects (%)
Pesticide Use - Households using pesticides to kill weeds (%)
Physical Activity - People doing vigorous-intensity work activities (%)
Physical Activity - People doing moderate-intensity work activities (%)
Physical Activity - People walking or bicycling (%)
Physical Activity - People doing vigorous-intensity recreational activities (%)
Physical Activity - People doing moderate-intensity recreational activities (%)
Physical Activity - Average hours a day doing sedentary activities
Physical Activity - Average hours a day watching TV or videos
Physical Activity - Average hours a day using computer
Physical Functioning - People having limitations keeping them from working (%)
Physical Functioning - People limited in amount of work they can do (%)
Physical Functioning - People that need special equipment to walk (%)
Physical Functioning - People experiencing confusion/memory problems (%)
Physical Functioning - People requiring special healthcare equipment (%)
Prescription Medications - Average number of prescription medicines taking
Preventive Aspirin Use - Adults 40+ taking low-dose aspirin (%)
Reproductive Health - Vaginal deliveries (%)
Reproductive Health - Cesarean deliveries (%)
Reproductive Health - Deliveries resulted in a live birth (%)
Reproductive Health - Pregnancies resulted in a delivery (%)
Reproductive Health - Women breastfeeding newborns (%)
Reproductive Health - Women that had a hysterectomy (%)
Reproductive Health - Women that had both ovaries removed (%)
Reproductive Health - Women that have ever taken birth control pills (%)
Reproductive Health - Women taking birth control pills (%)
Reproductive Health - Women that have ever used Depo-Provera or injectables (%)
Reproductive Health - Women that have ever used female hormones (%)
Sexual Behavior - People 18+ that ever had sex (vaginal, anal, or oral) (%)
Sexual Behavior - Males 18+ that ever had vaginal sex with a woman (%)
Sexual Behavior - Males 18+ that ever performed oral sex on a woman (%)
Sexual Behavior - Males 18+ that ever had anal sex with a woman (%)
Sexual Behavior - Males 18+ that ever had any sex with a man (%)
Sexual Behavior - Females 18+ that ever had vaginal sex with a man (%)
Sexual Behavior - Females 18+ that ever performed oral sex on a man (%)
Sexual Behavior - Females 18+ that ever had anal sex with a man (%)
Sexual Behavior - Females 18+ that ever had any kind of sex with a woman (%)
Sexual Behavior - Average age people first had sex
Sexual Behavior - Average number of female sex partners in lifetime (males 18+)
Sexual Behavior - Average number of female vaginal sex partners in lifetime (males 18+)
Sexual Behavior - Average age people first performed oral sex on a woman (18+)
Sexual Behavior - Average number of woman performed oral sex on in lifetime (18+)
Sexual Behavior - Average number of male sex partners in lifetime (males 18+)
Sexual Behavior - Average number of male anal sex partners in lifetime (males 18+)
Sexual Behavior - Average age people first performed oral sex on a man (18+)
Sexual Behavior - Average number of male oral sex partners in lifetime (18+)
Sexual Behavior - People using protection when performing oral sex (%)
Sexual Behavior - Average number of times people have vaginal or anal sex a year
Sexual Behavior - People having sex without condom (%)
Sexual Behavior - Average number of male sex partners in lifetime (females 18+)
Sexual Behavior - Average number of male vaginal sex partners in lifetime (females 18+)
Sexual Behavior - Average number of female sex partners in lifetime (females 18+)
Sexual Behavior - Circumcised males 18+ (%)
Sleep Disorders - Average hours sleeping at night
Sleep Disorders - People that has trouble sleeping (%)
Smoking-Cigarette Use - People smoking cigarettes (%)
Taste & Smell - People 40+ having problems with smell (%)
Taste & Smell - People 40+ having problems with taste (%)
Taste & Smell - People 40+ that ever had wisdom teeth removed (%)
Taste & Smell - People 40+ that ever had tonsils teeth removed (%)
Taste & Smell - People 40+ that ever had a loss of consciousness because of a head injury (%)
Taste & Smell - People 40+ that ever had a broken nose or other serious injury to face or skull (%)
Taste & Smell - People 40+ that ever had two or more sinus infections (%)
Weight - Average height (inches)
Weight - Average weight (pounds)
Weight - Average BMI
Weight - People that are obese (%)
Weight - People that ever were obese (%)
Weight - People trying to lose weight (%)
Officers per 1,000 residents here:
0.58New York average:
3.28
Latest news from Ballston Spa, NY collected exclusively by city-data.com from local newspapers, TV, and radio stations
Ancestries: Irish (30.2%), American (8.7%), English (8.5%), Italian (7.7%), German (6.9%), Polish (5.5%).
Current Local Time:
Land area: 1.60 square miles.
Population density: 3,105 people per square mile (average).
139 residents are foreign born (0.9% Europe , 0.9% Asia , 0.5% Latin America , 0.3% North America ).
This village:
2.6%New York:
22.6%
Median real estate property taxes paid for housing units with mortgages in 2022: $5,549 (1.9%)Median real estate property taxes paid for housing units with no mortgage in 2022: $5,120 (1.8%)
Nearest city with pop. 50,000+: Schenectady, NY
Nearest city with pop. 200,000+: Boston, MA
Nearest city with pop. 1,000,000+: Bronx, NY
Nearest cities:
Latitude: 43.01 N, Longitude: 73.85 W
Daytime population change due to commuting: +609 (+11.4%)Workers who live and work in this village: 995 (32.0%)
Single-family new house construction building permits:
2022: 3 buildings , average cost: $242,7002020: 2 buildings , average cost: $155,0002019: 1 building , cost: $160,0002018: 4 buildings , average cost: $232,5002017: 4 buildings , average cost: $243,8002016: 2 buildings , average cost: $315,0002015: 2 buildings , average cost: $350,0002013: 5 buildings , average cost: $275,0002012: 2 buildings , average cost: $300,0002011: 2 buildings , average cost: $300,0002010: 5 buildings , average cost: $300,0002009: 8 buildings , average cost: $250,0002008: 5 buildings , average cost: $287,0002007: 2 buildings , average cost: $250,0002002: 4 buildings , average cost: $73,8002000: 2 buildings , average cost: $80,0001999: 1 building , cost: $50,0001998: 2 buildings , average cost: $75,0001997: 8 buildings , average cost: $73,100Unemployment in December 2023:
Population change in the 1990s: +333 (+6.4%).
Most common occupations in Ballston Spa, NY (%)
Both Males Females
Other office and administrative support workers, including supervisors (5.3%)
Engineers (4.8%)
Customer service representatives (4.1%)
Information and record clerks, except customer service representatives (4.0%)
Building and grounds cleaning and maintenance occupations (2.8%)
Retail sales workers, except cashiers (2.8%)
Electrical equipment mechanics and other installation, maintenance, and repair workers, including supervisors (2.8%)
Engineers (7.6%)
Electrical equipment mechanics and other installation, maintenance, and repair workers, including supervisors (5.2%)
Construction traders workers except carpenters, electricians, painters, plumbers, and construction laborers (4.7%)
Laborers and material movers, hand (4.5%)
Building and grounds cleaning and maintenance occupations (4.1%)
Other production occupations, including supervisors (3.9%)
Other sales and related occupations, including supervisors (3.6%)
Other office and administrative support workers, including supervisors (10.5%)
Information and record clerks, except customer service representatives (6.5%)
Customer service representatives (6.5%)
Registered nurses (4.7%)
Secretaries and administrative assistants (4.2%)
Preschool, kindergarten, elementary, and middle school teachers (4.1%)
Counselors, social workers, and other community and social service specialists (4.0%)
Air pollution and air quality trends(lower is better)
AQI CO SO2 Ozone
Tornado activity:
Ballston Spa-area historical tornado activity is slightly above New York state average. It is 57% smaller than the overall U.S. average.
On 6/16/1974, a category F3 (max. wind speeds 158-206 mph) tornado 6.2 miles away from the Ballston Spa village center caused between $500,000 and $5,000,000 in damages.
On 5/31/1998, a category F3 tornado 7.3 miles away from the village center injured 68 people and caused $71 million in damages.
Earthquake activity:
Ballston Spa-area historical earthquake activity is significantly above New York state average. It is 68% smaller than the overall U.S. average. On 10/7/1983 at 10:18:46, a magnitude 5.3 (5.1 MB, 5.3 LG, 5.1 ML, Class: Moderate, Intensity: VI - VII) earthquake occurred 69.9 miles away from the city center On 4/20/2002 at 10:50:47, a magnitude 5.3 (5.3 ML, Depth: 3.0 mi) earthquake occurred 104.4 miles away from Ballston Spa center On 4/20/2002 at 10:50:47, a magnitude 5.2 (5.2 MB, 4.2 MS, 5.2 MW, 5.0 MW) earthquake occurred 102.6 miles away from the city center On 1/19/1982 at 00:14:42, a magnitude 4.7 (4.5 MB, 4.7 MD, 4.5 LG, Class: Light, Intensity: IV - V) earthquake occurred 118.4 miles away from Ballston Spa center On 10/16/2012 at 23:12:25, a magnitude 4.7 (4.7 ML, Depth: 10.0 mi) earthquake occurred 165.9 miles away from Ballston Spa center On 6/17/1991 at 08:53:16, a magnitude 4.1 (4.0 MB, 4.0 LG, Depth: 3.1 mi) earthquake occurred 49.4 miles away from Ballston Spa center Magnitude types: regional Lg-wave magnitude (LG), body-wave magnitude (MB), duration magnitude (MD), local magnitude (ML), surface-wave magnitude (MS), moment magnitude (MW) Natural disasters: The number of natural disasters in Saratoga County (17) is near the US average (15).Major Disasters (Presidential) Declared: 8Emergencies Declared: 7Winter Storms: 5, Storms: 4, Floods: 3, Hurricanes: 3, Snowstorms: 2, Blizzard: 1, Power Outage: 1, Tornado: 1, Wind: 1, Other: 2 (Note: some incidents may be assigned to more than one category). Hospitals and medical centers in Ballston Spa: AIM SERVICES, INC (8 SLEEPY COURT) AIM SERVICES, INC (292 STONECHURCH RD) GENTIVA HEALTH SVS BALLSTON SPA (100 SARATOGA VILLAGE BLVD, SUITE 5)
SARATOGA COUNTY HRF (BALLSTON AVE)
SARATOGA COUNTY MAPLEWOOD MANOR (149 BALLSTON AVENUE)
Amtrak stations near Ballston Spa: 6 miles: SARATOGA SPRINGS (WEST AVE. & STATION LN.) Services: ticket office, partially wheelchair accessible, enclosed waiting area, public restrooms, public payphones, free short-term parking, free long-term parking, call for car rental service, call for taxi service, public transit connection.
15 miles: SCHENECTADY (332 ERIE BLVD.) Services: ticket office, fully wheelchair accessible, enclosed waiting area, public restrooms, public payphones, vending machines, ATM, free short-term parking, free long-term parking, call for car rental service, taxi stand, public transit connection.
19 miles: AMSTERDAM (RAILROAD & W. MAIN STS.) Services: enclosed waiting area, public restrooms, public payphones, free short-term parking, free long-term parking, call for car rental service, call for taxi service, public transit connection.
College/University in Ballston Spa: John Paolo's Xtreme Beauty Institute-Goldwell Product Artistry Full-time enrollment: 196; Location: 2144 Saratoga Ave; Private, for-profit; Website: www.xtremebeautyinstitute.com)
Colleges/universities with over 2000 students nearest to Ballston Spa:
SUNY Empire State College (about 7 miles; Saratoga Springs, NY ; Full-time enrollment: 9,473)
Skidmore College (about 7 miles; Saratoga Springs, NY ; FT enrollment: 2,753)
Union College (about 14 miles; Schenectady, NY ; FT enrollment: 2,075)
Schenectady County Community College (about 15 miles; Schenectady, NY ; FT enrollment: 3,676)
Siena College (about 21 miles; Loudonville, NY ; FT enrollment: 3,153)
The Sage Colleges (about 21 miles; Troy, NY ; FT enrollment: 2,499)
Excelsior College (about 21 miles; Albany, NY ; FT enrollment: 4,723)
Public high school in Ballston Spa:
Public elementary/middle schools in Ballston Spa: BALLSTON SPA MIDDLE SCHOOL Students: 1,027, Location: 210 BALLSTON AVE, Grades: 6-8)WOOD ROAD ELEMENTARY SCHOOL Students: 543, Location: 300 WOOD RD, Grades: KG-5)MILTON TERRACE NORTH ELEMENTARY SCHOOL Students: 406, Location: 200 WOOD RD, Grades: KG-5)MALTA AVENUE ELEMENTARY SCHOOL Students: 387, Location: 70 MALTA AVE, Grades: KG-5)GORDON CREEK ELEMENTARY SCHOOL Location: 50 WOOD RD, Grades: KG-5)
Private elementary/middle schools in Ballston Spa: ST MARY S SCHOOL Students: 212, Location: 40 THOMPSON ST, Grades: PK-5)
SPA CHRISTIAN SCHOOL Students: 70, Location: 206 GREENFIELD AVE, Grades: PK-6)See full list of schools located in Ballston Spa Library in Ballston Spa: BALLSTON SPA PUBLIC LIBRARY Operating income: $223,304; Location: 21 MILTON AVENUE; 31,412 books ; 4,774 audio materials ; 2,290 video materials ; 1 local licensed databases ; 14 state licensed databases ; 71 print serial subscriptions )
Notable locations in Ballston Spa: (A) , Ballston Spa Public Library (B) , Union Fire Company Number 2 (C) , Saratoga County Office Building (D) , Saratoga County Court House (E) , National Bottle Museum (F) , Saratoga County Maplewood Manor Nursing Home (G) , Ballston Town Hall (H) , Eagle Matt Lee Fire Department (I) . Display/hide their locations on the map
Churches in Ballston Spa include: (A) , Ballston Spa Presbyterian Church (B) , Gospel Tabernacle (C) , Christ Episcopal Church (D) , First Baptist Church (E) , Saint Mary's Roman Catholic Church (F) , Ballston Spa United Methodist Church (G) . Display/hide their locations on the map
Cemetery: (1) . Display/hide its location on the map
Lake: (A) . Display/hide its location on the map
Creek: (A) . Display/hide its location on the map
Park in Ballston Spa: (1) . Display/hide its location on the map
Tourist attractions:
Hotel:
Courts:
Birthplace of: Abner Doubleday - Union Army general, Fessenden Nott Otis - Physician, Ira Thomas - Baseball player, Todd Waring - Film, Gerry Perry - Football player.
Saratoga County has a predicted average indoor radon screening level between 2 and 4 pCi/L (pico curies per liter) - Moderate Potential Drinking water stations with addresses in Ballston Spa and their reported violations in the past:
BALLSTON SPA VILLAGE (Address: 66 FRONT STREET Population served: 18,909, Groundwater):
Past health violations:
MCL, Monthly (TCR) - In JUN-2009, Contaminant: Coliform. Follow-up actions: St Boil Water Order (JUN-27-2009), St Compliance achieved (JUN-28-2009), St Public Notif requested (OCT-23-2009), St Formal NOV issued (OCT-23-2009), St Public Notif received (MAY-06-2010)
MCL, Average - Between JAN-2009 and DEC-2009, Contaminant: Color. Follow-up actions: St Compliance achieved (SEP-28-2009), St Public Notif requested (DEC-21-2009), St Formal NOV issued (DEC-21-2009), St Public Notif received (MAY-06-2010)
MCL, Average - Between JAN-2009 and DEC-2009, Contaminant: Iron. Follow-up actions: St Compliance achieved (SEP-28-2009), St Public Notif requested (DEC-21-2009), St Formal NOV issued (DEC-21-2009), St Public Notif received (2 times from MAY-06-2010 to MAY-27-2011)
MCL, Average - Between JAN-2007 and DEC-2007, Contaminant: Iron. Follow-up actions: St Formal NOV issued (NOV-13-2007), St Public Notif received (MAY-15-2008), St Compliance achieved (FEB-10-2011)
Past monitoring violations:
72 regular monitoring violations
Population served: 500, Groundwater):
Past health violations:
MCL, Monthly (TCR) - In SEP-2013, Contaminant: Coliform. Follow-up actions: St Public Notif received (OCT-04-2013), St Formal NOV issued (NOV-22-2013), St Compliance achieved (NOV-22-2013), St Boil Water Order (NOV-22-2013)
Past monitoring violations:
One regular monitoring violation
Address: 423 DEVILS LANE Population served: 140, Groundwater):
Past monitoring violations:
2 routine major monitoring violations
Address: 2961 ROUTE 9 Population served: 110, Groundwater):
Past monitoring violations:
Monitoring, Repeat Major (TCR) - In SEP-2012, Contaminant: Coliform (TCR). Follow-up actions: St Public Notif requested (NOV-02-2012), St Formal NOV issued (NOV-02-2012), St Public Notif received (NOV-08-2012)
Monitoring, Source Water (GWR) - In SEP-2012, Contaminant: E. COLI. Follow-up actions: St Formal NOV issued (NOV-02-2012), St Public Notif requested (NOV-02-2012)
7 routine major monitoring violations
One regular monitoring violation
Population served: 100, Groundwater):
Past health violations:
MCL, Monthly (TCR) - In OCT-2010, Contaminant: Coliform. Follow-up actions: St Boil Water Order (OCT-18-2010), St Public Notif requested (JAN-05-2011), St Formal NOV issued (JAN-05-2011), St Compliance achieved (APR-19-2011)
Past monitoring violations:
Monitoring, Source Water (GWR) - In OCT-2010, Contaminant: E. COLI
One routine major monitoring violation
One minor monitoring violation
Address: 152 WEST HIGH STREET Population served: 100, Groundwater):
Past health violations:
MCL, Monthly (TCR) - In JUL-2006, Contaminant: Coliform. Follow-up actions: St Boil Water Order (JUL-10-2006), St Compliance achieved (DEC-08-2006)
Past monitoring violations:
Monitoring, Repeat Major (TCR) - In JUN-2005, Contaminant: Coliform (TCR). Follow-up actions: St Compliance achieved (MAR-23-2011)
7 routine major monitoring violations
One regular monitoring violation
Address: 43 CHARLTON ROAD Population served: 98, Groundwater):
Past health violations:
MCL, Acute (TCR) - In SEP-2005, Contaminant: Coliform. Follow-up actions: St Boil Water Order (SEP-20-2005), St Compliance achieved (JAN-13-2006)
Past monitoring violations:
Notification, State - In JAN-2008, Contaminant: Residual Chlorine. Follow-up actions: St Formal NOV issued (JAN-15-2008), St Boil Water Order (JAN-15-2008), St Compliance achieved (2 times from JAN-15-2008 to SEP-08-2011)
Follow-up Or Routine LCR Tap M/R - In JUL-01-2006, Contaminant: Lead and Copper Rule. Follow-up actions: St Public Notif requested (JUL-27-2006), St Formal NOV issued (JUL-27-2006), St Public Notif received (NOV-08-2006), St Compliance achieved (FEB-10-2011)
Monitoring and Reporting (DBP) - In JAN-2006, Contaminant: Total Haloacetic Acids (HAA5). Follow-up actions: St Public Notif requested (OCT-26-2006), St Formal NOV issued (OCT-26-2006), St Compliance achieved (AUG-06-2007)
Monitoring and Reporting (DBP) - In JAN-2006, Contaminant: TTHM. Follow-up actions: St Public Notif requested (OCT-26-2006), St Formal NOV issued (OCT-26-2006), St Compliance achieved (AUG-06-2007)
Follow-up Or Routine LCR Tap M/R - In JAN-01-2006, Contaminant: Lead and Copper Rule. Follow-up actions: St Formal NOV issued (FEB-17-2006), St Public Notif requested (FEB-17-2006), St Public Notif received (NOV-08-2006), St Compliance achieved (FEB-10-2011)
2 routine major monitoring violations
16 regular monitoring violations
One other older monitoring violation
Address: 233 WEST MILTON ROAD Population served: 70, Groundwater):
Past monitoring violations:
Monitoring, Repeat Major (TCR) - In JUN-2005, Contaminant: Coliform (TCR). Follow-up actions: St Formal NOV issued (FEB-01-2006), St Compliance achieved (FEB-01-2006)
3 routine major monitoring violations
3 regular monitoring violations
Average household size: This village:
2.2 peopleNew York:
2.6 people
Percentage of family households: This village:
56.9%Whole state:
63.5%
Percentage of households with unmarried partners: This village:
9.3%Whole state:
6.8%
Likely homosexual households (counted as self-reported same-sex unmarried-partner households)
Lesbian couples: 0.4% of all households Gay men: 0.3% of all households
People in group quarters in Ballston Spa in 2010:
273 people in nursing facilities/skilled-nursing facilities
9 people in emergency and transitional shelters (with sleeping facilities) for people experiencing homelessness
8 people in group homes for juveniles (non-correctional)
5 people in group homes intended for adults
3 people in other noninstitutional facilities
People in group quarters in Ballston Spa in 2000:
273 people in nursing homes
9 people in other group homes
6 people in other noninstitutional group quarters
4 people in homes for the mentally retarded
Banks with branches in Ballston Spa (2011 data):
TrustCo Bank: Milton Center Plaza Branch at 2 Trieble Ave, branch established on 2000/12/06; Ballston Spa. Office at 235 Church Avenue, branch established on 2002/05/22. Info updated 2011/07/21: Bank assets: $4,250.1 mil, Deposits: $3,736.0 mil, headquarters in Glenville, NY, positive income , Mortgage Lending Specialization, 135 total offices
Ballston Spa National Bank: at 87 Front Street, branch established on 1838/01/01; Corporate Office Branch at 990 State Route 67, branch established on 2011/10/05. Info updated 2006/11/03: Bank assets: $387.6 mil, Deposits: $308.6 mil, local headquarters , positive income , 10 total offices , Holding Company: Ballston Spa Bancorp, Inc.
The Adirondack Trust Company: Ballston Spa Branch at 224 Church Avenue, branch established on 2004/06/09. Info updated 2006/11/03: Bank assets: $909.1 mil, Deposits: $791.5 mil, headquarters in Saratoga Springs, NY, positive income , Commercial Lending Specialization, 11 total offices , Holding Company: Adirondack Trust Company Employee Stock Ownership Trust, The
First Niagara Bank, National Association: Ballston Spa Branch at 2031 Doubleday Avenue, Route 50, branch established on 1989/07/01. Info updated 2011/06/09: Bank assets: $32,750.6 mil, Deposits: $19,595.4 mil, headquarters in Buffalo, NY, positive income , Commercial Lending Specialization, 351 total offices , Holding Company: First Niagara Financial Group, Inc.
KeyBank National Association: Malta Branch at 507 Route 67, branch established on 1989/03/20. Info updated 2008/03/03: Bank assets: $86,198.8 mil, Deposits: $64,214.8 mil, headquarters in Cleveland, OH, positive income , Commercial Lending Specialization, 1067 total offices , Holding Company: Keycorp
For population 15 years and over in Ballston Spa:
Never married: 32.3%Now married: 44.9%Separated: 1.1%Widowed: 5.6%Divorced: 16.0% For population 25 years and over in Ballston Spa:
High school or higher: 93.7%Bachelor's degree or higher: 42.0%Graduate or professional degree: 16.6%Unemployed: 4.7%Mean travel time to work (commute): 20.8 minutes
Education Gini index (Inequality in education) Here:
10.9New York average:
13.9
Religion statistics for Ballston Spa, NY (based on Saratoga County data)
Religion Adherents Congregations Catholic 52,507 16 Mainline Protestant 17,512 57 Evangelical Protestant 12,976 56 Other 2,828 14 Orthodox 210 2 Black Protestant 24 1 None 133,550 -
Source: Clifford Grammich, Kirk Hadaway, Richard Houseal, Dale E.Jones, Alexei Krindatch, Richie Stanley and Richard H.Taylor. 2012. 2010 U.S.Religion Census: Religious Congregations & Membership Study. Association of Statisticians of American Religious Bodies. Jones, Dale E., et al. 2002. Congregations and Membership in the United States 2000. Nashville, TN: Glenmary Research Center. Graphs represent county-level data
Food Environment Statistics: Number of grocery stores : 31Here :
1.44 / 10,000 pop.New York :
4.13 / 10,000 pop.
Number of supercenters and club stores : 3Saratoga County :
0.14 / 10,000 pop.New York :
0.06 / 10,000 pop.
Number of convenience stores (no gas) : 8This county :
0.37 / 10,000 pop.State :
0.92 / 10,000 pop.
Number of convenience stores (with gas) : 86Saratoga County :
3.99 / 10,000 pop.State :
1.68 / 10,000 pop.
Number of full-service restaurants : 195Saratoga County :
9.04 / 10,000 pop.New York :
8.82 / 10,000 pop.
Adult diabetes rate : This county :
7.5%State :
8.2%
Adult obesity rate : Saratoga County :
25.2%New York :
23.8%
Low-income preschool obesity rate : Health and Nutrition: Healthy diet rate : Ballston Spa:
49.3%New York:
50.1%
Average overall health of teeth and gums : This city:
46.6%New York:
48.1%
People feeling badly about themselves : This city:
21.5%New York:
20.3%
People not drinking alcohol at all : Average hours sleeping at night : Ballston Spa:
6.8New York:
6.8
Overweight people : This city:
36.4%New York:
33.4%
General health condition : Ballston Spa:
56.3%New York:
56.5%
Average condition of hearing : Ballston Spa:
78.3%New York:
80.2%
More about Health and Nutrition of Ballston Spa, NY Residents
Local government employment and payroll (March 2022)
Function
Full-time employees
Monthly full-time payroll
Average yearly full-time wage
Part-time employees
Monthly part-time payroll
Streets and Highways
9 $41,352 $55,136 1 $886 Police Protection - Officers
6 $37,315 $74,630 22 $50,751 Police - Other
4 $18,491 $55,473 5 $5,207 Financial Administration
3 $26,803 $107,212 9 $13,274 Water Supply
2 $10,782 $64,692 0 $0 Local Libraries
1 $5,555 $66,660 9 $14,513 Other and Unallocable
1 $6,135 $73,620 5 $8,392 Other Government Administration
0 $0 23 $11,028 Judicial and Legal
0 $0 6 $16,150
Totals for Government
26 $146,433 $67,584 80 $120,201
Ballston Spa government finances - Expenditure in 2017 (per resident):
Construction - Regular Highways: $72,000 ($14.46)
Current Operations - Housing and Community Development: $1,207,000 ($242.42)
General - Other: $1,102,000 ($221.33)Police Protection: $821,000 ($164.89)Regular Highways: $625,000 ($125.53)Water Utilities: $420,000 ($84.35)Libraries: $261,000 ($52.42)Parks and Recreation: $229,000 ($45.99)Central Staff Services: $178,000 ($35.75)Local Fire Protection: $127,000 ($25.51)Sewerage: $88,000 ($17.67)Judicial and Legal Services: $80,000 ($16.07)Financial Administration: $74,000 ($14.86)Protective Inspection and Regulation - Other: $34,000 ($6.83)Solid Waste Management: $34,000 ($6.83)Health - Other: $33,000 ($6.63)General Public Buildings: $16,000 ($3.21)General - Interest on Debt: $50,000 ($10.04)
Intergovernmental to Local - Other - Financial Administration: $38,000 ($7.63)
Other Capital Outlay - Local Fire Protection: $70,000 ($14.06)
Regular Highways: $20,000 ($4.02)Total Salaries and Wages: $1,724,000 ($346.25)
Ballston Spa government finances - Revenue in 2017 (per resident):
Charges - Sewerage: $188,000 ($37.76)
Other: $60,000 ($12.05)Parks and Recreation: $42,000 ($8.44)Solid Waste Management: $1,000 ($0.20)Federal Intergovernmental - Housing and Community Development: $867,000 ($174.13)
Other: $14,000 ($2.81)Local Intergovernmental - General Local Government Support: $979,000 ($196.63)
Other: $393,000 ($78.93)Miscellaneous - Rents: $63,000 ($12.65)
General Revenue - Other: $47,000 ($9.44)Fines and Forfeits: $24,000 ($4.82)Interest Earnings: $14,000 ($2.81)Revenue - Water Utilities: $694,000 ($139.39)
State Intergovernmental - Highways: $87,000 ($17.47)
General Local Government Support: $51,000 ($10.24)Other: $28,000 ($5.62)Tax - Property: $1,281,000 ($257.28)
Public Utilities Sales: $145,000 ($29.12)Other License: $71,000 ($14.26)Amusements License: $1,000 ($0.20)
Ballston Spa government finances - Debt in 2017 (per resident):
Long Term Debt - Beginning Outstanding - Unspecified Public Purpose: $465,000 ($93.39)
Retired Unspecified Public Purpose: $325,000 ($65.27)Outstanding Unspecified Public Purpose: $140,000 ($28.12)
Ballston Spa government finances - Cash and Securities in 2017 (per resident):
Other Funds - Cash and Securities: $345,000 ($69.29)
Businesses in Ballston Spa, NY
Name Count Name Count
ALDI 1 McDonald's 1 Ace Hardware 1 Penske 1 CVS 1 Pizza Hut 1 Curves 1 Subway 2 Dunkin Donuts 4 True Value 1 FedEx 3 U-Haul 1 H&R Block 1 UPS 4
Strongest AM radio stations in Ballston Spa:
WGY (810 AM; 50 kW; SCHENECTADY, NY; Owner: CLEAR CHANNEL BROADCASTING LICENSES, INC.)
WPTR (1540 AM; 50 kW; ALBANY, NY; Owner: KIMTRON, INC.)
WABY (1160 AM; 5 kW; MECHANICVILLE, NY; Owner: ANASTOS MEDIA GROUP, INC.)
WOFX (980 AM; 5 kW; TROY, NY)
WNNZ (640 AM; 50 kW; WESTFIELD, MA; Owner: CLEAR CHANNEL BROADCASTING LICENSES, INC.)
WUAM (900 AM; 0 kW; SARATOGA SPRINGS, NY)
WROW (590 AM; 5 kW; ALBANY, NY; Owner: 6 JOHNSON ROAD LICENSES, INC.)
WDDY (1460 AM; 5 kW; ALBANY, NY)
WCRN (830 AM; 50 kW; WORCESTER, MA; Owner: CARTER BROADCASTING CORPORATION)
WTIC (1080 AM; 50 kW; HARTFORD, CT; Owner: INFINITY RADIO OPERATIONS INC.)
WTMM (1300 AM; 5 kW; RENSSELAER, NY; Owner: REGENT LICENSEE OF MANSFIELD, INC.)
WRKO (680 AM; 50 kW; BOSTON, MA; Owner: ENTERCOM BOSTON LICENSE, LLC)
WVKZ (1240 AM; 1 kW; SCHENECTADY, NY; Owner: ANASTOS MEDIA GROUP, INC.)
Strongest FM radio stations in Ballston Spa:
WQAR (101.3 FM; STILLWATER, NY; Owner: ANASTOS MEDIA GROUP, INC.)
WABT (104.5 FM; MECHANICVILLE, NY; Owner: REGENT LICENSEE OF MANSFIELD, INC.)
WKKF (102.3 FM; BALLSTON SPA, NY; Owner: CLEAR CHANNEL BROADCASTING LICENSES, INC.)
WFFG-FM (107.1 FM; CORINTH, NY; Owner: VOX NEW YORK, L.L.C.)
WEQX (102.7 FM; MANCHESTER, VT; Owner: NORTHSHIRE COMMUNICATIONS, INC.)
WJAN (95.1 FM; SUNDERLAND, VT; Owner: 6 JOHNSON ROAD LICENSES, INC.)
WDCD-FM (96.7 FM; CLIFTON PARK, NY; Owner: KIMTRON, INC.)
WPGL (90.7 FM; PATTERSONVILLE, NY; Owner: SOUND OF LIFE, INC.)
WKRD (93.7 FM; SCOTIA, NY; Owner: DOT COMMUNICATIONS, INC.)
WNGN (91.9 FM; ARGYLE, NY; Owner: NORTHEAST GOSPEL BROADCASTING INC)
WZEC (97.5 FM; HOOSICK FALLS, NY; Owner: GREAT NORTHERN RADIO, LLC)
WKBE (100.3 FM; WARRENSBURG, NY; Owner: 6 JOHNSON ROAD LICENSES, INC.)
WCQL (95.9 FM; GLENS FALLS, NY; Owner: ENTERTRONICS, INC.)
WBKK (97.7 FM; AMSTERDAM, NY; Owner: GEM ASSOCIATES, L. P.)
WCKM-FM (99.1 FM; LAKE GEORGE, NY; Owner: ENTERTRONICS, INC.)
WBAR-FM (94.7 FM; LAKE LUZERNE, NY; Owner: CAPITAL MEDIA CORPORATION)
WNYQ (105.7 FM; QUEENSBURY, NY; Owner: VOX NEW YORK, L.L.C.)
WSSK (89.7 FM; SARATOGA SPRINGS, NY; Owner: SOUND OF LIFE, INC.)
WAMC-FM (90.3 FM; ALBANY, NY; Owner: WAMC)
WAJZ (96.3 FM; VOORHEESVILLE, NY; Owner: 6 JOHNSON ROAD LICENSES, INC.)
TV broadcast stations around Ballston Spa:
WYPX (Channel 55; AMSTERDAM, NY; Owner: PAXSON ALBANY LICENSE, INC.)
WRGB (Channel 6; SCHENECTADY, NY; Owner: FREEDOM BROADCASTING OF NEW YORK, INC)
WNYT (Channel 13; ALBANY, NY; Owner: WNYT-TV, LLC)
WTEN (Channel 10; ALBANY, NY; Owner: YOUNG BROADCASTING OF ALBANY, INC.)
WMHT (Channel 17; SCHENECTADY, NY; Owner: WMHT EDUCATIONAL TELECOMMUNICATIONS)
WEWB-TV (Channel 45; SCHENECTADY, NY; Owner: WEWB, L.L.C.)
WNYA-CA (Channel 39; EASTON, ETC., NY; Owner: VENTURE TECHNOLOGIES GROUP, LLC)
WXXA-TV (Channel 23; ALBANY, NY; Owner: CLEAR CHANNEL BROADCASTING LICENSES, INC.)
National Bridge Inventory (NBI) Statistics 9 Number of bridges43ft / 12.8m Total length $12,368,000 Total costs30,917 Total average daily traffic2,011 Total average daily truck traffic
FCC Registered Antenna Towers: 38 (
See the full list of FCC Registered Antenna Towers in Ballston Spa )
FCC Registered Commercial Land Mobile Towers: 1 (
See the full list of FCC Registered Commercial Land Mobile Towers in Ballston Spa, NY )
FCC Registered Broadcast Land Mobile Towers: 21 (
See the full list of FCC Registered Broadcast Land Mobile Towers )
FCC Registered Microwave Towers: 5
STATION, County Complex 40 Mc Master St (Lat: 42.999500 Lon: -73.850111), Structure height: 19.5 m, Overall height: 31.7 m, Call Sign: WNEW679, Assigned Frequencies: 2133.20 MHz, Grant Date: 10/01/1998, Expiration Date: 12/30/2008, Cancellation Date: 03/07/2009, Phone: (518) 885-2232 BALLSTON SPA, 887 Rt 67 (Lat: 42.971500 Lon: -73.845222), Type: Mast, Structure height: 89.3 m, Overall height: 91.1 m, Call Sign: WPJC224, Assigned Frequencies: 6760.62 MHz, Grant Date: 04/04/2011, Expiration Date: 02/01/2021, Cancellation Date: 03/31/2014, Certifier: Carol L Tacker, Registrant: At&t Mobility LLC, 1120 20th Street, Nw - Suite 1000, Washington, DC 20036, Phone: (202) 457-2055, Fax: (202) 457-3073, Email:
MILTON, County Farm Road (Lat: 43.019361 Lon: -73.873917), Type: Ltower, Structure height: 57.3 m, Call Sign: WQIX739, Assigned Frequencies: 6286.19 MHz, 6375.14 MHz, 6805.00 MHz, 6226.89 MHz, 6845.00 MHz, Grant Date: 03/16/2018, Expiration Date: 06/12/2028, Certifier: Paul Lent, Registrant: Saratoga County Office Of Emergency Services, 25 West High Street, Ballston Spa, NY 12020, Phone: (518) 885-2232, Fax: (518) 884-4707, Email:
CO COMPLEX, County Complex 40 Mc Master St (Lat: 42.999528 Lon: -73.850111), Type: Bant, Structure height: 19.5 m, Overall height: 31.7 m, Call Sign: WQKU968, Assigned Frequencies: 6725.00 MHz, Grant Date: 07/23/2019, Expiration Date: 09/22/2029, Certifier: Paul Lent, Registrant: Saratoga County Office Of Emergency Services, 25 West High Street, Ballston Spa, NY 12020, Phone: (518) 885-2232, Fax: (518) 884-4704, Email:
STATION, Nysp Station Saratoga-Malta 2455 State Hwy 9 (Lat: 42.968667 Lon: -73.791917), Type: Ltower, Structure height: 42.7 m, Call Sign: WIR20, Assigned Frequencies: 6315.84 MHz, 6635.00 MHz, 6623.75 MHz, Grant Date: 02/04/2020, Expiration Date: 04/19/2030, Registrant: Acd Telecom, 103 Commerce Street, Suite 180, Lake Mary, FL 32746, Phone: (407) 333-2300, Email:
FCC Registered Amateur Radio Licenses: 126 (
See the full list of FCC Registered Amateur Radio Licenses in Ballston Spa )
FAA Registered Aircraft Manufacturers and Dealers: 1 (
See the full list of FAA Registered Manufacturers and Dealers in Ballston Spa )
FAA Registered Aircraft: 49 (
See the full list of FAA Registered Aircraft )
Home Mortgage Disclosure Act Aggregated Statistics For Year 2009(Based on 1 partial tract) A) FHA, FSA/RHS & VA B) Conventional C) Refinancings D) Home Improvement Loans E) Loans on Dwellings For 5+ Families F) Non-occupant Loans on G) Loans On Manufactured Number Average Value Number Average Value Number Average Value Number Average Value Number Average Value Number Average Value Number Average Value
LOANS ORIGINATED 37 $170,310 28 $155,818 98 $164,436 11 $50,755 0 $0 6 $141,382 3 $29,187 APPLICATIONS APPROVED, NOT ACCEPTED 2 $115,805 4 $154,405 17 $191,457 1 $9,410 0 $0 0 $0 3 $42,053 APPLICATIONS DENIED 7 $151,447 8 $161,350 39 $164,280 15 $28,308 1 $273,040 3 $129,927 2 $37,190 APPLICATIONS WITHDRAWN 4 $163,115 4 $154,878 24 $163,429 0 $0 0 $0 1 $47,080 0 $0 FILES CLOSED FOR INCOMPLETENESS 0 $0 0 $0 6 $77,673 0 $0 0 $0 0 $0 0 $0
Aggregated Statistics For Year 2008(Based on 1 partial tract) A) FHA, FSA/RHS & VA B) Conventional C) Refinancings D) Home Improvement Loans E) Loans on Dwellings For 5+ Families F) Non-occupant Loans on G) Loans On Manufactured Number Average Value Number Average Value Number Average Value Number Average Value Number Average Value Number Average Value Number Average Value
LOANS ORIGINATED 26 $172,874 33 $156,717 43 $148,647 18 $36,509 2 $657,640 5 $94,904 4 $55,785 APPLICATIONS APPROVED, NOT ACCEPTED 1 $228,780 5 $78,332 14 $135,576 3 $86,933 0 $0 1 $112,040 2 $45,190 APPLICATIONS DENIED 2 $115,805 9 $159,846 37 $158,070 16 $40,661 1 $185,480 6 $86,305 3 $58,687 APPLICATIONS WITHDRAWN 3 $158,800 4 $165,468 18 $180,663 3 $122,710 0 $0 2 $99,800 0 $0 FILES CLOSED FOR INCOMPLETENESS 0 $0 0 $0 8 $162,526 0 $0 0 $0 1 $186,420 0 $0
Aggregated Statistics For Year 2007(Based on 1 partial tract) A) FHA, FSA/RHS & VA B) Conventional C) Refinancings D) Home Improvement Loans E) Loans on Dwellings For 5+ Families F) Non-occupant Loans on G) Loans On Manufactured Number Average Value Number Average Value Number Average Value Number Average Value Number Average Value Number Average Value Number Average Value
LOANS ORIGINATED 11 $171,695 89 $155,242 64 $128,044 29 $61,782 2 $828,520 11 $173,407 10 $39,920 APPLICATIONS APPROVED, NOT ACCEPTED 1 $154,410 21 $119,750 8 $91,325 5 $36,906 0 $0 3 $120,197 7 $50,437 APPLICATIONS DENIED 1 $156,290 21 $87,246 50 $140,208 13 $43,164 1 $164,760 8 $112,509 11 $43,052 APPLICATIONS WITHDRAWN 2 $157,700 10 $213,156 30 $136,455 1 $167,590 0 $0 6 $126,003 0 $0 FILES CLOSED FOR INCOMPLETENESS 0 $0 8 $120,630 3 $108,587 2 $70,610 0 $0 1 $143,110 0 $0
Aggregated Statistics For Year 2006(Based on 1 partial tract) A) FHA, FSA/RHS & VA B) Conventional C) Refinancings D) Home Improvement Loans E) Loans on Dwellings For 5+ Families F) Non-occupant Loans on G) Loans On Manufactured Number Average Value Number Average Value Number Average Value Number Average Value Number Average Value Number Average Value Number Average Value
LOANS ORIGINATED 12 $194,733 121 $118,979 84 $134,063 26 $60,872 3 $303,163 26 $124,893 16 $31,246 APPLICATIONS APPROVED, NOT ACCEPTED 1 $347,410 12 $99,014 19 $104,705 8 $65,081 0 $0 5 $82,288 3 $35,150 APPLICATIONS DENIED 1 $172,290 27 $91,221 67 $137,923 21 $53,038 1 $13,180 7 $69,537 5 $22,972 APPLICATIONS WITHDRAWN 2 $164,290 18 $168,686 37 $146,645 1 $47,080 0 $0 4 $136,988 0 $0 FILES CLOSED FOR INCOMPLETENESS 1 $125,220 13 $158,968 15 $146,937 1 $167,590 0 $0 6 $147,972 0 $0
Aggregated Statistics For Year 2005(Based on 1 partial tract) A) FHA, FSA/RHS & VA B) Conventional C) Refinancings D) Home Improvement Loans F) Non-occupant Loans on G) Loans On Manufactured Number Average Value Number Average Value Number Average Value Number Average Value Number Average Value Number Average Value
LOANS ORIGINATED 9 $142,794 112 $156,466 117 $133,395 29 $33,829 29 $137,751 2 $64,020 APPLICATIONS APPROVED, NOT ACCEPTED 2 $172,765 31 $125,584 22 $100,655 4 $52,488 4 $114,628 14 $43,376 APPLICATIONS DENIED 1 $64,960 30 $120,889 78 $127,078 25 $30,919 6 $138,087 15 $34,208 APPLICATIONS WITHDRAWN 4 $162,172 10 $166,740 76 $127,053 10 $96,504 5 $106,390 1 $30,130 FILES CLOSED FOR INCOMPLETENESS 0 $0 14 $133,828 8 $114,039 1 $180,770 2 $44,720 0 $0
Aggregated Statistics For Year 2004(Based on 1 partial tract) A) FHA, FSA/RHS & VA B) Conventional C) Refinancings D) Home Improvement Loans E) Loans on Dwellings For 5+ Families F) Non-occupant Loans on G) Loans On Manufactured Number Average Value Number Average Value Number Average Value Number Average Value Number Average Value Number Average Value Number Average Value
LOANS ORIGINATED 15 $145,619 102 $131,948 141 $113,374 19 $43,755 2 $306,460 24 $111,528 4 $58,608 APPLICATIONS APPROVED, NOT ACCEPTED 1 $234,430 22 $90,042 18 $102,309 0 $0 0 $0 8 $97,916 15 $38,288 APPLICATIONS DENIED 2 $111,570 40 $74,143 66 $98,572 21 $28,200 0 $0 8 $66,376 24 $29,697 APPLICATIONS WITHDRAWN 1 $120,510 6 $127,573 61 $120,126 9 $49,794 0 $0 3 $91,327 1 $39,540 FILES CLOSED FOR INCOMPLETENESS 0 $0 3 $206,817 8 $130,634 4 $35,305 0 $0 0 $0 0 $0
Aggregated Statistics For Year 2003(Based on 1 partial tract) A) FHA, FSA/RHS & VA B) Conventional C) Refinancings D) Home Improvement Loans E) Loans on Dwellings For 5+ Families F) Non-occupant Loans on Number Average Value Number Average Value Number Average Value Number Average Value Number Average Value Number Average Value
LOANS ORIGINATED 22 $118,543 76 $105,498 249 $101,236 12 $19,772 2 $271,150 24 $80,224 APPLICATIONS APPROVED, NOT ACCEPTED 1 $80,970 16 $92,561 26 $100,016 4 $13,652 0 $0 3 $90,383 APPLICATIONS DENIED 5 $90,008 20 $58,608 70 $99,449 7 $39,409 0 $0 9 $85,781 APPLICATIONS WITHDRAWN 4 $90,148 11 $102,795 56 $102,607 2 $39,545 0 $0 3 $90,697 FILES CLOSED FOR INCOMPLETENESS 0 $0 2 $333,760 11 $91,155 0 $0 0 $0 0 $0
Aggregated Statistics For Year 2002(Based on 1 partial tract) A) FHA, FSA/RHS & VA B) Conventional C) Refinancings D) Home Improvement Loans E) Loans on Dwellings For 5+ Families F) Non-occupant Loans on Number Average Value Number Average Value Number Average Value Number Average Value Number Average Value Number Average Value
LOANS ORIGINATED 27 $111,864 98 $94,794 134 $91,810 20 $16,758 4 $133,928 22 $76,818 APPLICATIONS APPROVED, NOT ACCEPTED 2 $125,690 12 $60,256 27 $101,821 6 $25,263 0 $0 1 $63,080 APPLICATIONS DENIED 4 $93,208 40 $36,672 61 $85,800 12 $17,810 0 $0 3 $195,833 APPLICATIONS WITHDRAWN 2 $95,090 7 $76,530 41 $96,079 7 $23,941 0 $0 0 $0 FILES CLOSED FOR INCOMPLETENESS 1 $78,140 4 $84,970 10 $85,017 0 $0 0 $0 0 $0
Aggregated Statistics For Year 2001(Based on 1 partial tract) A) FHA, FSA/RHS & VA B) Conventional C) Refinancings D) Home Improvement Loans E) Loans on Dwellings For 5+ Families F) Non-occupant Loans on Number Average Value Number Average Value Number Average Value Number Average Value Number Average Value Number Average Value
LOANS ORIGINATED 24 $110,626 77 $72,288 101 $89,228 18 $18,464 6 $130,398 12 $104,507 APPLICATIONS APPROVED, NOT ACCEPTED 2 $112,510 22 $51,954 10 $69,389 5 $29,374 0 $0 2 $84,735 APPLICATIONS DENIED 1 $53,670 55 $37,591 55 $65,888 20 $19,960 0 $0 8 $49,546 APPLICATIONS WITHDRAWN 1 $122,400 7 $66,443 42 $77,427 4 $14,592 0 $0 2 $59,315 FILES CLOSED FOR INCOMPLETENESS 0 $0 1 $112,040 8 $74,261 0 $0 0 $0 1 $50,840
Aggregated Statistics For Year 2000(Based on 1 partial tract) A) FHA, FSA/RHS & VA B) Conventional C) Refinancings D) Home Improvement Loans E) Loans on Dwellings For 5+ Families F) Non-occupant Loans on Number Average Value Number Average Value Number Average Value Number Average Value Number Average Value Number Average Value
LOANS ORIGINATED 17 $90,052 107 $64,849 28 $54,472 17 $11,187 1 $230,670 3 $49,900 APPLICATIONS APPROVED, NOT ACCEPTED 1 $93,210 22 $39,286 13 $69,743 5 $19,584 0 $0 0 $0 APPLICATIONS DENIED 3 $66,533 145 $32,933 42 $60,727 14 $21,049 0 $0 2 $32,010 APPLICATIONS WITHDRAWN 3 $94,150 12 $44,093 26 $78,434 3 $53,667 0 $0 2 $29,655 FILES CLOSED FOR INCOMPLETENESS 1 $37,660 0 $0 4 $71,790 1 $14,120 0 $0 0 $0
Aggregated Statistics For Year 1999(Based on 1 partial tract) A) FHA, FSA/RHS & VA B) Conventional C) Refinancings D) Home Improvement Loans F) Non-occupant Loans on Number Average Value Number Average Value Number Average Value Number Average Value Number Average Value
LOANS ORIGINATED 23 $80,703 69 $222,524 44 $70,646 26 $10,932 5 $104,432 APPLICATIONS APPROVED, NOT ACCEPTED 0 $0 50 $35,380 28 $80,205 3 $6,660 2 $84,455 APPLICATIONS DENIED 1 $104,430 101 $33,114 43 $57,506 24 $23,724 5 $56,302 APPLICATIONS WITHDRAWN 4 $84,228 9 $63,163 38 $73,986 15 $51,217 1 $36,320 FILES CLOSED FOR INCOMPLETENESS 1 $90,810 0 $0 5 $65,928 0 $0 0 $0
Detailed HMDA statistics for the following Tracts:
0618.00
Private Mortgage Insurance Companies Aggregated Statistics For Year 2009(Based on 1 partial tract) A) Conventional B) Refinancings Number Average Value Number Average Value
LOANS ORIGINATED 6 $181,553 5 $181,898 APPLICATIONS APPROVED, NOT ACCEPTED 1 $212,780 2 $185,005 APPLICATIONS DENIED 2 $187,360 0 $0 APPLICATIONS WITHDRAWN 0 $0 1 $216,540 FILES CLOSED FOR INCOMPLETENESS 0 $0 0 $0
Aggregated Statistics For Year 2008(Based on 1 partial tract) A) Conventional B) Refinancings C) Non-occupant Loans on Number Average Value Number Average Value Number Average Value
LOANS ORIGINATED 12 $186,103 6 $166,332 1 $225,020 APPLICATIONS APPROVED, NOT ACCEPTED 8 $221,959 0 $0 1 $225,020 APPLICATIONS DENIED 1 $189,240 1 $165,700 0 $0 APPLICATIONS WITHDRAWN 1 $201,480 0 $0 0 $0 FILES CLOSED FOR INCOMPLETENESS 0 $0 0 $0 0 $0
Aggregated Statistics For Year 2007(Based on 1 partial tract) A) Conventional B) Refinancings C) Non-occupant Loans on Number Average Value Number Average Value Number Average Value
LOANS ORIGINATED 24 $194,263 8 $205,248 3 $240,710 APPLICATIONS APPROVED, NOT ACCEPTED 11 $200,112 2 $136,520 5 $163,068 APPLICATIONS DENIED 1 $113,920 0 $0 0 $0 APPLICATIONS WITHDRAWN 1 $80,970 3 $166,960 0 $0 FILES CLOSED FOR INCOMPLETENESS 0 $0 0 $0 0 $0
Aggregated Statistics For Year 2006(Based on 1 partial tract) A) Conventional B) Refinancings C) Non-occupant Loans on Number Average Value Number Average Value Number Average Value
LOANS ORIGINATED 20 $176,955 8 $162,526 1 $54,610 APPLICATIONS APPROVED, NOT ACCEPTED 3 $185,163 2 $195,360 0 $0 APPLICATIONS DENIED 0 $0 0 $0 0 $0 APPLICATIONS WITHDRAWN 3 $165,390 2 $136,990 2 $125,220 FILES CLOSED FOR INCOMPLETENESS 0 $0 0 $0 0 $0
Aggregated Statistics For Year 2005(Based on 1 partial tract) A) Conventional B) Refinancings C) Non-occupant Loans on Number Average Value Number Average Value Number Average Value
LOANS ORIGINATED 21 $169,918 6 $176,060 3 $179,513 APPLICATIONS APPROVED, NOT ACCEPTED 6 $163,663 1 $155,350 0 $0 APPLICATIONS DENIED 0 $0 0 $0 0 $0 APPLICATIONS WITHDRAWN 0 $0 0 $0 0 $0 FILES CLOSED FOR INCOMPLETENESS 0 $0 0 $0 0 $0
Aggregated Statistics For Year 2004(Based on 1 partial tract) A) Conventional B) Refinancings C) Non-occupant Loans on Number Average Value Number Average Value Number Average Value
LOANS ORIGINATED 19 $147,221 17 $135,853 3 $91,013 APPLICATIONS APPROVED, NOT ACCEPTED 8 $126,396 3 $127,730 1 $98,860 APPLICATIONS DENIED 0 $0 0 $0 0 $0 APPLICATIONS WITHDRAWN 3 $149,383 0 $0 1 $177,000 FILES CLOSED FOR INCOMPLETENESS 0 $0 0 $0 0 $0
Aggregated Statistics For Year 2003(Based on 1 partial tract) A) Conventional B) Refinancings C) Non-occupant Loans on Number Average Value Number Average Value Number Average Value
LOANS ORIGINATED 23 $112,530 32 $117,570 4 $80,732 APPLICATIONS APPROVED, NOT ACCEPTED 5 $95,468 7 $92,804 2 $112,980 APPLICATIONS DENIED 0 $0 0 $0 0 $0 APPLICATIONS WITHDRAWN 1 $144,990 1 $75,320 1 $75,320 FILES CLOSED FOR INCOMPLETENESS 0 $0 0 $0 0 $0
Aggregated Statistics For Year 2002(Based on 1 partial tract) A) Conventional B) Refinancings C) Non-occupant Loans on Number Average Value Number Average Value Number Average Value
LOANS ORIGINATED 26 $105,702 17 $119,681 3 $79,713 APPLICATIONS APPROVED, NOT ACCEPTED 2 $130,400 8 $125,926 1 $44,250 APPLICATIONS DENIED 0 $0 0 $0 0 $0 APPLICATIONS WITHDRAWN 0 $0 0 $0 0 $0 FILES CLOSED FOR INCOMPLETENESS 0 $0 0 $0 0 $0
Aggregated Statistics For Year 2001(Based on 1 partial tract) A) Conventional B) Refinancings C) Non-occupant Loans on Number Average Value Number Average Value Number Average Value
LOANS ORIGINATED 14 $94,890 15 $94,903 1 $80,970 APPLICATIONS APPROVED, NOT ACCEPTED 1 $60,260 3 $183,907 0 $0 APPLICATIONS DENIED 0 $0 2 $87,090 1 $59,310 APPLICATIONS WITHDRAWN 0 $0 0 $0 0 $0 FILES CLOSED FOR INCOMPLETENESS 0 $0 1 $357,770 0 $0
Aggregated Statistics For Year 2000(Based on 1 partial tract) A) Conventional B) Refinancings Number Average Value Number Average Value
LOANS ORIGINATED 17 $91,381 3 $96,973 APPLICATIONS APPROVED, NOT ACCEPTED 5 $71,554 2 $88,500 APPLICATIONS DENIED 0 $0 0 $0 APPLICATIONS WITHDRAWN 1 $32,950 0 $0 FILES CLOSED FOR INCOMPLETENESS 1 $75,320 0 $0
Aggregated Statistics For Year 1999(Based on 1 partial tract) A) Conventional B) Refinancings Number Average Value Number Average Value
LOANS ORIGINATED 19 $122,211 5 $95,168 APPLICATIONS APPROVED, NOT ACCEPTED 3 $97,167 1 $92,630 APPLICATIONS DENIED 1 $125,320 0 $0 APPLICATIONS WITHDRAWN 0 $0 1 $106,250 FILES CLOSED FOR INCOMPLETENESS 0 $0 0 $0
Detailed PMIC statistics for the following Tracts:
0618.00
Ballston Spa compared to New York state average:
Unemployed percentage significantly below state average. Black race population percentage significantly below state average. Hispanic race population percentage significantly below state average. Foreign-born population percentage significantly below state average. Length of stay since moving in significantly above state average. Number of rooms per house above state average. Institutionalized population percentage significantly above state average.
Top Patent Applicants
Kyle E. Litz (20)
Slawomir Rubinsztajn (16)
Michael Dennis Mack (16)
Jianjun Guo (14)
Roger Allen Shisler (13)
Kevin Paul Mcevoy (12)
Stefan Schmitz (12)
Bingwu Liu (10)
Gordon Raymond Smith (10)
Robert C. Ewell, Jr. (10)
Total of 428 patent applications in 2008-2024.
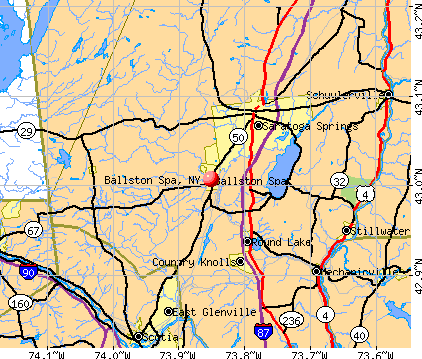


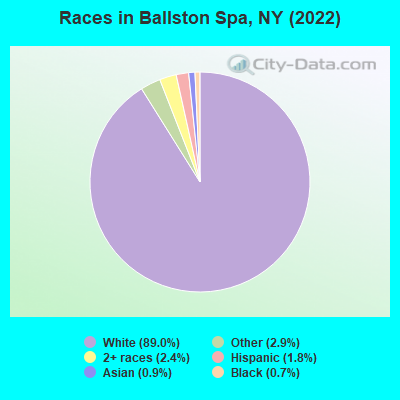
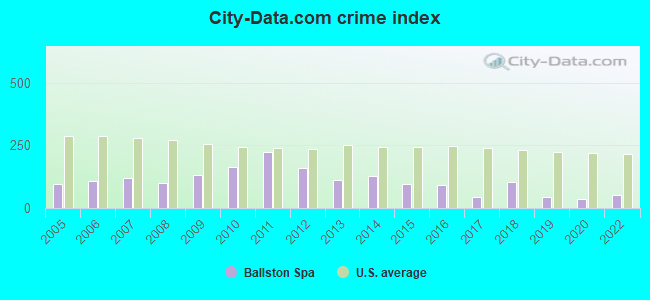
 Recent articles from our blog. Our writers, many of them Ph.D. graduates or candidates, create easy-to-read articles on a wide variety of topics.

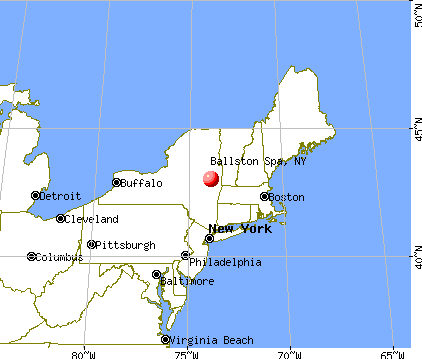
 (14.6 miles
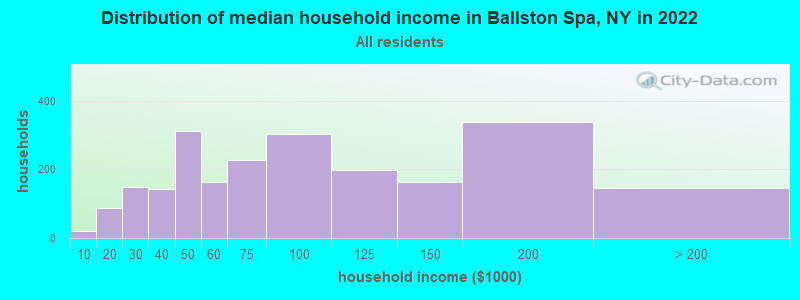
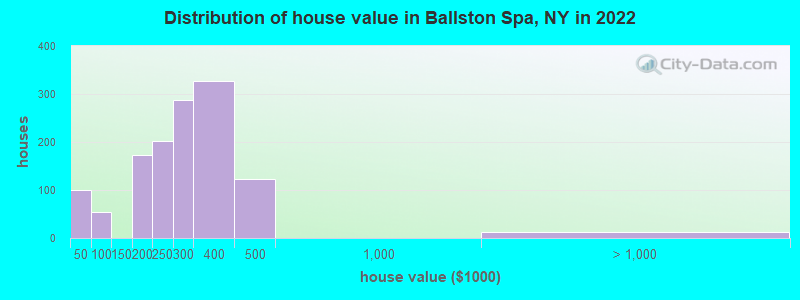

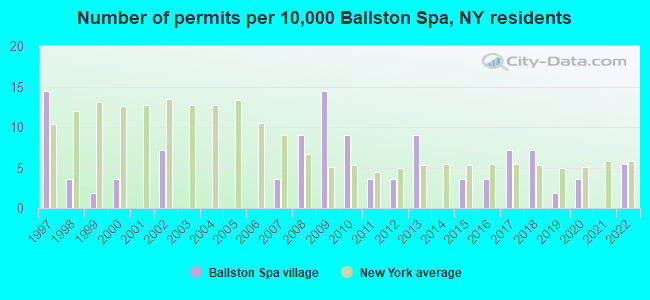
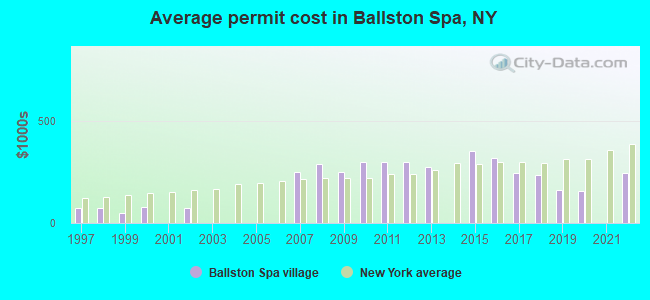
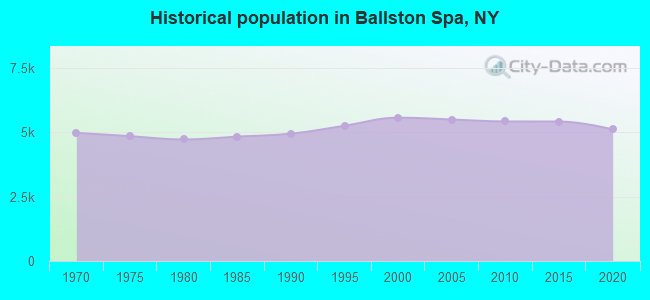
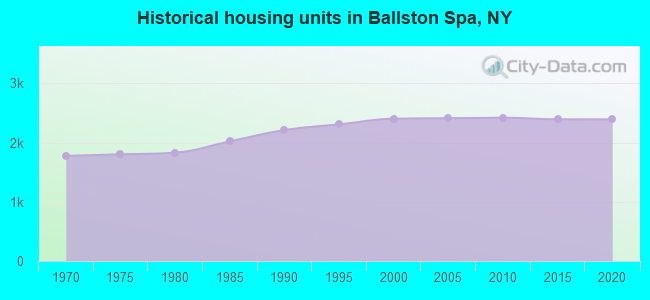
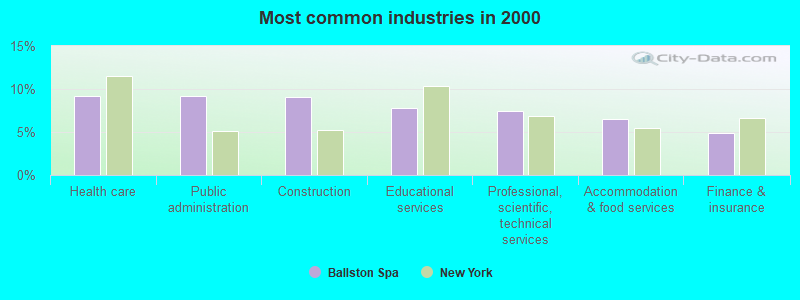
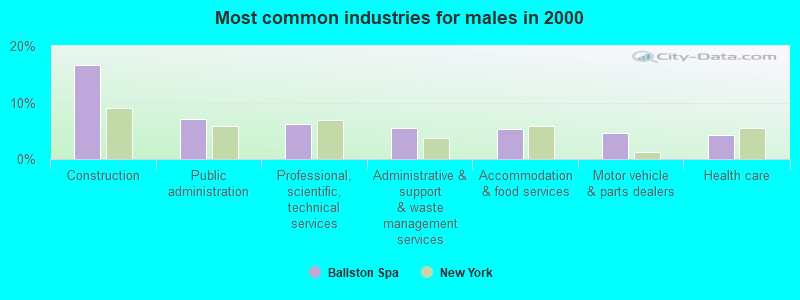
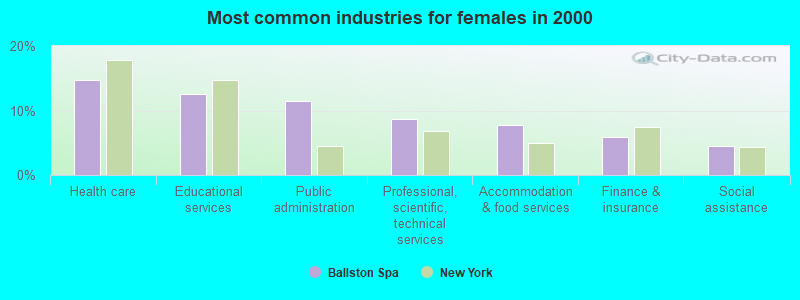
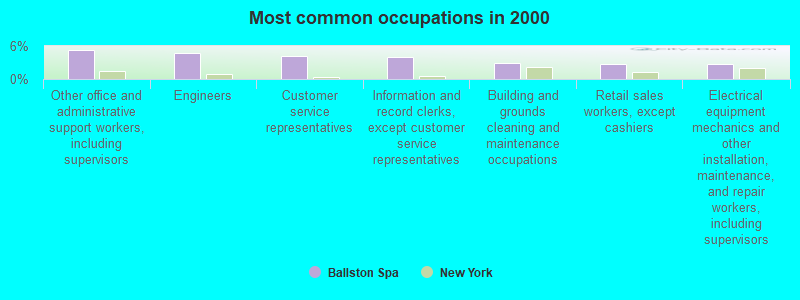
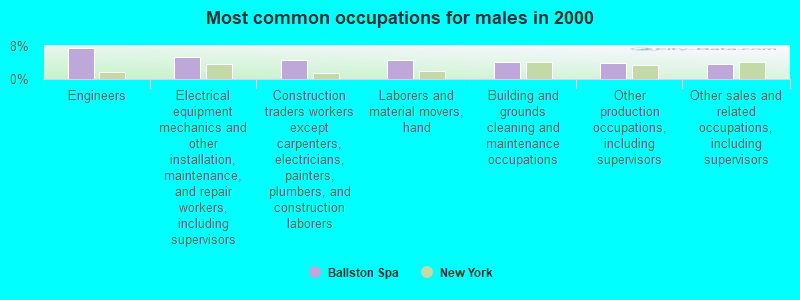
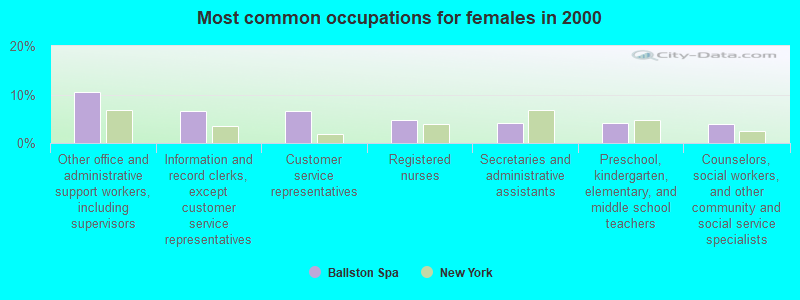


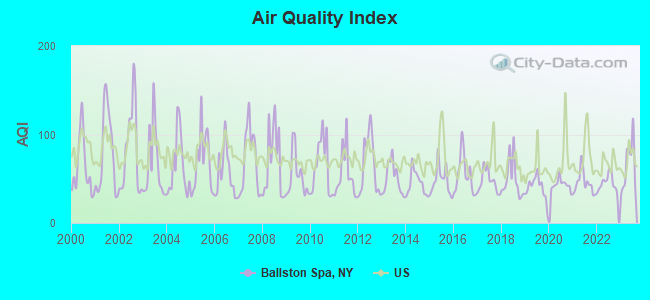
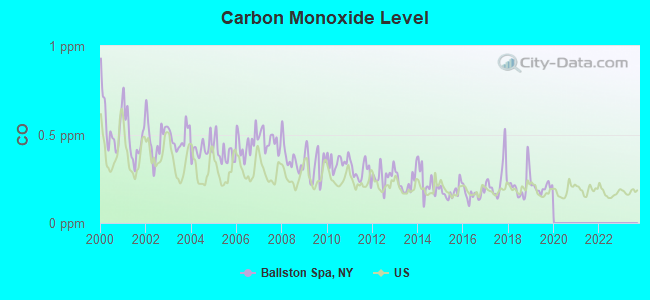
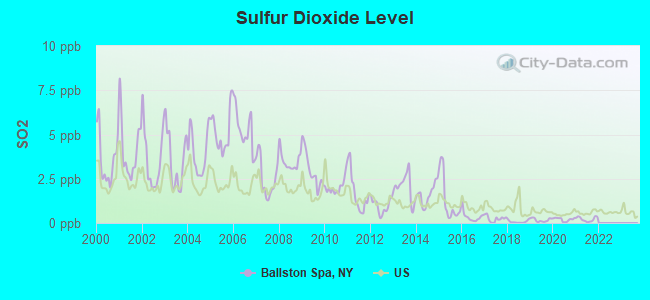
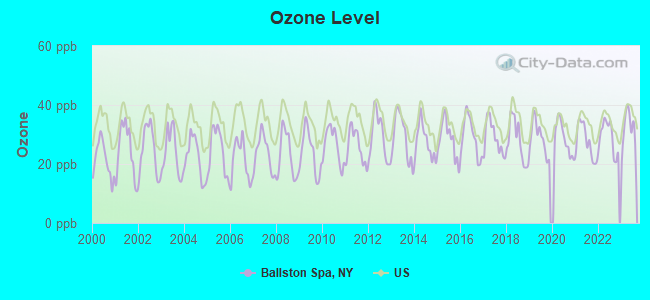

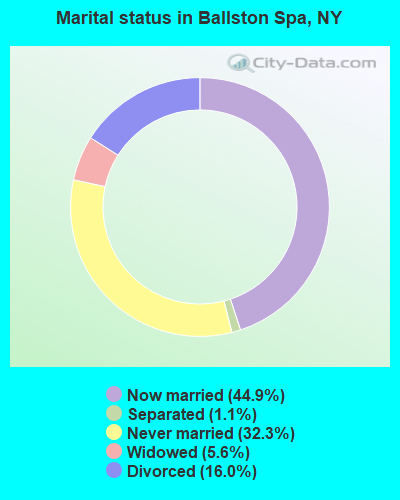
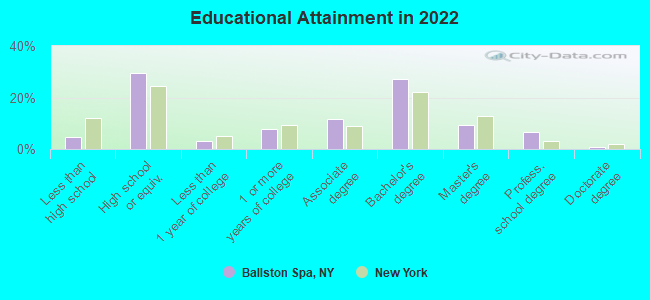
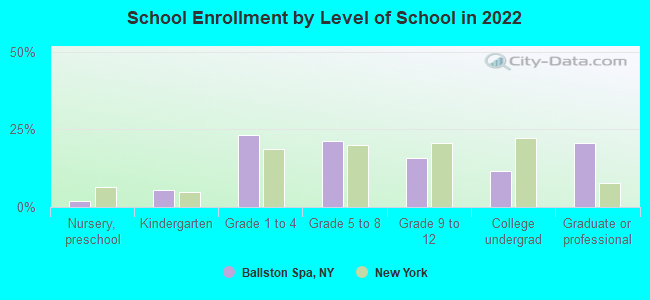
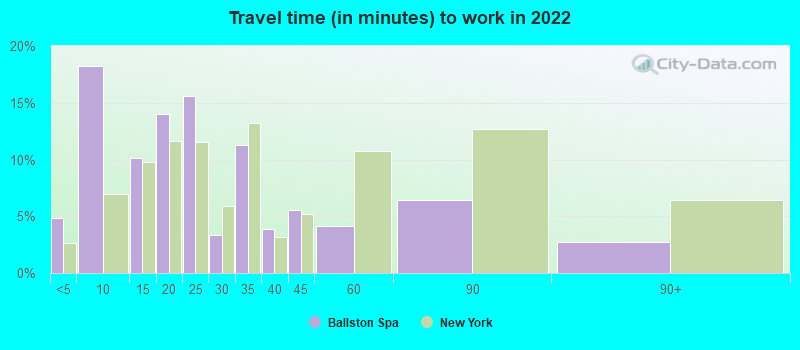
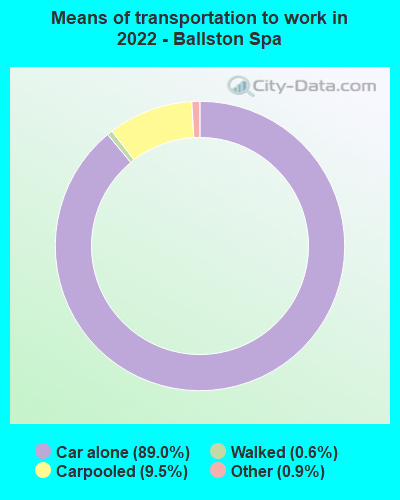
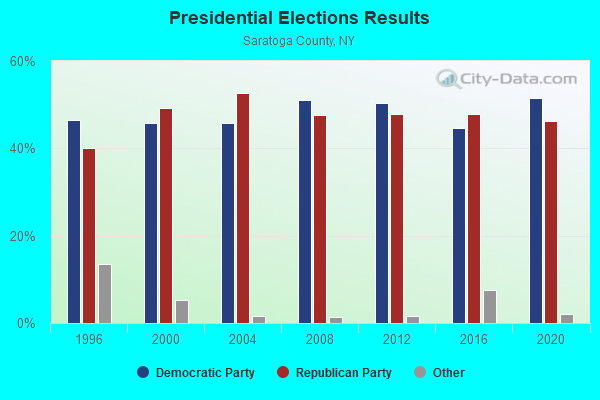
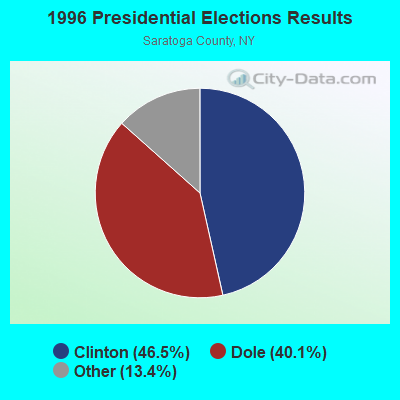
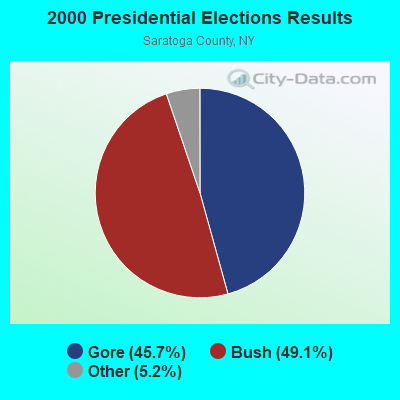
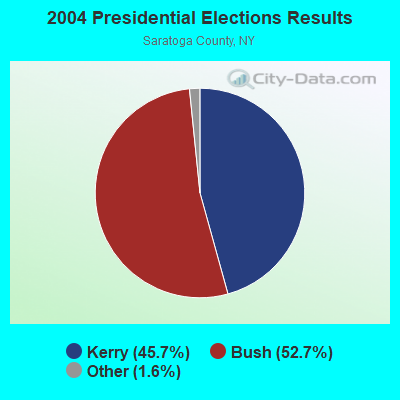
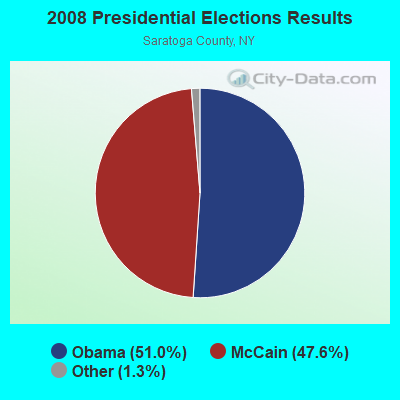
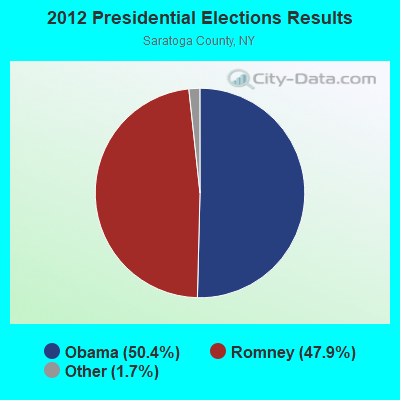
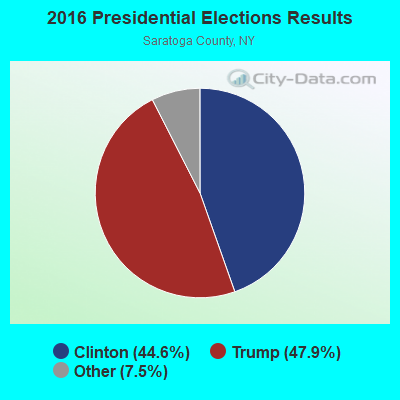
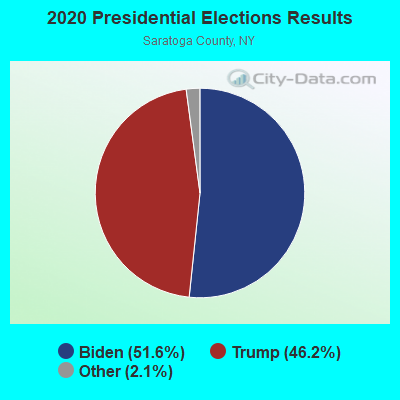
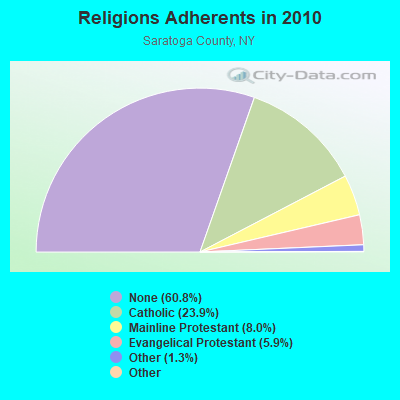
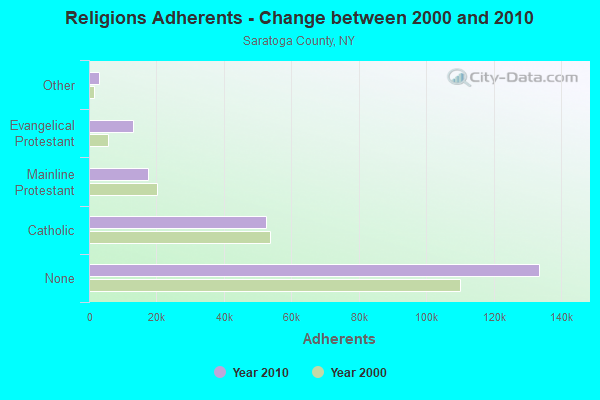
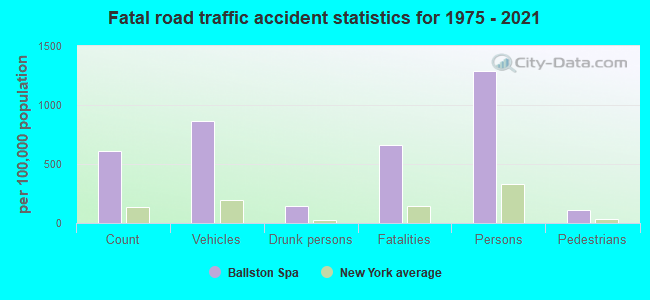
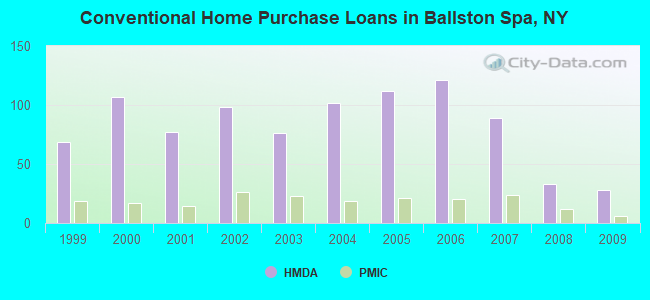
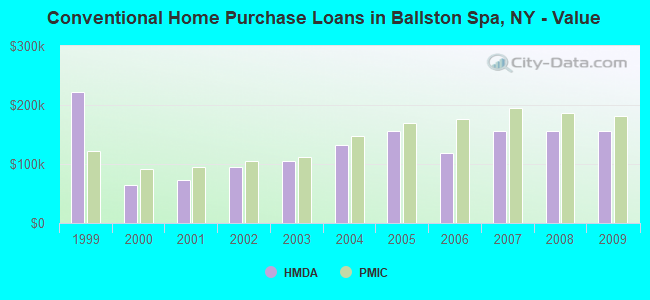
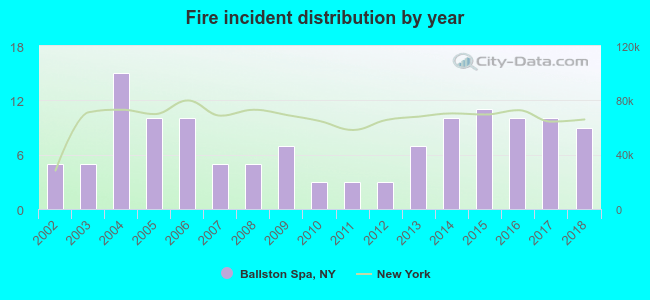 According to the data from the years 2002 - 2018 the average number of fire incidents per year is 8. The highest number of fire incidents - 15 took place in 2004, and the least - 3 in 2010. The data has an increasing trend.
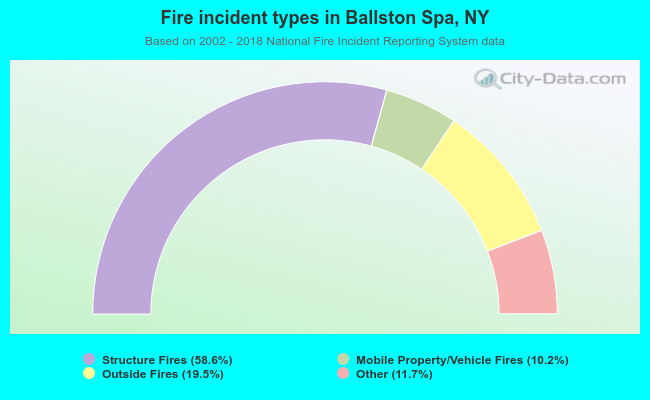 When looking into fire subcategories, the most reports belonged to: Structure Fires (58.6%), and Outside Fires (19.5%).