Ball, Louisiana Submit your own pictures of this town and show them to the world
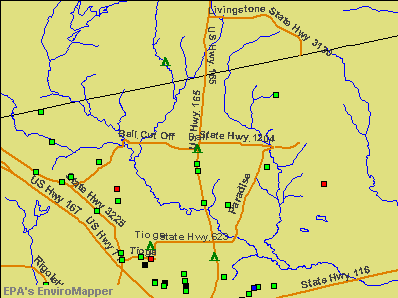
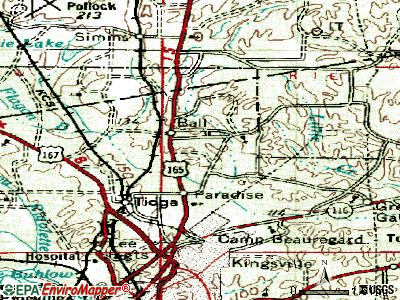
OSM Map
General Map
Google Map
MSN Map
OSM Map
General Map
Google Map
MSN Map
OSM Map
General Map
Google Map
MSN Map
OSM Map
General Map
Google Map
MSN Map
Please wait while loading the map...
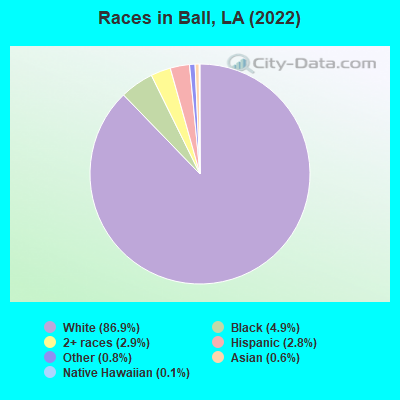
Population in 2022: 3,839 (86% urban, 14% rural). Population change since 2000: +4.3%Males: 2,040 Females: 1,799
March 2022 cost of living index in Ball: 82.4 (low, U.S. average is 100) Percentage of residents living in poverty in 2022: 6.1%for White Non-Hispanic residents , 0.6% for Black residents , 100.0% for Native Hawaiian and other Pacific Islander residents , 40.9% for other race residents )
Profiles of local businesses
Business Search - 14 Million verified businesses
Data:
Median household income ($)
Median household income (% change since 2000)
Household income diversity
Ratio of average income to average house value (%)
Ratio of average income to average rent
Median household income ($) - White
Median household income ($) - Black or African American
Median household income ($) - Asian
Median household income ($) - Hispanic or Latino
Median household income ($) - American Indian and Alaska Native
Median household income ($) - Multirace
Median household income ($) - Other Race
Median household income for houses/condos with a mortgage ($)
Median household income for apartments without a mortgage ($)
Races - White alone (%)
Races - White alone (% change since 2000)
Races - Black alone (%)
Races - Black alone (% change since 2000)
Races - American Indian alone (%)
Races - American Indian alone (% change since 2000)
Races - Asian alone (%)
Races - Asian alone (% change since 2000)
Races - Hispanic (%)
Races - Hispanic (% change since 2000)
Races - Native Hawaiian and Other Pacific Islander alone (%)
Races - Native Hawaiian and Other Pacific Islander alone (% change since 2000)
Races - Two or more races (%)
Races - Two or more races (% change since 2000)
Races - Other race alone (%)
Races - Other race alone (% change since 2000)
Racial diversity
Unemployment (%)
Unemployment (% change since 2000)
Unemployment (%) - White
Unemployment (%) - Black or African American
Unemployment (%) - Asian
Unemployment (%) - Hispanic or Latino
Unemployment (%) - American Indian and Alaska Native
Unemployment (%) - Multirace
Unemployment (%) - Other Race
Population density (people per square mile)
Population - Males (%)
Population - Females (%)
Population - Males (%) - White
Population - Males (%) - Black or African American
Population - Males (%) - Asian
Population - Males (%) - Hispanic or Latino
Population - Males (%) - American Indian and Alaska Native
Population - Males (%) - Multirace
Population - Males (%) - Other Race
Population - Females (%) - White
Population - Females (%) - Black or African American
Population - Females (%) - Asian
Population - Females (%) - Hispanic or Latino
Population - Females (%) - American Indian and Alaska Native
Population - Females (%) - Multirace
Population - Females (%) - Other Race
Coronavirus confirmed cases (Jun 03, 2024)
Deaths caused by coronavirus (Jun 03, 2024)
Coronavirus confirmed cases (per 100k population) (Jun 03, 2024)
Deaths caused by coronavirus (per 100k population) (Jun 03, 2024)
Daily increase in number of cases (Jun 03, 2024)
Weekly increase in number of cases (Jun 03, 2024)
Cases doubled (in days) (Jun 03, 2024)
Hospitalized patients (Apr 18, 2022)
Negative test results (Apr 18, 2022)
Total test results (Apr 18, 2022)
COVID Vaccine doses distributed (per 100k population) (Sep 19, 2023)
COVID Vaccine doses administered (per 100k population) (Sep 19, 2023)
COVID Vaccine doses distributed (Sep 19, 2023)
COVID Vaccine doses administered (Sep 19, 2023)
Likely homosexual households (%)
Likely homosexual households (% change since 2000)
Likely homosexual households - Lesbian couples (%)
Likely homosexual households - Lesbian couples (% change since 2000)
Likely homosexual households - Gay men (%)
Likely homosexual households - Gay men (% change since 2000)
Cost of living index
Median gross rent ($)
Median contract rent ($)
Median monthly housing costs ($)
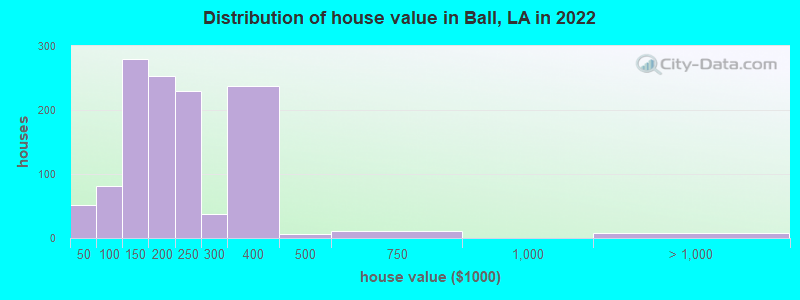
Median house or condo value ($)
Median house or condo value ($ change since 2000)
Mean house or condo value by units in structure - 1, detached ($)
Mean house or condo value by units in structure - 1, attached ($)
Mean house or condo value by units in structure - 2 ($)
Mean house or condo value by units in structure by units in structure - 3 or 4 ($)
Mean house or condo value by units in structure - 5 or more ($)
Mean house or condo value by units in structure - Boat, RV, van, etc. ($)
Mean house or condo value by units in structure - Mobile home ($)
Median house or condo value ($) - White
Median house or condo value ($) - Black or African American
Median house or condo value ($) - Asian
Median house or condo value ($) - Hispanic or Latino
Median house or condo value ($) - American Indian and Alaska Native
Median house or condo value ($) - Multirace
Median house or condo value ($) - Other Race
Median resident age
Resident age diversity
Median resident age - Males
Median resident age - Females
Median resident age - White
Median resident age - Black or African American
Median resident age - Asian
Median resident age - Hispanic or Latino
Median resident age - American Indian and Alaska Native
Median resident age - Multirace
Median resident age - Other Race
Median resident age - Males - White
Median resident age - Males - Black or African American
Median resident age - Males - Asian
Median resident age - Males - Hispanic or Latino
Median resident age - Males - American Indian and Alaska Native
Median resident age - Males - Multirace
Median resident age - Males - Other Race
Median resident age - Females - White
Median resident age - Females - Black or African American
Median resident age - Females - Asian
Median resident age - Females - Hispanic or Latino
Median resident age - Females - American Indian and Alaska Native
Median resident age - Females - Multirace
Median resident age - Females - Other Race
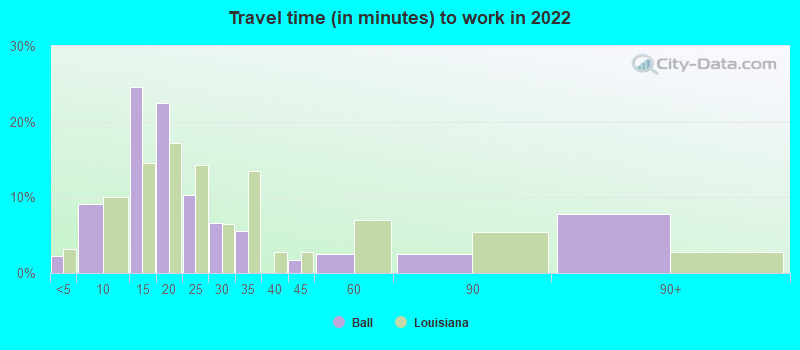
Commute - mean travel time to work (minutes)
Travel time to work - Less than 5 minutes (%)
Travel time to work - Less than 5 minutes (% change since 2000)
Travel time to work - 5 to 9 minutes (%)
Travel time to work - 5 to 9 minutes (% change since 2000)
Travel time to work - 10 to 19 minutes (%)
Travel time to work - 10 to 19 minutes (% change since 2000)
Travel time to work - 20 to 29 minutes (%)
Travel time to work - 20 to 29 minutes (% change since 2000)
Travel time to work - 30 to 39 minutes (%)
Travel time to work - 30 to 39 minutes (% change since 2000)
Travel time to work - 40 to 59 minutes (%)
Travel time to work - 40 to 59 minutes (% change since 2000)
Travel time to work - 60 to 89 minutes (%)
Travel time to work - 60 to 89 minutes (% change since 2000)
Travel time to work - 90 or more minutes (%)
Travel time to work - 90 or more minutes (% change since 2000)
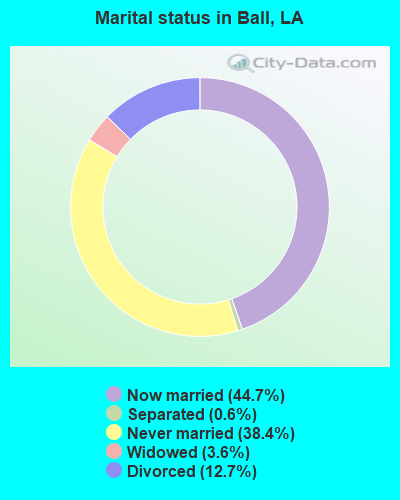
Marital status - Never married (%)
Marital status - Now married (%)
Marital status - Separated (%)
Marital status - Widowed (%)
Marital status - Divorced (%)
Median family income ($)
Median family income (% change since 2000)
Median non-family income ($)
Median non-family income (% change since 2000)
Median per capita income ($)
Median per capita income (% change since 2000)
Median family income ($) - White
Median family income ($) - Black or African American
Median family income ($) - Asian
Median family income ($) - Hispanic or Latino
Median family income ($) - American Indian and Alaska Native
Median family income ($) - Multirace
Median family income ($) - Other Race
Median year house/condo built
Median year apartment built
Year house built - Built 2005 or later (%)
Year house built - Built 2000 to 2004 (%)
Year house built - Built 1990 to 1999 (%)
Year house built - Built 1980 to 1989 (%)
Year house built - Built 1970 to 1979 (%)
Year house built - Built 1960 to 1969 (%)
Year house built - Built 1950 to 1959 (%)
Year house built - Built 1940 to 1949 (%)
Year house built - Built 1939 or earlier (%)
Average household size
Household density (households per square mile)
Average household size - White
Average household size - Black or African American
Average household size - Asian
Average household size - Hispanic or Latino
Average household size - American Indian and Alaska Native
Average household size - Multirace
Average household size - Other Race
Occupied housing units (%)
Vacant housing units (%)
Owner occupied housing units (%)
Renter occupied housing units (%)
Vacancy status - For rent (%)
Vacancy status - For sale only (%)
Vacancy status - Rented or sold, not occupied (%)
Vacancy status - For seasonal, recreational, or occasional use (%)
Vacancy status - For migrant workers (%)
Vacancy status - Other vacant (%)
Residents with income below the poverty level (%)
Residents with income below 50% of the poverty level (%)
Children below poverty level (%)
Poor families by family type - Married-couple family (%)
Poor families by family type - Male, no wife present (%)
Poor families by family type - Female, no husband present (%)
Poverty status for native-born residents (%)
Poverty status for foreign-born residents (%)
Poverty among high school graduates not in families (%)
Poverty among people who did not graduate high school not in families (%)
Residents with income below the poverty level (%) - White
Residents with income below the poverty level (%) - Black or African American
Residents with income below the poverty level (%) - Asian
Residents with income below the poverty level (%) - Hispanic or Latino
Residents with income below the poverty level (%) - American Indian and Alaska Native
Residents with income below the poverty level (%) - Multirace
Residents with income below the poverty level (%) - Other Race
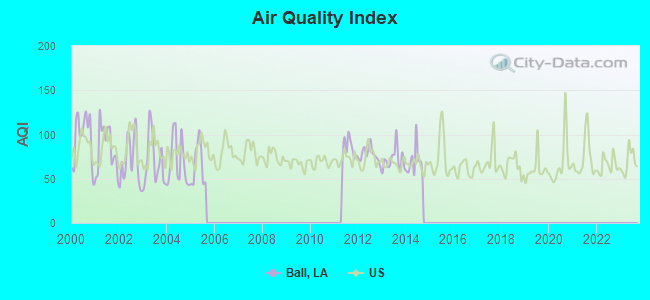
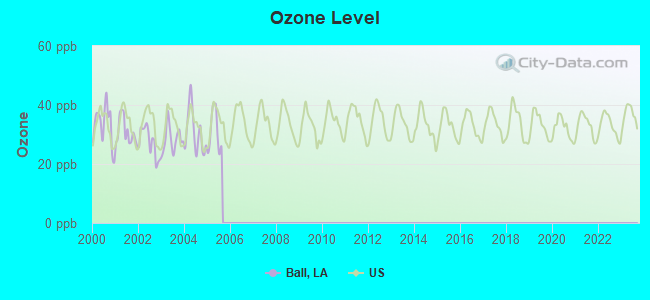
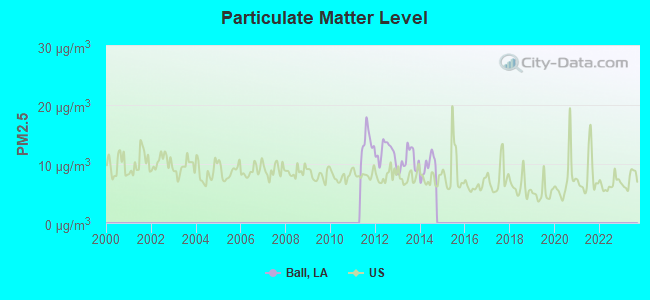
Air pollution - Air Quality Index (AQI)
Air pollution - CO
Air pollution - NO2
Air pollution - SO2
Air pollution - Ozone
Air pollution - PM10
Air pollution - PM25
Air pollution - Pb
Crime - Murders per 100,000 population
Crime - Rapes per 100,000 population
Crime - Robberies per 100,000 population
Crime - Assaults per 100,000 population
Crime - Burglaries per 100,000 population
Crime - Thefts per 100,000 population
Crime - Auto thefts per 100,000 population
Crime - Arson per 100,000 population
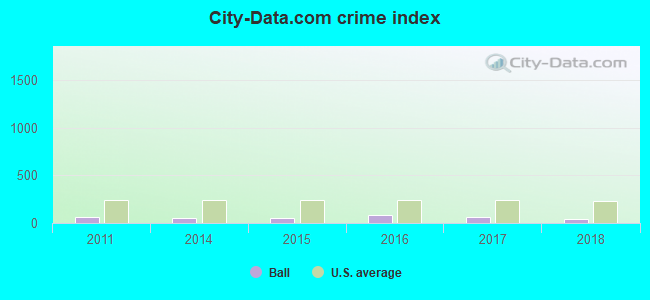
Crime - City-data.com crime index
Crime - Violent crime index
Crime - Property crime index
Crime - Murders per 100,000 population (5 year average)
Crime - Rapes per 100,000 population (5 year average)
Crime - Robberies per 100,000 population (5 year average)
Crime - Assaults per 100,000 population (5 year average)
Crime - Burglaries per 100,000 population (5 year average)
Crime - Thefts per 100,000 population (5 year average)
Crime - Auto thefts per 100,000 population (5 year average)
Crime - Arson per 100,000 population (5 year average)
Crime - City-data.com crime index (5 year average)
Crime - Violent crime index (5 year average)
Crime - Property crime index (5 year average)
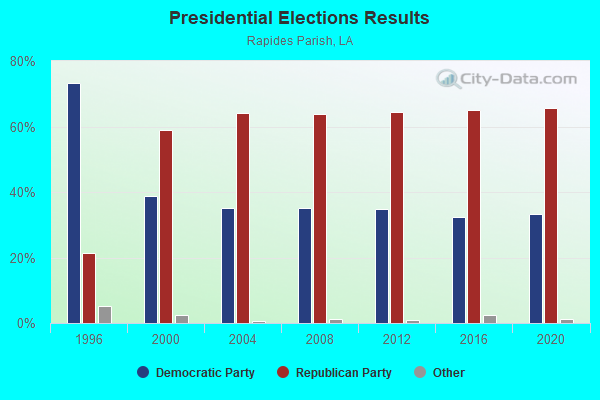
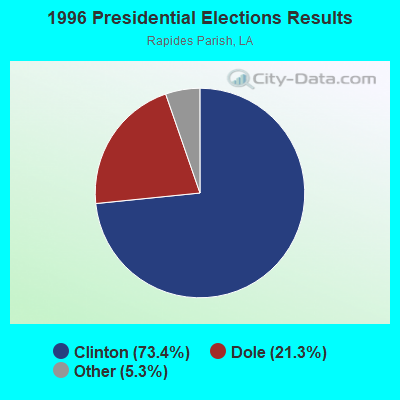
1996 Presidential Elections Results (%) - Democratic Party (Clinton)
1996 Presidential Elections Results (%) - Republican Party (Dole)
1996 Presidential Elections Results (%) - Other
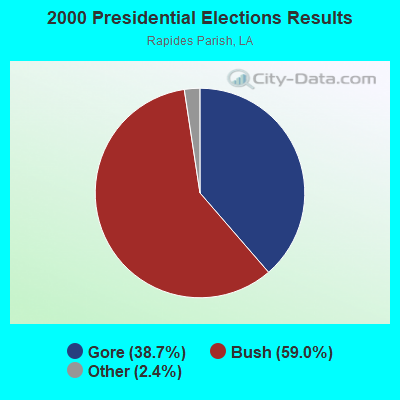
2000 Presidential Elections Results (%) - Democratic Party (Gore)
2000 Presidential Elections Results (%) - Republican Party (Bush)
2000 Presidential Elections Results (%) - Other
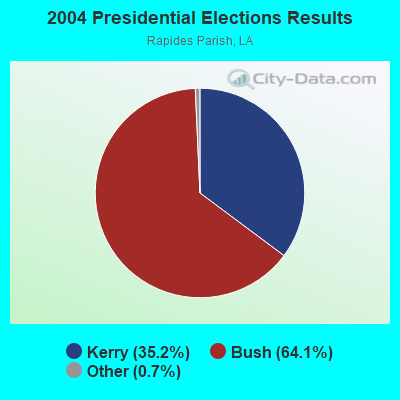
2004 Presidential Elections Results (%) - Democratic Party (Kerry)
2004 Presidential Elections Results (%) - Republican Party (Bush)
2004 Presidential Elections Results (%) - Other
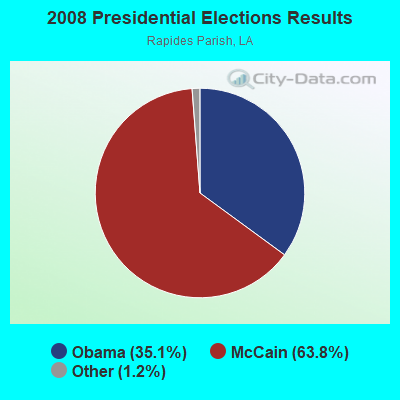
2008 Presidential Elections Results (%) - Democratic Party (Obama)
2008 Presidential Elections Results (%) - Republican Party (McCain)
2008 Presidential Elections Results (%) - Other
2012 Presidential Elections Results (%) - Democratic Party (Obama)
2012 Presidential Elections Results (%) - Republican Party (Romney)
2012 Presidential Elections Results (%) - Other
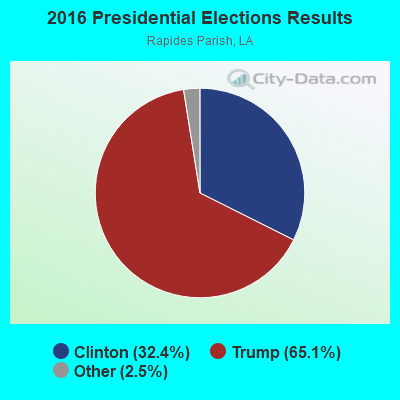
2016 Presidential Elections Results (%) - Democratic Party (Clinton)
2016 Presidential Elections Results (%) - Republican Party (Trump)
2016 Presidential Elections Results (%) - Other
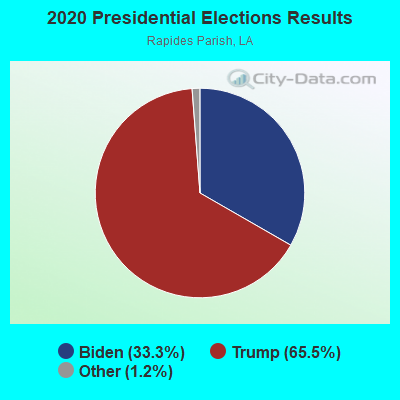
2020 Presidential Elections Results (%) - Democratic Party (Biden)
2020 Presidential Elections Results (%) - Republican Party (Trump)
2020 Presidential Elections Results (%) - Other
Ancestries Reported - Arab (%)
Ancestries Reported - Czech (%)
Ancestries Reported - Danish (%)
Ancestries Reported - Dutch (%)
Ancestries Reported - English (%)
Ancestries Reported - French (%)
Ancestries Reported - French Canadian (%)
Ancestries Reported - German (%)
Ancestries Reported - Greek (%)
Ancestries Reported - Hungarian (%)
Ancestries Reported - Irish (%)
Ancestries Reported - Italian (%)
Ancestries Reported - Lithuanian (%)
Ancestries Reported - Norwegian (%)
Ancestries Reported - Polish (%)
Ancestries Reported - Portuguese (%)
Ancestries Reported - Russian (%)
Ancestries Reported - Scotch-Irish (%)
Ancestries Reported - Scottish (%)
Ancestries Reported - Slovak (%)
Ancestries Reported - Subsaharan African (%)
Ancestries Reported - Swedish (%)
Ancestries Reported - Swiss (%)
Ancestries Reported - Ukrainian (%)
Ancestries Reported - United States (%)
Ancestries Reported - Welsh (%)
Ancestries Reported - West Indian (%)
Ancestries Reported - Other (%)
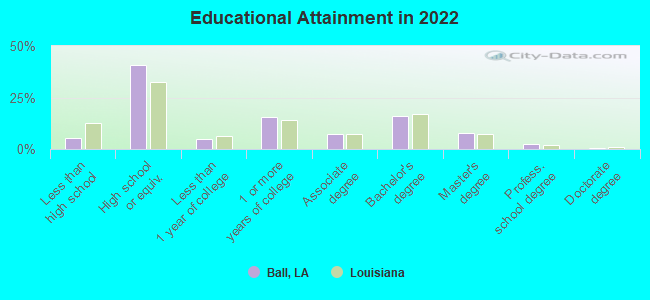
Educational Attainment - No schooling completed (%)
Educational Attainment - Less than high school (%)
Educational Attainment - High school or equivalent (%)
Educational Attainment - Less than 1 year of college (%)
Educational Attainment - 1 or more years of college (%)
Educational Attainment - Associate degree (%)
Educational Attainment - Bachelor's degree (%)
Educational Attainment - Master's degree (%)
Educational Attainment - Professional school degree (%)
Educational Attainment - Doctorate degree (%)
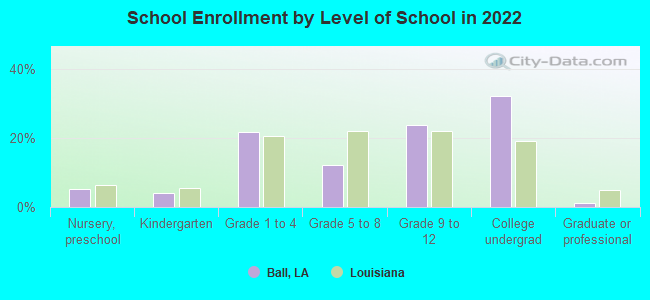
School Enrollment - Nursery, preschool (%)
School Enrollment - Kindergarten (%)
School Enrollment - Grade 1 to 4 (%)
School Enrollment - Grade 5 to 8 (%)
School Enrollment - Grade 9 to 12 (%)
School Enrollment - College undergrad (%)
School Enrollment - Graduate or professional (%)
School Enrollment - Not enrolled in school (%)
School enrollment - Public schools (%)
School enrollment - Private schools (%)
School enrollment - Not enrolled (%)
Median number of rooms in houses and condos
Median number of rooms in apartments
Housing units lacking complete plumbing facilities (%)
Housing units lacking complete kitchen facilities (%)
Density of houses
Urban houses (%)
Rural houses (%)
Households with people 60 years and over (%)
Households with people 65 years and over (%)
Households with people 75 years and over (%)
Households with one or more nonrelatives (%)
Households with no nonrelatives (%)
Population in households (%)
Family households (%)
Nonfamily households (%)
Population in families (%)
Family households with own children (%)
Median number of bedrooms in owner occupied houses
Mean number of bedrooms in owner occupied houses
Median number of bedrooms in renter occupied houses
Mean number of bedrooms in renter occupied houses
Median number of vehichles in owner occupied houses
Mean number of vehichles in owner occupied houses
Median number of vehichles in renter occupied houses
Mean number of vehichles in renter occupied houses
Mortgage status - with mortgage (%)
Mortgage status - with second mortgage (%)
Mortgage status - with home equity loan (%)
Mortgage status - with both second mortgage and home equity loan (%)
Mortgage status - without a mortgage (%)
Average family size
Average family size - White
Average family size - Black or African American
Average family size - Asian
Average family size - Hispanic or Latino
Average family size - American Indian and Alaska Native
Average family size - Multirace
Average family size - Other Race
Geographical mobility - Same house 1 year ago (%)
Geographical mobility - Moved within same county (%)
Geographical mobility - Moved from different county within same state (%)
Geographical mobility - Moved from different state (%)
Geographical mobility - Moved from abroad (%)
Place of birth - Born in state of residence (%)
Place of birth - Born in other state (%)
Place of birth - Native, outside of US (%)
Place of birth - Foreign born (%)
Housing units in structures - 1, detached (%)
Housing units in structures - 1, attached (%)
Housing units in structures - 2 (%)
Housing units in structures - 3 or 4 (%)
Housing units in structures - 5 to 9 (%)
Housing units in structures - 10 to 19 (%)
Housing units in structures - 20 to 49 (%)
Housing units in structures - 50 or more (%)
Housing units in structures - Mobile home (%)
Housing units in structures - Boat, RV, van, etc. (%)
House/condo owner moved in on average (years ago)
Renter moved in on average (years ago)
Year householder moved into unit - Moved in 1999 to March 2000 (%)
Year householder moved into unit - Moved in 1995 to 1998 (%)
Year householder moved into unit - Moved in 1990 to 1994 (%)
Year householder moved into unit - Moved in 1980 to 1989 (%)
Year householder moved into unit - Moved in 1970 to 1979 (%)
Year householder moved into unit - Moved in 1969 or earlier (%)
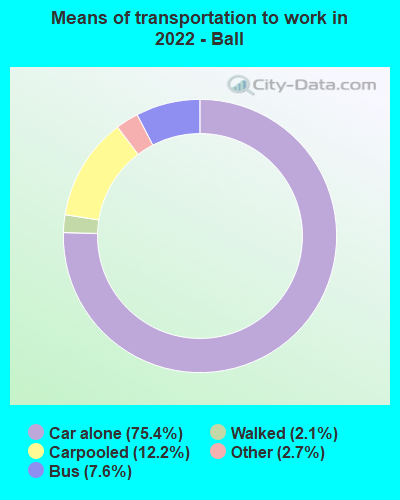
Means of transportation to work - Drove car alone (%)
Means of transportation to work - Carpooled (%)
Means of transportation to work - Public transportation (%)
Means of transportation to work - Bus or trolley bus (%)
Means of transportation to work - Streetcar or trolley car (%)
Means of transportation to work - Subway or elevated (%)
Means of transportation to work - Railroad (%)
Means of transportation to work - Ferryboat (%)
Means of transportation to work - Taxicab (%)
Means of transportation to work - Motorcycle (%)
Means of transportation to work - Bicycle (%)
Means of transportation to work - Walked (%)
Means of transportation to work - Other means (%)
Working at home (%)
Industry diversity
Most Common Industries - Agriculture, forestry, fishing and hunting, and mining (%)
Most Common Industries - Agriculture, forestry, fishing and hunting (%)
Most Common Industries - Mining, quarrying, and oil and gas extraction (%)
Most Common Industries - Construction (%)
Most Common Industries - Manufacturing (%)
Most Common Industries - Wholesale trade (%)
Most Common Industries - Retail trade (%)
Most Common Industries - Transportation and warehousing, and utilities (%)
Most Common Industries - Transportation and warehousing (%)
Most Common Industries - Utilities (%)
Most Common Industries - Information (%)
Most Common Industries - Finance and insurance, and real estate and rental and leasing (%)
Most Common Industries - Finance and insurance (%)
Most Common Industries - Real estate and rental and leasing (%)
Most Common Industries - Professional, scientific, and management, and administrative and waste management services (%)
Most Common Industries - Professional, scientific, and technical services (%)
Most Common Industries - Management of companies and enterprises (%)
Most Common Industries - Administrative and support and waste management services (%)
Most Common Industries - Educational services, and health care and social assistance (%)
Most Common Industries - Educational services (%)
Most Common Industries - Health care and social assistance (%)
Most Common Industries - Arts, entertainment, and recreation, and accommodation and food services (%)
Most Common Industries - Arts, entertainment, and recreation (%)
Most Common Industries - Accommodation and food services (%)
Most Common Industries - Other services, except public administration (%)
Most Common Industries - Public administration (%)
Occupation diversity
Most Common Occupations - Management, business, science, and arts occupations (%)
Most Common Occupations - Management, business, and financial occupations (%)
Most Common Occupations - Management occupations (%)
Most Common Occupations - Business and financial operations occupations (%)
Most Common Occupations - Computer, engineering, and science occupations (%)
Most Common Occupations - Computer and mathematical occupations (%)
Most Common Occupations - Architecture and engineering occupations (%)
Most Common Occupations - Life, physical, and social science occupations (%)
Most Common Occupations - Education, legal, community service, arts, and media occupations (%)
Most Common Occupations - Community and social service occupations (%)
Most Common Occupations - Legal occupations (%)
Most Common Occupations - Education, training, and library occupations (%)
Most Common Occupations - Arts, design, entertainment, sports, and media occupations (%)
Most Common Occupations - Healthcare practitioners and technical occupations (%)
Most Common Occupations - Health diagnosing and treating practitioners and other technical occupations (%)
Most Common Occupations - Health technologists and technicians (%)
Most Common Occupations - Service occupations (%)
Most Common Occupations - Healthcare support occupations (%)
Most Common Occupations - Protective service occupations (%)
Most Common Occupations - Fire fighting and prevention, and other protective service workers including supervisors (%)
Most Common Occupations - Law enforcement workers including supervisors (%)
Most Common Occupations - Food preparation and serving related occupations (%)
Most Common Occupations - Building and grounds cleaning and maintenance occupations (%)
Most Common Occupations - Personal care and service occupations (%)
Most Common Occupations - Sales and office occupations (%)
Most Common Occupations - Sales and related occupations (%)
Most Common Occupations - Office and administrative support occupations (%)
Most Common Occupations - Natural resources, construction, and maintenance occupations (%)
Most Common Occupations - Farming, fishing, and forestry occupations (%)
Most Common Occupations - Construction and extraction occupations (%)
Most Common Occupations - Installation, maintenance, and repair occupations (%)
Most Common Occupations - Production, transportation, and material moving occupations (%)
Most Common Occupations - Production occupations (%)
Most Common Occupations - Transportation occupations (%)
Most Common Occupations - Material moving occupations (%)
People in Group quarters - Institutionalized population (%)
People in Group quarters - Correctional institutions (%)
People in Group quarters - Federal prisons and detention centers (%)
People in Group quarters - Halfway houses (%)
People in Group quarters - Local jails and other confinement facilities (including police lockups) (%)
People in Group quarters - Military disciplinary barracks (%)
People in Group quarters - State prisons (%)
People in Group quarters - Other types of correctional institutions (%)
People in Group quarters - Nursing homes (%)
People in Group quarters - Hospitals/wards, hospices, and schools for the handicapped (%)
People in Group quarters - Hospitals/wards and hospices for chronically ill (%)
People in Group quarters - Hospices or homes for chronically ill (%)
People in Group quarters - Military hospitals or wards for chronically ill (%)
People in Group quarters - Other hospitals or wards for chronically ill (%)
People in Group quarters - Hospitals or wards for drug/alcohol abuse (%)
People in Group quarters - Mental (Psychiatric) hospitals or wards (%)
People in Group quarters - Schools, hospitals, or wards for the mentally retarded (%)
People in Group quarters - Schools, hospitals, or wards for the physically handicapped (%)
People in Group quarters - Institutions for the deaf (%)
People in Group quarters - Institutions for the blind (%)
People in Group quarters - Orthopedic wards and institutions for the physically handicapped (%)
People in Group quarters - Wards in general hospitals for patients who have no usual home elsewhere (%)
People in Group quarters - Wards in military hospitals for patients who have no usual home elsewhere (%)
People in Group quarters - Juvenile institutions (%)
People in Group quarters - Long-term care (%)
People in Group quarters - Homes for abused, dependent, and neglected children (%)
People in Group quarters - Residential treatment centers for emotionally disturbed children (%)
People in Group quarters - Training schools for juvenile delinquents (%)
People in Group quarters - Short-term care, detention or diagnostic centers for delinquent children (%)
People in Group quarters - Type of juvenile institution unknown (%)
People in Group quarters - Noninstitutionalized population (%)
People in Group quarters - College dormitories (includes college quarters off campus) (%)
People in Group quarters - Military quarters (%)
People in Group quarters - On base (%)
People in Group quarters - Barracks, unaccompanied personnel housing (UPH), (Enlisted/Officer), ;and similar group living quarters for military personnel (%)
People in Group quarters - Transient quarters for temporary residents (%)
People in Group quarters - Military ships (%)
People in Group quarters - Group homes (%)
People in Group quarters - Homes or halfway houses for drug/alcohol abuse (%)
People in Group quarters - Homes for the mentally ill (%)
People in Group quarters - Homes for the mentally retarded (%)
People in Group quarters - Homes for the physically handicapped (%)
People in Group quarters - Other group homes (%)
People in Group quarters - Religious group quarters (%)
People in Group quarters - Dormitories (%)
People in Group quarters - Agriculture workers' dormitories on farms (%)
People in Group quarters - Job Corps and vocational training facilities (%)
People in Group quarters - Other workers' dormitories (%)
People in Group quarters - Crews of maritime vessels (%)
People in Group quarters - Other nonhousehold living situations (%)
People in Group quarters - Other noninstitutional group quarters (%)
Residents speaking English at home (%)
Residents speaking English at home - Born in the United States (%)
Residents speaking English at home - Native, born elsewhere (%)
Residents speaking English at home - Foreign born (%)
Residents speaking Spanish at home (%)
Residents speaking Spanish at home - Born in the United States (%)
Residents speaking Spanish at home - Native, born elsewhere (%)
Residents speaking Spanish at home - Foreign born (%)
Residents speaking other language at home (%)
Residents speaking other language at home - Born in the United States (%)
Residents speaking other language at home - Native, born elsewhere (%)
Residents speaking other language at home - Foreign born (%)
Class of Workers - Employee of private company (%)
Class of Workers - Self-employed in own incorporated business (%)
Class of Workers - Private not-for-profit wage and salary workers (%)
Class of Workers - Local government workers (%)
Class of Workers - State government workers (%)
Class of Workers - Federal government workers (%)
Class of Workers - Self-employed workers in own not incorporated business and Unpaid family workers (%)
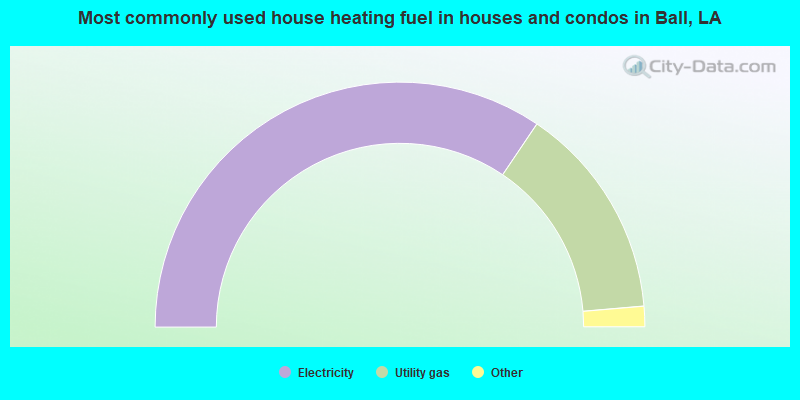
House heating fuel used in houses and condos - Utility gas (%)
House heating fuel used in houses and condos - Bottled, tank, or LP gas (%)
House heating fuel used in houses and condos - Electricity (%)
House heating fuel used in houses and condos - Fuel oil, kerosene, etc. (%)
House heating fuel used in houses and condos - Coal or coke (%)
House heating fuel used in houses and condos - Wood (%)
House heating fuel used in houses and condos - Solar energy (%)
House heating fuel used in houses and condos - Other fuel (%)
House heating fuel used in houses and condos - No fuel used (%)
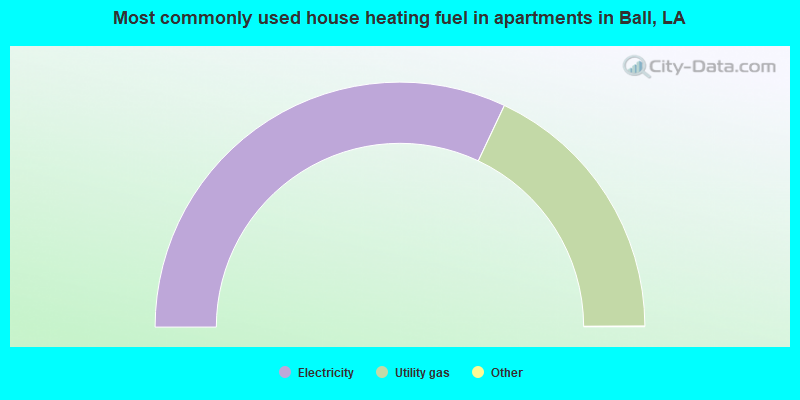
House heating fuel used in apartments - Utility gas (%)
House heating fuel used in apartments - Bottled, tank, or LP gas (%)
House heating fuel used in apartments - Electricity (%)
House heating fuel used in apartments - Fuel oil, kerosene, etc. (%)
House heating fuel used in apartments - Coal or coke (%)
House heating fuel used in apartments - Wood (%)
House heating fuel used in apartments - Solar energy (%)
House heating fuel used in apartments - Other fuel (%)
House heating fuel used in apartments - No fuel used (%)
Armed forces status - In Armed Forces (%)
Armed forces status - Civilian (%)
Armed forces status - Civilian - Veteran (%)
Armed forces status - Civilian - Nonveteran (%)
Fatal accidents locations in years 2005-2021
Fatal accidents locations in 2005
Fatal accidents locations in 2006
Fatal accidents locations in 2007
Fatal accidents locations in 2008
Fatal accidents locations in 2009
Fatal accidents locations in 2010
Fatal accidents locations in 2011
Fatal accidents locations in 2012
Fatal accidents locations in 2013
Fatal accidents locations in 2014
Fatal accidents locations in 2015
Fatal accidents locations in 2016
Fatal accidents locations in 2017
Fatal accidents locations in 2018
Fatal accidents locations in 2019
Fatal accidents locations in 2020
Fatal accidents locations in 2021
Alcohol use - People drinking some alcohol every month (%)
Alcohol use - People not drinking at all (%)
Alcohol use - Average days/month drinking alcohol
Alcohol use - Average drinks/week
Alcohol use - Average days/year people drink much
Audiometry - Average condition of hearing (%)
Audiometry - People that can hear a whisper from across a quiet room (%)
Audiometry - People that can hear normal voice from across a quiet room (%)
Audiometry - Ears ringing, roaring, buzzing (%)
Audiometry - Had a job exposure to loud noise (%)
Audiometry - Had off-work exposure to loud noise (%)
Blood Pressure & Cholesterol - Has high blood pressure (%)
Blood Pressure & Cholesterol - Checking blood pressure at home (%)
Blood Pressure & Cholesterol - Frequently checking blood cholesterol (%)
Blood Pressure & Cholesterol - Has high cholesterol level (%)
Consumer Behavior - Money monthly spent on food at supermarket/grocery store
Consumer Behavior - Money monthly spent on food at other stores
Consumer Behavior - Money monthly spent on eating out
Consumer Behavior - Money monthly spent on carryout/delivered foods
Consumer Behavior - Income spent on food at supermarket/grocery store (%)
Consumer Behavior - Income spent on food at other stores (%)
Consumer Behavior - Income spent on eating out (%)
Consumer Behavior - Income spent on carryout/delivered foods (%)
Current Health Status - General health condition (%)
Current Health Status - Blood donors (%)
Current Health Status - Has blood ever tested for HIV virus (%)
Current Health Status - Left-handed people (%)
Dermatology - People using sunscreen (%)
Diabetes - Diabetics (%)
Diabetes - Had a blood test for high blood sugar (%)
Diabetes - People taking insulin (%)
Diet Behavior & Nutrition - Diet health (%)
Diet Behavior & Nutrition - Milk product consumption (# of products/month)
Diet Behavior & Nutrition - Meals not home prepared (#/week)
Diet Behavior & Nutrition - Meals from fast food or pizza place (#/week)
Diet Behavior & Nutrition - Ready-to-eat foods (#/month)
Diet Behavior & Nutrition - Frozen meals/pizza (#/month)
Drug Use - People that ever used marijuana or hashish (%)
Drug Use - Ever used hard drugs (%)
Drug Use - Ever used any form of cocaine (%)
Drug Use - Ever used heroin (%)
Drug Use - Ever used methamphetamine (%)
Health Insurance - People covered by health insurance (%)
Kidney Conditions-Urology - Avg. # of times urinating at night
Medical Conditions - People with asthma (%)
Medical Conditions - People with anemia (%)
Medical Conditions - People with psoriasis (%)
Medical Conditions - People with overweight (%)
Medical Conditions - Elderly people having difficulties in thinking or remembering (%)
Medical Conditions - People who ever received blood transfusion (%)
Medical Conditions - People having trouble seeing even with glass/contacts (%)
Medical Conditions - People with arthritis (%)
Medical Conditions - People with gout (%)
Medical Conditions - People with congestive heart failure (%)
Medical Conditions - People with coronary heart disease (%)
Medical Conditions - People with angina pectoris (%)
Medical Conditions - People who ever had heart attack (%)
Medical Conditions - People who ever had stroke (%)
Medical Conditions - People with emphysema (%)
Medical Conditions - People with thyroid problem (%)
Medical Conditions - People with chronic bronchitis (%)
Medical Conditions - People with any liver condition (%)
Medical Conditions - People who ever had cancer or malignancy (%)
Mental Health - People who have little interest in doing things (%)
Mental Health - People feeling down, depressed, or hopeless (%)
Mental Health - People who have trouble sleeping or sleeping too much (%)
Mental Health - People feeling tired or having little energy (%)
Mental Health - People with poor appetite or overeating (%)
Mental Health - People feeling bad about themself (%)
Mental Health - People who have trouble concentrating on things (%)
Mental Health - People moving or speaking slowly or too fast (%)
Mental Health - People having thoughts they would be better off dead (%)
Oral Health - Average years since last visit a dentist
Oral Health - People embarrassed because of mouth (%)
Oral Health - People with gum disease (%)
Oral Health - General health of teeth and gums (%)
Oral Health - Average days a week using dental floss/device
Oral Health - Average days a week using mouthwash for dental problem
Oral Health - Average number of teeth
Pesticide Use - Households using pesticides to control insects (%)
Pesticide Use - Households using pesticides to kill weeds (%)
Physical Activity - People doing vigorous-intensity work activities (%)
Physical Activity - People doing moderate-intensity work activities (%)
Physical Activity - People walking or bicycling (%)
Physical Activity - People doing vigorous-intensity recreational activities (%)
Physical Activity - People doing moderate-intensity recreational activities (%)
Physical Activity - Average hours a day doing sedentary activities
Physical Activity - Average hours a day watching TV or videos
Physical Activity - Average hours a day using computer
Physical Functioning - People having limitations keeping them from working (%)
Physical Functioning - People limited in amount of work they can do (%)
Physical Functioning - People that need special equipment to walk (%)
Physical Functioning - People experiencing confusion/memory problems (%)
Physical Functioning - People requiring special healthcare equipment (%)
Prescription Medications - Average number of prescription medicines taking
Preventive Aspirin Use - Adults 40+ taking low-dose aspirin (%)
Reproductive Health - Vaginal deliveries (%)
Reproductive Health - Cesarean deliveries (%)
Reproductive Health - Deliveries resulted in a live birth (%)
Reproductive Health - Pregnancies resulted in a delivery (%)
Reproductive Health - Women breastfeeding newborns (%)
Reproductive Health - Women that had a hysterectomy (%)
Reproductive Health - Women that had both ovaries removed (%)
Reproductive Health - Women that have ever taken birth control pills (%)
Reproductive Health - Women taking birth control pills (%)
Reproductive Health - Women that have ever used Depo-Provera or injectables (%)
Reproductive Health - Women that have ever used female hormones (%)
Sexual Behavior - People 18+ that ever had sex (vaginal, anal, or oral) (%)
Sexual Behavior - Males 18+ that ever had vaginal sex with a woman (%)
Sexual Behavior - Males 18+ that ever performed oral sex on a woman (%)
Sexual Behavior - Males 18+ that ever had anal sex with a woman (%)
Sexual Behavior - Males 18+ that ever had any sex with a man (%)
Sexual Behavior - Females 18+ that ever had vaginal sex with a man (%)
Sexual Behavior - Females 18+ that ever performed oral sex on a man (%)
Sexual Behavior - Females 18+ that ever had anal sex with a man (%)
Sexual Behavior - Females 18+ that ever had any kind of sex with a woman (%)
Sexual Behavior - Average age people first had sex
Sexual Behavior - Average number of female sex partners in lifetime (males 18+)
Sexual Behavior - Average number of female vaginal sex partners in lifetime (males 18+)
Sexual Behavior - Average age people first performed oral sex on a woman (18+)
Sexual Behavior - Average number of woman performed oral sex on in lifetime (18+)
Sexual Behavior - Average number of male sex partners in lifetime (males 18+)
Sexual Behavior - Average number of male anal sex partners in lifetime (males 18+)
Sexual Behavior - Average age people first performed oral sex on a man (18+)
Sexual Behavior - Average number of male oral sex partners in lifetime (18+)
Sexual Behavior - People using protection when performing oral sex (%)
Sexual Behavior - Average number of times people have vaginal or anal sex a year
Sexual Behavior - People having sex without condom (%)
Sexual Behavior - Average number of male sex partners in lifetime (females 18+)
Sexual Behavior - Average number of male vaginal sex partners in lifetime (females 18+)
Sexual Behavior - Average number of female sex partners in lifetime (females 18+)
Sexual Behavior - Circumcised males 18+ (%)
Sleep Disorders - Average hours sleeping at night
Sleep Disorders - People that has trouble sleeping (%)
Smoking-Cigarette Use - People smoking cigarettes (%)
Taste & Smell - People 40+ having problems with smell (%)
Taste & Smell - People 40+ having problems with taste (%)
Taste & Smell - People 40+ that ever had wisdom teeth removed (%)
Taste & Smell - People 40+ that ever had tonsils teeth removed (%)
Taste & Smell - People 40+ that ever had a loss of consciousness because of a head injury (%)
Taste & Smell - People 40+ that ever had a broken nose or other serious injury to face or skull (%)
Taste & Smell - People 40+ that ever had two or more sinus infections (%)
Weight - Average height (inches)
Weight - Average weight (pounds)
Weight - Average BMI
Weight - People that are obese (%)
Weight - People that ever were obese (%)
Weight - People trying to lose weight (%)
According to our research of Louisiana and other state lists, there were 7 registered sex offenders living in Ball, Louisiana as of June 03, 2024 . The ratio of all residents to sex offenders in Ball is 578 to 1.The ratio of registered sex offenders to all residents in this city is lower than the state average.
Officers per 1,000 residents here:
3.08Louisiana average:
3.44
Latest news from Ball, LA collected exclusively by city-data.com from local newspapers, TV, and radio stations
Ancestries: French (10.4%), American (8.4%), Irish (3.3%), Italian (1.0%).
Current Local Time:
Land area: 8.03 square miles.
Population density: 478 people per square mile (low).
22 residents are foreign born
This town:
0.6%Louisiana:
4.2%
Median real estate property taxes paid for housing units in 2000: Ball town:
0.3% ($199)Louisiana:
0.3% ($199)
Nearest city with pop. 50,000+: Monroe, LA
Nearest city with pop. 200,000+: Baton Rouge, LA
Nearest city with pop. 1,000,000+: Houston, TX
Nearest cities:
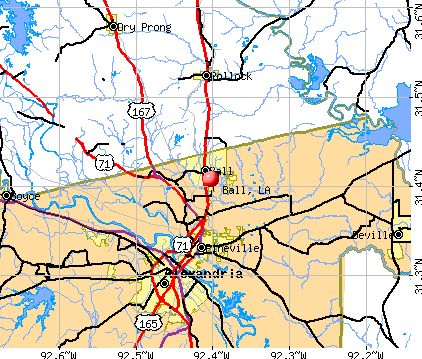
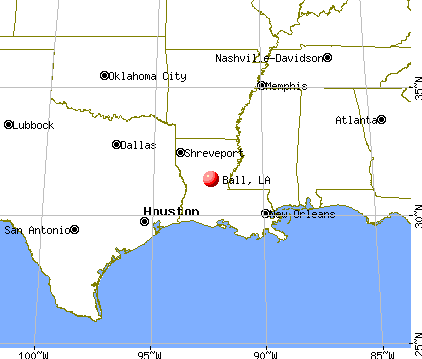
Latitude: 31.41 N, Longitude: 92.40 W
Area code commonly used in this area: 318
Single-family new house construction building permits:
2022: 10 buildings , average cost: $227,0002021: 1 building , cost: $160,0002020: 2 buildings , average cost: $187,5002018: 8 buildings , average cost: $150,5002017: 4 buildings , average cost: $107,5002016: 17 buildings , average cost: $199,3002015: 10 buildings , average cost: $123,6002014: 4 buildings , average cost: $152,6002013: 12 buildings , average cost: $180,1002012: 11 buildings , average cost: $180,1002011: 9 buildings , average cost: $180,1002010: 9 buildings , average cost: $180,1002009: 2 buildings , average cost: $109,5002008: 9 buildings , average cost: $145,4002007: 8 buildings , average cost: $149,6002006: 25 buildings , average cost: $150,6002005: 13 buildings , average cost: $32,7002004: 15 buildings , average cost: $53,6002003: 15 buildings , average cost: $53,6002002: 14 buildings , average cost: $53,6002000: 11 buildings , average cost: $62,1001999: 8 buildings , average cost: $57,8001998: 6 buildings , average cost: $69,4001997: 6 buildings , average cost: $69,400Unemployment in December 2023: Population change in the 1990s: +274 (+8.0%).
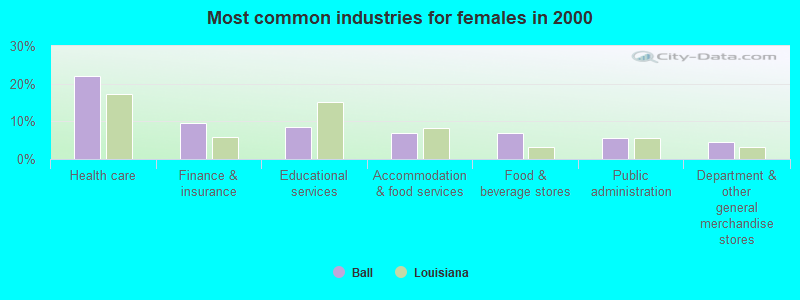
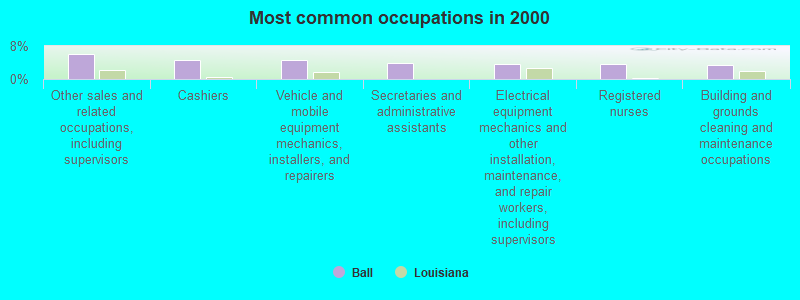
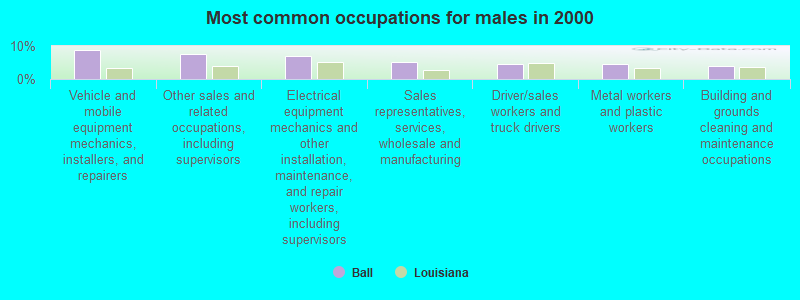
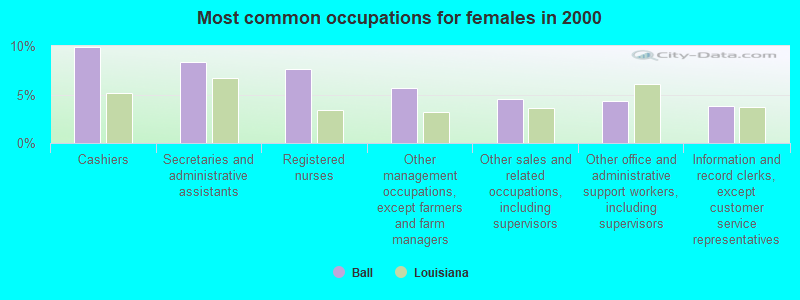
Most common occupations in Ball, LA (%)
Both Males Females
Other sales and related occupations, including supervisors (6.2%)
Cashiers (4.7%)
Vehicle and mobile equipment mechanics, installers, and repairers (4.7%)
Secretaries and administrative assistants (4.0%)
Electrical equipment mechanics and other installation, maintenance, and repair workers, including supervisors (3.6%)
Registered nurses (3.6%)
Building and grounds cleaning and maintenance occupations (3.4%)
Vehicle and mobile equipment mechanics, installers, and repairers (8.9%)
Other sales and related occupations, including supervisors (7.7%)
Electrical equipment mechanics and other installation, maintenance, and repair workers, including supervisors (7.0%)
Sales representatives, services, wholesale and manufacturing (5.2%)
Driver/sales workers and truck drivers (4.7%)
Metal workers and plastic workers (4.7%)
Building and grounds cleaning and maintenance occupations (3.8%)
Cashiers (9.9%)
Secretaries and administrative assistants (8.3%)
Registered nurses (7.7%)
Other management occupations, except farmers and farm managers (5.7%)
Other sales and related occupations, including supervisors (4.5%)
Other office and administrative support workers, including supervisors (4.4%)
Information and record clerks, except customer service representatives (3.8%)
Air pollution and air quality trends(lower is better)
AQI Ozone PM2.5
Tornado activity:
Ball-area historical tornado activity is near Louisiana state average. It is 57% greater than the overall U.S. average.
On 12/3/1953, a category F4 (max. wind speeds 207-260 mph) tornado 28.9 miles away from the Ball town center killed 9 people and injured 50 people and caused between $500,000 and $5,000,000 in damages.
On 6/5/1981, a category F3 (max. wind speeds 158-206 mph) tornado 6.1 miles away from the town center injured 10 people and caused between $500,000 and $5,000,000 in damages.
Earthquake activity:
Ball-area historical earthquake activity is significantly above Louisiana state average. It is 215% greater than the overall U.S. average. On 5/17/2012 at 08:12:00, a magnitude 4.8 (4.8 MW, Depth: 3.1 mi, Class: Light, Intensity: IV - V) earthquake occurred 121.2 miles away from the city center On 11/6/2011 at 03:53:10, a magnitude 5.7 (5.7 MW, Depth: 3.2 mi, Class: Moderate, Intensity: VI - VII) earthquake occurred 380.3 miles away from Ball center On 9/2/2013 at 23:51:15, a magnitude 4.3 (4.3 MW, Depth: 2.9 mi) earthquake occurred 124.2 miles away from the city center On 9/2/2013 at 21:52:38, a magnitude 4.2 (4.2 MW, Depth: 3.0 mi) earthquake occurred 130.8 miles away from the city center On 1/25/2013 at 07:01:19, a magnitude 4.1 (4.1 MB, Depth: 3.1 mi) earthquake occurred 115.8 miles away from Ball center On 9/3/2016 at 12:02:44, a magnitude 5.8 (5.8 MW, Depth: 3.5 mi) earthquake occurred 433.4 miles away from the city center Magnitude types: body-wave magnitude (MB), moment magnitude (MW) Natural disasters: The number of natural disasters in Rapides Parish (26) is a lot greater than the US average (15).Major Disasters (Presidential) Declared: 16Emergencies Declared: 5Floods: 10, Hurricanes: 10, Storms: 7, Tornadoes: 3, Tropical Storms: 2, Drought: 1, Fire: 1, Freeze: 1, Heavy Rain: 1, Other: 2 (Note: some incidents may be assigned to more than one category). Hospitals and medical centers near Ball: PARADISE ROAD COMMUNITY HOME (Hospital, about 1 miles away; PINEVILLE, LA)
LIVINGSTON ROAD COMMUNITY HOME (Hospital, about 1 miles away; PINEVILLE, LA)
ROBERTSON ROAD COMM HOME (Hospital, about 2 miles away; POLLOCK, LA)
TIOGA COMMUNITY CARE CENTER (Nursing Home, about 3 miles away; PINEVILLE, LA)
PINECREST DEVELOPMENTAL CENTER (Hospital, about 4 miles away; PINEVILLE, LA)
OAKS CARE CENTER (THE) (Nursing Home, about 4 miles away; PINEVILLE, LA)
EDGEWOOD COMMUNITY HOME (Hospital, about 5 miles away; PINEVILLE, LA)
Colleges/universities with over 2000 students nearest to Ball:
Northwestern State University of Louisiana (about 48 miles; Natchitoches, LA ; Full-time enrollment: 7,700)
Louisiana Delta Community College (about 79 miles; Monroe, LA ; FT enrollment: 3,168)
Louisiana Tech University (about 79 miles; Ruston, LA ; FT enrollment: 5,874)
Grambling State University (about 80 miles; Grambling, LA ; FT enrollment: 4,885)
University of Louisiana at Monroe (about 80 miles; Monroe, LA ; FT enrollment: 6,764)
Alcorn State University (about 81 miles; Alcorn State, MS ; FT enrollment: 3,479)
Acadiana Technical College-Lafayette Campus (about 85 miles; Lafayette, LA ; FT enrollment: 2,378)
Public high school in Ball: TIOGA HIGH SCHOOL Location: 1207 TIOGA ROAD, Grades: 9-12)
Public elementary/middle schools in Ball: PARADISE ELEMENTARY SCHOOL Students: 516, Location: 5010 MONROE HIGHWAY, Grades: PK-6)BALL ELEMENTARY SCHOOL Students: 357, Location: 89 CAMP LIVINGSTON ROAD, Grades: PK-6)TIOGA ELEMENTARY SCHOOL Location: 4310 PARDUE ROAD, Grades: PK-6)
See full list of schools located in Ball Birthplace of: Frank Estes Cole - Politician.
Rapides Parish has a predicted average indoor radon screening level less than 2 pCi/L (pico curies per liter) - Low Potential Average household size: This town:
2.5 peopleLouisiana:
2.5 people
Percentage of family households: This town:
71.8%Whole state:
67.1%
Percentage of households with unmarried partners: This town:
5.9%Whole state:
6.8%
Likely homosexual households (counted as self-reported same-sex unmarried-partner households)
Lesbian couples: 0.5% of all households Gay men: 0.3% of all households
131 people in military barracks and dormitories (nondisciplinary) in 2010people in group homes intended for adults in 2010people in homes for the mentally retarded in 2000
Banks with branches in Ball (2011 data):
Sabine State Bank and Trust Company: Ball Branch at 6206 Monroe Hwy, branch established on 2009/03/20. Info updated 2006/09/14: Bank assets: $683.7 mil, Deposits: $592.9 mil, headquarters in Many, LA, positive income , Commercial Lending Specialization, 45 total offices , Holding Company: Sabine Bancshares, Inc.
For population 15 years and over in Ball:
Never married: 38.4%Now married: 44.7%Separated: 0.6%Widowed: 3.6%Divorced: 12.7% For population 25 years and over in Ball:
High school or higher: 94.7%Bachelor's degree or higher: 22.2%Graduate or professional degree: 8.5%Unemployed: 4.3%Mean travel time to work (commute): 23.2 minutes
Education Gini index (Inequality in education) Here:
10.2Louisiana average:
11.9
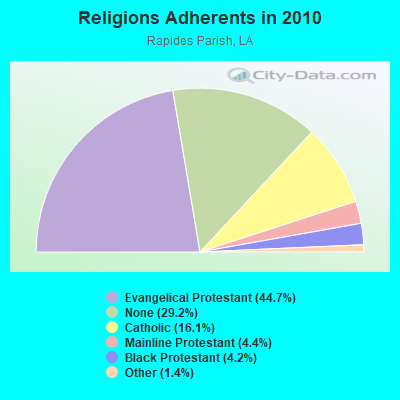
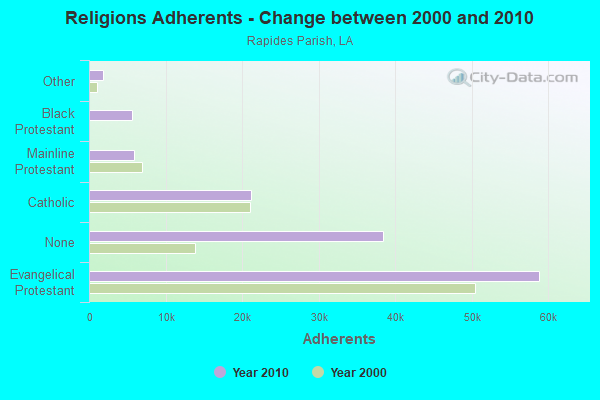
Religion statistics for Ball, LA (based on Rapides Parish data)
Religion Adherents Congregations Evangelical Protestant 58,827 172 Catholic 21,160 20 Mainline Protestant 5,844 29 Black Protestant 5,561 23 Other 1,813 11 None 38,408 -
Source: Clifford Grammich, Kirk Hadaway, Richard Houseal, Dale E.Jones, Alexei Krindatch, Richie Stanley and Richard H.Taylor. 2012. 2010 U.S.Religion Census: Religious Congregations & Membership Study. Association of Statisticians of American Religious Bodies. Jones, Dale E., et al. 2002. Congregations and Membership in the United States 2000. Nashville, TN: Glenmary Research Center. Graphs represent county-level data
Food Environment Statistics: Number of grocery stores : 19Rapides Parish :
1.43 / 10,000 pop.Louisiana :
2.56 / 10,000 pop.
Number of supercenters and club stores : 3This county :
0.23 / 10,000 pop.State :
0.18 / 10,000 pop.
Number of convenience stores (no gas) : 14Rapides Parish :
1.05 / 10,000 pop.Louisiana :
1.29 / 10,000 pop.
Number of convenience stores (with gas) : 85Rapides Parish :
6.40 / 10,000 pop.State :
4.49 / 10,000 pop.
Number of full-service restaurants : 56Here :
4.21 / 10,000 pop.State :
5.92 / 10,000 pop.
Adult diabetes rate : This county :
11.7%Louisiana :
10.9%
Adult obesity rate : Rapides Parish :
30.3%Louisiana :
29.2%
Low-income preschool obesity rate : This county :
10.2%State :
13.7%
Health and Nutrition:
Average overall health of teeth and gums : Ball:
49.1%Louisiana:
46.5%
People feeling badly about themselves : This city:
22.1%Louisiana:
20.3%
People not drinking alcohol at all : Average hours sleeping at night : General health condition : Here:
57.9%Louisiana:
55.8%
Average condition of hearing : This city:
79.5%State:
80.2%
More about Health and Nutrition of Ball, LA Residents
Local government employment and payroll (March 2022)
Function
Full-time employees
Monthly full-time payroll
Average yearly full-time wage
Part-time employees
Monthly part-time payroll
Firefighters
17 $19,214 $13,563 0 $0 Streets and Highways
13 $34,434 $31,785 0 $0 Police Protection - Officers
10 $39,774 $47,729 0 $0 Sewerage
6 $23,063 $46,126 0 $0 Other Government Administration
3 $11,680 $46,720 5 $3,230 Solid Waste Management
2 $8,053 $48,318 0 $0 Judicial and Legal
1 $3,841 $46,092 0 $0 Financial Administration
1 $3,173 $38,076 0 $0
Totals for Government
53 $143,232 $32,430 5 $3,230
Businesses in Ball, LA
Ace Hardware: 1Dairy Queen: 1 Strongest AM radio stations in Ball:
KWDF (840 AM; daytime; 8 kW; BALL, LA; Owner: BALL BROADCASTING CO.)
KJMJ (580 AM; 5 kW; ALEXANDRIA, LA; Owner: RADIO MARIA, INC.)
KTTP (1110 AM; daytime; 2 kW; PINEVILLE, LA; Owner: PEOPLES BROADCAST NETWORK LLC)
KSYL (970 AM; 1 kW; ALEXANDRIA, LA; Owner: CENLA B/C CO INC.)
KDBS (1410 AM; 1 kW; ALEXANDRIA, LA; Owner: CAPSTAR TX LIMITED PARTNERSHIP)
KEEL (710 AM; 50 kW; SHREVEPORT, LA; Owner: CITICASTERS LICENSES, L.P.)
KWKH (1130 AM; 50 kW; SHREVEPORT, LA; Owner: CITICASTERS LICENSES, L.P.)
WSJC (810 AM; 50 kW; MAGEE, MS; Owner: FAMILY TALK RADIO)
KTRH (740 AM; 50 kW; HOUSTON, TX; Owner: AMFM TEXAS LICENSES LIMITED PARTNERSHIP)
WJNT (1180 AM; 50 kW; PEARL, MS; Owner: BUCHANAN BROADCASTING CO., INC.)
WWL (870 AM; 50 kW; NEW ORLEANS, LA; Owner: ENTERCOM NEW ORLEANS LICENSE, LLC)
WLNO (1060 AM; 50 kW; NEW ORLEANS, LA; Owner: COMMUNICOM CO. OF LOUISIANA, L.P.)
WOMN (1110 AM; daytime; 30 kW; FRANKLINTON, LA; Owner: PITTMAN BROADCASTING SERVICES, LLC.)
Strongest FM radio stations in Ball:
KHFX (105.5 FM; BALL, LA; Owner: CAJUN COMMUNICATIONS OF TEXAS, INC.)
KRRV-FM (100.3 FM; ALEXANDRIA, LA; Owner: CAPSTAR TX LIMITED PARTNERSHIP)
KOUZ (89.9 FM; ALEXANDRIA, LA; Owner: FAMILY LIFE EDUCATIONAL FOUNDATION)
KEDG (106.9 FM; ALEXANDRIA, LA; Owner: FLINN BROADCASTING CORPORATION)
KLSA (90.7 FM; ALEXANDRIA, LA; Owner: BD OF SUPV OF LA ST U & A&M COLLEGE)
KAYT (88.1 FM; JENA, LA; Owner: BLACK MEDIA WORKS, INC.)
KQID-FM (93.1 FM; ALEXANDRIA, LA; Owner: CENLA B/C CO INC.)
K288ER (105.5 FM; ALEXANDRIA, LA; Owner: BIBLE BROADCASTING NETWORK, INC.)
KZMZ (96.9 FM; ALEXANDRIA, LA; Owner: CAPSTAR TX LIMITED PARTNERSHIP)
KFAD (93.9 FM; ALEXANDRIA, LA; Owner: FM BROADCASTING CORPORATION)
KKST (98.7 FM; OAKDALE, LA; Owner: CAPSTAR TX LIMITED PARTNERSHIP)
KAPM (91.7 FM; ALEXANDRIA, LA; Owner: AMERICAN FAMILY ASSOCIATION)
KLAA (103.5 FM; TIOGA, LA; Owner: CAJUN COMMUNICATIONS OF TEXAS, INC.)
KBCE (102.3 FM; BOYCE, LA; Owner: TRINITY BROADCASTING CORPORATION)
KVDP (89.1 FM; DRY PRONG, LA; Owner: DRY PRONG EDUC B/C FOUNDATION)
WQNZ (95.1 FM; NATCHEZ, MS; Owner: FIRST NATCHEZ CORPORATION)
KCJM-LP (107.9 FM; ALEXANDRIA, LA; Owner: M&M COMMUNITY DEVELOPMENT INC., ALEXANDRIA BRANCH)
TV broadcast stations around Ball:
KALB-TV (Channel 5; ALEXANDRIA, LA; Owner: MEDIA GENERAL COMMUNICATIONS, INC.)
K60GE (Channel 60; ALEXANDRIA, LA; Owner: MS COMMUNICATIONS, LLC)
K36DS (Channel 36; ALEXANDRIA, LA; Owner: POLLACK/BELZ COMMUNICATION COMPANY, INC.)
KLAX-TV (Channel 31; ALEXANDRIA, LA; Owner: POLLACK/BELZ COMMUNICATIONS CO., INC)
K16DK (Channel 16; ALEXANDRIA, LA; Owner: MS COMMUNICATIONS, LLC)
K23DZ (Channel 23; ALEXANDRIA, LA; Owner: MS COMMUNICATIONS, LLC)
K38EG (Channel 38; ALEXANDRIA, LA; Owner: MS COMMUNICATIONS, LLC)
K55GT (Channel 55; ALEXANDRIA, LA; Owner: MS COMMUNICATIONS, LLC)
K02PO (Channel 2; ALEXANDRIA, LA; Owner: TIGER EYE BROADCASTING CORPORATION)
KLPA-TV (Channel 25; ALEXANDRIA, LA; Owner: LOUISIANA EDUCATIONAL TELEVISION AUTHORITY)
K21EL (Channel 21; ALEXANDRIA, LA; Owner: MS COMMUNICATIONS, LLC)
K43EI (Channel 43; ALEXANDRIA, LA; Owner: MS COMMUNICATIONS, LLC)
K57GK (Channel 57; ALEXANDRIA, LA; Owner: MS COMMUNICATIONS, LLC)
K53FA (Channel 53; ALEXANDRIA, LA; Owner: ESTATE OF VIOLA WEBER)
K47DW (Channel 47; ALEXANDRIA, LA; Owner: WHITE KNIGHT B/CING. OF NATCHEZ LICENSE CORP.)
K64FT (Channel 64; ALEXANDRIA, LA; Owner: TRINITY BROADCASTING NETWORK)
KAQY (Channel 11; COLUMBIA, LA; Owner: MONROE BROADCASTING, INC.)
KNOE-TV (Channel 8; MONROE, LA; Owner: NOE CORP., LLC)
KLTM-TV (Channel 13; MONROE, LA; Owner: LOUISIANA EDUCATIONAL TELEVISION AUTHORITY)
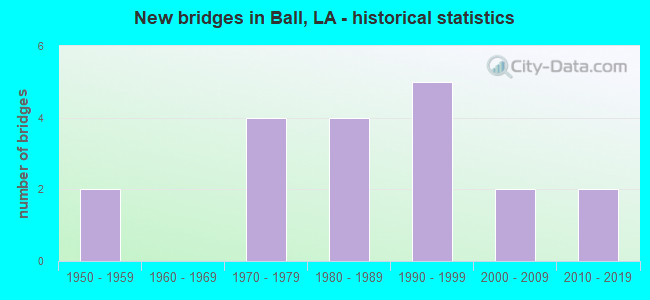
National Bridge Inventory (NBI) Statistics 25 Number of bridges243ft / 73.7m Total length $1,027,000 Total costs97,385 Total average daily traffic7,893 Total average daily truck traffic
New bridges - historical statistics
2 1950-1959 4 1970-1979 4 1980-1989 5 1990-1999 2 2000-2009 2 2010-2019
See full National Bridge Inventory statistics for Ball, LA
FCC Registered Cell Phone Towers: 2 (
See the full list of FCC Registered Cell Phone Towers in Ball )
FCC Registered Antenna Towers: 64 (
See the full list of FCC Registered Antenna Towers )
FCC Registered Private Land Mobile Towers: 2
N Of Us Hwy 165 197 (Lat: 31.447111 Lon: -92.419028), Type: Tower, Structure height: 61 m, Call Sign: WPKI727, Assigned Frequencies: 929.512 MHz, Grant Date: 03/05/1997, Expiration Date: 03/05/2007, Cancellation Date: 08/09/2001, Certifier: Steven D Jacoby, Registrant: Fiorio Communications Consulting, 10451 Twin Rivers Rd Ste 207, Columbia, MD 21044, Fax: (301) 596-1121 197 La Vergne Ln (Lat: 31.447222 Lon: -92.418889), Type: Tower, Structure height: 91 m, Overall height: 91.4 m, Call Sign: WNVG251, Assigned Frequencies: 157.740 MHz, Grant Date: 03/24/2009, Expiration Date: 02/14/2019, Cancellation Date: 04/06/2019, Registrant: L & L Communications, 1113 6th Street, Alexandria, LA 71309-0088, Phone: (318) 445-6234, Fax: (318) 445-1711, Email:
FCC Registered Broadcast Land Mobile Towers: 3
OLLA, Ball Cell Site (Lat: 31.436111 Lon: -92.425833), Type: Tower, Structure height: 94.4 m, Call Sign: KKD823, Assigned Frequencies: 151.280 MHz, Grant Date: 10/14/2015, Expiration Date: 10/02/2025, Certifier: Kenneth R Goodwin, Registrant: Lousisana Department Of Ag And Forestry, 515 Forestry Rd., Woodworth, LA 71485, Phone: (318) 487-5867, Email:
Town Hall (Lat: 31.390722 Lon: -92.409861), Call Sign: KNHQ965, Assigned Frequencies: 39.5000 MHz, Grant Date: 09/19/2023, Expiration Date: 10/12/2033, Registrant: Business Radio Licensing, 30251 Golden Lantern, Suite E #501, Laguna Niguel, CA 92677, Phone: (949) 348-8510, Fax: (949) 348-8514, Email:
Lat: 31.375000 Lon: -92.414722, Call Sign: WQXG855, Assigned Frequencies: 467.512 MHz, Grant Date: 03/01/2016, Expiration Date: 03/01/2026, Certifier: James Hayward, Registrant: Blooston, Mordkofsky, Dickens, Duffy & Prendergast, LLP, 2120 L Street, N.W., Suite 300, Washington, DC 20037, Phone: (202) 828-5519, Fax: (202) 828-5568, Email:
FCC Registered Microwave Towers: 5
BALL, 1.8 Mi Sw Of (Lat: 31.436000 Lon: -92.425944), Overall height: 94.5 m, Call Sign: WML805, Assigned Frequencies: 2162.00 MHz, Grant Date: 01/17/2001, Expiration Date: 02/01/2011, Cancellation Date: 10/01/2009, Certifier: Vicki Schultheis, Registrant: Verizon Wireless, 1120 Sanctuary Pkwy, #150 Gasa5reg, Alpharetta, GA 30009-7630, Phone: (770) 797-1070, Fax: (770) 797-1036, Email:
HWY 165 HWY 8, Hwy 165/ Hwy 8 Pollock Cell Site (Lat: 31.499556 Lon: -92.415694), Type: Gtower, Structure height: 61 m, Overall height: 69.8 m, Call Sign: WQSY748, Assigned Frequencies: 6226.89 MHz, Grant Date: 12/10/2013, Expiration Date: 12/10/2023, Cancellation Date: 09/14/2016, Certifier: Steven A Regitz, Registrant: Verizon Wireless, 1120 Sanctuary Pkwy #150 Gasa5reg, Alpharetta, GA 30009-7630, Phone: (770) 797-1070, Fax: (770) 797-1036, Email:
BEAVER CREEK, 6.5 Mi Ene Of Ball 138 Kv Substation (Lat: 31.441833 Lon: -92.344556), Overall height: 36.6 m, Call Sign: WHF43, Assigned Frequencies: 954.900 MHz, Grant Date: 10/29/2021, Expiration Date: 11/28/2031, Cancellation Date: 03/21/2024, Certifier: Mark H Segura, Registrant: Cleco Power LLC, 403 Wavell Street, Bunkie, LA 71322, Phone: (318) 346-5622, Fax: (318) 346-5650, Email:
BALL, W Of Hwy 165 On N Ferguson Loop (Lat: 31.447111 Lon: -92.419000), Overall height: 61 m, Call Sign: WLR335, Licensee ID: L00128090, Assigned Frequencies: 2168.40 MHz, Grant Date: 04/17/1991, Expiration Date: 02/01/2001, Cancellation Date: 12/22/2002, Certifier: Michael J Small, Registrant: Centennial Southeast License Company LLC Dba Centennial Communications BALL, 2 Mi Nw (Lat: 31.436000 Lon: -92.425944), Overall height: 95.4 m, Call Sign: WLU556, Assigned Frequencies: 2174.80 MHz, Grant Date: 01/17/2001, Expiration Date: 02/01/2011, Cancellation Date: 07/02/2009, Certifier: Vicki Schultheis, Registrant: Verizon Wireless, 1120 Sanctuary Pkwy, #150 Gasa5reg, Alpharetta, GA 30009-7630, Phone: (770) 797-1070, Fax: (770) 797-1036, Email:
FCC Registered Amateur Radio Licenses: 16 (
See the full list of FCC Registered Amateur Radio Licenses in Ball )
FAA Registered Aircraft: 7
Aircraft: BEECH C24R (Category: Land, Seats: 6, Weight: Up to 12,499 Pounds, Speed: 178 mph), Engine: LYCOMING I0360 SER A&C (200 HP) (Reciprocating)N-Number: 1824X, N1824X, N-1824X, Serial Number: MC-760, Year manufactured: 1981, Airworthiness Date: 08/05/1981, Certificate Issue Date: 02/04/2020Registrant (LLC): Kepo Aviation LLC, 6920 Monroe Hwy, Ball, LA 71405Aircraft: MOONEY M20J (Category: Land, Seats: 4, Weight: Up to 12,499 Pounds, Speed: 126 mph), Engine: LYCOMING I0360 SER (180 HP) (Reciprocating)N-Number: 201MF, N201MF, N-201MF, Serial Number: 24-0096, Year manufactured: 1977, Airworthiness Date: 02/17/1977, Certificate Issue Date: 12/18/2017Registrant (LLC): Jay Mcdonald LLC, 86 Baum Rd, Ball, LA 71405Aircraft: GRIGSBY B-8M (Category: Land, Weight: Up to 12,499 Pounds, Speed: 45 mph), Engine: MCCULLOCH 4318A&E/0-100 (72 HP) (Reciprocating)N-Number: 31234, N31234, N-31234, Serial Number: 101, Year manufactured: 1979, Airworthiness Date: 08/12/1980, Certificate Issue Date: 07/18/2007Registrant (Individual): William F Wieger, 112 Gayven Dr, Ball, LA 71405Aircraft: PIPER J3C-65 (Category: Land, Seats: 2, Weight: Up to 12,499 Pounds, Speed: 67 mph), Engine: CONT MOTOR A&C65 SERIES (65 HP) (Reciprocating)N-Number: 42999, N42999, N-42999, Serial Number: 15358, Airworthiness Date: 02/26/1970, Certificate Issue Date: 01/03/2020Registrant (LLC): Tweety Bird LLC, Po Box 12, Ball, LA 71405Deregistered: Cancel Date: 11/29/2019Aircraft: CESSNA 150L (Category: Land, Seats: 2, Weight: Up to 12,499 Pounds, Speed: 90 mph), Engine: CONT MOTOR 0-200 SERIES (100 HP) (Reciprocating)N-Number: 6616G, N6616G, N-6616G, Serial Number: 15072116, Airworthiness Date: 08/27/1970, Certificate Issue Date: 05/09/2019Registrant (Corporation): Kepo Aviation LLC, 6920 Monroe Hwy, Ball, LA 71405Deregistered: Cancel Date: 04/30/2013Aircraft: QUICKSILVER GT-400 (Category: Land, Weight: Up to 12,499 Pounds), Engine: ROTAX 503 DCDI (52 HP) (2 Cycle)N-Number: 8019G, N8019G, N-8019G, Serial Number: GT2801072, Year manufactured: 2004, Airworthiness Date: 07/02/2007, Certificate Issue Date: 08/30/2013Registrant (Individual): Frank K Poteet, 6920 Monroe Hwy, Ball, LA 71405Aircraft: MOONEY M20E (Category: Land, Seats: 4, Weight: Up to 12,499 Pounds, Speed: 127 mph), Engine: LYCOMING I0360 SER (180 HP) (Reciprocating)N-Number: 9322M, N9322M, N-9322M, Serial Number: 1254, Airworthiness Date: 08/09/1966, Certificate Issue Date: 02/24/2020Registrant (LLC): Jay Mcdonald LLC, 86 Baum Rd, Ball, LA 71405Deregistered: Cancel Date: 10/05/2019
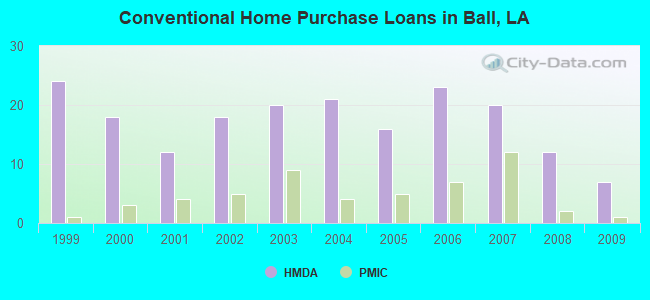
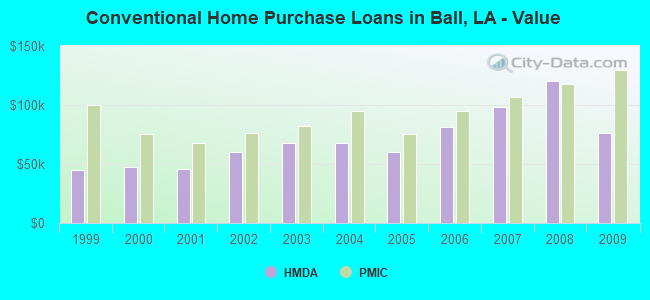
Home Mortgage Disclosure Act Aggregated Statistics For Year 2009(Based on 2 partial tracts) A) FHA, FSA/RHS & VA B) Conventional C) Refinancings D) Home Improvement Loans E) Loans on Dwellings For 5+ Families F) Non-occupant Loans on G) Loans On Manufactured Number Average Value Number Average Value Number Average Value Number Average Value Number Average Value Number Average Value Number Average Value
LOANS ORIGINATED 8 $120,058 7 $76,606 26 $95,408 6 $31,363 1 $493,340 7 $55,656 7 $40,249 APPLICATIONS APPROVED, NOT ACCEPTED 1 $96,110 1 $33,150 3 $76,837 1 $7,940 0 $0 1 $12,130 1 $28,100 APPLICATIONS DENIED 3 $97,207 4 $73,140 12 $101,997 3 $21,143 0 $0 1 $44,740 2 $31,740 APPLICATIONS WITHDRAWN 2 $110,955 1 $86,090 7 $84,683 0 $0 0 $0 0 $0 0 $0 FILES CLOSED FOR INCOMPLETENESS 0 $0 0 $0 2 $129,885 1 $22,910 0 $0 0 $0 0 $0
Aggregated Statistics For Year 2008(Based on 2 partial tracts) A) FHA, FSA/RHS & VA B) Conventional C) Refinancings D) Home Improvement Loans F) Non-occupant Loans on G) Loans On Manufactured Number Average Value Number Average Value Number Average Value Number Average Value Number Average Value Number Average Value
LOANS ORIGINATED 14 $122,095 12 $120,143 24 $92,248 7 $30,523 6 $94,097 5 $56,286 APPLICATIONS APPROVED, NOT ACCEPTED 1 $75,800 2 $95,075 2 $76,645 1 $85,140 0 $0 2 $38,135 APPLICATIONS DENIED 2 $141,820 9 $56,590 14 $109,876 6 $32,128 0 $0 6 $42,967 APPLICATIONS WITHDRAWN 0 $0 1 $89,950 4 $165,788 0 $0 0 $0 0 $0 FILES CLOSED FOR INCOMPLETENESS 0 $0 1 $39,250 3 $74,237 0 $0 0 $0 0 $0
Aggregated Statistics For Year 2007(Based on 2 partial tracts) A) FHA, FSA/RHS & VA B) Conventional C) Refinancings D) Home Improvement Loans E) Loans on Dwellings For 5+ Families F) Non-occupant Loans on G) Loans On Manufactured Number Average Value Number Average Value Number Average Value Number Average Value Number Average Value Number Average Value Number Average Value
LOANS ORIGINATED 7 $108,923 20 $98,044 22 $98,536 7 $48,766 1 $60,310 7 $77,521 5 $43,794 APPLICATIONS APPROVED, NOT ACCEPTED 1 $81,250 2 $58,525 5 $96,956 1 $23,260 0 $0 0 $0 1 $59,850 APPLICATIONS DENIED 1 $200,860 8 $67,936 16 $72,938 4 $37,898 0 $0 1 $66,240 5 $62,284 APPLICATIONS WITHDRAWN 1 $146,420 2 $57,540 5 $82,178 1 $76,680 0 $0 0 $0 1 $55,590 FILES CLOSED FOR INCOMPLETENESS 0 $0 0 $0 2 $85,910 1 $61,990 0 $0 0 $0 0 $0
Aggregated Statistics For Year 2006(Based on 2 partial tracts) A) FHA, FSA/RHS & VA B) Conventional C) Refinancings D) Home Improvement Loans E) Loans on Dwellings For 5+ Families F) Non-occupant Loans on G) Loans On Manufactured Number Average Value Number Average Value Number Average Value Number Average Value Number Average Value Number Average Value Number Average Value
LOANS ORIGINATED 6 $97,493 23 $81,710 20 $83,735 7 $30,001 1 $249,980 8 $61,849 5 $31,076 APPLICATIONS APPROVED, NOT ACCEPTED 0 $0 5 $49,814 4 $59,355 2 $16,590 0 $0 0 $0 3 $36,747 APPLICATIONS DENIED 2 $63,360 7 $48,801 15 $72,041 7 $38,750 0 $0 1 $54,610 7 $37,577 APPLICATIONS WITHDRAWN 0 $0 2 $111,565 5 $75,362 1 $81,720 0 $0 0 $0 0 $0 FILES CLOSED FOR INCOMPLETENESS 1 $72,860 1 $59,400 4 $96,232 0 $0 0 $0 0 $0 0 $0
Aggregated Statistics For Year 2005(Based on 2 partial tracts) A) FHA, FSA/RHS & VA B) Conventional C) Refinancings D) Home Improvement Loans F) Non-occupant Loans on G) Loans On Manufactured Number Average Value Number Average Value Number Average Value Number Average Value Number Average Value Number Average Value
LOANS ORIGINATED 3 $90,880 16 $60,509 26 $68,997 9 $29,683 7 $57,423 6 $35,195 APPLICATIONS APPROVED, NOT ACCEPTED 0 $0 4 $59,348 5 $56,544 2 $38,850 1 $27,020 2 $57,635 APPLICATIONS DENIED 2 $71,525 8 $53,830 19 $79,247 6 $37,510 2 $25,775 7 $35,037 APPLICATIONS WITHDRAWN 0 $0 1 $78,460 10 $98,772 1 $63,430 0 $0 0 $0 FILES CLOSED FOR INCOMPLETENESS 0 $0 2 $48,515 3 $97,377 0 $0 0 $0 1 $27,620
Aggregated Statistics For Year 2004(Based on 2 partial tracts) A) FHA, FSA/RHS & VA B) Conventional C) Refinancings D) Home Improvement Loans F) Non-occupant Loans on G) Loans On Manufactured Number Average Value Number Average Value Number Average Value Number Average Value Number Average Value Number Average Value
LOANS ORIGINATED 5 $92,032 21 $67,937 35 $74,590 6 $33,533 6 $78,912 9 $60,454 APPLICATIONS APPROVED, NOT ACCEPTED 1 $94,600 4 $51,685 10 $69,316 1 $42,170 0 $0 3 $35,493 APPLICATIONS DENIED 1 $91,160 11 $42,415 24 $67,942 5 $39,658 1 $67,270 6 $38,675 APPLICATIONS WITHDRAWN 0 $0 2 $87,410 7 $102,086 1 $13,000 0 $0 0 $0 FILES CLOSED FOR INCOMPLETENESS 0 $0 1 $97,620 2 $74,535 2 $37,225 1 $45,760 0 $0
Aggregated Statistics For Year 2003(Based on 2 partial tracts) A) FHA, FSA/RHS & VA B) Conventional C) Refinancings D) Home Improvement Loans F) Non-occupant Loans on Number Average Value Number Average Value Number Average Value Number Average Value Number Average Value
LOANS ORIGINATED 6 $77,338 20 $67,958 48 $64,788 7 $15,960 8 $55,138 APPLICATIONS APPROVED, NOT ACCEPTED 0 $0 1 $54,640 14 $64,462 3 $17,163 1 $34,700 APPLICATIONS DENIED 0 $0 10 $35,377 23 $62,603 4 $28,195 1 $36,720 APPLICATIONS WITHDRAWN 1 $67,380 1 $63,000 9 $77,677 0 $0 0 $0 FILES CLOSED FOR INCOMPLETENESS 0 $0 0 $0 2 $120,400 0 $0 0 $0
Aggregated Statistics For Year 2002(Based on 2 partial tracts) A) FHA, FSA/RHS & VA B) Conventional C) Refinancings D) Home Improvement Loans F) Non-occupant Loans on Number Average Value Number Average Value Number Average Value Number Average Value Number Average Value
LOANS ORIGINATED 7 $68,404 18 $59,914 32 $64,642 11 $26,993 6 $57,203 APPLICATIONS APPROVED, NOT ACCEPTED 0 $0 5 $47,188 8 $64,151 1 $22,570 1 $41,970 APPLICATIONS DENIED 2 $63,835 9 $43,190 16 $53,976 7 $9,886 1 $43,400 APPLICATIONS WITHDRAWN 0 $0 3 $35,683 6 $53,013 0 $0 0 $0 FILES CLOSED FOR INCOMPLETENESS 0 $0 1 $42,050 3 $74,173 0 $0 0 $0
Aggregated Statistics For Year 2001(Based on 2 partial tracts) A) FHA, FSA/RHS & VA B) Conventional C) Refinancings D) Home Improvement Loans F) Non-occupant Loans on Number Average Value Number Average Value Number Average Value Number Average Value Number Average Value
LOANS ORIGINATED 6 $67,730 12 $45,592 39 $59,174 7 $21,264 4 $40,095 APPLICATIONS APPROVED, NOT ACCEPTED 0 $0 5 $46,710 7 $45,217 2 $18,865 1 $32,010 APPLICATIONS DENIED 0 $0 12 $37,730 23 $54,121 7 $22,157 0 $0 APPLICATIONS WITHDRAWN 1 $40,290 2 $20,540 9 $58,368 1 $30,500 0 $0 FILES CLOSED FOR INCOMPLETENESS 0 $0 0 $0 2 $43,020 0 $0 0 $0
Aggregated Statistics For Year 2000(Based on 2 partial tracts) A) FHA, FSA/RHS & VA B) Conventional C) Refinancings D) Home Improvement Loans F) Non-occupant Loans on Number Average Value Number Average Value Number Average Value Number Average Value Number Average Value
LOANS ORIGINATED 10 $70,711 18 $47,107 20 $52,340 9 $18,472 3 $45,403 APPLICATIONS APPROVED, NOT ACCEPTED 2 $62,235 5 $34,028 7 $41,940 3 $22,230 1 $26,620 APPLICATIONS DENIED 1 $71,370 14 $34,402 20 $49,803 3 $17,967 2 $28,390 APPLICATIONS WITHDRAWN 0 $0 1 $24,270 9 $51,141 1 $14,640 0 $0 FILES CLOSED FOR INCOMPLETENESS 0 $0 0 $0 1 $28,840 0 $0 0 $0
Aggregated Statistics For Year 1999(Based on 2 partial tracts) A) FHA, FSA/RHS & VA B) Conventional C) Refinancings D) Home Improvement Loans F) Non-occupant Loans on Number Average Value Number Average Value Number Average Value Number Average Value Number Average Value
LOANS ORIGINATED 5 $67,120 24 $45,137 38 $57,284 7 $16,117 3 $45,437 APPLICATIONS APPROVED, NOT ACCEPTED 0 $0 4 $44,648 11 $43,497 2 $14,960 0 $0 APPLICATIONS DENIED 1 $63,530 17 $38,318 18 $49,262 8 $11,378 0 $0 APPLICATIONS WITHDRAWN 1 $29,660 3 $48,240 6 $65,445 0 $0 0 $0 FILES CLOSED FOR INCOMPLETENESS 0 $0 0 $0 2 $68,965 0 $0 0 $0
Detailed HMDA statistics for the following Tracts:
0102.00
, 0103.00
Private Mortgage Insurance Companies Aggregated Statistics For Year 2009(Based on 2 partial tracts) A) Conventional Number Average Value
LOANS ORIGINATED 1 $129,240 APPLICATIONS APPROVED, NOT ACCEPTED 0 $0 APPLICATIONS DENIED 0 $0 APPLICATIONS WITHDRAWN 0 $0 FILES CLOSED FOR INCOMPLETENESS 0 $0
Aggregated Statistics For Year 2008(Based on 2 partial tracts) A) Conventional B) Refinancings Number Average Value Number Average Value
LOANS ORIGINATED 2 $117,705 2 $141,325 APPLICATIONS APPROVED, NOT ACCEPTED 0 $0 1 $156,650 APPLICATIONS DENIED 0 $0 0 $0 APPLICATIONS WITHDRAWN 0 $0 0 $0 FILES CLOSED FOR INCOMPLETENESS 0 $0 0 $0
Aggregated Statistics For Year 2007(Based on 2 partial tracts) A) Conventional B) Refinancings Number Average Value Number Average Value
LOANS ORIGINATED 12 $106,393 4 $128,035 APPLICATIONS APPROVED, NOT ACCEPTED 2 $109,885 0 $0 APPLICATIONS DENIED 0 $0 0 $0 APPLICATIONS WITHDRAWN 0 $0 0 $0 FILES CLOSED FOR INCOMPLETENESS 0 $0 0 $0
Aggregated Statistics For Year 2006(Based on 2 partial tracts) A) Conventional B) Refinancings Number Average Value Number Average Value
LOANS ORIGINATED 7 $94,646 2 $121,975 APPLICATIONS APPROVED, NOT ACCEPTED 0 $0 0 $0 APPLICATIONS DENIED 0 $0 0 $0 APPLICATIONS WITHDRAWN 0 $0 0 $0 FILES CLOSED FOR INCOMPLETENESS 0 $0 0 $0
Aggregated Statistics For Year 2005(Based on 2 partial tracts) A) Conventional B) Refinancings Number Average Value Number Average Value
LOANS ORIGINATED 5 $75,616 1 $79,710 APPLICATIONS APPROVED, NOT ACCEPTED 1 $57,610 1 $84,560 APPLICATIONS DENIED 0 $0 0 $0 APPLICATIONS WITHDRAWN 0 $0 0 $0 FILES CLOSED FOR INCOMPLETENESS 0 $0 0 $0
Aggregated Statistics For Year 2004(Based on 2 partial tracts) A) Conventional B) Refinancings Number Average Value Number Average Value
LOANS ORIGINATED 4 $95,300 3 $71,920 APPLICATIONS APPROVED, NOT ACCEPTED 2 $80,290 1 $120,710 APPLICATIONS DENIED 0 $0 0 $0 APPLICATIONS WITHDRAWN 0 $0 0 $0 FILES CLOSED FOR INCOMPLETENESS 0 $0 0 $0
Aggregated Statistics For Year 2003(Based on 2 partial tracts) A) Conventional B) Refinancings C) Non-occupant Loans on Number Average Value Number Average Value Number Average Value
LOANS ORIGINATED 9 $81,969 5 $86,282 1 $69,060 APPLICATIONS APPROVED, NOT ACCEPTED 1 $54,160 1 $128,410 0 $0 APPLICATIONS DENIED 0 $0 0 $0 0 $0 APPLICATIONS WITHDRAWN 0 $0 0 $0 0 $0 FILES CLOSED FOR INCOMPLETENESS 0 $0 0 $0 0 $0
Aggregated Statistics For Year 2002(Based on 2 partial tracts) A) Conventional B) Refinancings Number Average Value Number Average Value
LOANS ORIGINATED 5 $76,040 5 $83,658 APPLICATIONS APPROVED, NOT ACCEPTED 1 $59,290 0 $0 APPLICATIONS DENIED 0 $0 0 $0 APPLICATIONS WITHDRAWN 0 $0 0 $0 FILES CLOSED FOR INCOMPLETENESS 0 $0 0 $0
Aggregated Statistics For Year 2001(Based on 2 partial tracts) A) Conventional B) Refinancings C) Non-occupant Loans on Number Average Value Number Average Value Number Average Value
LOANS ORIGINATED 4 $67,528 4 $55,912 1 $38,280 APPLICATIONS APPROVED, NOT ACCEPTED 0 $0 1 $65,390 0 $0 APPLICATIONS DENIED 0 $0 0 $0 0 $0 APPLICATIONS WITHDRAWN 0 $0 0 $0 0 $0 FILES CLOSED FOR INCOMPLETENESS 0 $0 0 $0 0 $0
Aggregated Statistics For Year 2000(Based on 2 partial tracts) A) Conventional B) Refinancings Number Average Value Number Average Value
LOANS ORIGINATED 3 $75,813 1 $87,570 APPLICATIONS APPROVED, NOT ACCEPTED 0 $0 0 $0 APPLICATIONS DENIED 0 $0 0 $0 APPLICATIONS WITHDRAWN 0 $0 0 $0 FILES CLOSED FOR INCOMPLETENESS 0 $0 0 $0
Aggregated Statistics For Year 1999(Based on 2 partial tracts) A) Conventional B) Refinancings Number Average Value Number Average Value
LOANS ORIGINATED 1 $100,390 2 $66,585 APPLICATIONS APPROVED, NOT ACCEPTED 0 $0 0 $0 APPLICATIONS DENIED 0 $0 0 $0 APPLICATIONS WITHDRAWN 0 $0 0 $0 FILES CLOSED FOR INCOMPLETENESS 0 $0 0 $0
Detailed PMIC statistics for the following Tracts:
0102.00
, 0103.00 Ball compared to Louisiana state average:
Unemployed percentage significantly below state average. Black race population percentage significantly below state average. Hispanic race population percentage below state average. Foreign-born population percentage significantly below state average.
Top Patent Applicants
Total of 1 patent application in 2008-2024.


 Recent articles from our blog. Our writers, many of them Ph.D. graduates or candidates, create easy-to-read articles on a wide variety of topics.

 (78.4 miles
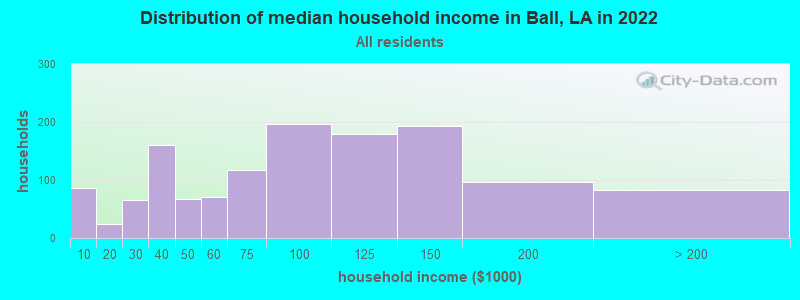


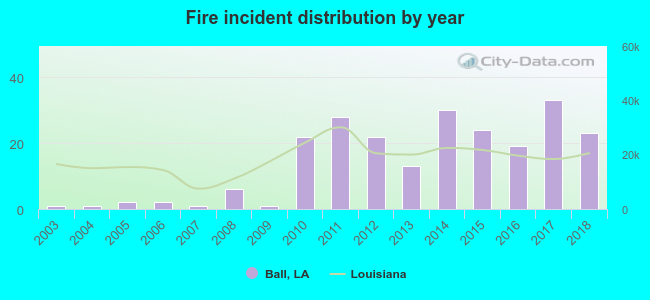 According to the data from the years 2003 - 2018 the average number of fires per year is 14. The highest number of fires - 33 took place in 2017, and the least - 1 in 2003. The data has a growing trend.
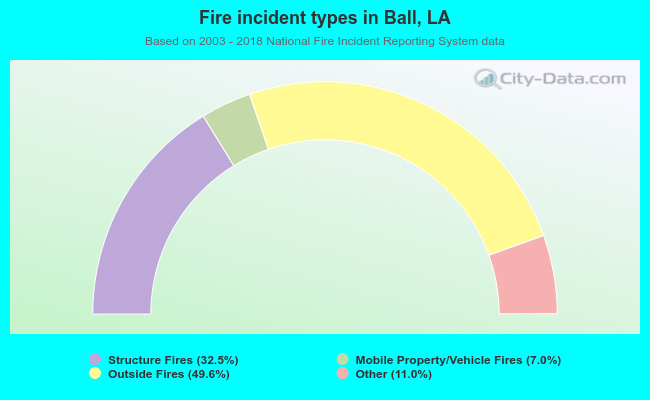 When looking into fire subcategories, the most incidents belonged to: Outside Fires (49.6%), and Structure Fires (32.5%).