Bainbridge Island, Washington
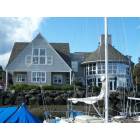
Bainbridge Island: Waterfront Business & Restaurant on Parfitt Way
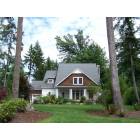
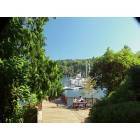
Bainbridge Island: A Bainbridge Home
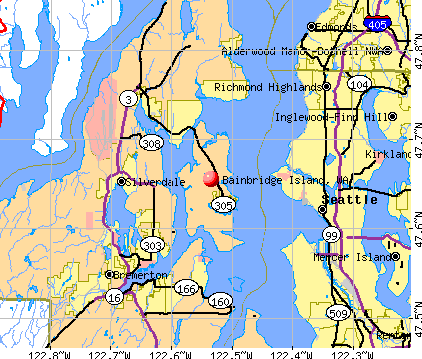
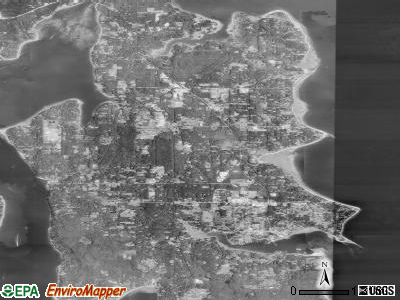
Bainbridge Island: Bainbridge Island
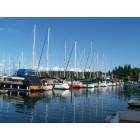
Bainbridge Island: Winslow Wharf Marina
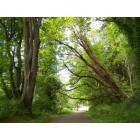
Bainbridge Island: "Walking Path" in Fort Ward State Park
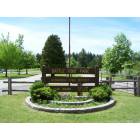
Bainbridge Island: Entrance to Battle Point Park

Bainbridge Island: Sunrise over Mt Rainier, seen from Bainbridge Island
Bainbridge Island: Entrance to Harbour Marina
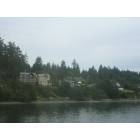
Bainbridge Island: Bainbridge Island, WA coastline taken from the ferry - July 2006
Bainbridge Island: from the ferry
Bainbridge Island: Across the Harbor
- see
45
more - add
your
Submit your own pictures of this city and show them to the world
- OSM Map
- General Map
- Google Map
- MSN Map
Population change since 2000: +20.6%
 |
| Males: 12,171 | |
| Females: 12,323 |
| Median resident age: | 50.5 years |
| Washington median age: | 38.4 years |
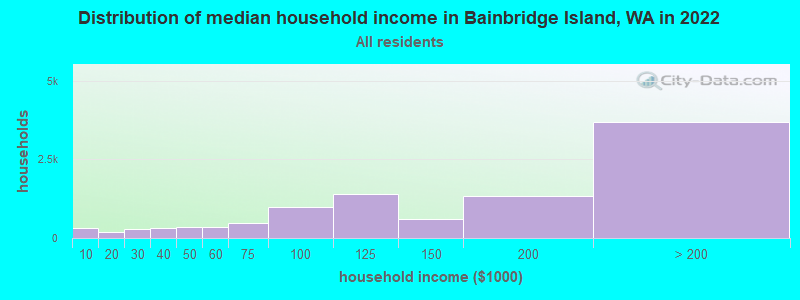
| Bainbridge Island: | $153,067 |
| WA: | $91,306 |
Estimated per capita income in 2022: $88,903 (it was $37,482 in 2000)
Bainbridge Island city income, earnings, and wages data
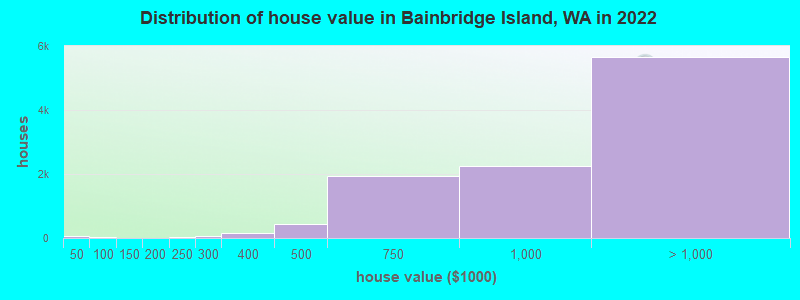
Estimated median house or condo value in 2022: over $1,000,000 (it was $322,400 in 2000)
| Bainbridge Island: | over $1,000,000 |
| WA: | $569,500 |
Mean prices in 2022: all housing units: $649,234; detached houses: $689,246; townhouses or other attached units: $490,921; in 2-unit structures: $615,215; in 3-to-4-unit structures: $532,551; in 5-or-more-unit structures: $413,149; mobile homes: $252,413; occupied boats, rvs, vans, etc.: $80,405
Median gross rent in 2022: $2,043.
Bainbridge Island, WA residents, houses, and apartments details
(2.6% for White Non-Hispanic residents, 27.6% for Black residents, 2.9% for Hispanic or Latino residents, 20.4% for other race residents, 3.9% for two or more races residents)
Detailed information about poverty and poor residents in Bainbridge Island, WA


Compare current foreclosures near Bainbridge Island, WA:
| Photo | Address | Area | Beds / Baths | Price | Details |
|---|---|---|---|---|---|

|
#1
NE Murden Cove Dr
Bainbridge Island, WA 98110
|
2,663 sq. feet
|
2 baths 4 beds |
show details | |

|
#2
Harbor Sq Loop NE Unit A106
Bainbridge Island, WA 98110
|
1,498 sq. feet
|
2 baths 2 beds |
show details | |

|
#3
Forest Ln NE
Bainbridge Island, WA 98110
|
2,336 sq. feet
|
3 baths 3 beds |
show details | |

|
#4
Agatewood Rd NE
Bainbridge Island, WA 98110
|
3,662 sq. feet
|
3 baths 3 beds |
show details | |

|
#5
High School Rd Ne, # D3176
Bainbridge Island, WA 98110
|
- sq. feet
|
- baths - beds |
show details | |

|
#6
NE Bergman Rd
Bainbridge Island, WA 98110
|
- sq. feet
|
- baths - beds |
show details | |

|
#7
Hanami Ln Ne, Apt 412
Bainbridge Island, WA 98110
|
- sq. feet
|
- baths - beds |
show details | |

|
#8
High School Rd NW Apt 19
Bainbridge Island, WA 98110
|
- sq. feet
|
- baths - beds |
show details | |

|
#9
14th Ct NE
Seattle, WA 98155
|
1,420 sq. feet
|
2 baths 2 beds |
show details | |

|
#10
1st Ave S # 806
Seattle, WA 98104
|
806 sq. feet
|
1 baths 1 beds |
show details |
| Photo | Address | Area | Beds / Baths | Price | Details |
|---|---|---|---|---|---|

|
#11
Bloomington Ave
Bremerton, WA 98312
|
1,656 sq. feet
|
1 baths 4 beds |
show details | |

|
#12
SW 119th St
Seattle, WA 98146
|
2,540 sq. feet
|
2 baths 4 beds |
show details | |

|
#13
Sirocco Cir NW
Silverdale, WA 98383
|
1,842 sq. feet
|
2 baths 3 beds |
show details | |

|
#14
Morgan Rd NW
Bremerton, WA 98312
|
976 sq. feet
|
1 baths 2 beds |
show details | |

|
#15
13th Ave NW
Seattle, WA 98117
|
1,490 sq. feet
|
2 baths 3 beds |
show details | |

|
#16
Burwell St
Bremerton, WA 98337
|
1,770 sq. feet
|
1 baths 3 beds |
show details | |

|
#17
19th Ave S
Seattle, WA 98168
|
2,420 sq. feet
|
2 baths 2 beds |
show details | |

|
#18
NE 142nd Pl
Kirkland, WA 98034
|
1,830 sq. feet
|
2 baths 3 beds |
show details | |

|
#19
S Sullivan St
Seattle, WA 98118
|
1,710 sq. feet
|
2 baths 3 beds |
show details | |

|
#20
91st Ave W
Edmonds, WA 98026
|
1,504 sq. feet
|
1 baths 3 beds |
show details |
| Photo | Address | Area | Beds / Baths | Price | Details |
|---|---|---|---|---|---|

|
#21
67th Pl W
Mountlake Terrace, WA 98043
|
2,194 sq. feet
|
2 baths 5 beds |
show details | |

|
#22
9th St
Bremerton, WA 98337
|
776 sq. feet
|
1 baths 2 beds |
show details | |

|
#23
NW 59th St
Seattle, WA 98107
|
1,110 sq. feet
|
1 baths 3 beds |
show details | |

|
#24
5th St
Bremerton, WA 98337
|
950 sq. feet
|
1 baths 2 beds |
show details | |

|
#25
Howard Ave NE
Kingston, WA 98346
|
1,008 sq. feet
|
1 baths 2 beds |
show details | |

|
#26
16th Ave S
Seattle, WA 98168
|
1,800 sq. feet
|
1 baths 4 beds |
show details | |

|
#27
3rd Ave S
Seattle, WA 98168
|
870 sq. feet
|
1 baths 2 beds |
show details | |

|
#28
Cynthia Ln SW
Port Orchard, WA 98367
|
2,870 sq. feet
|
2 baths 4 beds |
show details | |

|
#29
SW 148th St
Seattle, WA 98166
|
1,030 sq. feet
|
1 baths 3 beds |
show details | |

|
#30
NW Holmberg St
Bremerton, WA 98311
|
1,460 sq. feet
|
1 baths 3 beds |
show details |
| Photo | Address | Area | Beds / Baths | Price | Details |
|---|---|---|---|---|---|

|
#31
Bear Paw Ct NW
Silverdale, WA 98383
|
2,131 sq. feet
|
3 baths 4 beds |
show details | |

|
#32
41st Ave SW
Seattle, WA 98116
|
1,420 sq. feet
|
1 baths 2 beds |
show details | |

|
#33
1st Ave NE
Seattle, WA 98115
|
1,110 sq. feet
|
1 baths 4 beds |
show details | |

|
#34
Carr Blvd
Bremerton, WA 98312
|
1,270 sq. feet
|
1 baths 3 beds |
show details | |

|
#35
E Lynn St # 98102
Seattle, WA 98102
|
792 sq. feet
|
1 baths - beds |
show details | |

|
#36
Puget Blvd SW
Seattle, WA 98106
|
1,820 sq. feet
|
1 baths 3 beds |
show details | |

|
#37
N 161st Pl Unit A308 Aka 700 N 160th St Unit A308
Seattle, WA 98133
|
- sq. feet
|
1 baths 1 beds |
show details | |

|
#38
Anderson Hill Rd SW
Port Orchard, WA 98367
|
1,454 sq. feet
|
1 baths 4 beds |
show details | |

|
#39
1st Ave W
Bremerton, WA 98312
|
1,782 sq. feet
|
2 baths 3 beds |
show details | |

|
#40
NE 88th St
Seattle, WA 98115
|
2,200 sq. feet
|
2 baths 3 beds |
show details |
| Photo | Address | Area | Beds / Baths | Price | Details |
|---|---|---|---|---|---|

|
#41
Ravenna Ave NE
Seattle, WA 98125
|
1,660 sq. feet
|
2 baths 4 beds |
show details | |

|
#42
2nd Ave NW
Seattle, WA 98177
|
1,660 sq. feet
|
2 baths 3 beds |
show details | |

|
#43
William Heights Ln SW
Port Orchard, WA 98367
|
1,680 sq. feet
|
2 baths 3 beds |
show details | |

|
#44
58th Ln NE
Kenmore, WA 98028
|
2,700 sq. feet
|
2 baths 3 beds |
show details | |

|
#45
SW 100th St
Seattle, WA 98146
|
2,130 sq. feet
|
1 baths 5 beds |
show details | |

|
#46
16th Ave SW
Seattle, WA 98106
|
970 sq. feet
|
1 baths 3 beds |
show details | |

|
#47
51st Ave NE
Seattle, WA 98115
|
2,450 sq. feet
|
2 baths 4 beds |
show details | |

|
#48
5th Ave NE
Seattle, WA 98155
|
1,460 sq. feet
|
1 baths 3 beds |
show details | |

|
#49
SW 109th St
Seattle, WA 98146
|
2,410 sq. feet
|
1 baths 4 beds |
show details | |

|
Check over 1 million property listings on Foreclosure.com!
|
browse all offers | |||


- 21,04384.6%White alone
- 1,4685.9%Two or more races
- 9513.8%Asian alone
- 8933.6%Hispanic
- 3721.5%Other race alone
- 550.2%Black alone
- 390.2%American Indian alone
- 20.01%Native Hawaiian and Other
Pacific Islander alone
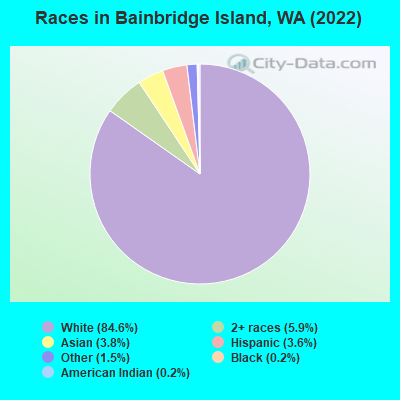
Races in Bainbridge Island detailed stats: ancestries, foreign born residents, place of birth
According to our research of Washington and other state lists, there were 2 registered sex offenders living in Bainbridge Island, Washington as of May 16, 2024.
The ratio of all residents to sex offenders in Bainbridge Island is 12,123 to 1.
The ratio of registered sex offenders to all residents in this city is much lower than the state average.
Type |
2009 |
2010 |
2011 |
2012 |
2013 |
2014 |
2015 |
2016 |
2017 |
2018 |
2019 |
2020 |
2021 |
2022 |
|---|---|---|---|---|---|---|---|---|---|---|---|---|---|---|
| Murders (per 100,000) | 0 (0.0) | 0 (0.0) | 0 (0.0) | 0 (0.0) | 0 (0.0) | 0 (0.0) | 0 (0.0) | 0 (0.0) | 0 (0.0) | 1 (4.0) | 0 (0.0) | 0 (0.0) | 0 (0.0) | 0 (0.0) |
| Rapes (per 100,000) | 4 (18.1) | 1 (4.3) | 3 (12.8) | 5 (21.3) | 3 (12.9) | 3 (12.9) | 1 (4.3) | 9 (37.5) | 10 (40.6) | 14 (56.6) | 3 (12.0) | 4 (15.6) | 7 (27.3) | 12 (49.3) |
| Robberies (per 100,000) | 4 (18.1) | N/A | 2 (8.6) | 0 (0.0) | 0 (0.0) | 2 (8.6) | 1 (4.3) | 1 (4.2) | 1 (4.1) | 2 (8.1) | 0 (0.0) | 1 (3.9) | 3 (11.7) | 0 (0.0) |
| Assaults (per 100,000) | 23 (104.3) | 26 (112.9) | 9 (38.5) | 8 (34.1) | 9 (38.6) | 5 (21.5) | 8 (34.3) | 17 (70.8) | 7 (28.4) | 12 (48.5) | 7 (27.9) | 11 (43.0) | 5 (19.5) | 11 (45.2) |
| Burglaries (per 100,000) | 80 (362.6) | 64 (278.0) | 104 (444.7) | 56 (238.4) | 50 (214.4) | 77 (331.5) | 57 (244.1) | 65 (270.9) | 48 (194.8) | 48 (194.0) | 42 (167.5) | 30 (117.4) | 56 (218.7) | 55 (226.0) |
| Thefts (per 100,000) | 210 (951.9) | 222 (964.2) | 218 (932.2) | 233 (991.9) | 277 (1,188) | 250 (1,076) | 256 (1,096) | 245 (1,021) | 210 (852.4) | 192 (776.1) | 179 (713.7) | 202 (790.3) | 152 (593.7) | 256 (1,052) |
| Auto thefts (per 100,000) | 12 (54.4) | 6 (26.1) | 1 (4.3) | 9 (38.3) | 12 (51.4) | 11 (47.4) | 6 (25.7) | 13 (54.2) | 7 (28.4) | 6 (24.3) | 5 (19.9) | 12 (46.9) | 11 (43.0) | 29 (119.2) |
| Arson (per 100,000) | 2 (9.1) | 3 (13.0) | 3 (12.8) | 2 (8.5) | 0 (0.0) | 1 (4.3) | 3 (12.8) | 1 (4.2) | 2 (8.1) | 2 (8.1) | 0 (0.0) | 0 (0.0) | 0 (0.0) | 1 (4.1) |
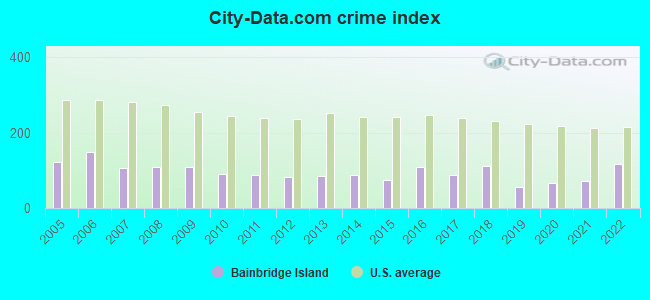
| City-Data.com crime index | 108.6 | 91.4 | 89.3 | 83.3 | 84.6 | 87.3 | 74.6 | 109.6 | 89.4 | 112.0 | 57.0 | 65.9 | 71.8 | 115.9 |
The City-Data.com crime index weighs serious crimes and violent crimes more heavily. Higher means more crime, U.S. average is 246.1. It adjusts for the number of visitors and daily workers commuting into cities.
Crime rate in Bainbridge Island detailed stats: murders, rapes, robberies, assaults, burglaries, thefts, arson
Full-time law enforcement employees in 2021, including police officers: 25 (21 officers - 20 male; 1 female).
| Officers per 1,000 residents here: | 0.82 |
| Washington average: | 1.35 |
 Recent articles from our blog. Our writers, many of them Ph.D. graduates or candidates, create easy-to-read articles on a wide variety of topics.

 | Potential Move to Camas (53 replies) |
| Vancouver vs. Portland - Pros and Cons? (40 replies) |
| Sewage Plant on the Island Next to Camas? (28 replies) |
| 2020 National Merit Semifinalists from Clark County schools (1 reply) |
| Ferry proposed to connect Vancouver to downtown Portland (13 replies) |
| Travel Time from Bainbridge Island to Gig Harbor??? (3 replies) |
Latest news from Bainbridge Island, WA collected exclusively by city-data.com from local newspapers, TV, and radio stations
Ancestries: English (12.9%), European (10.8%), Irish (10.5%), German (10.5%), American (6.3%), Italian (2.9%).
Current Local Time: PST time zone
Incorporated in 1947
Land area: 27.6 square miles.
Population density: 887 people per square mile (low).
1,884 residents are foreign born (2.5% Asia, 2.2% Europe, 1.1% North America, 0.9% Latin America).
| This city: | 7.6% |
| Washington: | 14.9% |
Median real estate property taxes paid for housing units with mortgages in 2022: $7,749 (0.7%)
Median real estate property taxes paid for housing units with no mortgage in 2022: $7,892 (0.7%)
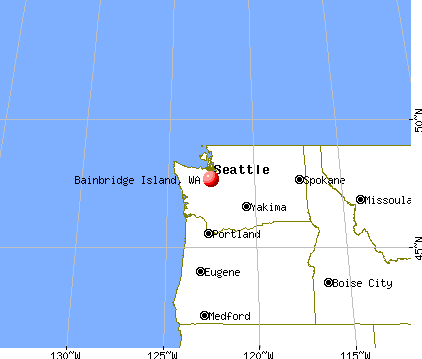
Nearest city with pop. 50,000+: Seattle, WA  (9.6 miles , pop. 563,374).
Nearest city with pop. 1,000,000+: Los Angeles, CA (963.0 miles , pop. 3,694,820).
Nearest cities:
), ), )Latitude: 47.66 N, Longitude: 122.54 W
Daytime population change due to commuting: -411 (-1.7%)
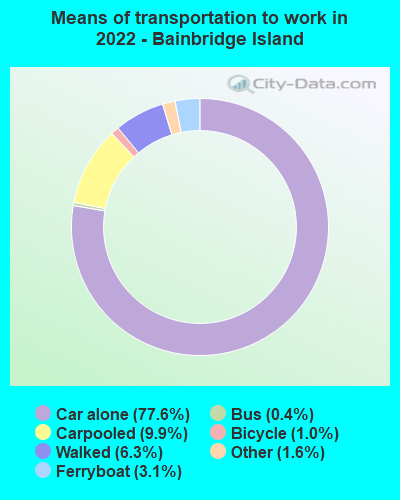
Workers who live and work in this city: 7,411 (65.5%)
Area code: 206
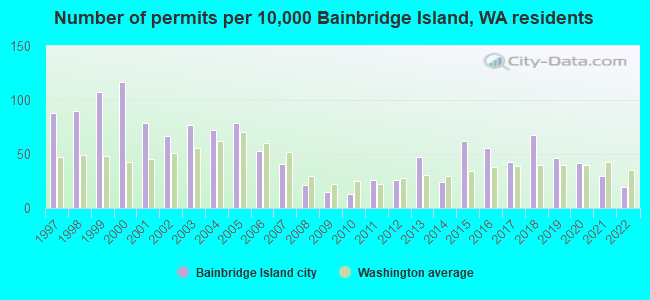
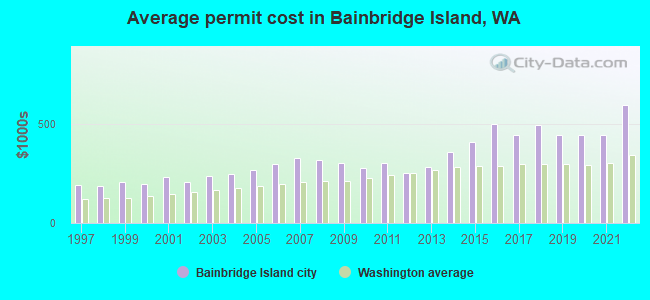
Single-family new house construction building permits:
- 2022: 38 buildings, average cost: $593,400
- 2021: 61 buildings, average cost: $444,100
- 2020: 86 buildings, average cost: $440,600
- 2019: 94 buildings, average cost: $442,500
- 2018: 138 buildings, average cost: $490,000
- 2017: 88 buildings, average cost: $441,200
- 2016: 114 buildings, average cost: $500,000
- 2015: 125 buildings, average cost: $408,900
- 2014: 49 buildings, average cost: $355,300
- 2013: 96 buildings, average cost: $281,800
- 2012: 52 buildings, average cost: $252,300
- 2011: 53 buildings, average cost: $304,200
- 2010: 27 buildings, average cost: $276,400
- 2009: 30 buildings, average cost: $299,800
- 2008: 42 buildings, average cost: $314,500
- 2007: 83 buildings, average cost: $324,700
- 2006: 107 buildings, average cost: $294,600
- 2005: 161 buildings, average cost: $263,900
- 2004: 146 buildings, average cost: $246,000
- 2003: 157 buildings, average cost: $238,100
- 2002: 136 buildings, average cost: $203,800
- 2001: 160 buildings, average cost: $232,500
- 2000: 238 buildings, average cost: $197,400
- 1999: 217 buildings, average cost: $206,600
- 1998: 183 buildings, average cost: $186,900
- 1997: 178 buildings, average cost: $191,100
| Here: | 4.2% |
| Washington: | 4.6% |
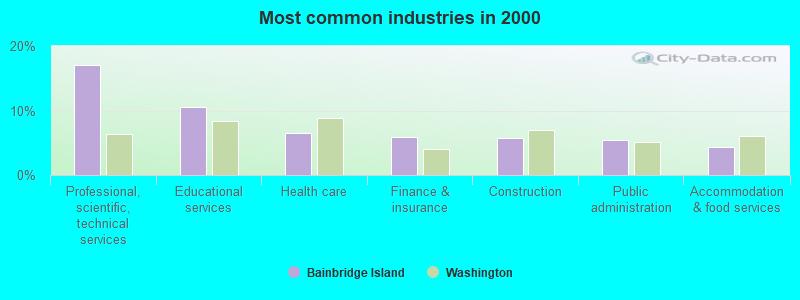
- Professional, scientific, technical services (17.1%)
- Educational services (10.5%)
- Health care (6.6%)
- Finance & insurance (6.0%)
- Construction (5.7%)
- Public administration (5.4%)
- Accommodation & food services (4.3%)
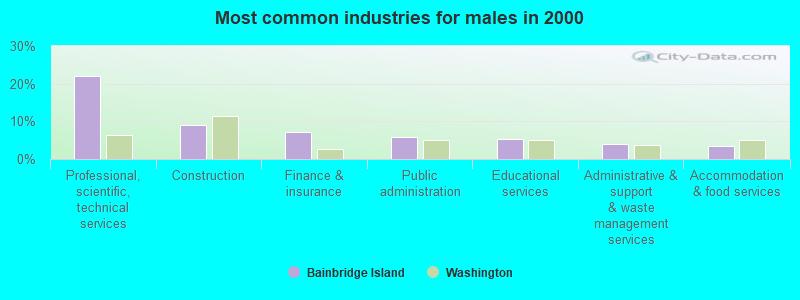
- Professional, scientific, technical services (21.9%)
- Construction (8.9%)
- Finance & insurance (7.2%)
- Public administration (5.8%)
- Educational services (5.3%)
- Administrative & support & waste management services (3.9%)
- Accommodation & food services (3.5%)
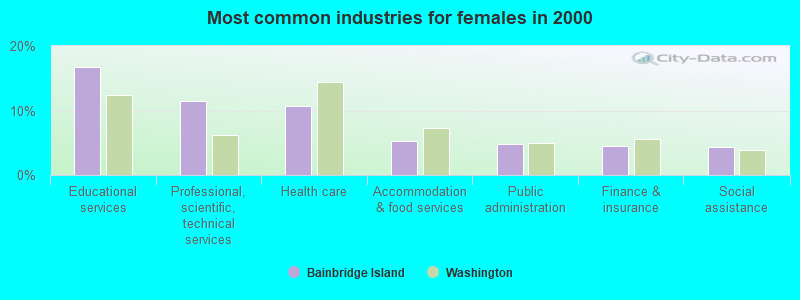
- Educational services (16.8%)
- Professional, scientific, technical services (11.5%)
- Health care (10.6%)
- Accommodation & food services (5.3%)
- Public administration (4.9%)
- Finance & insurance (4.5%)
- Social assistance (4.3%)
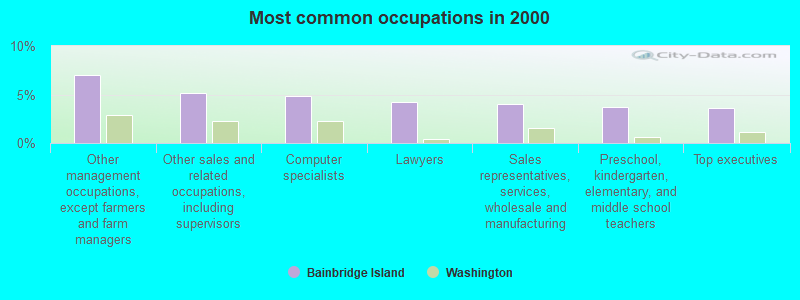
- Other management occupations, except farmers and farm managers (7.0%)
- Other sales and related occupations, including supervisors (5.2%)
- Computer specialists (4.8%)
- Lawyers (4.2%)
- Sales representatives, services, wholesale and manufacturing (4.1%)
- Preschool, kindergarten, elementary, and middle school teachers (3.7%)
- Top executives (3.6%)
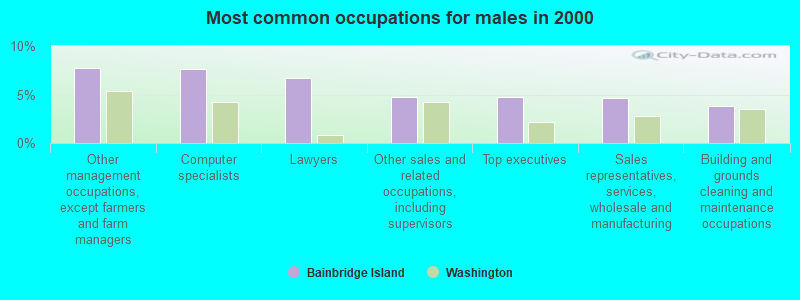
- Other management occupations, except farmers and farm managers (7.8%)
- Computer specialists (7.6%)
- Lawyers (6.7%)
- Other sales and related occupations, including supervisors (4.7%)
- Top executives (4.7%)
- Sales representatives, services, wholesale and manufacturing (4.7%)
- Building and grounds cleaning and maintenance occupations (3.8%)
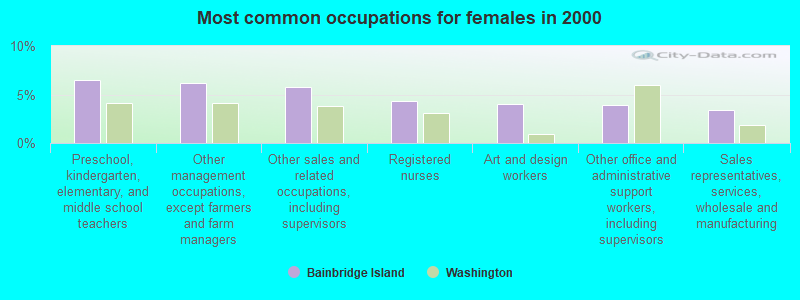
- Preschool, kindergarten, elementary, and middle school teachers (6.5%)
- Other management occupations, except farmers and farm managers (6.1%)
- Other sales and related occupations, including supervisors (5.7%)
- Registered nurses (4.3%)
- Art and design workers (4.0%)
- Other office and administrative support workers, including supervisors (3.9%)
- Sales representatives, services, wholesale and manufacturing (3.4%)
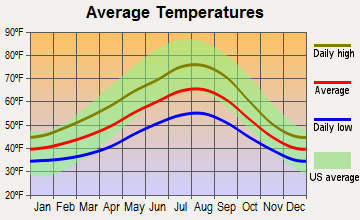
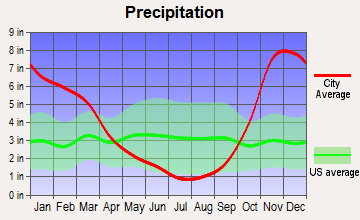
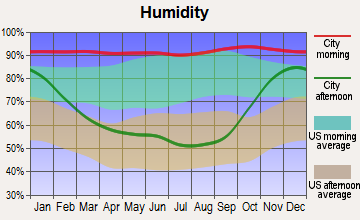
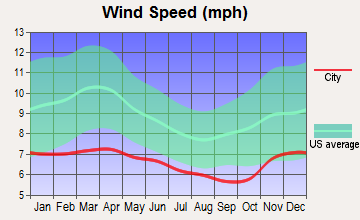
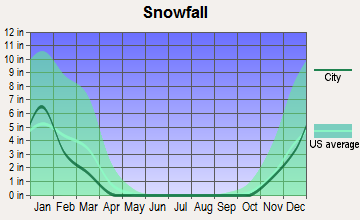
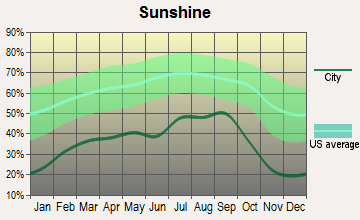
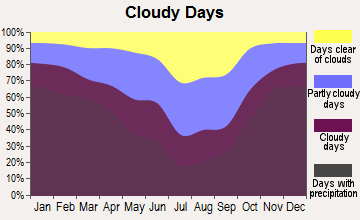
Average climate in Bainbridge Island, Washington
Based on data reported by over 4,000 weather stations
(lower is better)
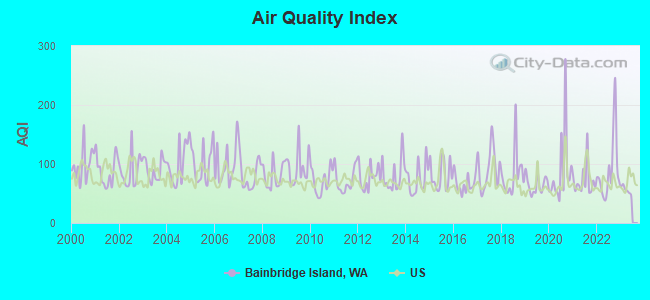
Air Quality Index (AQI) level in 2022 was 90.3. This is worse than average.
| City: | 90.3 |
| U.S.: | 72.6 |
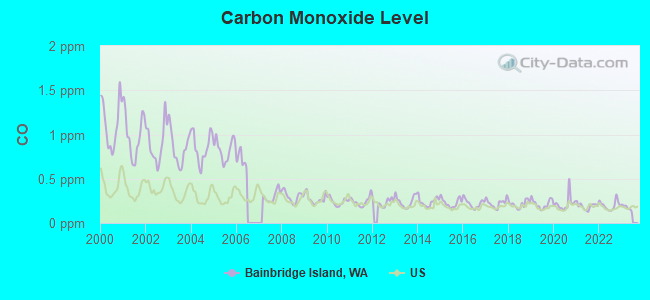
Carbon Monoxide (CO) [ppm] level in 2022 was 0.200. This is better than average. Closest monitor was 6.3 miles away from the city center.
| City: | 0.200 |
| U.S.: | 0.251 |
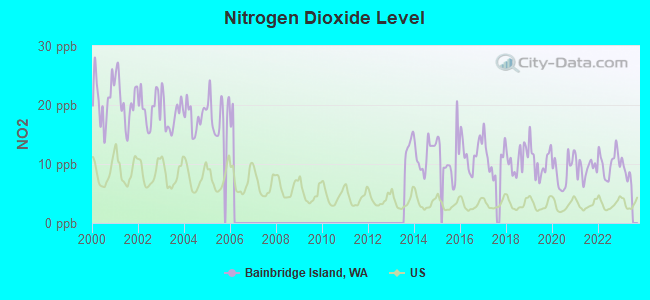
Nitrogen Dioxide (NO2) [ppb] level in 2022 was 10.2. This is significantly worse than average. Closest monitor was 10.2 miles away from the city center.
| City: | 10.2 |
| U.S.: | 5.1 |
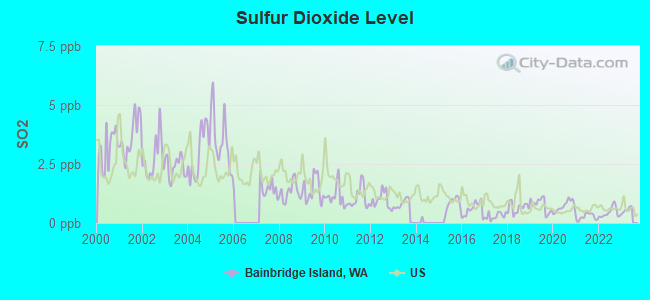
Sulfur Dioxide (SO2) [ppb] level in 2022 was 0.443. This is significantly better than average. Closest monitor was 6.3 miles away from the city center.
| City: | 0.443 |
| U.S.: | 1.515 |
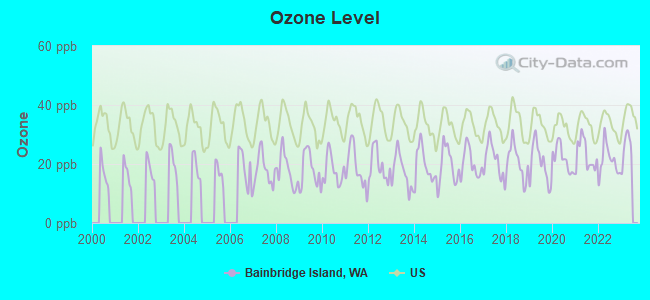
Ozone [ppb] level in 2022 was 21.1. This is significantly better than average. Closest monitor was 12.2 miles away from the city center.
| City: | 21.1 |
| U.S.: | 33.3 |
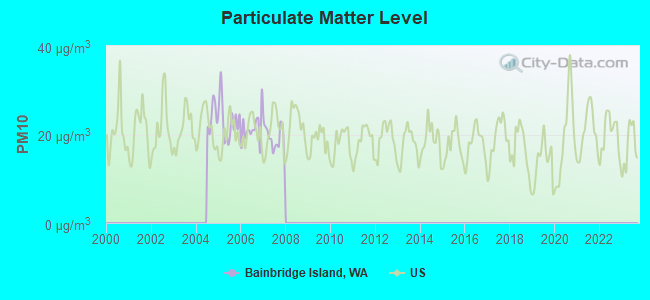
Particulate Matter (PM10) [µg/m3] level in 2007 was 19.3. This is about average. Closest monitor was 5.2 miles away from the city center.
| City: | 19.3 |
| U.S.: | 19.2 |
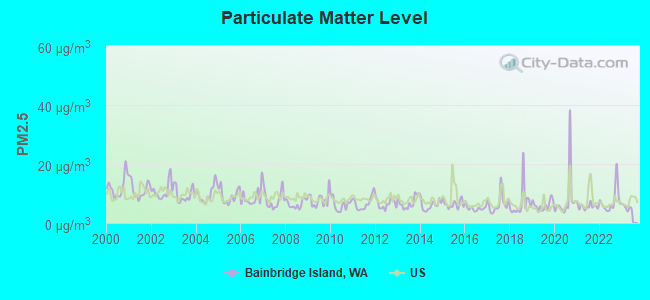
Particulate Matter (PM2.5) [µg/m3] level in 2022 was 7.47. This is about average. Closest monitor was 5.6 miles away from the city center.
| City: | 7.47 |
| U.S.: | 8.11 |
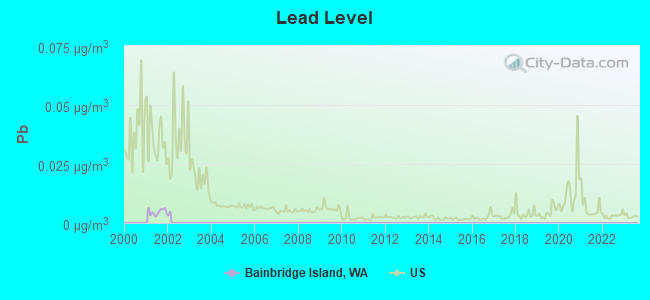
Lead (Pb) [µg/m3] level in 2001 was 0.00469. This is significantly better than average. Closest monitor was 9.4 miles away from the city center.
| City: | 0.00469 |
| U.S.: | 0.00931 |
Earthquake activity:
Bainbridge Island-area historical earthquake activity is significantly above Washington state average. It is 1275% greater than the overall U.S. average.On 4/13/1949 at 19:55:42, a magnitude 7.0 (7.0 UK, Class: Major, Intensity: VIII - XII) earthquake occurred 28.1 miles away from the city center, causing $80,000,000 total damage
On 2/28/2001 at 18:54:32, a magnitude 6.8 (6.8 MD, Depth: 32.2 mi, Class: Strong, Intensity: VII - IX) earthquake occurred 36.1 miles away from Bainbridge Island center
On 2/28/2001 at 18:54:32, a magnitude 6.8 (6.5 MB, 6.6 MS, 6.8 MW) earthquake occurred 39.2 miles away from the city center, causing $2,000,000,000 total damage and $305,000,000 insured losses
On 4/29/1965 at 15:28:43, a magnitude 6.6 (6.6 UK) earthquake occurred 25.2 miles away from the city center, causing $28,000,000 total damage
On 7/3/1999 at 01:43:54, a magnitude 5.8 (5.4 MB, 5.5 MS, 5.8 MW, 5.3 ME, Depth: 25.2 mi, Class: Moderate, Intensity: VI - VII) earthquake occurred 52.6 miles away from Bainbridge Island center
On 5/3/1996 at 04:04:22, a magnitude 5.5 (5.2 MB, 5.3 MD, 5.5 ML, Depth: 2.5 mi) earthquake occurred 38.8 miles away from the city center
Magnitude types: body-wave magnitude (MB), duration magnitude (MD), energy magnitude (ME), local magnitude (ML), surface-wave magnitude (MS), moment magnitude (MW)
Natural disasters:
The number of natural disasters in Kitsap County (15) is near the US average (15).Major Disasters (Presidential) Declared: 14
Emergencies Declared: 1
Causes of natural disasters: Floods: 9, Storms: 9, Mudslides: 4, Landslides: 3, Earthquakes: 2, Hurricane: 1, Snow: 1, Volcanic Eruption: 1, Winter Storm: 1, Other: 1 (Note: some incidents may be assigned to more than one category).
Hospitals and medical centers in Bainbridge Island:
- ISLAND HEALTH AND REHAB CENTER (835 MADISON AVENUE NORTH)
- MESSENGER HOUSE CARE CENTER (10861 NE MANITOU PARK BLVD)
Other hospitals and medical centers near Bainbridge Island:
- MAGNOLIA HEALTH CARE CENTER (Nursing Home, about 7 miles away; SEATTLE, WA)
- OLYMPIC PENINSULA KIDNEY CENTER (Dialysis Facility, about 7 miles away; BREMERTON, WA)
- HARRISON MEDICAL CENTER Acute Care Hospitals (about 7 miles away; BREMERTON, WA)
- BREMERTON CONVALESCENT CENTER (Nursing Home, about 7 miles away; BREMERTON, WA)
- BREMERTON HEALTH AND REHABILITATION CENTER (Nursing Home, about 7 miles away; BREMERTON, WA)
- HARRISON HOME HEALTH (Home Health Center, about 7 miles away; BREMERTON, WA)
- RESTHAVEN NURSING HOME (Nursing Home, about 7 miles away; BREMERTON, WA)
Heliports located in Bainbridge Island:
Amtrak stations near Bainbridge Island:
- 11 miles: SEATTLE (303 S. JACKSON ST.) . Services: ticket office, fully wheelchair accessible, enclosed waiting area, public restrooms, public payphones, vending machines, paid short-term parking, paid long-term parking, call for car rental service, taxi stand, intercity bus service, public transit connection.
- 13 miles: EDMONDS (211 RAILROAD AVE.) . Services: ticket office, fully wheelchair accessible, enclosed waiting area, public restrooms, public payphones, vending machines, paid short-term parking, paid long-term parking, call for taxi service, public transit connection.
Colleges/universities with over 2000 students nearest to Bainbridge Island:
- Olympic College (about 8 miles; Bremerton, WA; Full-time enrollment: 6,158)
- Seattle Pacific University (about 9 miles; Seattle, WA; FT enrollment: 3,897)
- Seattle Community College-North Campus (about 10 miles; Seattle, WA; FT enrollment: 4,220)
- Seattle Central College (about 11 miles; Seattle, WA; FT enrollment: 5,825)
- University of Washington-Seattle Campus (about 11 miles; Seattle, WA; FT enrollment: 39,445)
- Shoreline Community College (about 11 miles; Shoreline, WA; FT enrollment: 5,026)
- Seattle University (about 11 miles; Seattle, WA; FT enrollment: 5,808)
Public high schools in Bainbridge Island:
- BAINBRIDGE HIGH SCHOOL (Location: 9330 NE HIGH SCHOOL RD, Grades: 9-12)
- EAGLE HARBOR HIGH SCHOOL (Location: 9530 NE HIGH SCHOOL RD, Grades: 9-12)
- BAINBRIDGE SPECIAL EDUCATION SERVICES (Location: 8489 MADISON AVE NE, Grades: PK-12)
Public elementary/middle schools in Bainbridge Island:
- CAPT. CHARLES WILKES ELEM SCHOOL (Location: 12781 MADISON AVE NE, Grades: PK-4)
- CAPT JOHNSTON BLAKELY ELEM SCH (Location: 4704 BLAKELY AVE NE, Grades: KG-4)
- ORDWAY ELEMENTARY (Location: 8555 MADISON AVE NE, Grades: PK-4)
- WOODWARD MIDDLE SCHOOL (Location: 9100 NE SPORTSMAN CLUB RD, Grades: 7-8)
- ODYSSEY MULTIAGE PROGRAM (Location: 9530 NE HIGH SCHOOL RD, Grades: 1-8)
- SAKAI INTERMEDIATE (Location: 9343 NE SPORTSMAN CLUB RD, Grades: 5-6)
- MOSAIC HOME EDUCATION PARTNERSHIP (Location: 9530 NE HIGH SCHOOL RD, Grades: KG-8)
Private elementary/middle schools in Bainbridge Island:
- MADRONA SCHOOL (Students: 136, Location: 219 MADISON AVE S, Grades: PK-6)
- ST CECILIA CATHOLIC SCHOOL (Students: 112, Location: 1310 MADISON AVE N, Grades: PK-8)
- THE ISLAND SCHOOL (Students: 108, Location: 8553 NE DAY RD, Grades: KG-5)
- HYLA MIDDLE SCHOOL (Students: 82, Location: 7861 BUCKLIN HILL RD NE, Grades: 6-8)
- MONTESSORI COUNTRY SCHOOL (Students: 81, Location: 10994 ARROW POINT DR NE, Grades: PK-1)
- CARDEN COUNTRY SCHOOL (Students: 41, Location: 6974 ISLAND CENTER RD, Grades: KG-8)
- VOYAGER MONTESSORI ELEMENTARY SCHOOL (Students: 35, Location: 8225 NE HIGH SCHOOL RD, Grades: 1-5)
Points of interest:
Notable locations in Bainbridge Island: Wing Point Golf and Country Club (A), Island Center (B), Bainbridge Isle Ferry Landing (C), Pleasant Beach (D), Eagle Harbor Marina (E), Harbour Marina (F), Eagledale Moorings (G), Queen City Yacht Club Outstation (H), Bainbridge Marina (I), Winslow Wharf Marina (J), The Chandlery at Winslow Wharf (K), Port Madison Yacht Club (L), Seattle Yacht Club Port Madison Outstation (M), Bainbridge Island City Sewage Treatment Plant (N), Point Monroe Light (O), Bainbridge Island Fire Department Station 23 (P), Bainbridge Island Fire Department Station 22 (Q), Bainbridge Island Ambulance Association (R), Battle Point Light (S), Bainbridge Island Senior Community Center (T). Display/hide their locations on the map
Shopping Center: Bainbridge Village Shopping Center (1). Display/hide its location on the map
Churches in Bainbridge Island include: Madison Church (A), Bethany Lutheran Church (B), Eagle Harbor Congregational Church (C), Grace Church (D), Island Church (E), Life Staff Ministries (F), Saint Cecilia Catholic Church (G), Bainbridge Bible Chapel (H), Bainbridge First Baptist Church (I). Display/hide their locations on the map
Cemeteries: Fort Blakely Cemetery (1), Seabold Cemetery (2). Display/hide their locations on the map
Lakes and reservoirs: Gazzam Lake (A), Erickson Reservoir (B), Battlepoint Park Reservoir (C). Display/hide their locations on the map
Creeks: Issei Creek (A), Manzanita Creek (B), Miemois Creek (C). Display/hide their locations on the map
Parks in Bainbridge Island include: Fay-Bainbridge State Park (1), Battle Point Park (2), Fort Ward State Park (3). Display/hide their locations on the map
Tourist attraction: Bainbridge Island Historical Museum (215 Ericksen Avenue Northeast) (1). Display/hide its approximate location on the map
Hotels: Island Country Inn (920 Hildebrand Lane Northeast) (1), Monarch Manor Estates LLC- Bed And Beach (7656 Madrona Drive NE) (2). Display/hide their approximate locations on the map
Court: Bainbridge Island City - Municipal Court (10255 Northeast Valley Road) (1). Display/hide its approximate location on the map
Drinking water stations with addresses in Bainbridge Island and their reported violations in the past:
EAGLE HARBOR MARINA (Population served: 257, Groundwater):Past monitoring violations:ISLAND CENTER COMMUNITY (Population served: 73, Groundwater):
- 6 routine major monitoring violations
Past monitoring violations:EAGLEDALE PARK (Population served: 51, Groundwater):
- 2 routine major monitoring violations
Past monitoring violations:CRYSTAL SPRINGS (Population served: 48, Groundwater):
- 2 routine major monitoring violations
Past monitoring violations:
- One routine major monitoring violation
- One regular monitoring violation
| This city: | 2.4 people |
| Washington: | 2.5 people |
| This city: | 69.8% |
| Whole state: | 64.4% |
| This city: | 4.6% |
| Whole state: | 7.7% |
Likely homosexual households (counted as self-reported same-sex unmarried-partner households)
- Lesbian couples: 0.7% of all households
- Gay men: 0.5% of all households
People in group quarters in Bainbridge Island in 2010:
- 132 people in nursing facilities/skilled-nursing facilities
- 43 people in other noninstitutional facilities
- 26 people in college/university student housing
- 5 people in group homes intended for adults
- 5 people in workers' group living quarters and job corps centers
24 people in other noninstitutional group quarters in 2000
Banks with most branches in Bainbridge Island (2011 data):
- Columbia State Bank: Village Branch at 208 High School Road Ne, branch established on 1968/01/25; Branch at 249 Winslow Way East, branch established on 1948/09/17. Info updated 2011/08/09: Bank assets: $4,785.2 mil, Deposits: $3,892.8 mil, headquarters in Tacoma, WA, positive income, Commercial Lending Specialization, 104 total offices, Holding Company: Columbia Banking System, Inc.
- Union Bank, National Association: Bainbridge Island Branch at 901 Hildebrand Lane Ne, branch established on 1991/03/25. Info updated 2011/09/01: Bank assets: $88,967.5 mil, Deposits: $65,286.4 mil, headquarters in San Francisco, CA, positive income, Commercial Lending Specialization, 403 total offices, Holding Company: Mitsubishi Ufj Financial Group, Inc.
- JPMorgan Chase Bank, National Association: Bainbridge Island at 231 Winslow Way East, branch established on 1916/01/01. Info updated 2011/11/10: Bank assets: $1,811,678.0 mil, Deposits: $1,190,738.0 mil, headquarters in Columbus, OH, positive income, International Specialization, 5577 total offices, Holding Company: Jpmorgan Chase & Co.
- Kitsap Bank: Bainbridge Island Branch at 10140 N.E. High School Road, branch established on 1979/12/05. Info updated 2009/05/11: Bank assets: $903.9 mil, Deposits: $775.3 mil, headquarters in Port Orchard, WA, positive income, Commercial Lending Specialization, 22 total offices, Holding Company: Olympic Bancorp, Inc.
- Wells Fargo Bank, National Association: Bainbridge Branch at 1180 Hildebrand Lane Northeast, branch established on 1995/01/07. Info updated 2011/04/05: Bank assets: $1,161,490.0 mil, Deposits: $905,653.0 mil, headquarters in Sioux Falls, SD, positive income, 6395 total offices, Holding Company: Wells Fargo & Company
- AmericanWest Bank: Bainbridge Island Branch at 945 Hildebrand Lane Suite 240, branch established on 2006/05/21. Info updated 2011/12/12: Bank assets: $2,274.6 mil, Deposits: $1,889.1 mil, headquarters in Spokane, WA, positive income, Commercial Lending Specialization, 76 total offices, Holding Company: Skbhc Holdings Llc
- Sterling Savings Bank: Winslow Branch at 600 Winslow Way East, Ste 120, branch established on 1988/06/30. Info updated 2012/03/21: Bank assets: $9,207.8 mil, Deposits: $6,454.1 mil, headquarters in Spokane, WA, positive income, Commercial Lending Specialization, 192 total offices, Holding Company: Sterling Financial Corporation
- KeyBank National Association: Winslow Branch at 617 High School Road Ne, branch established on 1993/03/03. Info updated 2008/03/03: Bank assets: $86,198.8 mil, Deposits: $64,214.8 mil, headquarters in Cleveland, OH, positive income, Commercial Lending Specialization, 1067 total offices, Holding Company: Keycorp
- Bank of America, National Association: Bainbridge Island Branch at 1200 Hildebrand Lane, Northeast, branch established on 1994/08/01. Info updated 2009/11/18: Bank assets: $1,451,969.3 mil, Deposits: $1,077,176.8 mil, headquarters in Charlotte, NC, positive income, 5782 total offices, Holding Company: Bank Of America Corporation
For population 15 years and over in Bainbridge Island:
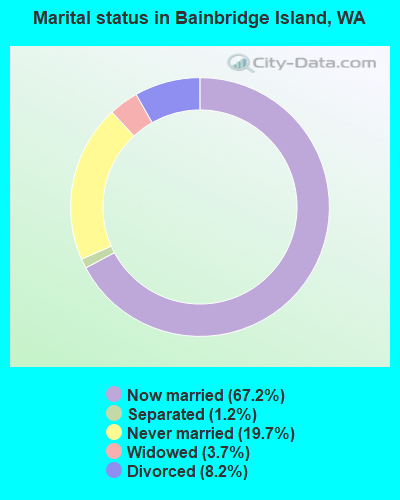
- Never married: 19.7%
- Now married: 67.2%
- Separated: 1.2%
- Widowed: 3.7%
- Divorced: 8.2%
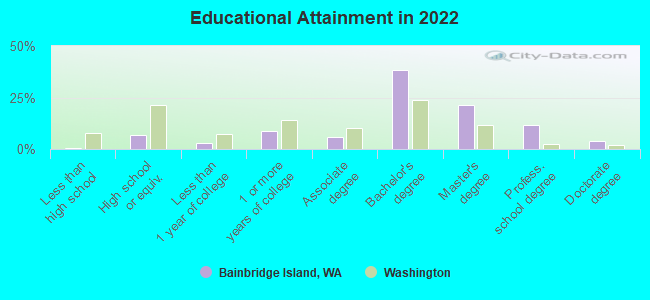
For population 25 years and over in Bainbridge Island:
- High school or higher: 99.6%
- Bachelor's degree or higher: 73.8%
- Graduate or professional degree: 34.8%
- Unemployed: 2.6%
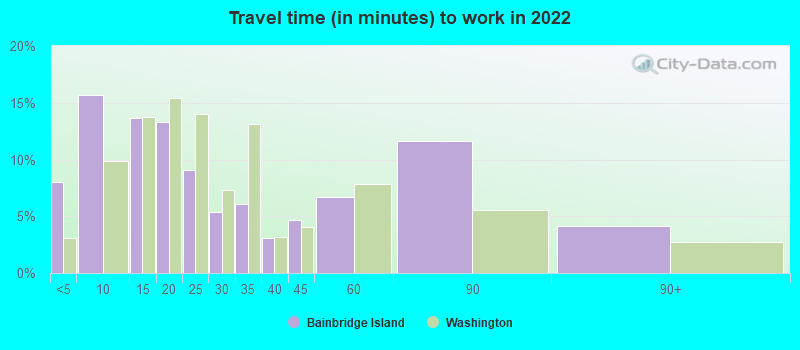
- Mean travel time to work (commute): 26.0 minutes
| Here: | 8.1 |
| Washington average: | 11.6 |
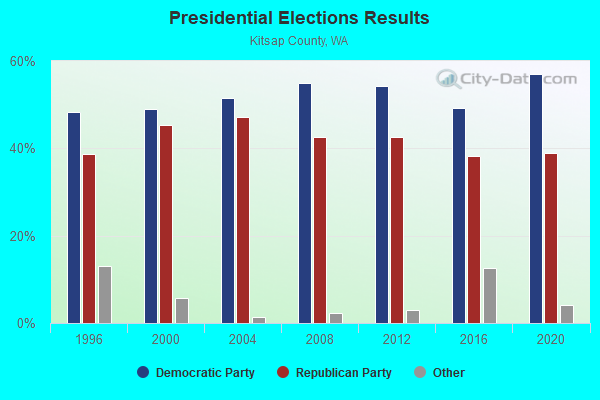
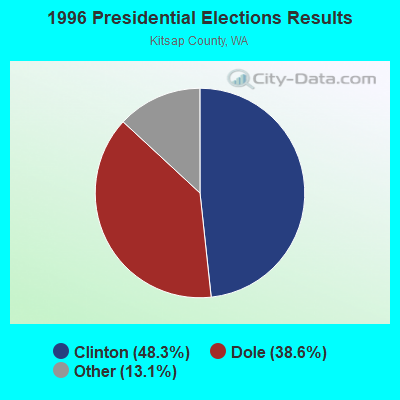
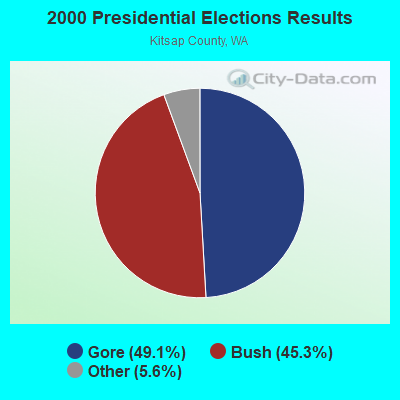

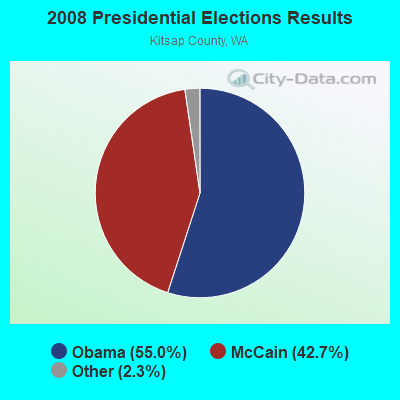
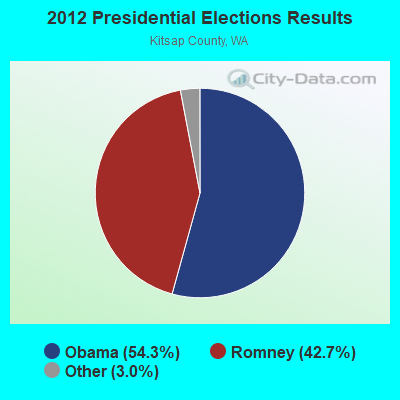

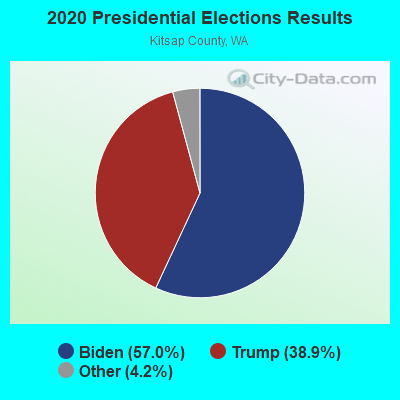
Graphs represent county-level data. Detailed 2008 Election Results
Political contributions by individuals in Bainbridge Island, WA
Religion statistics for Bainbridge Island, WA (based on Kitsap County data)
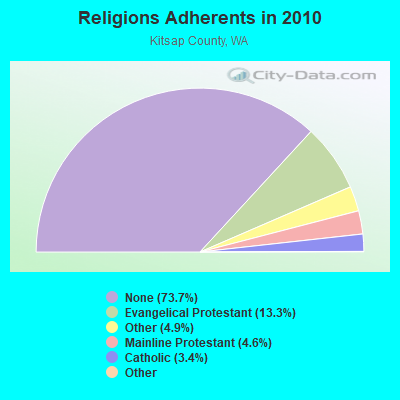
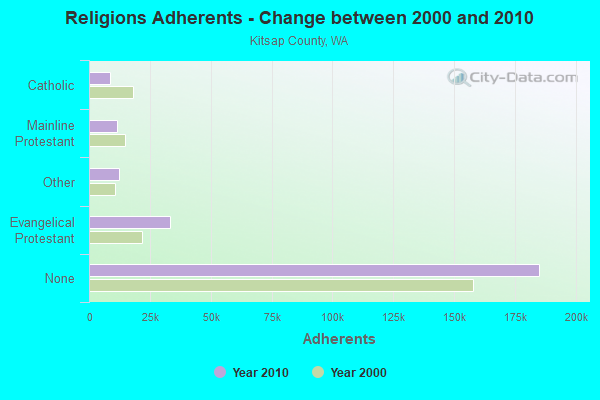
| Religion | Adherents | Congregations |
|---|---|---|
| Evangelical Protestant | 33,373 | 118 |
| Other | 12,378 | 42 |
| Mainline Protestant | 11,484 | 39 |
| Catholic | 8,572 | 5 |
| Orthodox | 140 | 2 |
| Black Protestant | 84 | 1 |
| None | 185,102 | - |
Food Environment Statistics:
| Kitsap County: | 1.81 / 10,000 pop. |
| Washington: | 2.06 / 10,000 pop. |
| This county: | 0.13 / 10,000 pop. |
| State: | 0.19 / 10,000 pop. |
| Kitsap County: | 1.39 / 10,000 pop. |
| Washington: | 1.18 / 10,000 pop. |
| Kitsap County: | 2.23 / 10,000 pop. |
| State: | 2.67 / 10,000 pop. |
| Here: | 7.26 / 10,000 pop. |
| State: | 8.26 / 10,000 pop. |
| This county: | 7.9% |
| Washington: | 7.7% |
| Kitsap County: | 27.6% |
| Washington: | 25.7% |
| This county: | 11.4% |
| State: | 13.9% |
Health and Nutrition:
| Here: | 59.3% |
| State: | 49.9% |
| Bainbridge Island: | 60.5% |
| Washington: | 47.2% |
| Bainbridge Island: | 27.9 |
| State: | 28.4 |
| Bainbridge Island: | 17.5% |
| Washington: | 20.9% |
| Bainbridge Island: | 7.4% |
| Washington: | 10.5% |
| This city: | 7.0 |
| Washington: | 6.8 |
| This city: | 35.5% |
| Washington: | 32.8% |
| Bainbridge Island: | 64.4% |
| Washington: | 56.8% |
| This city: | 81.4% |
| State: | 79.4% |
More about Health and Nutrition of Bainbridge Island, WA Residents
| Local government employment and payroll (March 2022) | |||||
| Function | Full-time employees | Monthly full-time payroll | Average yearly full-time wage | Part-time employees | Monthly part-time payroll |
|---|---|---|---|---|---|
| Other Government Administration | 40 | $295,382 | $88,615 | 6 | $2,886 |
| Police Protection - Officers | 20 | $204,486 | $122,692 | 0 | $0 |
| Streets and Highways | 20 | $153,452 | $92,071 | 0 | $0 |
| Financial Administration | 13 | $114,574 | $105,761 | 0 | $0 |
| Other and Unallocable | 6 | $45,542 | $91,084 | 0 | $0 |
| Water Supply | 6 | $47,646 | $95,292 | 0 | $0 |
| Judicial and Legal | 5 | $44,586 | $107,006 | 2 | $10,402 |
| Sewerage | 4 | $28,384 | $85,152 | 1 | $2,944 |
| Police - Other | 4 | $27,068 | $81,204 | 2 | $9,104 |
| Natural Resources | 3 | $19,968 | $79,872 | 0 | $0 |
| Health | 1 | $6,284 | $75,408 | 0 | $0 |
| Totals for Government | 122 | $987,372 | $97,119 | 11 | $25,336 |
Bainbridge Island government finances - Expenditure in 2017 (per resident):
- Construction - Regular Highways: $1,942,000 ($79.28)
Parks and Recreation: $1,705,000 ($69.61)
Parking Facilities: $73,000 ($2.98)
Police Protection: $14,000 ($0.57)
General - Other: $11,000 ($0.45)
- Current Operations - Central Staff Services: $3,997,000 ($163.18)
Police Protection: $3,838,000 ($156.69)
Sewerage: $2,837,000 ($115.82)
Regular Highways: $2,127,000 ($86.84)
Financial Administration: $1,710,000 ($69.81)
Judicial and Legal Services: $1,384,000 ($56.50)
General - Other: $1,197,000 ($48.87)
Water Utilities: $839,000 ($34.25)
Housing and Community Development: $815,000 ($33.27)
Parks and Recreation: $502,000 ($20.49)
Health - Other: $167,000 ($6.82)
General Public Buildings: $118,000 ($4.82)
Protective Inspection and Regulation - Other: $94,000 ($3.84)
Solid Waste Management: $37,000 ($1.51)
Parking Facilities: $10,000 ($0.41)
Libraries: $9,000 ($0.37)
Correctional Institutions: $2,000 ($0.08)
- General - Interest on Debt: $1,403,000 ($57.28)
- Intergovernmental to Local - Other - Sewerage: $717,000 ($29.27)
Other - Local Fire Protection: $272,000 ($11.10)
Other - Water Utilities: $120,000 ($4.90)
Other - Police Protection: $88,000 ($3.59)
Other - Health - Other: $79,000 ($3.23)
Other - General - Other: $74,000 ($3.02)
Other - Correctional Institutions: $61,000 ($2.49)
Other - Financial Administration: $26,000 ($1.06)
Other - Housing and Community Development: $16,000 ($0.65)
Other - Central Staff Services: $14,000 ($0.57)
Other - Natural Resources - Other: $10,000 ($0.41)
Other - Regular Highways: $9,000 ($0.37)
Other - Judicial and Legal Services: $1,000 ($0.04)
- Other Capital Outlay - Police Protection: $225,000 ($9.19)
Regular Highways: $198,000 ($8.08)
Parks and Recreation: $83,000 ($3.39)
General - Other: $68,000 ($2.78)
- Total Salaries and Wages: $9,758,000 ($398.38)
- Transit Utilities - Interest on Debt: $21,000 ($0.86)
Bainbridge Island government finances - Revenue in 2017 (per resident):
- Charges - Sewerage: $3,632,000 ($148.28)
Other: $2,877,000 ($117.46)
Parks and Recreation: $1,000 ($0.04)
- Miscellaneous - Special Assessments: $864,000 ($35.27)
Rents: $390,000 ($15.92)
Sale of Property: $339,000 ($13.84)
General Revenue - Other: $120,000 ($4.90)
Fines and Forfeits: $99,000 ($4.04)
Donations From Private Sources: $7,000 ($0.29)
Interest Earnings: $0 ($0.00)
- Revenue - Water Utilities: $1,288,000 ($52.58)
- State Intergovernmental - Other: $1,724,000 ($70.38)
Highways: $696,000 ($28.42)
General Local Government Support: $311,000 ($12.70)
Health and Hospitals: $118,000 ($4.82)
- Tax - Property: $7,723,000 ($315.30)
General Sales and Gross Receipts: $4,015,000 ($163.92)
Public Utilities Sales: $3,594,000 ($146.73)
Documentary and Stock Transfer: $2,882,000 ($117.66)
Other Selective Sales: $1,135,000 ($46.34)
Other License: $744,000 ($30.37)
Occupation and Business License - Other: $668,000 ($27.27)
Motor Vehicle License: $409,000 ($16.70)
Amusements Sales: $1,000 ($0.04)
Bainbridge Island government finances - Debt in 2017 (per resident):
- Long Term Debt - Beginning Outstanding - Unspecified Public Purpose: $35,619,000 ($1454.19)
Outstanding Unspecified Public Purpose: $33,225,000 ($1356.45)
Retired Unspecified Public Purpose: $4,486,000 ($183.15)
Issue, Unspecified Public Purpose: $2,091,000 ($85.37)
8.72% of this county's 2021 resident taxpayers lived in other counties in 2020 ($89,569 average adjusted gross income)
| Here: | 8.72% |
| Washington average: | 7.53% |
0.23% of residents moved from foreign countries ($1,775 average AGI)
Kitsap County: 0.23% Washington average: 0.05%
Top counties from which taxpayers relocated into this county between 2020 and 2021:
| from King County, WA | |
| from Pierce County, WA | |
| from San Diego County, CA |
8.34% of this county's 2020 resident taxpayers moved to other counties in 2021 ($88,661 average adjusted gross income)
| Here: | 8.34% |
| Washington average: | 7.40% |
0.15% of residents moved to foreign countries ($1,281 average AGI)
Kitsap County: 0.15% Washington average: 0.04%
Top counties to which taxpayers relocated from this county between 2020 and 2021:
| to Pierce County, WA | |
| to King County, WA | |
| to San Diego County, CA |
| Businesses in Bainbridge Island, WA | ||||
| Name | Count | Name | Count | |
|---|---|---|---|---|
| Ace Hardware | 1 | Nike | 2 | |
| Best Western | 1 | Rite Aid | 1 | |
| Curves | 1 | Starbucks | 1 | |
| FedEx | 3 | Subway | 1 | |
| GNC | 1 | U-Haul | 1 | |
| McDonald's | 1 | UPS | 5 | |
| New Balance | 1 | Vons | 1 | |
Strongest AM radio stations in Bainbridge Island:
- KKOL (1300 AM; 50 kW; SEATTLE, WA; Owner: INSPIRATION MEDIA, INC.)
- KLFE (1590 AM; 10 kW; SEATTLE, WA; Owner: INSPIRATION MEDIA, INC.)
- KOMO (1000 AM; 50 kW; SEATTLE, WA; Owner: FISHER BROADCASTING - SEATTLE RADIO, L.L.C.)
- KGNW (820 AM; 50 kW; BURIEN-SEATTLE, WA; Owner: INSPIRATION MEDIA, INC.)
- KIRO (710 AM; 50 kW; SEATTLE, WA; Owner: ENTERCOM SEATTLE LICENSE, LLC)
- KIXI (880 AM; 50 kW; MERCER ISLAND/SEATTL, WA; Owner: BELLEVUE RADIO, INC.)
- KTTH (770 AM; 50 kW; SEATTLE, WA; Owner: ENTERCOM SEATTLE LICENSE, LLC)
- KYCW (1090 AM; 50 kW; SEATTLE, WA; Owner: INFINITY RADIO SUBSIDIARY OPERATIONS INC.)
- KJR (950 AM; 50 kW; SEATTLE, WA)
- KCIS (630 AM; 5 kW; EDMONDS, WA; Owner: CRISTA MINISTRIES)
- KRKO (1380 AM; 50 kW; EVERETT, WA; Owner: S-R BROADCASTING, CO.)
- KBLE (1050 AM; 5 kW; SEATTLE, WA; Owner: SACRED HEART RADIO, INC.)
- KKDZ (1250 AM; 5 kW; SEATTLE, WA; Owner: WMAL, INC.)
Strongest FM radio stations in Bainbridge Island:
- KQBZ (100.7 FM; SEATTLE, WA; Owner: ENTERCOM SEATTLE LICENSE, LLC)
- KISW (99.9 FM; SEATTLE, WA; Owner: ENTERCOM SEATTLE LICENSE, LLC)
- KRWM (106.9 FM; BREMERTON, WA; Owner: SEASCAPE RADIO, INC.)
- KCMS (105.3 FM; EDMONDS, WA; Owner: CRISTA MINISTRIES, INC.)
- K205DD (88.9 FM; BREMERTON, WA; Owner: CALVARY CHAPEL OF TWIN FALLS, INC.)
- KMTT (103.7 FM; TACOMA, WA; Owner: ENTERCOM SEATTLE LICENSE, LLC)
- KNDD (107.7 FM; SEATTLE, WA; Owner: ENTERCOM SEATTLE LICENSE, LLC)
- KYPT (96.5 FM; SEATTLE, WA; Owner: INFINITY RADIO SUBSIDIARY OPERATIONS INC.)
- KBSG-FM (97.3 FM; TACOMA, WA; Owner: ENTERCOM SEATTLE LICENSE, LLC)
- KUOW (94.9 FM; SEATTLE, WA; Owner: THE UNIVERSITY OF WASHINGTON)
- KEXP-FM (90.3 FM; SEATTLE, WA; Owner: UNIVERSITY OF WASHINGTON BOARD OF REGENTS)
- KBKS (106.1 FM; TACOMA, WA; Owner: INFINITY RADIO SUBSIDIARY OPERATIONS INC.)
- KING-FM (98.1 FM; SEATTLE, WA; Owner: CLASSIC RADIO, INC.)
- KLSY-FM (92.5 FM; BELLEVUE, WA; Owner: BELLEVUE RADIO INC.)
- KPLU-FM (88.5 FM; TACOMA, WA; Owner: PACIFIC LUTHERAN UNIVERSITY, INC.)
- KWJZ (98.9 FM; SEATTLE, WA; Owner: ORCA RADIO, INC.)
- KZOK-FM (102.5 FM; SEATTLE, WA; Owner: INFINITY RADIO SUBSIDIARY OPERATIONS INC.)
- KMPS-FM (94.1 FM; SEATTLE, WA; Owner: INFINITY RADIO SUBSIDIARY OPERATIONS INC.)
- KJR-FM (95.7 FM; SEATTLE, WA; Owner: ACKERLEY MEDIA GROUP, INC.)
- KUBE (93.3 FM; SEATTLE, WA; Owner: ACKERLEY MEDIA GROUP, INC.)
TV broadcast stations around Bainbridge Island:
- KING-TV (Channel 5; SEATTLE, WA; Owner: KING BROADCASTING COMPANY)
- KSTW (Channel 11; TACOMA, WA; Owner: UPN TELEVISION STATIONS INC.)
- KOMO-TV (Channel 4; SEATTLE, WA; Owner: FISHER BROADCASTING - SEATTLE TV, L.L.C.)
- KIRO-TV (Channel 7; SEATTLE, WA; Owner: KIRO-TV HOLDINGS, INC.)
- K58DP (Channel 58; SEATTLE, WA; Owner: WORD OF GOD FELLOWSHIP, INC.)
- KTWB-TV (Channel 22; SEATTLE, WA; Owner: TRIBUNE TELEVISION HOLDINGS, INC.)
- K57HB (Channel 57; EUREKA, CA; Owner: MS COMMUNICATIONS, LLC)
- KCTS-TV (Channel 9; SEATTLE, WA; Owner: KCTS TELEVISION)
- KONG-TV (Channel 16; EVERETT, WA; Owner: KONG-TV, INC.)
- KCPQ (Channel 13; TACOMA, WA; Owner: TRIBUNE TELEVISION NORTHWEST, INC.)
- K68DL (Channel 68; SEATTLE, WA; Owner: THREE ANGELS BROADCASTING NETWORK)
- KHCV (Channel 45; SEATTLE, WA; Owner: NORTH PACIFIC INTERNATIONAL TELEVISION, INC.)
- KWPX (Channel 33; BELLEVUE, WA; Owner: PAXSON COMMUNICATIONS LICENSE COMPANY, LLC)
- KWDK (Channel 56; TACOMA, WA; Owner: PUGET SOUND EDUCATIONAL TV, INC.)
- KTBW-TV (Channel 20; TACOMA, WA; Owner: TRINITY BROADCASTING OF WASHINGTON)
- KBTC-TV (Channel 28; TACOMA, WA; Owner: BATES TECHNICAL COLLEGE)
- K54AO (Channel 54; BREMERTON, WA; Owner: KIRO-TV HOLDINGS, INC.)
- K02EO (Channel 2; SEATTLE, WA; Owner: KIRO-TV HOLDINGS, INC.)
- National Bridge Inventory (NBI) Statistics
- 7Number of bridges
- 249ft / 75.6mTotal length
- $42,622,000Total costs
- 59,603Total average daily traffic
- 1,815Total average daily truck traffic
FCC Registered Broadcast Land Mobile Towers: 12 (See the full list of FCC Registered Broadcast Land Mobile Towers in Bainbridge Island, WA)
FCC Registered Microwave Towers: 5 (See the full list of FCC Registered Microwave Towers in this town)
FCC Registered Maritime Coast & Aviation Ground Towers: 4 (See the full list of FCC Registered Maritime Coast & Aviation Ground Towers)
FCC Registered Amateur Radio Licenses: 478 (See the full list of FCC Registered Amateur Radio Licenses in Bainbridge Island)
FAA Registered Aircraft: 34 (See the full list of FAA Registered Aircraft in Bainbridge Island)
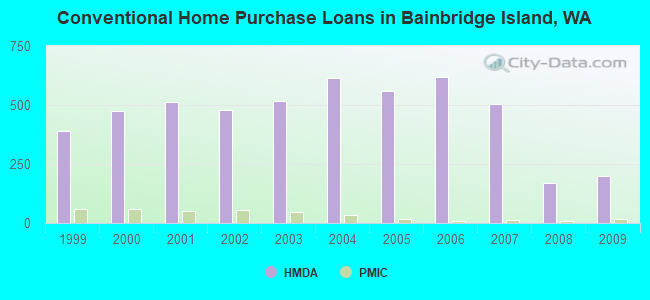
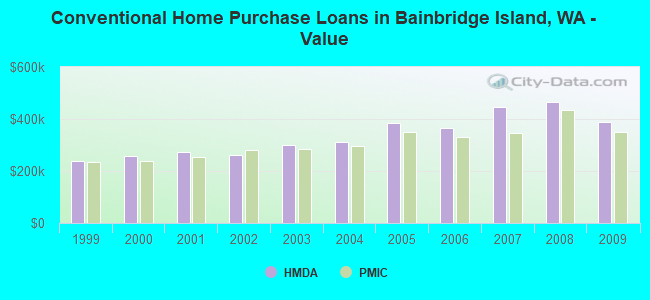
| Home Mortgage Disclosure Act Aggregated Statistics For Year 2009 (Based on 4 full tracts) | ||||||||||||
| A) FHA, FSA/RHS & VA Home Purchase Loans | B) Conventional Home Purchase Loans | C) Refinancings | D) Home Improvement Loans | F) Non-occupant Loans on < 5 Family Dwellings (A B C & D) | G) Loans On Manufactured Home Dwelling (A B C & D) | |||||||
|---|---|---|---|---|---|---|---|---|---|---|---|---|
| Number | Average Value | Number | Average Value | Number | Average Value | Number | Average Value | Number | Average Value | Number | Average Value | |
| LOANS ORIGINATED | 22 | $374,364 | 199 | $387,628 | 1,124 | $318,343 | 39 | $231,026 | 90 | $307,800 | 5 | $197,200 |
| APPLICATIONS APPROVED, NOT ACCEPTED | 1 | $294,000 | 24 | $421,292 | 111 | $345,423 | 4 | $357,000 | 3 | $322,667 | 0 | $0 |
| APPLICATIONS DENIED | 3 | $378,667 | 31 | $412,613 | 210 | $388,681 | 17 | $114,059 | 21 | $344,762 | 4 | $180,000 |
| APPLICATIONS WITHDRAWN | 3 | $402,333 | 29 | $506,483 | 155 | $348,968 | 4 | $215,500 | 18 | $289,556 | 2 | $201,500 |
| FILES CLOSED FOR INCOMPLETENESS | 0 | $0 | 1 | $417,000 | 32 | $379,188 | 2 | $117,000 | 4 | $317,000 | 0 | $0 |
Detailed HMDA statistics for the following Tracts: 0907.00 , 0908.00, 0909.00, 0910.00
| Private Mortgage Insurance Companies Aggregated Statistics For Year 2009 (Based on 4 full tracts) | ||||||
| A) Conventional Home Purchase Loans | B) Refinancings | C) Non-occupant Loans on < 5 Family Dwellings (A & B) | ||||
|---|---|---|---|---|---|---|
| Number | Average Value | Number | Average Value | Number | Average Value | |
| LOANS ORIGINATED | 16 | $350,250 | 8 | $355,500 | 0 | $0 |
| APPLICATIONS APPROVED, NOT ACCEPTED | 6 | $385,000 | 1 | $398,000 | 1 | $298,000 |
| APPLICATIONS DENIED | 3 | $294,667 | 1 | $352,000 | 0 | $0 |
| APPLICATIONS WITHDRAWN | 4 | $387,750 | 0 | $0 | 0 | $0 |
| FILES CLOSED FOR INCOMPLETENESS | 0 | $0 | 0 | $0 | 0 | $0 |
Detailed PMIC statistics for the following Tracts: 0907.00 , 0908.00, 0909.00, 0910.00
2002 - 2018 National Fire Incident Reporting System (NFIRS) incidents
- Fire incident types reported to NFIRS in Bainbridge Island, WA
- 39947.1%Structure Fires
- 29835.2%Outside Fires
- 11813.9%Mobile Property/Vehicle Fires
- 323.8%Other
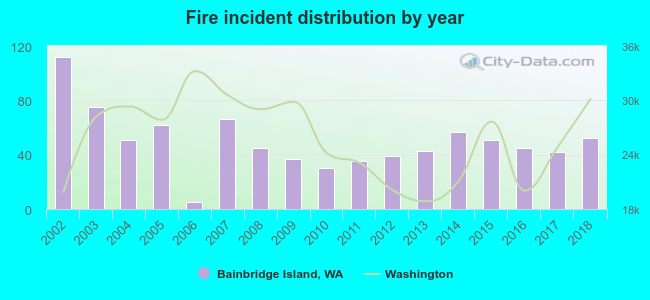 According to the data from the years 2002 - 2018 the average number of fire incidents per year is 50. The highest number of reported fires - 112 took place in 2002, and the least - 5 in 2006. The data has a declining trend.
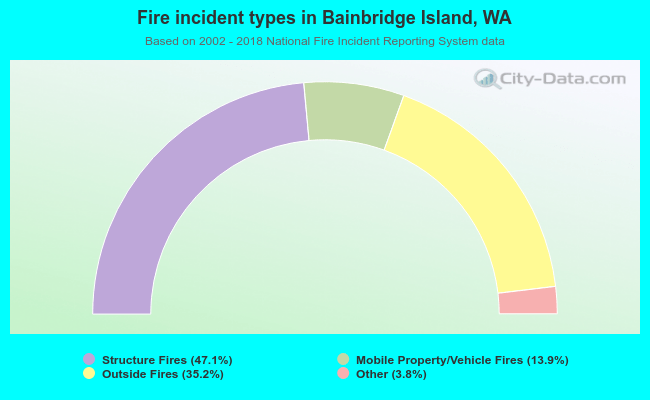 When looking into fire subcategories, the most reports belonged to: Structure Fires (47.1%), and Outside Fires (35.2%).
Fire-safe hotels and motels in Bainbridge Island, Washington:
- Island Country Inn, 920 Hildebrand Lane NE, Bainbridge Island, Washington 98110 , Phone: (206) 842-6861, Fax: (206) 842-9808
- Best Western Bainbridge Island Suites, 350 High School Rd NE, Bainbridge Island, Washington 98110 , Phone: (206) 855-9666, Fax: (206) 855-9790
| Most common first names in Bainbridge Island, WA among deceased individuals | ||
| Name | Count | Lived (average) |
|---|---|---|
| John | 107 | 78.5 years |
| Robert | 87 | 74.5 years |
| William | 76 | 77.0 years |
| Mary | 70 | 81.8 years |
| Helen | 58 | 83.9 years |
| James | 54 | 78.1 years |
| Charles | 53 | 78.3 years |
| Ruth | 53 | 84.1 years |
| Margaret | 50 | 82.5 years |
| George | 46 | 80.3 years |
| Most common last names in Bainbridge Island, WA among deceased individuals | ||
| Last name | Count | Lived (average) |
|---|---|---|
| Smith | 38 | 78.4 years |
| Johnson | 36 | 78.1 years |
| Anderson | 21 | 81.8 years |
| Thompson | 19 | 79.9 years |
| Jones | 18 | 83.1 years |
| Allen | 17 | 81.1 years |
| Brown | 17 | 80.3 years |
| Hansen | 16 | 78.2 years |
| Peterson | 15 | 80.2 years |
| Nelson | 15 | 79.3 years |
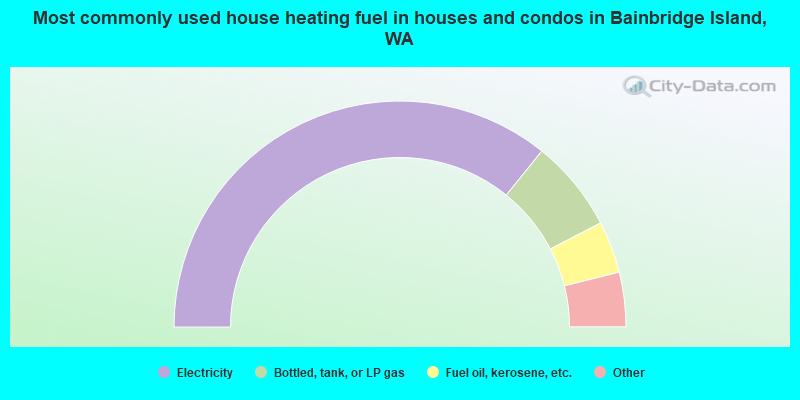
- 71.6%Electricity
- 13.2%Bottled, tank, or LP gas
- 7.4%Fuel oil, kerosene, etc.
- 3.3%Utility gas
- 2.6%Wood
- 0.8%Other fuel
- 0.6%Solar energy
- 0.3%Coal or coke
- 0.2%No fuel used
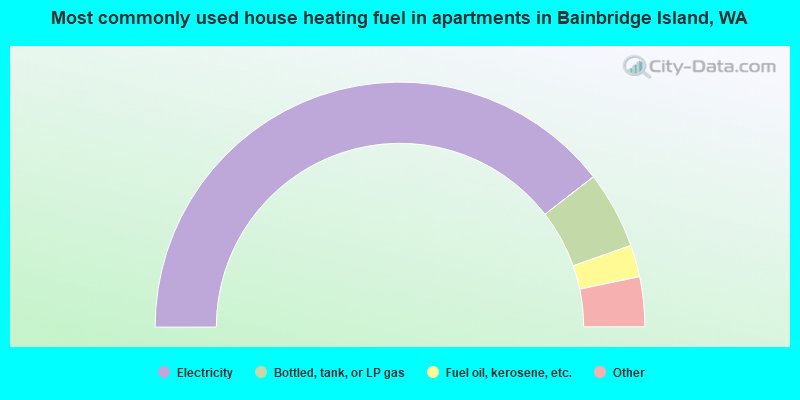
- 79.0%Electricity
- 10.2%Bottled, tank, or LP gas
- 4.2%Fuel oil, kerosene, etc.
- 1.9%Utility gas
- 1.8%No fuel used
- 1.7%Other fuel
- 1.1%Wood
Bainbridge Island compared to Washington state average:
- Median household income above state average.
- Median house value above state average.
- Unemployed percentage significantly below state average.
- Black race population percentage significantly below state average.
- Hispanic race population percentage significantly below state average.
- Median age significantly above state average.
- Foreign-born population percentage below state average.
- Renting percentage below state average.
- Length of stay since moving in above state average.
- Percentage of population with a bachelor's degree or higher significantly above state average.
Bainbridge Island on our top lists:
- #17 on the list of "Top 101 cities with the most people taking a motorcycle to work (population 5,000+)"
- #33 on the list of "Top 101 cities with the highest percentage of workers working at home, population 5,000+"
- #40 on the list of "Top 101 cities with the lowest number of robberies per 100,000 residents (population 5,000+)"
- #44 on the list of "Top 101 cities with the most people taking a ferryboat to work (population 5,000+)"
- #54 on the list of "Top 101 cities with the lowest number of police officers per 1000 residents (population 5,000+)"
- #64 on the list of "Top 101 cities with largest percentage of males in occupations: architecture and engineering occupations (population 5,000+)"
- #17 on the list of "Top 101 counties with the lowest Particulate Matter (PM2.5) Annual air pollution readings in 2012 (µg/m3)"
- #26 on the list of "Top 101 counties with the highest percentage of residents relocating from foreign countries between 2010 and 2011"
- #36 on the list of "Top 101 counties with the highest average weight of females"
- #38 on the list of "Top 101 counties with the highest percentage of residents relocating to foreign countries in 2011 (pop. 50,000+)"
- #42 on the list of "Top 101 counties with the highest percentage of residents that exercised in the past month"

|
|
Total of 1223 patent applications in 2008-2024.