Archdale, North Carolina Submit your own pictures of this city and show them to the world
OSM Map
General Map
Google Map
MSN Map
OSM Map
General Map
Google Map
MSN Map
OSM Map
General Map
Google Map
MSN Map
OSM Map
General Map
Google Map
MSN Map
Please wait while loading the map...
Population in 2022: 12,003 (100% urban, 0% rural). Population change since 2000: +33.2%Males: 5,570 Females: 6,433
March 2022 cost of living index in Archdale: 89.8 (less than average, U.S. average is 100) Percentage of residents living in poverty in 2022: 7.4%for White Non-Hispanic residents , 3.4% for Black residents , 37.2% for Hispanic or Latino residents , 81.2% for American Indian residents , 61.9% for other race residents , 8.3% for two or more races residents )
Profiles of local businesses
Business Search - 14 Million verified businesses
Data:
Median household income ($)
Median household income (% change since 2000)
Household income diversity
Ratio of average income to average house value (%)
Ratio of average income to average rent
Median household income ($) - White
Median household income ($) - Black or African American
Median household income ($) - Asian
Median household income ($) - Hispanic or Latino
Median household income ($) - American Indian and Alaska Native
Median household income ($) - Multirace
Median household income ($) - Other Race
Median household income for houses/condos with a mortgage ($)
Median household income for apartments without a mortgage ($)
Races - White alone (%)
Races - White alone (% change since 2000)
Races - Black alone (%)
Races - Black alone (% change since 2000)
Races - American Indian alone (%)
Races - American Indian alone (% change since 2000)
Races - Asian alone (%)
Races - Asian alone (% change since 2000)
Races - Hispanic (%)
Races - Hispanic (% change since 2000)
Races - Native Hawaiian and Other Pacific Islander alone (%)
Races - Native Hawaiian and Other Pacific Islander alone (% change since 2000)
Races - Two or more races (%)
Races - Two or more races (% change since 2000)
Races - Other race alone (%)
Races - Other race alone (% change since 2000)
Racial diversity
Unemployment (%)
Unemployment (% change since 2000)
Unemployment (%) - White
Unemployment (%) - Black or African American
Unemployment (%) - Asian
Unemployment (%) - Hispanic or Latino
Unemployment (%) - American Indian and Alaska Native
Unemployment (%) - Multirace
Unemployment (%) - Other Race
Population density (people per square mile)
Population - Males (%)
Population - Females (%)
Population - Males (%) - White
Population - Males (%) - Black or African American
Population - Males (%) - Asian
Population - Males (%) - Hispanic or Latino
Population - Males (%) - American Indian and Alaska Native
Population - Males (%) - Multirace
Population - Males (%) - Other Race
Population - Females (%) - White
Population - Females (%) - Black or African American
Population - Females (%) - Asian
Population - Females (%) - Hispanic or Latino
Population - Females (%) - American Indian and Alaska Native
Population - Females (%) - Multirace
Population - Females (%) - Other Race
Coronavirus confirmed cases (May 16, 2024)
Deaths caused by coronavirus (May 16, 2024)
Coronavirus confirmed cases (per 100k population) (May 16, 2024)
Deaths caused by coronavirus (per 100k population) (May 16, 2024)
Daily increase in number of cases (May 16, 2024)
Weekly increase in number of cases (May 16, 2024)
Cases doubled (in days) (May 16, 2024)
Hospitalized patients (Apr 18, 2022)
Negative test results (Apr 18, 2022)
Total test results (Apr 18, 2022)
COVID Vaccine doses distributed (per 100k population) (Sep 19, 2023)
COVID Vaccine doses administered (per 100k population) (Sep 19, 2023)
COVID Vaccine doses distributed (Sep 19, 2023)
COVID Vaccine doses administered (Sep 19, 2023)
Likely homosexual households (%)
Likely homosexual households (% change since 2000)
Likely homosexual households - Lesbian couples (%)
Likely homosexual households - Lesbian couples (% change since 2000)
Likely homosexual households - Gay men (%)
Likely homosexual households - Gay men (% change since 2000)
Cost of living index
Median gross rent ($)
Median contract rent ($)
Median monthly housing costs ($)
Median house or condo value ($)
Median house or condo value ($ change since 2000)
Mean house or condo value by units in structure - 1, detached ($)
Mean house or condo value by units in structure - 1, attached ($)
Mean house or condo value by units in structure - 2 ($)
Mean house or condo value by units in structure by units in structure - 3 or 4 ($)
Mean house or condo value by units in structure - 5 or more ($)
Mean house or condo value by units in structure - Boat, RV, van, etc. ($)
Mean house or condo value by units in structure - Mobile home ($)
Median house or condo value ($) - White
Median house or condo value ($) - Black or African American
Median house or condo value ($) - Asian
Median house or condo value ($) - Hispanic or Latino
Median house or condo value ($) - American Indian and Alaska Native
Median house or condo value ($) - Multirace
Median house or condo value ($) - Other Race
Median resident age
Resident age diversity
Median resident age - Males
Median resident age - Females
Median resident age - White
Median resident age - Black or African American
Median resident age - Asian
Median resident age - Hispanic or Latino
Median resident age - American Indian and Alaska Native
Median resident age - Multirace
Median resident age - Other Race
Median resident age - Males - White
Median resident age - Males - Black or African American
Median resident age - Males - Asian
Median resident age - Males - Hispanic or Latino
Median resident age - Males - American Indian and Alaska Native
Median resident age - Males - Multirace
Median resident age - Males - Other Race
Median resident age - Females - White
Median resident age - Females - Black or African American
Median resident age - Females - Asian
Median resident age - Females - Hispanic or Latino
Median resident age - Females - American Indian and Alaska Native
Median resident age - Females - Multirace
Median resident age - Females - Other Race
Commute - mean travel time to work (minutes)
Travel time to work - Less than 5 minutes (%)
Travel time to work - Less than 5 minutes (% change since 2000)
Travel time to work - 5 to 9 minutes (%)
Travel time to work - 5 to 9 minutes (% change since 2000)
Travel time to work - 10 to 19 minutes (%)
Travel time to work - 10 to 19 minutes (% change since 2000)
Travel time to work - 20 to 29 minutes (%)
Travel time to work - 20 to 29 minutes (% change since 2000)
Travel time to work - 30 to 39 minutes (%)
Travel time to work - 30 to 39 minutes (% change since 2000)
Travel time to work - 40 to 59 minutes (%)
Travel time to work - 40 to 59 minutes (% change since 2000)
Travel time to work - 60 to 89 minutes (%)
Travel time to work - 60 to 89 minutes (% change since 2000)
Travel time to work - 90 or more minutes (%)
Travel time to work - 90 or more minutes (% change since 2000)
Marital status - Never married (%)
Marital status - Now married (%)
Marital status - Separated (%)
Marital status - Widowed (%)
Marital status - Divorced (%)
Median family income ($)
Median family income (% change since 2000)
Median non-family income ($)
Median non-family income (% change since 2000)
Median per capita income ($)
Median per capita income (% change since 2000)
Median family income ($) - White
Median family income ($) - Black or African American
Median family income ($) - Asian
Median family income ($) - Hispanic or Latino
Median family income ($) - American Indian and Alaska Native
Median family income ($) - Multirace
Median family income ($) - Other Race
Median year house/condo built
Median year apartment built
Year house built - Built 2005 or later (%)
Year house built - Built 2000 to 2004 (%)
Year house built - Built 1990 to 1999 (%)
Year house built - Built 1980 to 1989 (%)
Year house built - Built 1970 to 1979 (%)
Year house built - Built 1960 to 1969 (%)
Year house built - Built 1950 to 1959 (%)
Year house built - Built 1940 to 1949 (%)
Year house built - Built 1939 or earlier (%)
Average household size
Household density (households per square mile)
Average household size - White
Average household size - Black or African American
Average household size - Asian
Average household size - Hispanic or Latino
Average household size - American Indian and Alaska Native
Average household size - Multirace
Average household size - Other Race
Occupied housing units (%)
Vacant housing units (%)
Owner occupied housing units (%)
Renter occupied housing units (%)
Vacancy status - For rent (%)
Vacancy status - For sale only (%)
Vacancy status - Rented or sold, not occupied (%)
Vacancy status - For seasonal, recreational, or occasional use (%)
Vacancy status - For migrant workers (%)
Vacancy status - Other vacant (%)
Residents with income below the poverty level (%)
Residents with income below 50% of the poverty level (%)
Children below poverty level (%)
Poor families by family type - Married-couple family (%)
Poor families by family type - Male, no wife present (%)
Poor families by family type - Female, no husband present (%)
Poverty status for native-born residents (%)
Poverty status for foreign-born residents (%)
Poverty among high school graduates not in families (%)
Poverty among people who did not graduate high school not in families (%)
Residents with income below the poverty level (%) - White
Residents with income below the poverty level (%) - Black or African American
Residents with income below the poverty level (%) - Asian
Residents with income below the poverty level (%) - Hispanic or Latino
Residents with income below the poverty level (%) - American Indian and Alaska Native
Residents with income below the poverty level (%) - Multirace
Residents with income below the poverty level (%) - Other Race
Air pollution - Air Quality Index (AQI)
Air pollution - CO
Air pollution - NO2
Air pollution - SO2
Air pollution - Ozone
Air pollution - PM10
Air pollution - PM25
Air pollution - Pb
Crime - Murders per 100,000 population
Crime - Rapes per 100,000 population
Crime - Robberies per 100,000 population
Crime - Assaults per 100,000 population
Crime - Burglaries per 100,000 population
Crime - Thefts per 100,000 population
Crime - Auto thefts per 100,000 population
Crime - Arson per 100,000 population
Crime - City-data.com crime index
Crime - Violent crime index
Crime - Property crime index
Crime - Murders per 100,000 population (5 year average)
Crime - Rapes per 100,000 population (5 year average)
Crime - Robberies per 100,000 population (5 year average)
Crime - Assaults per 100,000 population (5 year average)
Crime - Burglaries per 100,000 population (5 year average)
Crime - Thefts per 100,000 population (5 year average)
Crime - Auto thefts per 100,000 population (5 year average)
Crime - Arson per 100,000 population (5 year average)
Crime - City-data.com crime index (5 year average)
Crime - Violent crime index (5 year average)
Crime - Property crime index (5 year average)
1996 Presidential Elections Results (%) - Democratic Party (Clinton)
1996 Presidential Elections Results (%) - Republican Party (Dole)
1996 Presidential Elections Results (%) - Other
2000 Presidential Elections Results (%) - Democratic Party (Gore)
2000 Presidential Elections Results (%) - Republican Party (Bush)
2000 Presidential Elections Results (%) - Other
2004 Presidential Elections Results (%) - Democratic Party (Kerry)
2004 Presidential Elections Results (%) - Republican Party (Bush)
2004 Presidential Elections Results (%) - Other
2008 Presidential Elections Results (%) - Democratic Party (Obama)
2008 Presidential Elections Results (%) - Republican Party (McCain)
2008 Presidential Elections Results (%) - Other
2012 Presidential Elections Results (%) - Democratic Party (Obama)
2012 Presidential Elections Results (%) - Republican Party (Romney)
2012 Presidential Elections Results (%) - Other
2016 Presidential Elections Results (%) - Democratic Party (Clinton)
2016 Presidential Elections Results (%) - Republican Party (Trump)
2016 Presidential Elections Results (%) - Other
2020 Presidential Elections Results (%) - Democratic Party (Biden)
2020 Presidential Elections Results (%) - Republican Party (Trump)
2020 Presidential Elections Results (%) - Other
Ancestries Reported - Arab (%)
Ancestries Reported - Czech (%)
Ancestries Reported - Danish (%)
Ancestries Reported - Dutch (%)
Ancestries Reported - English (%)
Ancestries Reported - French (%)
Ancestries Reported - French Canadian (%)
Ancestries Reported - German (%)
Ancestries Reported - Greek (%)
Ancestries Reported - Hungarian (%)
Ancestries Reported - Irish (%)
Ancestries Reported - Italian (%)
Ancestries Reported - Lithuanian (%)
Ancestries Reported - Norwegian (%)
Ancestries Reported - Polish (%)
Ancestries Reported - Portuguese (%)
Ancestries Reported - Russian (%)
Ancestries Reported - Scotch-Irish (%)
Ancestries Reported - Scottish (%)
Ancestries Reported - Slovak (%)
Ancestries Reported - Subsaharan African (%)
Ancestries Reported - Swedish (%)
Ancestries Reported - Swiss (%)
Ancestries Reported - Ukrainian (%)
Ancestries Reported - United States (%)
Ancestries Reported - Welsh (%)
Ancestries Reported - West Indian (%)
Ancestries Reported - Other (%)
Educational Attainment - No schooling completed (%)
Educational Attainment - Less than high school (%)
Educational Attainment - High school or equivalent (%)
Educational Attainment - Less than 1 year of college (%)
Educational Attainment - 1 or more years of college (%)
Educational Attainment - Associate degree (%)
Educational Attainment - Bachelor's degree (%)
Educational Attainment - Master's degree (%)
Educational Attainment - Professional school degree (%)
Educational Attainment - Doctorate degree (%)
School Enrollment - Nursery, preschool (%)
School Enrollment - Kindergarten (%)
School Enrollment - Grade 1 to 4 (%)
School Enrollment - Grade 5 to 8 (%)
School Enrollment - Grade 9 to 12 (%)
School Enrollment - College undergrad (%)
School Enrollment - Graduate or professional (%)
School Enrollment - Not enrolled in school (%)
School enrollment - Public schools (%)
School enrollment - Private schools (%)
School enrollment - Not enrolled (%)
Median number of rooms in houses and condos
Median number of rooms in apartments
Housing units lacking complete plumbing facilities (%)
Housing units lacking complete kitchen facilities (%)
Density of houses
Urban houses (%)
Rural houses (%)
Households with people 60 years and over (%)
Households with people 65 years and over (%)
Households with people 75 years and over (%)
Households with one or more nonrelatives (%)
Households with no nonrelatives (%)
Population in households (%)
Family households (%)
Nonfamily households (%)
Population in families (%)
Family households with own children (%)
Median number of bedrooms in owner occupied houses
Mean number of bedrooms in owner occupied houses
Median number of bedrooms in renter occupied houses
Mean number of bedrooms in renter occupied houses
Median number of vehichles in owner occupied houses
Mean number of vehichles in owner occupied houses
Median number of vehichles in renter occupied houses
Mean number of vehichles in renter occupied houses
Mortgage status - with mortgage (%)
Mortgage status - with second mortgage (%)
Mortgage status - with home equity loan (%)
Mortgage status - with both second mortgage and home equity loan (%)
Mortgage status - without a mortgage (%)
Average family size
Average family size - White
Average family size - Black or African American
Average family size - Asian
Average family size - Hispanic or Latino
Average family size - American Indian and Alaska Native
Average family size - Multirace
Average family size - Other Race
Geographical mobility - Same house 1 year ago (%)
Geographical mobility - Moved within same county (%)
Geographical mobility - Moved from different county within same state (%)
Geographical mobility - Moved from different state (%)
Geographical mobility - Moved from abroad (%)
Place of birth - Born in state of residence (%)
Place of birth - Born in other state (%)
Place of birth - Native, outside of US (%)
Place of birth - Foreign born (%)
Housing units in structures - 1, detached (%)
Housing units in structures - 1, attached (%)
Housing units in structures - 2 (%)
Housing units in structures - 3 or 4 (%)
Housing units in structures - 5 to 9 (%)
Housing units in structures - 10 to 19 (%)
Housing units in structures - 20 to 49 (%)
Housing units in structures - 50 or more (%)
Housing units in structures - Mobile home (%)
Housing units in structures - Boat, RV, van, etc. (%)
House/condo owner moved in on average (years ago)
Renter moved in on average (years ago)
Year householder moved into unit - Moved in 1999 to March 2000 (%)
Year householder moved into unit - Moved in 1995 to 1998 (%)
Year householder moved into unit - Moved in 1990 to 1994 (%)
Year householder moved into unit - Moved in 1980 to 1989 (%)
Year householder moved into unit - Moved in 1970 to 1979 (%)
Year householder moved into unit - Moved in 1969 or earlier (%)
Means of transportation to work - Drove car alone (%)
Means of transportation to work - Carpooled (%)
Means of transportation to work - Public transportation (%)
Means of transportation to work - Bus or trolley bus (%)
Means of transportation to work - Streetcar or trolley car (%)
Means of transportation to work - Subway or elevated (%)
Means of transportation to work - Railroad (%)
Means of transportation to work - Ferryboat (%)
Means of transportation to work - Taxicab (%)
Means of transportation to work - Motorcycle (%)
Means of transportation to work - Bicycle (%)
Means of transportation to work - Walked (%)
Means of transportation to work - Other means (%)
Working at home (%)
Industry diversity
Most Common Industries - Agriculture, forestry, fishing and hunting, and mining (%)
Most Common Industries - Agriculture, forestry, fishing and hunting (%)
Most Common Industries - Mining, quarrying, and oil and gas extraction (%)
Most Common Industries - Construction (%)
Most Common Industries - Manufacturing (%)
Most Common Industries - Wholesale trade (%)
Most Common Industries - Retail trade (%)
Most Common Industries - Transportation and warehousing, and utilities (%)
Most Common Industries - Transportation and warehousing (%)
Most Common Industries - Utilities (%)
Most Common Industries - Information (%)
Most Common Industries - Finance and insurance, and real estate and rental and leasing (%)
Most Common Industries - Finance and insurance (%)
Most Common Industries - Real estate and rental and leasing (%)
Most Common Industries - Professional, scientific, and management, and administrative and waste management services (%)
Most Common Industries - Professional, scientific, and technical services (%)
Most Common Industries - Management of companies and enterprises (%)
Most Common Industries - Administrative and support and waste management services (%)
Most Common Industries - Educational services, and health care and social assistance (%)
Most Common Industries - Educational services (%)
Most Common Industries - Health care and social assistance (%)
Most Common Industries - Arts, entertainment, and recreation, and accommodation and food services (%)
Most Common Industries - Arts, entertainment, and recreation (%)
Most Common Industries - Accommodation and food services (%)
Most Common Industries - Other services, except public administration (%)
Most Common Industries - Public administration (%)
Occupation diversity
Most Common Occupations - Management, business, science, and arts occupations (%)
Most Common Occupations - Management, business, and financial occupations (%)
Most Common Occupations - Management occupations (%)
Most Common Occupations - Business and financial operations occupations (%)
Most Common Occupations - Computer, engineering, and science occupations (%)
Most Common Occupations - Computer and mathematical occupations (%)
Most Common Occupations - Architecture and engineering occupations (%)
Most Common Occupations - Life, physical, and social science occupations (%)
Most Common Occupations - Education, legal, community service, arts, and media occupations (%)
Most Common Occupations - Community and social service occupations (%)
Most Common Occupations - Legal occupations (%)
Most Common Occupations - Education, training, and library occupations (%)
Most Common Occupations - Arts, design, entertainment, sports, and media occupations (%)
Most Common Occupations - Healthcare practitioners and technical occupations (%)
Most Common Occupations - Health diagnosing and treating practitioners and other technical occupations (%)
Most Common Occupations - Health technologists and technicians (%)
Most Common Occupations - Service occupations (%)
Most Common Occupations - Healthcare support occupations (%)
Most Common Occupations - Protective service occupations (%)
Most Common Occupations - Fire fighting and prevention, and other protective service workers including supervisors (%)
Most Common Occupations - Law enforcement workers including supervisors (%)
Most Common Occupations - Food preparation and serving related occupations (%)
Most Common Occupations - Building and grounds cleaning and maintenance occupations (%)
Most Common Occupations - Personal care and service occupations (%)
Most Common Occupations - Sales and office occupations (%)
Most Common Occupations - Sales and related occupations (%)
Most Common Occupations - Office and administrative support occupations (%)
Most Common Occupations - Natural resources, construction, and maintenance occupations (%)
Most Common Occupations - Farming, fishing, and forestry occupations (%)
Most Common Occupations - Construction and extraction occupations (%)
Most Common Occupations - Installation, maintenance, and repair occupations (%)
Most Common Occupations - Production, transportation, and material moving occupations (%)
Most Common Occupations - Production occupations (%)
Most Common Occupations - Transportation occupations (%)
Most Common Occupations - Material moving occupations (%)
People in Group quarters - Institutionalized population (%)
People in Group quarters - Correctional institutions (%)
People in Group quarters - Federal prisons and detention centers (%)
People in Group quarters - Halfway houses (%)
People in Group quarters - Local jails and other confinement facilities (including police lockups) (%)
People in Group quarters - Military disciplinary barracks (%)
People in Group quarters - State prisons (%)
People in Group quarters - Other types of correctional institutions (%)
People in Group quarters - Nursing homes (%)
People in Group quarters - Hospitals/wards, hospices, and schools for the handicapped (%)
People in Group quarters - Hospitals/wards and hospices for chronically ill (%)
People in Group quarters - Hospices or homes for chronically ill (%)
People in Group quarters - Military hospitals or wards for chronically ill (%)
People in Group quarters - Other hospitals or wards for chronically ill (%)
People in Group quarters - Hospitals or wards for drug/alcohol abuse (%)
People in Group quarters - Mental (Psychiatric) hospitals or wards (%)
People in Group quarters - Schools, hospitals, or wards for the mentally retarded (%)
People in Group quarters - Schools, hospitals, or wards for the physically handicapped (%)
People in Group quarters - Institutions for the deaf (%)
People in Group quarters - Institutions for the blind (%)
People in Group quarters - Orthopedic wards and institutions for the physically handicapped (%)
People in Group quarters - Wards in general hospitals for patients who have no usual home elsewhere (%)
People in Group quarters - Wards in military hospitals for patients who have no usual home elsewhere (%)
People in Group quarters - Juvenile institutions (%)
People in Group quarters - Long-term care (%)
People in Group quarters - Homes for abused, dependent, and neglected children (%)
People in Group quarters - Residential treatment centers for emotionally disturbed children (%)
People in Group quarters - Training schools for juvenile delinquents (%)
People in Group quarters - Short-term care, detention or diagnostic centers for delinquent children (%)
People in Group quarters - Type of juvenile institution unknown (%)
People in Group quarters - Noninstitutionalized population (%)
People in Group quarters - College dormitories (includes college quarters off campus) (%)
People in Group quarters - Military quarters (%)
People in Group quarters - On base (%)
People in Group quarters - Barracks, unaccompanied personnel housing (UPH), (Enlisted/Officer), ;and similar group living quarters for military personnel (%)
People in Group quarters - Transient quarters for temporary residents (%)
People in Group quarters - Military ships (%)
People in Group quarters - Group homes (%)
People in Group quarters - Homes or halfway houses for drug/alcohol abuse (%)
People in Group quarters - Homes for the mentally ill (%)
People in Group quarters - Homes for the mentally retarded (%)
People in Group quarters - Homes for the physically handicapped (%)
People in Group quarters - Other group homes (%)
People in Group quarters - Religious group quarters (%)
People in Group quarters - Dormitories (%)
People in Group quarters - Agriculture workers' dormitories on farms (%)
People in Group quarters - Job Corps and vocational training facilities (%)
People in Group quarters - Other workers' dormitories (%)
People in Group quarters - Crews of maritime vessels (%)
People in Group quarters - Other nonhousehold living situations (%)
People in Group quarters - Other noninstitutional group quarters (%)
Residents speaking English at home (%)
Residents speaking English at home - Born in the United States (%)
Residents speaking English at home - Native, born elsewhere (%)
Residents speaking English at home - Foreign born (%)
Residents speaking Spanish at home (%)
Residents speaking Spanish at home - Born in the United States (%)
Residents speaking Spanish at home - Native, born elsewhere (%)
Residents speaking Spanish at home - Foreign born (%)
Residents speaking other language at home (%)
Residents speaking other language at home - Born in the United States (%)
Residents speaking other language at home - Native, born elsewhere (%)
Residents speaking other language at home - Foreign born (%)
Class of Workers - Employee of private company (%)
Class of Workers - Self-employed in own incorporated business (%)
Class of Workers - Private not-for-profit wage and salary workers (%)
Class of Workers - Local government workers (%)
Class of Workers - State government workers (%)
Class of Workers - Federal government workers (%)
Class of Workers - Self-employed workers in own not incorporated business and Unpaid family workers (%)
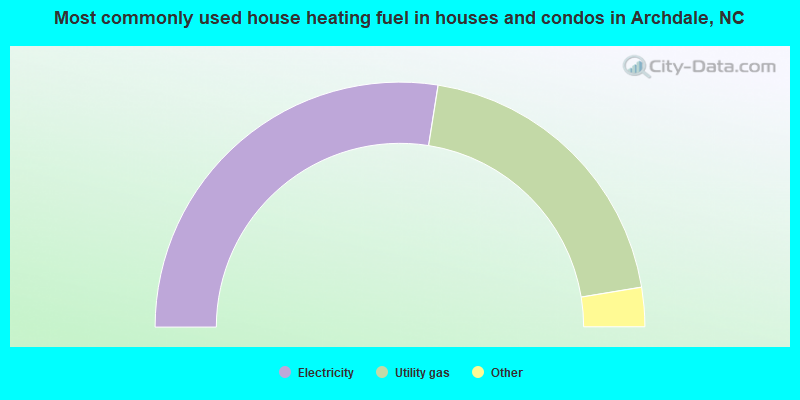
House heating fuel used in houses and condos - Utility gas (%)
House heating fuel used in houses and condos - Bottled, tank, or LP gas (%)
House heating fuel used in houses and condos - Electricity (%)
House heating fuel used in houses and condos - Fuel oil, kerosene, etc. (%)
House heating fuel used in houses and condos - Coal or coke (%)
House heating fuel used in houses and condos - Wood (%)
House heating fuel used in houses and condos - Solar energy (%)
House heating fuel used in houses and condos - Other fuel (%)
House heating fuel used in houses and condos - No fuel used (%)
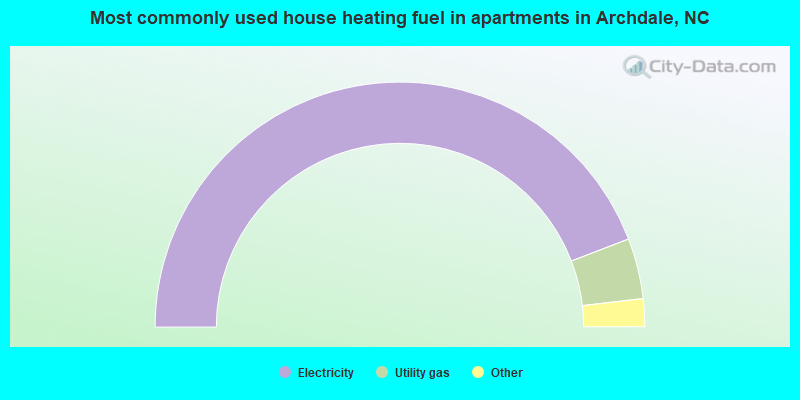
House heating fuel used in apartments - Utility gas (%)
House heating fuel used in apartments - Bottled, tank, or LP gas (%)
House heating fuel used in apartments - Electricity (%)
House heating fuel used in apartments - Fuel oil, kerosene, etc. (%)
House heating fuel used in apartments - Coal or coke (%)
House heating fuel used in apartments - Wood (%)
House heating fuel used in apartments - Solar energy (%)
House heating fuel used in apartments - Other fuel (%)
House heating fuel used in apartments - No fuel used (%)
Armed forces status - In Armed Forces (%)
Armed forces status - Civilian (%)
Armed forces status - Civilian - Veteran (%)
Armed forces status - Civilian - Nonveteran (%)
Fatal accidents locations in years 2005-2021
Fatal accidents locations in 2005
Fatal accidents locations in 2006
Fatal accidents locations in 2007
Fatal accidents locations in 2008
Fatal accidents locations in 2009
Fatal accidents locations in 2010
Fatal accidents locations in 2011
Fatal accidents locations in 2012
Fatal accidents locations in 2013
Fatal accidents locations in 2014
Fatal accidents locations in 2015
Fatal accidents locations in 2016
Fatal accidents locations in 2017
Fatal accidents locations in 2018
Fatal accidents locations in 2019
Fatal accidents locations in 2020
Fatal accidents locations in 2021
Alcohol use - People drinking some alcohol every month (%)
Alcohol use - People not drinking at all (%)
Alcohol use - Average days/month drinking alcohol
Alcohol use - Average drinks/week
Alcohol use - Average days/year people drink much
Audiometry - Average condition of hearing (%)
Audiometry - People that can hear a whisper from across a quiet room (%)
Audiometry - People that can hear normal voice from across a quiet room (%)
Audiometry - Ears ringing, roaring, buzzing (%)
Audiometry - Had a job exposure to loud noise (%)
Audiometry - Had off-work exposure to loud noise (%)
Blood Pressure & Cholesterol - Has high blood pressure (%)
Blood Pressure & Cholesterol - Checking blood pressure at home (%)
Blood Pressure & Cholesterol - Frequently checking blood cholesterol (%)
Blood Pressure & Cholesterol - Has high cholesterol level (%)
Consumer Behavior - Money monthly spent on food at supermarket/grocery store
Consumer Behavior - Money monthly spent on food at other stores
Consumer Behavior - Money monthly spent on eating out
Consumer Behavior - Money monthly spent on carryout/delivered foods
Consumer Behavior - Income spent on food at supermarket/grocery store (%)
Consumer Behavior - Income spent on food at other stores (%)
Consumer Behavior - Income spent on eating out (%)
Consumer Behavior - Income spent on carryout/delivered foods (%)
Current Health Status - General health condition (%)
Current Health Status - Blood donors (%)
Current Health Status - Has blood ever tested for HIV virus (%)
Current Health Status - Left-handed people (%)
Dermatology - People using sunscreen (%)
Diabetes - Diabetics (%)
Diabetes - Had a blood test for high blood sugar (%)
Diabetes - People taking insulin (%)
Diet Behavior & Nutrition - Diet health (%)
Diet Behavior & Nutrition - Milk product consumption (# of products/month)
Diet Behavior & Nutrition - Meals not home prepared (#/week)
Diet Behavior & Nutrition - Meals from fast food or pizza place (#/week)
Diet Behavior & Nutrition - Ready-to-eat foods (#/month)
Diet Behavior & Nutrition - Frozen meals/pizza (#/month)
Drug Use - People that ever used marijuana or hashish (%)
Drug Use - Ever used hard drugs (%)
Drug Use - Ever used any form of cocaine (%)
Drug Use - Ever used heroin (%)
Drug Use - Ever used methamphetamine (%)
Health Insurance - People covered by health insurance (%)
Kidney Conditions-Urology - Avg. # of times urinating at night
Medical Conditions - People with asthma (%)
Medical Conditions - People with anemia (%)
Medical Conditions - People with psoriasis (%)
Medical Conditions - People with overweight (%)
Medical Conditions - Elderly people having difficulties in thinking or remembering (%)
Medical Conditions - People who ever received blood transfusion (%)
Medical Conditions - People having trouble seeing even with glass/contacts (%)
Medical Conditions - People with arthritis (%)
Medical Conditions - People with gout (%)
Medical Conditions - People with congestive heart failure (%)
Medical Conditions - People with coronary heart disease (%)
Medical Conditions - People with angina pectoris (%)
Medical Conditions - People who ever had heart attack (%)
Medical Conditions - People who ever had stroke (%)
Medical Conditions - People with emphysema (%)
Medical Conditions - People with thyroid problem (%)
Medical Conditions - People with chronic bronchitis (%)
Medical Conditions - People with any liver condition (%)
Medical Conditions - People who ever had cancer or malignancy (%)
Mental Health - People who have little interest in doing things (%)
Mental Health - People feeling down, depressed, or hopeless (%)
Mental Health - People who have trouble sleeping or sleeping too much (%)
Mental Health - People feeling tired or having little energy (%)
Mental Health - People with poor appetite or overeating (%)
Mental Health - People feeling bad about themself (%)
Mental Health - People who have trouble concentrating on things (%)
Mental Health - People moving or speaking slowly or too fast (%)
Mental Health - People having thoughts they would be better off dead (%)
Oral Health - Average years since last visit a dentist
Oral Health - People embarrassed because of mouth (%)
Oral Health - People with gum disease (%)
Oral Health - General health of teeth and gums (%)
Oral Health - Average days a week using dental floss/device
Oral Health - Average days a week using mouthwash for dental problem
Oral Health - Average number of teeth
Pesticide Use - Households using pesticides to control insects (%)
Pesticide Use - Households using pesticides to kill weeds (%)
Physical Activity - People doing vigorous-intensity work activities (%)
Physical Activity - People doing moderate-intensity work activities (%)
Physical Activity - People walking or bicycling (%)
Physical Activity - People doing vigorous-intensity recreational activities (%)
Physical Activity - People doing moderate-intensity recreational activities (%)
Physical Activity - Average hours a day doing sedentary activities
Physical Activity - Average hours a day watching TV or videos
Physical Activity - Average hours a day using computer
Physical Functioning - People having limitations keeping them from working (%)
Physical Functioning - People limited in amount of work they can do (%)
Physical Functioning - People that need special equipment to walk (%)
Physical Functioning - People experiencing confusion/memory problems (%)
Physical Functioning - People requiring special healthcare equipment (%)
Prescription Medications - Average number of prescription medicines taking
Preventive Aspirin Use - Adults 40+ taking low-dose aspirin (%)
Reproductive Health - Vaginal deliveries (%)
Reproductive Health - Cesarean deliveries (%)
Reproductive Health - Deliveries resulted in a live birth (%)
Reproductive Health - Pregnancies resulted in a delivery (%)
Reproductive Health - Women breastfeeding newborns (%)
Reproductive Health - Women that had a hysterectomy (%)
Reproductive Health - Women that had both ovaries removed (%)
Reproductive Health - Women that have ever taken birth control pills (%)
Reproductive Health - Women taking birth control pills (%)
Reproductive Health - Women that have ever used Depo-Provera or injectables (%)
Reproductive Health - Women that have ever used female hormones (%)
Sexual Behavior - People 18+ that ever had sex (vaginal, anal, or oral) (%)
Sexual Behavior - Males 18+ that ever had vaginal sex with a woman (%)
Sexual Behavior - Males 18+ that ever performed oral sex on a woman (%)
Sexual Behavior - Males 18+ that ever had anal sex with a woman (%)
Sexual Behavior - Males 18+ that ever had any sex with a man (%)
Sexual Behavior - Females 18+ that ever had vaginal sex with a man (%)
Sexual Behavior - Females 18+ that ever performed oral sex on a man (%)
Sexual Behavior - Females 18+ that ever had anal sex with a man (%)
Sexual Behavior - Females 18+ that ever had any kind of sex with a woman (%)
Sexual Behavior - Average age people first had sex
Sexual Behavior - Average number of female sex partners in lifetime (males 18+)
Sexual Behavior - Average number of female vaginal sex partners in lifetime (males 18+)
Sexual Behavior - Average age people first performed oral sex on a woman (18+)
Sexual Behavior - Average number of woman performed oral sex on in lifetime (18+)
Sexual Behavior - Average number of male sex partners in lifetime (males 18+)
Sexual Behavior - Average number of male anal sex partners in lifetime (males 18+)
Sexual Behavior - Average age people first performed oral sex on a man (18+)
Sexual Behavior - Average number of male oral sex partners in lifetime (18+)
Sexual Behavior - People using protection when performing oral sex (%)
Sexual Behavior - Average number of times people have vaginal or anal sex a year
Sexual Behavior - People having sex without condom (%)
Sexual Behavior - Average number of male sex partners in lifetime (females 18+)
Sexual Behavior - Average number of male vaginal sex partners in lifetime (females 18+)
Sexual Behavior - Average number of female sex partners in lifetime (females 18+)
Sexual Behavior - Circumcised males 18+ (%)
Sleep Disorders - Average hours sleeping at night
Sleep Disorders - People that has trouble sleeping (%)
Smoking-Cigarette Use - People smoking cigarettes (%)
Taste & Smell - People 40+ having problems with smell (%)
Taste & Smell - People 40+ having problems with taste (%)
Taste & Smell - People 40+ that ever had wisdom teeth removed (%)
Taste & Smell - People 40+ that ever had tonsils teeth removed (%)
Taste & Smell - People 40+ that ever had a loss of consciousness because of a head injury (%)
Taste & Smell - People 40+ that ever had a broken nose or other serious injury to face or skull (%)
Taste & Smell - People 40+ that ever had two or more sinus infections (%)
Weight - Average height (inches)
Weight - Average weight (pounds)
Weight - Average BMI
Weight - People that are obese (%)
Weight - People that ever were obese (%)
Weight - People trying to lose weight (%)
Officers per 1,000 residents here:
2.42North Carolina average:
2.27
Latest news from Archdale, NC collected exclusively by city-data.com from local newspapers, TV, and radio stations
Ancestries: American (14.3%), English (11.0%), Irish (6.5%), Scotch-Irish (5.4%), German (5.1%), European (4.2%).
Current Local Time:
Land area: 7.83 square miles.
Population density: 1,534 people per square mile (low).
790 residents are foreign born (3.2% Asia , 1.7% Latin America , 1.1% Europe ).
This city:
6.6%North Carolina:
8.3%
Median real estate property taxes paid for housing units with mortgages in 2022: $1,505 (0.8%)Median real estate property taxes paid for housing units with no mortgage in 2022: $1,522 (0.8%)
Nearest city with pop. 50,000+: High Point, NC
Nearest city with pop. 200,000+: Greensboro, NC
Nearest city with pop. 1,000,000+: Philadelphia, PA
Nearest cities:
Latitude: 35.90 N, Longitude: 79.97 W
Daytime population change due to commuting: -1,517 (-12.6%)Workers who live and work in this city: 989 (15.9%)
Area code commonly used in this area: 336
Property values in Archdale, NC
Unemployment in December 2023: Here:
3.3%North Carolina:
3.2%
Population change in the 1990s: +1,633 (+22.1%).
Most common occupations in Archdale, NC (%)
Both Males Females
Other production occupations, including supervisors (7.1%)
Driver/sales workers and truck drivers (5.6%)
Other office and administrative support workers, including supervisors (4.1%)
Material recording, scheduling, dispatching, and distributing workers (4.1%)
Textile, apparel, and furnishings workers (3.7%)
Other sales and related occupations, including supervisors (3.5%)
Metal workers and plastic workers (3.4%)
Driver/sales workers and truck drivers (10.5%)
Other production occupations, including supervisors (9.0%)
Metal workers and plastic workers (5.1%)
Material recording, scheduling, dispatching, and distributing workers (4.5%)
Electrical equipment mechanics and other installation, maintenance, and repair workers, including supervisors (4.0%)
Other management occupations, except farmers and farm managers (3.7%)
Sales representatives, services, wholesale and manufacturing (3.5%)
Other office and administrative support workers, including supervisors (6.8%)
Information and record clerks, except customer service representatives (5.3%)
Secretaries and administrative assistants (5.3%)
Customer service representatives (5.3%)
Cashiers (5.1%)
Other production occupations, including supervisors (5.1%)
Textile, apparel, and furnishings workers (4.6%)
Tornado activity:
Archdale-area historical tornado activity is near North Carolina state average. It is 17% smaller than the overall U.S. average.
On 5/22/1985, a category F3 (max. wind speeds 158-206 mph) tornado 18.3 miles away from the Archdale city center caused between $500,000 and $5,000,000 in damages.
On 10/7/1965, a category F3 tornado 19.2 miles away from the city center killed one person and injured 4 people and caused between $5000 and $50,000 in damages.
Earthquake activity:
Archdale-area historical earthquake activity is significantly above North Carolina state average. It is 31% smaller than the overall U.S. average. On 8/23/2011 at 17:51:04, a magnitude 5.8 (5.8 MW, Depth: 3.7 mi, Class: Moderate, Intensity: VI - VII) earthquake occurred 178.4 miles away from the city center On 8/9/2020 at 12:07:37, a magnitude 5.1 (5.1 MW, Depth: 4.7 mi) earthquake occurred 74.3 miles away from Archdale center On 8/2/1974 at 08:52:09, a magnitude 4.9 (4.3 MB, 4.9 LG, Class: Light, Intensity: IV - V) earthquake occurred 200.5 miles away from the city center On 7/27/1980 at 18:52:21, a magnitude 5.2 (5.1 MB, 4.7 MS, 5.0 UK, 5.2 UK) earthquake occurred 271.1 miles away from the city center On 12/9/2003 at 20:59:14, a magnitude 4.5 (4.5 MB, 4.5 LG) earthquake occurred 163.2 miles away from Archdale center On 12/9/2003 at 20:59:18, a magnitude 4.5 (4.5 ML, Depth: 6.2 mi) earthquake occurred 165.5 miles away from the city center Magnitude types: regional Lg-wave magnitude (LG), body-wave magnitude (MB), local magnitude (ML), surface-wave magnitude (MS), moment magnitude (MW) Natural disasters: The number of natural disasters in Randolph County (16) is near the US average (15).Major Disasters (Presidential) Declared: 8Emergencies Declared: 4Hurricanes: 7, Floods: 2, Storms: 2, Winter Storms: 2, Blizzard: 1, Drought: 1, Ice Storm: 1, Tornado: 1, Tropical Storm: 1, Other: 1 (Note: some incidents may be assigned to more than one category). Hospitals and medical centers in Archdale: WESTWOOD HEALTH AND REHABILITA (625 ASHLAND STREET)
Other hospitals and medical centers near Archdale: THE GRAYBRIER NURS AND RETIREMENT CT (Nursing Home, about 2 miles away; TRINITY, NC)
WESLEYAN ARMS INC (Nursing Home, about 4 miles away; HIGH POINT, NC)
HIGH POINT KIDNEY CENTER OF WAKE FOREST UNIVERSITY (Dialysis Facility, about 5 miles away; HIGH POINT, NC)
CARE CONNECTION (Home Health Center, about 5 miles away; HIGH POINT, NC)
WESTCHESTER MANOR AT PROVIDENCE PLACE (Nursing Home, about 5 miles away; HIGH POINT, NC)
HIGH POINT REGIONAL HOSPITAL (about 5 miles away; HIGH POINT, NC)
HOME HEALTH PROFESSIONALS (Home Health Center, about 5 miles away; HIGH POINT, NC)
Amtrak stations near Archdale: 5 miles: HIGH POINT (100 W. HIGH ST.) Services: partially wheelchair accessible, enclosed waiting area, public restrooms, public payphones, vending machines, paid short-term parking, paid long-term parking, call for car rental service, call for taxi service, public transit connection.
14 miles: GREENSBORO (2603 OAKLAND AVE.) Services: ticket office, fully wheelchair accessible, enclosed waiting area, public restrooms, public payphones, vending machines, free short-term parking, free long-term parking, call for car rental service, call for taxi service.
Colleges/universities with over 2000 students nearest to Archdale:
High Point University (about 6 miles; High Point, NC ; Full-time enrollment: 4,240)
Guilford Technical Community College (about 7 miles; Jamestown, NC ; FT enrollment: 13,068)
Davidson County Community College (about 13 miles; Thomasville, NC ; FT enrollment: 3,581)
Guilford College (about 14 miles; Greensboro, NC ; FT enrollment: 2,211)
University of North Carolina at Greensboro (about 15 miles; Greensboro, NC ; FT enrollment: 16,174)
North Carolina A & T State University (about 17 miles; Greensboro, NC ; FT enrollment: 9,805)
Randolph Community College (about 18 miles; Asheboro, NC ; FT enrollment: 2,528)
Private high school in Archdale: MOUNT CALVARY CHRISTIAN SCHOOL Students: 86, Location: 6551 WEANT RD, Grades: KG-12)
Public elementary/middle schools in Archdale:
See full list of schools located in Archdale User-submitted facts and corrections:
Kindred Hospital Greensboro is/was a long-term care facility. Moses Cone Health System in Greensboro and Wake Forest University Baptist Medical Center in Winston-Salem are the major hospitals, in addition to High Point Regional, near Archdale, NC.
Birthplace of: Jimmie Lewallen - Racing driver.
Randolph County has a predicted average indoor radon screening level less than 2 pCi/L (pico curies per liter) - Low Potential Drinking water stations with addresses in Archdale and their reported violations in the past:
ARCHDALE, CITY OF (Population served: 12,200, Purch surface water):
Past health violations:
MCL, Average - Between JUL-2009 and SEP-2009, Contaminant: Total Haloacetic Acids (HAA5). Follow-up actions: St AO (w/o penalty) issued (APR-03-2009), St Public Notif requested (NOV-20-2009), St Formal NOV issued (NOV-20-2009), St Compliance achieved (NOV-23-2010)
MCL, Average - Between APR-2009 and JUN-2009, Contaminant: Total Haloacetic Acids (HAA5). Follow-up actions: St AO (w/o penalty) issued (APR-03-2009), St Public Notif requested (OCT-30-2009), St Formal NOV issued (OCT-30-2009), St Compliance achieved (NOV-23-2010)
MCL, Average - Between JAN-2009 and MAR-2009, Contaminant: Total Haloacetic Acids (HAA5). Follow-up actions: St AO (w/o penalty) issued (APR-03-2009), St Public Notif received (JUN-02-2009), St Public Notif requested (JUL-23-2009), St Formal NOV issued (JUL-23-2009), St Compliance achieved (NOV-23-2010)
MCL, Average - Between OCT-2008 and DEC-2008, Contaminant: Total Haloacetic Acids (HAA5). Follow-up actions: St Public Notif received (DEC-01-2008), St Public Notif requested (APR-03-2009), St Formal NOV issued (APR-03-2009), St AO (w/o penalty) issued (APR-03-2009), St Compliance achieved (NOV-23-2010)
OCCT/SOWT Study/Recommendation - In APR-02-2007, Contaminant: Lead and Copper Rule. Follow-up actions: St Public Notif requested (JUL-24-2007), St Formal NOV issued (JUL-24-2007), St Public Notif received (AUG-01-2007), St Compliance achieved (OCT-05-2007)
MCL, Monthly (TCR) - In MAR-2007, Contaminant: Coliform. Follow-up actions: St Public Notif requested (MAR-21-2007), St Formal NOV issued (MAR-21-2007), St AO (w/o penalty) issued (MAR-21-2007), St Public Notif received (APR-20-2007), St Compliance achieved (AUG-30-2010)
6 other older health violations
Past monitoring violations:
Monitoring and Reporting (DBP) - Between OCT-2006 and DEC-2006, Contaminant: Chlorine. Follow-up actions: St Compliance achieved (NOV-15-2006), St Public Notif requested (FEB-07-2007), St Formal NOV issued (FEB-07-2007), St Public Notif received (APR-20-2007)
2 minor monitoring violations
Population served: 25, Groundwater):
Past health violations:
MCL, Monthly (TCR) - Between JAN-2014 and MAR-2014, Contaminant: Coliform. Follow-up actions: St Public Notif requested (JAN-24-2014), St Formal NOV issued (JAN-24-2014), St AO (w/o penalty) issued (JAN-24-2014), St Compliance achieved (FEB-28-2014), St Public Notif received (JUN-19-2014)
MCL, Monthly (TCR) - In SEP-2008, Contaminant: Coliform. Follow-up actions: St Public Notif requested (SEP-28-2008), St Formal NOV issued (SEP-28-2008), St Public Notif received (OCT-17-2008), St Compliance achieved (AUG-30-2010)
MCL, Monthly (TCR) - In AUG-2008, Contaminant: Coliform. Follow-up actions: St Public Notif requested (AUG-20-2008), St Formal NOV issued (AUG-20-2008), St Compliance achieved (AUG-30-2010)
MCL, Monthly (TCR) - Between JUL-2006 and SEP-2006, Contaminant: Coliform. Follow-up actions: St Public Notif requested (JUL-20-2006), St Formal NOV issued (JUL-20-2006), St Public Notif received (JUL-23-2006), St Compliance achieved (AUG-30-2010)
MCL, Monthly (TCR) - Between JAN-2006 and MAR-2006, Contaminant: Coliform. Follow-up actions: St Public Notif requested (JAN-23-2006), St Formal NOV issued (JAN-23-2006), St Public Notif received (FEB-17-2006), St Compliance achieved (AUG-30-2010)
Population served: 25, Groundwater):
Past health violations:
MCL, Monthly (TCR) - Between JUL-2007 and SEP-2007, Contaminant: Coliform. Follow-up actions: St Public Notif requested (AUG-01-2007), St Formal NOV issued (AUG-01-2007), St Public Notif received (AUG-21-2007), St Compliance achieved (AUG-30-2010)
MCL, Single Sample - Between JAN-2006 and DEC-2006, Contaminant: Nitrate. Follow-up actions: St Public Notif requested (JAN-20-2006), St Formal NOV issued (JAN-20-2006), St Tech Assistance Visit (JAN-20-2006), St Public Notif received (JAN-28-2006), St Compliance achieved (JAN-24-2007)
Past monitoring violations:
One routine major monitoring violation
Average household size: This city:
2.5 peopleNorth Carolina:
2.5 people
Percentage of family households: This city:
68.9%Whole state:
66.7%
Percentage of households with unmarried partners: This city:
4.9%Whole state:
5.9%
Likely homosexual households (counted as self-reported same-sex unmarried-partner households)
Lesbian couples: 0.2% of all households Gay men: 0.4% of all households
217 people in nursing facilities/skilled-nursing facilities in 2010people in emergency and transitional shelters (with sleeping facilities) for people experiencing homelessness in 2010people in nursing homes in 2000
Banks with branches in Archdale (2011 data):
Communityone Bank, National Association: Archdale Branch at 10108 South Main Street, branch established on 1986/12/31. Info updated 2007/12/11: Bank assets: $1,666.0 mil, Deposits: $1,443.4 mil, headquarters in Asheboro, NC, negative income in the last year , 46 total offices , Holding Company: Fnb United Corp.
NewBridge Bank: Archdale Branch at 10401 North Main Street, branch established on 2003/05/12. Info updated 2012/03/07: Bank assets: $1,733.4 mil, Deposits: $1,423.7 mil, headquarters in Greensboro, NC, positive income , Commercial Lending Specialization, 31 total offices , Holding Company: Newbridge Bancorp
Wells Fargo Bank, National Association: Archdale Branch at 11245 North Main Street, branch established on 1973/05/15. Info updated 2011/04/05: Bank assets: $1,161,490.0 mil, Deposits: $905,653.0 mil, headquarters in Sioux Falls, SD, positive income , 6395 total offices , Holding Company: Wells Fargo & Company
First Bank: Archdale Branch at 10901 N Main Street, branch established on 1979/06/04. Info updated 2011/01/25: Bank assets: $3,289.4 mil, Deposits: $2,759.1 mil, headquarters in Troy, NC, positive income , Commercial Lending Specialization, 98 total offices , Holding Company: First Bancorp
First-Citizens Bank & Trust Company: Archdale Branch at 11613 North Main Street, branch established on 1908/01/01. Info updated 2011/10/11: Bank assets: $20,566.4 mil, Deposits: $17,596.8 mil, headquarters in Raleigh, NC, positive income , Commercial Lending Specialization, 433 total offices , Holding Company: First Citizens Bancshares, Inc.
Bank of North Carolina: Archdale Branch at 113 Trindale Road, branch established on 1995/12/08. Info updated 2012/01/09: Bank assets: $2,453.6 mil, Deposits: $2,119.0 mil, headquarters in Thomasville, NC, positive income , Commercial Lending Specialization, 37 total offices , Holding Company: Bnc Bancorp
PNC Bank, National Association: 3301 S Main St Branch at 11246 N. Main Street, branch established on 1985/06/30. Info updated 2012/03/20: Bank assets: $263,309.6 mil, Deposits: $197,343.0 mil, headquarters in Wilmington, DE, positive income , Commercial Lending Specialization, 3085 total offices , Holding Company: Pnc Financial Services Group, Inc., The
For population 15 years and over in Archdale:
Never married: 24.4%Now married: 52.6%Separated: 1.6%Widowed: 6.3%Divorced: 15.1% For population 25 years and over in Archdale:
High school or higher: 88.0%Bachelor's degree or higher: 20.2%Graduate or professional degree: 7.4%Unemployed: 2.8%Mean travel time to work (commute): 21.3 minutes
Education Gini index (Inequality in education) Here:
11.1North Carolina average:
11.7
Religion statistics for Archdale, NC (based on Randolph County data)
Religion Adherents Congregations Evangelical Protestant 29,662 162 Mainline Protestant 17,614 94 Catholic 1,585 1 Other 904 6 Black Protestant 814 6 None 92,070 -
Source: Clifford Grammich, Kirk Hadaway, Richard Houseal, Dale E.Jones, Alexei Krindatch, Richie Stanley and Richard H.Taylor. 2012. 2010 U.S.Religion Census: Religious Congregations & Membership Study. Association of Statisticians of American Religious Bodies. Jones, Dale E., et al. 2002. Congregations and Membership in the United States 2000. Nashville, TN: Glenmary Research Center. Graphs represent county-level data
Food Environment Statistics: Number of grocery stores : 22Randolph County :
1.58 / 10,000 pop.North Carolina :
2.05 / 10,000 pop.
Number of supercenters and club stores : 2This county :
0.14 / 10,000 pop.State :
0.14 / 10,000 pop.
Number of convenience stores (no gas) : 9Randolph County :
0.65 / 10,000 pop.North Carolina :
0.92 / 10,000 pop.
Number of convenience stores (with gas) : 58Randolph County :
4.16 / 10,000 pop.State :
4.75 / 10,000 pop.
Number of full-service restaurants : 74Here :
5.30 / 10,000 pop.State :
7.57 / 10,000 pop.
Adult diabetes rate : This county :
10.2%North Carolina :
9.8%
Adult obesity rate : Randolph County :
28.9%North Carolina :
28.3%
Low-income preschool obesity rate : This county :
18.3%State :
15.6%
Health and Nutrition: Healthy diet rate : This city:
51.0%State:
48.9%
Average overall health of teeth and gums : Archdale:
49.0%North Carolina:
46.1%
Average BMI : Here:
28.7North Carolina:
28.8
People feeling badly about themselves : Archdale:
19.7%North Carolina:
20.7%
People not drinking alcohol at all : Archdale:
9.5%North Carolina:
10.7%
Average hours sleeping at night : Overweight people : Archdale:
34.0%North Carolina:
33.7%
General health condition : Here:
58.6%North Carolina:
55.8%
Average condition of hearing : This city:
79.4%State:
79.7%
More about Health and Nutrition of Archdale, NC Residents
Local government employment and payroll (March 2022)
Function
Full-time employees
Monthly full-time payroll
Average yearly full-time wage
Part-time employees
Monthly part-time payroll
Police Protection - Officers
25 $109,330 $52,478 0 $0 Streets and Highways
9 $36,769 $49,025 1 $1,554 Financial Administration
7 $30,404 $52,121 0 $0 Sewerage
6 $21,153 $42,306 0 $0 Parks and Recreation
5 $17,688 $42,451 11 $5,437 Police - Other
5 $17,250 $41,400 0 $0 Other Government Administration
2 $15,466 $92,796 16 $16,733
Totals for Government
59 $248,060 $50,453 28 $23,724
Archdale government finances - Expenditure in 2017 (per resident):
Construction - Water Utilities: $117,000 ($9.75)
Parks and Recreation: $109,000 ($9.08)Regular Highways: $67,000 ($5.58)Sewerage: $34,000 ($2.83)Current Operations - Police Protection: $2,250,000 ($187.45)
Sewerage: $845,000 ($70.40)Regular Highways: $791,000 ($65.90)Solid Waste Management: $770,000 ($64.15)Parks and Recreation: $672,000 ($55.99)Water Utilities: $445,000 ($37.07)Central Staff Services: $397,000 ($33.08)General Public Buildings: $291,000 ($24.24)Financial Administration: $251,000 ($20.91)Housing and Community Development: $191,000 ($15.91)Libraries: $67,000 ($5.58)Judicial and Legal Services: $56,000 ($4.67)General - Other: $4,000 ($0.33)General - Interest on Debt: $87,000 ($7.25)
Intergovernmental to Local - Other - Sewerage: $494,000 ($41.16)
Other - Water Utilities: $427,000 ($35.57)Other - Libraries: $86,000 ($7.16)Other - Financial Administration: $42,000 ($3.50)Other - Local Fire Protection: $28,000 ($2.33)Other - Public Welfare - Other: $24,000 ($2.00)Other - Housing and Community Development: $4,000 ($0.33)Other Capital Outlay - Water Utilities: $778,000 ($64.82)
Sewerage: $222,000 ($18.50)Police Protection: $209,000 ($17.41)Regular Highways: $116,000 ($9.66)Parks and Recreation: $78,000 ($6.50)General Public Building: $43,000 ($3.58)Water Utilities - Interest on Debt: $133,000 ($11.08)
Archdale government finances - Revenue in 2017 (per resident):
Charges - Sewerage: $2,489,000 ($207.36)
Solid Waste Management: $818,000 ($68.15)Parks and Recreation: $168,000 ($14.00)Federal Intergovernmental - Other: $21,000 ($1.75)
Local Intergovernmental - General Local Government Support: $15,000 ($1.25)
Other: $10,000 ($0.83)Miscellaneous - General Revenue - Other: $300,000 ($24.99)
Rents: $26,000 ($2.17)Fines and Forfeits: $4,000 ($0.33)Donations From Private Sources: $2,000 ($0.17)Interest Earnings: $0 ($0.00)Revenue - Water Utilities: $1,514,000 ($126.14)
State Intergovernmental - General Local Government Support: $1,359,000 ($113.22)
Highways: $414,000 ($34.49)Other: $2,000 ($0.17)Tax - Property: $2,749,000 ($229.03)
General Sales and Gross Receipts: $1,965,000 ($163.71)Other License: $9,000 ($0.75)Occupation and Business License - Other: $6,000 ($0.50)Motor Vehicle License: $1,000 ($0.08)
Archdale government finances - Debt in 2017 (per resident):
Long Term Debt - Beginning Outstanding - Unspecified Public Purpose: $5,205,000 ($433.64)
Outstanding Unspecified Public Purpose: $4,502,000 ($375.07)Retired Unspecified Public Purpose: $704,000 ($58.65)
Businesses in Archdale, NC
Name Count Name Count
CVS 1 McDonald's 1 Circle K 1 Papa John's Pizza 1 Comfort Inn 1 Rite Aid 1 Decora Cabinetry 2 Sprint Nextel 1 FedEx 1 Subway 1 Hardee's 1 U-Haul 2 Hilton 1 UPS 2 Holiday Inn 1 Waffle House 1 Marriott 1 Wendy's 1 MasterBrand Cabinets 2
Strongest AM radio stations in Archdale:
WGOS (1070 AM; daytime; 1 kW; HIGH POINT, NC; Owner: RITCHY BROADCASTING CO., INC.)
WTRU (830 AM; 50 kW; KERNERSVILLE, NC; Owner: TRUTH BROADCASTING CORPORATION)
WIST (790 AM; 2 kW; THOMASVILLE, NC; Owner: GHB RADIO, INC.)
WMFR (1230 AM; 1 kW; HIGH POINT, NC; Owner: INFINITY RADIO OPERATIONS INC.)
WWBG (1470 AM; 10 kW; GREENSBORO, NC; Owner: TRUTH BROADCASTING COPORATION)
WKXR (1260 AM; 5 kW; ASHEBORO, NC; Owner: RANDOLPH BROADCASTING, INC.)
WPTF (680 AM; 50 kW; RALEIGH, NC; Owner: FIRST STATE COMMUNICATIONS)
WLXN (1440 AM; 5 kW; LEXINGTON, NC; Owner: DAVIDSON COUNTY BROADCASTING COMPANY, INC.)
WOKX (1590 AM; 1 kW; HIGH POINT, NC; Owner: EASTERN BROADCASTING GROUP, INC.)
WCOG (1320 AM; 5 kW; GREENSBORO, NC; Owner: TRUTH BROADCASTING CORPORATION)
WSJS (600 AM; 5 kW; WINSTON-SALEM, NC)
WFTK (1030 AM; daytime; 50 kW; WAKE FOREST, NC; Owner: POSITIVE RADIO GROUP, INC.)
WZOO (710 AM; daytime; 1 kW; ASHEBORO, NC; Owner: FAITH ENTERPRISES, INC.)
Strongest FM radio stations in Archdale:
WMAG (99.5 FM; HIGH POINT, NC; Owner: CAPSTAR TX LIMITED PARTNERSHIP)
WQMG-FM (97.1 FM; GREENSBORO, NC; Owner: ENTERCOM GREENSBORO LICENSE, LLC)
WHPE-FM (95.5 FM; HIGH POINT, NC; Owner: BIBLE BROADCASTING NETWORK, INC.)
WKRR (92.3 FM; ASHEBORO, NC; Owner: DICK BROADCASTING COMPANY, INC. OF TENNESSEE)
WOZN (98.7 FM; GREENSBORO, NC; Owner: ENTERCOM GREENSBORO LICENSE, LLC)
WVBZ (100.3 FM; HIGH POINT, NC; Owner: CAPSTAR TX LIMITED PARTNERSHIP)
WIST-FM (98.3 FM; THOMASVILLE, NC; Owner: WEAM QUALITY RADIO CORP.)
WFDD (88.5 FM; WINSTON-SALEM, NC; Owner: WAKE FOREST UNIVERSITY)
WKZL (107.5 FM; WINSTON-SALEM, NC; Owner: DICK BROADCASTING COMPANY, INC. OF TENNESSEE)
WHPU (90.3 FM; HIGH POINT, NC; Owner: TRUSTEES OF HIGH POINT COLLEGE, INC.)
WJMH (102.1 FM; REIDSVILLE, NC; Owner: ENTERCOM GREENSBORO LICENSE, LLC)
WMQX-FM (93.1 FM; WINSTON-SALEM, NC; Owner: ENTERCOM GREENSBORO LICENSE, LLC)
WKXU (101.1 FM; BURLINGTON, NC; Owner: CAROLINA RADIO GROUP, INC.)
WTQR (104.1 FM; WINSTON-SALEM, NC; Owner: CLEAR CHANNEL BROADCASTING LICENSES, INC.)
WFMX (105.7 FM; STATESVILLE, NC; Owner: MERCURY BROADCASTING COMPANY, INC.)
WNAA (90.1 FM; GREENSBORO, NC; Owner: NC AGRICULTURAL & TECHNICAL STATE UNIVERSITY)
WGBT (94.5 FM; EDEN, NC; Owner: CLEAR CHANNEL BROADCASTING LICENSES, INC.)
WTJY (89.5 FM; ASHEBORO, NC; Owner: POSITIVE ALTERNATIVE RADIO, INC.)
W285DJ (104.9 FM; MOUNT AIRY, NC; Owner: TRIAD FAMILY NETWORK, INC,)
WRSN (93.9 FM; BURLINGTON, NC; Owner: CAPSTAR TX LIMITED PARTNERSHIP)
TV broadcast stations around Archdale:
WFMY-TV (Channel 2; GREENSBORO, NC; Owner: WFMY TELEVISION CORPORATION)
WUPN-TV (Channel 48; GREENSBORO, NC; Owner: WUPN LICENSEE, LLC)
WXLV-TV (Channel 45; WINSTON-SALEM, NC; Owner: WXLV LICENSEE, LLC)
WTWB-TV (Channel 20; LEXINGTON, NC; Owner: WTWB OF THE TRIAD, LLC)
WLXI-TV (Channel 61; GREENSBORO, NC; Owner: TRI-STATE CHRISTIAN TV, INC.)
WGHP (Channel 8; HIGH POINT, NC; Owner: WGHP LICENSE, INC.)
WGPX (Channel 16; BURLINGTON, NC; Owner: PAXSON GREENSBORO LICENSE, INC.)
WAXN (Channel 64; KANNAPOLIS, NC; Owner: WSOC-TV HOLDINGS, INC.)
WUNC-TV (Channel 4; CHAPEL HILL, NC; Owner: UNIVERSITY OF NORTH CAROLINA)
WUNG-TV (Channel 58; CONCORD, NC; Owner: UNIVERSITY OF NORTH CAROLINA)
National Bridge Inventory (NBI) Statistics 55 Number of bridges459ft / 140m Total length645,390 Total average daily traffic99,663 Total average daily truck traffic
New bridges - historical statistics
2 1920-1929 2 1950-1959 2 1960-1969 14 1980-1989 1 1990-1999 17 2000-2009 17 2010-2019
See full National Bridge Inventory statistics for Archdale, NC
FCC Registered Antenna Towers: 53 (
See the full list of FCC Registered Antenna Towers in Archdale )
FCC Registered Broadcast Land Mobile Towers: 12 (
See the full list of FCC Registered Broadcast Land Mobile Towers in Archdale, NC )
FCC Registered Microwave Towers: 5
CAR2611, 4782 Darr Rd (Lat: 35.884722 Lon: -79.974167), Type: Tower, Structure height: 76 m, Overall height: 80.8 m, Call Sign: WQHG209, Assigned Frequencies: 11345.0 MHz, 21885.0 MHz, Grant Date: 07/20/2007, Expiration Date: 07/20/2017, Cancellation Date: 01/14/2009, Certifier: Joseph M Sandri, Registrant: Fibertower Corporation, 1667 K Street Nw, Suite 250, Washington, DC 20006, Phone: (202) 223-1028, Fax: (202) 315-3415, Email:
CAR2603, 5516 Groometown Rd Greensboro (Lat: 35.951944 Lon: -79.889444), Type: Tower, Structure height: 76 m, Overall height: 80.8 m, Call Sign: WQHG269, Assigned Frequencies: 11245.0 MHz, 11385.0 MHz, Grant Date: 07/20/2007, Expiration Date: 07/20/2017, Cancellation Date: 01/14/2009, Certifier: Joseph M Sandri, Registrant: Fibertower Corporation, 1667 K Street Nw, Suite 250, Washington, DC 20006, Phone: (202) 223-1028, Fax: (202) 315-3415, Email:
Archdale, 5516 Groometown Rd Greensboro (Lat: 35.952000 Lon: -79.889611), Type: Tower, Structure height: 76 m, Overall height: 80.8 m, Call Sign: WQJN732, Assigned Frequencies: 11645.0 MHz, 11445.0 MHz, 11445.0 MHz, 11525.0 MHz, 11565.0 MHz, Grant Date: 11/27/2018, Expiration Date: 11/11/2028, Certifier: Christopher L Harris, Registrant: Conterra Ultra Broadband, LLC, 2101 Rexford Rd Ste 200e, Charlotte, NC 28211, Phone: (704) 936-1777, Fax: (704) 936-1801, Email:
Jesse Williams, 4782 Darr Rd (Lat: 35.884694 Lon: -79.974000), Type: Tower, Structure height: 76 m, Overall height: 80.8 m, Call Sign: WQJN902, Assigned Frequencies: 10715.0 MHz, Grant Date: 11/13/2008, Expiration Date: 11/13/2018, Cancellation Date: 02/16/2019, Certifier: Christopher L Harris, Registrant: Conterra Ultra Broadband, LLC, 2101 Rexford Rd Ste 200e, Charlotte, NC 28211, Phone: (704) 936-1777, Fax: (704) 936-1801, Email:
NC-GSB197A, Davidson And Columbus Ave (Lat: 35.904944 Lon: -79.963306), Type: Tank, Structure height: 56.1 m, Call Sign: WQLA958, Assigned Frequencies: 23025.0 MHz, 23125.0 MHz, Grant Date: 01/07/2020, Expiration Date: 11/17/2029, Cancellation Date: 05/09/2023, Certifier: Nadja S Sodos-Wallace, Registrant: T-Mobile Usa, Inc., 12920 Se 38th Street, Bellevue, WA 98006, Phone: (425) 383-8401, Email:
FCC Registered Amateur Radio Licenses: 51 (
See the full list of FCC Registered Amateur Radio Licenses in Archdale )
FAA Registered Aircraft: 5
Aircraft: MOONEY M20C (Category: Land, Seats: 4, Weight: Up to 12,499 Pounds, Speed: 127 mph), Engine: LYCOMING O&VO-360 SER (180 HP) (Reciprocating)N-Number: 4068N, N4068N, N-4068N, Serial Number: 680030, Year manufactured: 1968, Certificate Issue Date: 04/11/2019Registrant (Individual): Averett V Thomas, 108 Belgian Dr, Archdale, NC 27263Aircraft: BEECH F33A (Category: Land, Seats: 5, Weight: Up to 12,499 Pounds, Speed: 138 mph), Engine: ReciprocatingN-Number: 4289S, N4289S, N-4289S, Serial Number: CE-682, Year manufactured: 1977, Airworthiness Date: 11/13/1976, Certificate Issue Date: 02/20/2008Registrant (LLC): Gleason Aviation LLC, 9552 Highway 311 South, Archdale, NC 27263Aircraft: U-FLY-IT LIGHT SPORT ACFT LLC GT-400 (Category: Land, Seats: 2, Weight: Up to 12,499 Pounds), Engine: ROTAX 503 DCDI (52 HP) (2 Cycle)N-Number: 702UF, N702UF, N-702UF, Serial Number: GT2801490, Year manufactured: 2005, Airworthiness Date: 05/09/2007Registrant (Individual): Reported Sale, 6405 Canter Rd, Archdale, NC 27263Aircraft: CESSNA R172K (Category: Land, Seats: 4, Weight: Up to 12,499 Pounds, Speed: 76 mph), Engine: ReciprocatingN-Number: 736CZ, N736CZ, N-736CZ, Serial Number: R1722433, Airworthiness Date: 03/12/1977, Certificate Issue Date: 05/07/2020Registrant (Individual): Tom J Stamper, 216 Kinview Dr, Archdale, NC 27263Aircraft: WILSON MICHAEL N EVANS VP-1 (Category: Land, Weight: Up to 12,499 Pounds), Engine: VOLKSWAGEN CONVERSION (36 HP) (Reciprocating)N-Number: 31501, N31501, N-31501, Serial Number: V-2587, Year manufactured: 1982, Airworthiness Date: 08/04/1982, Certificate Issue Date: 03/19/1992Registrant (Individual): Ronald C Brown, 216 Kinview Drive, Archdale, NC 27263Deregistered: Cancel Date: 02/17/2017
Home Mortgage Disclosure Act Aggregated Statistics For Year 2009(Based on 2 full and 1 partial tracts) A) FHA, FSA/RHS & VA B) Conventional C) Refinancings D) Home Improvement Loans F) Non-occupant Loans on Number Average Value Number Average Value Number Average Value Number Average Value Number Average Value
LOANS ORIGINATED 26 $117,400 40 $101,499 109 $116,348 8 $64,424 20 $71,284 APPLICATIONS APPROVED, NOT ACCEPTED 4 $101,475 2 $105,430 8 $112,526 1 $7,300 2 $68,000 APPLICATIONS DENIED 2 $128,395 9 $67,606 44 $125,183 4 $32,638 7 $72,793 APPLICATIONS WITHDRAWN 4 $119,018 5 $118,378 20 $129,505 1 $99,070 1 $119,470 FILES CLOSED FOR INCOMPLETENESS 0 $0 0 $0 13 $128,802 0 $0 0 $0
Aggregated Statistics For Year 2008(Based on 2 full and 1 partial tracts) A) FHA, FSA/RHS & VA B) Conventional C) Refinancings D) Home Improvement Loans E) Loans on Dwellings For 5+ Families F) Non-occupant Loans on G) Loans On Manufactured Number Average Value Number Average Value Number Average Value Number Average Value Number Average Value Number Average Value Number Average Value
LOANS ORIGINATED 27 $109,969 61 $100,656 76 $117,218 14 $31,821 3 $2,981,333 21 $68,022 0 $0 APPLICATIONS APPROVED, NOT ACCEPTED 0 $0 5 $65,956 15 $92,556 2 $25,725 0 $0 1 $41,450 0 $0 APPLICATIONS DENIED 3 $103,437 10 $151,200 89 $110,669 10 $60,105 0 $0 5 $91,770 4 $114,550 APPLICATIONS WITHDRAWN 1 $169,980 4 $73,698 31 $137,555 2 $124,975 0 $0 1 $131,390 1 $55,530 FILES CLOSED FOR INCOMPLETENESS 0 $0 3 $99,233 7 $120,806 1 $245,820 0 $0 0 $0 0 $0
Aggregated Statistics For Year 2007(Based on 2 full and 1 partial tracts) A) FHA, FSA/RHS & VA B) Conventional C) Refinancings D) Home Improvement Loans E) Loans on Dwellings For 5+ Families F) Non-occupant Loans on G) Loans On Manufactured Number Average Value Number Average Value Number Average Value Number Average Value Number Average Value Number Average Value Number Average Value
LOANS ORIGINATED 13 $101,403 122 $112,251 103 $98,173 15 $28,736 1 $1,014,700 25 $73,748 1 $79,580 APPLICATIONS APPROVED, NOT ACCEPTED 0 $0 19 $120,838 23 $101,600 3 $19,437 0 $0 3 $62,100 0 $0 APPLICATIONS DENIED 0 $0 18 $110,514 97 $99,860 15 $53,951 0 $0 2 $122,165 0 $0 APPLICATIONS WITHDRAWN 2 $87,490 15 $87,111 33 $116,678 2 $23,620 0 $0 3 $70,023 0 $0 FILES CLOSED FOR INCOMPLETENESS 0 $0 2 $75,375 5 $151,030 0 $0 0 $0 0 $0 0 $0
Aggregated Statistics For Year 2006(Based on 2 full and 1 partial tracts) A) FHA, FSA/RHS & VA B) Conventional C) Refinancings D) Home Improvement Loans E) Loans on Dwellings For 5+ Families F) Non-occupant Loans on G) Loans On Manufactured Number Average Value Number Average Value Number Average Value Number Average Value Number Average Value Number Average Value Number Average Value
LOANS ORIGINATED 12 $106,560 154 $94,495 114 $90,404 16 $29,002 1 $577,830 38 $82,993 1 $47,000 APPLICATIONS APPROVED, NOT ACCEPTED 1 $128,930 18 $79,444 24 $81,386 3 $27,533 0 $0 3 $63,323 1 $56,000 APPLICATIONS DENIED 1 $126,440 22 $95,460 92 $97,962 19 $42,441 0 $0 5 $113,202 5 $65,118 APPLICATIONS WITHDRAWN 2 $112,165 11 $114,267 31 $114,806 4 $45,520 0 $0 3 $143,313 0 $0 FILES CLOSED FOR INCOMPLETENESS 0 $0 1 $70,390 17 $124,527 3 $88,313 0 $0 3 $111,860 0 $0
Aggregated Statistics For Year 2005(Based on 2 full and 1 partial tracts) A) FHA, FSA/RHS & VA B) Conventional C) Refinancings D) Home Improvement Loans E) Loans on Dwellings For 5+ Families F) Non-occupant Loans on G) Loans On Manufactured Number Average Value Number Average Value Number Average Value Number Average Value Number Average Value Number Average Value Number Average Value
LOANS ORIGINATED 23 $114,773 153 $89,767 143 $85,043 15 $42,070 0 $0 43 $68,341 1 $56,720 APPLICATIONS APPROVED, NOT ACCEPTED 2 $88,590 18 $78,859 30 $78,714 1 $70,910 1 $144,000 4 $74,780 0 $0 APPLICATIONS DENIED 3 $111,557 29 $81,213 102 $102,125 14 $51,846 0 $0 7 $58,663 5 $52,280 APPLICATIONS WITHDRAWN 2 $86,895 16 $88,818 57 $110,838 3 $163,287 0 $0 6 $82,795 1 $41,680 FILES CLOSED FOR INCOMPLETENESS 0 $0 2 $73,545 11 $130,197 0 $0 0 $0 0 $0 0 $0
Aggregated Statistics For Year 2004(Based on 2 full and 1 partial tracts) A) FHA, FSA/RHS & VA B) Conventional C) Refinancings D) Home Improvement Loans F) Non-occupant Loans on G) Loans On Manufactured Number Average Value Number Average Value Number Average Value Number Average Value Number Average Value Number Average Value
LOANS ORIGINATED 22 $94,180 129 $97,588 138 $90,618 9 $32,469 32 $95,563 1 $47,450 APPLICATIONS APPROVED, NOT ACCEPTED 0 $0 17 $91,444 25 $80,179 4 $7,595 6 $66,558 0 $0 APPLICATIONS DENIED 1 $63,610 21 $71,943 67 $99,616 14 $30,757 8 $33,384 3 $42,130 APPLICATIONS WITHDRAWN 4 $85,652 13 $81,592 35 $99,153 4 $46,350 2 $41,490 0 $0 FILES CLOSED FOR INCOMPLETENESS 0 $0 3 $84,273 7 $111,877 0 $0 1 $54,230 0 $0
Aggregated Statistics For Year 2003(Based on 2 full and 1 partial tracts) A) FHA, FSA/RHS & VA B) Conventional C) Refinancings D) Home Improvement Loans F) Non-occupant Loans on Number Average Value Number Average Value Number Average Value Number Average Value Number Average Value
LOANS ORIGINATED 25 $102,439 89 $100,148 262 $93,549 12 $14,462 38 $84,885 APPLICATIONS APPROVED, NOT ACCEPTED 1 $76,910 7 $116,603 26 $94,490 2 $9,670 3 $86,600 APPLICATIONS DENIED 1 $88,000 19 $85,926 84 $87,163 13 $20,513 7 $60,299 APPLICATIONS WITHDRAWN 3 $105,647 7 $122,511 36 $91,014 1 $9,000 4 $45,960 FILES CLOSED FOR INCOMPLETENESS 0 $0 1 $85,770 8 $104,608 1 $23,460 1 $50,000
Aggregated Statistics For Year 2002(Based on 2 full and 1 partial tracts) A) FHA, FSA/RHS & VA B) Conventional C) Refinancings D) Home Improvement Loans E) Loans on Dwellings For 5+ Families F) Non-occupant Loans on Number Average Value Number Average Value Number Average Value Number Average Value Number Average Value Number Average Value
LOANS ORIGINATED 37 $94,172 85 $99,145 152 $90,954 5 $23,574 2 $233,040 19 $85,707 APPLICATIONS APPROVED, NOT ACCEPTED 3 $88,627 11 $107,675 22 $80,481 1 $4,950 0 $0 1 $45,000 APPLICATIONS DENIED 3 $90,810 26 $75,809 53 $75,071 7 $21,653 0 $0 5 $84,786 APPLICATIONS WITHDRAWN 2 $98,575 14 $83,801 26 $80,177 2 $18,685 0 $0 2 $88,500 FILES CLOSED FOR INCOMPLETENESS 1 $66,740 4 $103,582 5 $60,034 0 $0 0 $0 0 $0
Aggregated Statistics For Year 2001(Based on 2 full and 1 partial tracts) A) FHA, FSA/RHS & VA B) Conventional C) Refinancings D) Home Improvement Loans F) Non-occupant Loans on Number Average Value Number Average Value Number Average Value Number Average Value Number Average Value
LOANS ORIGINATED 30 $93,034 82 $85,026 176 $84,331 16 $17,146 33 $63,292 APPLICATIONS APPROVED, NOT ACCEPTED 1 $58,660 18 $67,915 21 $80,959 2 $39,045 3 $46,473 APPLICATIONS DENIED 0 $0 30 $57,043 59 $67,964 11 $12,054 5 $55,212 APPLICATIONS WITHDRAWN 2 $89,585 16 $91,505 25 $74,476 2 $44,970 2 $52,625 FILES CLOSED FOR INCOMPLETENESS 0 $0 1 $85,510 3 $92,323 0 $0 0 $0
Aggregated Statistics For Year 2000(Based on 2 full and 1 partial tracts) A) FHA, FSA/RHS & VA B) Conventional C) Refinancings D) Home Improvement Loans F) Non-occupant Loans on Number Average Value Number Average Value Number Average Value Number Average Value Number Average Value
LOANS ORIGINATED 23 $95,374 102 $85,902 50 $77,342 15 $23,253 21 $63,243 APPLICATIONS APPROVED, NOT ACCEPTED 7 $41,173 17 $59,761 11 $56,472 5 $14,036 1 $32,850 APPLICATIONS DENIED 8 $51,488 54 $59,877 36 $61,915 7 $15,710 2 $72,195 APPLICATIONS WITHDRAWN 5 $71,488 8 $102,866 18 $68,391 2 $47,430 0 $0 FILES CLOSED FOR INCOMPLETENESS 1 $108,000 1 $61,260 6 $71,350 0 $0 0 $0
Aggregated Statistics For Year 1999(Based on 2 full and 1 partial tracts) A) FHA, FSA/RHS & VA B) Conventional C) Refinancings D) Home Improvement Loans F) Non-occupant Loans on Number Average Value Number Average Value Number Average Value Number Average Value Number Average Value
LOANS ORIGINATED 29 $80,739 99 $77,349 97 $69,882 16 $11,422 24 $59,464 APPLICATIONS APPROVED, NOT ACCEPTED 2 $106,520 30 $77,328 36 $64,398 4 $14,945 6 $73,175 APPLICATIONS DENIED 3 $65,793 74 $53,669 58 $68,094 9 $20,484 8 $104,091 APPLICATIONS WITHDRAWN 4 $66,795 15 $90,635 31 $64,745 3 $23,577 1 $34,560 FILES CLOSED FOR INCOMPLETENESS 1 $53,980 12 $67,295 16 $67,163 0 $0 1 $66,480
Detailed HMDA statistics for the following Tracts:
0315.02
, 0315.03 , 0316.02
Private Mortgage Insurance Companies Aggregated Statistics For Year 2009(Based on 2 full and 1 partial tracts) A) Conventional B) Refinancings Number Average Value Number Average Value
LOANS ORIGINATED 5 $143,068 2 $187,315 APPLICATIONS APPROVED, NOT ACCEPTED 1 $75,000 1 $203,610 APPLICATIONS DENIED 3 $107,467 2 $119,830 APPLICATIONS WITHDRAWN 0 $0 1 $194,130 FILES CLOSED FOR INCOMPLETENESS 0 $0 0 $0
Aggregated Statistics For Year 2008(Based on 2 full and 1 partial tracts) A) Conventional B) Refinancings C) Non-occupant Loans on Number Average Value Number Average Value Number Average Value
LOANS ORIGINATED 27 $122,167 9 $158,949 3 $72,213 APPLICATIONS APPROVED, NOT ACCEPTED 8 $127,981 6 $145,448 1 $112,000 APPLICATIONS DENIED 1 $99,560 1 $58,400 0 $0 APPLICATIONS WITHDRAWN 0 $0 0 $0 0 $0 FILES CLOSED FOR INCOMPLETENESS 0 $0 0 $0 0 $0
Aggregated Statistics For Year 2007(Based on 2 full and 1 partial tracts) A) Conventional B) Refinancings C) Non-occupant Loans on Number Average Value Number Average Value Number Average Value
LOANS ORIGINATED 46 $123,898 17 $105,903 4 $87,498 APPLICATIONS APPROVED, NOT ACCEPTED 4 $128,658 3 $177,560 0 $0 APPLICATIONS DENIED 0 $0 0 $0 0 $0 APPLICATIONS WITHDRAWN 2 $99,565 0 $0 0 $0 FILES CLOSED FOR INCOMPLETENESS 0 $0 0 $0 0 $0
Aggregated Statistics For Year 2006(Based on 2 full and 1 partial tracts) A) Conventional B) Refinancings C) Non-occupant Loans on Number Average Value Number Average Value Number Average Value
LOANS ORIGINATED 36 $119,333 7 $134,310 3 $114,833 APPLICATIONS APPROVED, NOT ACCEPTED 2 $85,300 4 $98,648 0 $0 APPLICATIONS DENIED 0 $0 0 $0 0 $0 APPLICATIONS WITHDRAWN 0 $0 1 $100,630 0 $0 FILES CLOSED FOR INCOMPLETENESS 0 $0 0 $0 0 $0
Aggregated Statistics For Year 2005(Based on 2 full and 1 partial tracts) A) Conventional B) Refinancings C) Non-occupant Loans on Number Average Value Number Average Value Number Average Value
LOANS ORIGINATED 21 $113,318 11 $102,137 2 $171,575 APPLICATIONS APPROVED, NOT ACCEPTED 3 $110,723 3 $91,333 0 $0 APPLICATIONS DENIED 0 $0 0 $0 0 $0 APPLICATIONS WITHDRAWN 3 $118,513 2 $167,790 0 $0 FILES CLOSED FOR INCOMPLETENESS 0 $0 0 $0 0 $0
Aggregated Statistics For Year 2004(Based on 2 full and 1 partial tracts) A) Conventional B) Refinancings C) Non-occupant Loans on Number Average Value Number Average Value Number Average Value
LOANS ORIGINATED 23 $117,758 17 $111,485 2 $78,085 APPLICATIONS APPROVED, NOT ACCEPTED 3 $104,827 4 $108,282 0 $0 APPLICATIONS DENIED 1 $137,460 0 $0 0 $0 APPLICATIONS WITHDRAWN 0 $0 2 $96,460 1 $67,000 FILES CLOSED FOR INCOMPLETENESS 0 $0 0 $0 0 $0
Aggregated Statistics For Year 2003(Based on 2 full and 1 partial tracts) A) Conventional B) Refinancings C) Non-occupant Loans on Number Average Value Number Average Value Number Average Value
LOANS ORIGINATED 25 $105,673 58 $105,137 5 $73,700 APPLICATIONS APPROVED, NOT ACCEPTED 4 $117,510 6 $111,793 0 $0 APPLICATIONS DENIED 0 $0 1 $142,340 1 $114,970 APPLICATIONS WITHDRAWN 0 $0 1 $69,090 0 $0 FILES CLOSED FOR INCOMPLETENESS 0 $0 0 $0 0 $0
Aggregated Statistics For Year 2002(Based on 2 full and 1 partial tracts) A) Conventional B) Refinancings C) Non-occupant Loans on Number Average Value Number Average Value Number Average Value
LOANS ORIGINATED 45 $120,879 22 $107,445 3 $99,923 APPLICATIONS APPROVED, NOT ACCEPTED 6 $101,335 9 $113,032 2 $81,000 APPLICATIONS DENIED 1 $47,450 2 $97,630 0 $0 APPLICATIONS WITHDRAWN 1 $68,000 1 $52,920 0 $0 FILES CLOSED FOR INCOMPLETENESS 0 $0 0 $0 0 $0
Aggregated Statistics For Year 2001(Based on 2 full and 1 partial tracts) A) Conventional B) Refinancings C) Non-occupant Loans on Number Average Value Number Average Value Number Average Value
LOANS ORIGINATED 28 $109,526 27 $97,371 8 $77,018 APPLICATIONS APPROVED, NOT ACCEPTED 4 $82,982 4 $122,815 0 $0 APPLICATIONS DENIED 2 $135,040 3 $96,993 0 $0 APPLICATIONS WITHDRAWN 1 $98,540 0 $0 0 $0 FILES CLOSED FOR INCOMPLETENESS 0 $0 2 $59,350 0 $0
Aggregated Statistics For Year 2000(Based on 2 full and 1 partial tracts) A) Conventional B) Refinancings C) Non-occupant Loans on Number Average Value Number Average Value Number Average Value
LOANS ORIGINATED 22 $90,578 3 $65,430 3 $49,667 APPLICATIONS APPROVED, NOT ACCEPTED 2 $109,070 0 $0 1 $38,000 APPLICATIONS DENIED 2 $92,395 0 $0 1 $68,000 APPLICATIONS WITHDRAWN 2 $78,185 0 $0 0 $0 FILES CLOSED FOR INCOMPLETENESS 0 $0 0 $0 0 $0
Aggregated Statistics For Year 1999(Based on 2 full and 1 partial tracts) A) Conventional B) Refinancings Number Average Value Number Average Value
LOANS ORIGINATED 24 $94,779 7 $89,134 APPLICATIONS APPROVED, NOT ACCEPTED 0 $0 0 $0 APPLICATIONS DENIED 0 $0 0 $0 APPLICATIONS WITHDRAWN 2 $103,000 0 $0 FILES CLOSED FOR INCOMPLETENESS 0 $0 0 $0
Detailed PMIC statistics for the following Tracts:
0315.02
, 0315.03 , 0316.02 Archdale compared to North Carolina state average:
Median house value below state average. Unemployed percentage significantly below state average. Black race population percentage below state average. Median age below state average. Length of stay since moving in above state average.
Top Patent Applicants
Terry L. Gajtka, Jr. (2)
Anthony T. Harrelson (2)
James V. Mirante (2)
Herbert D. Temple (2)
Jonathan L. Matson (1)
Nellie Moretz (1)
Robert J. Sechrest, Jr. (1)
John L. Adair, Iii (1)
Nellie M. Moretz (1)
William G. Arpin (1)
Total of 18 patent applications in 2008-2024.
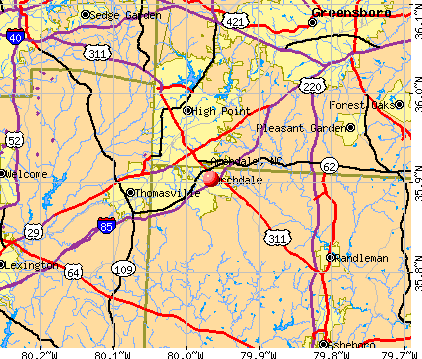


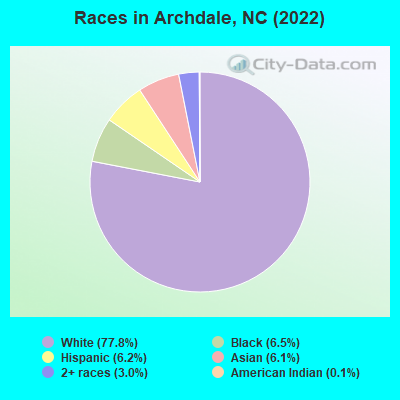
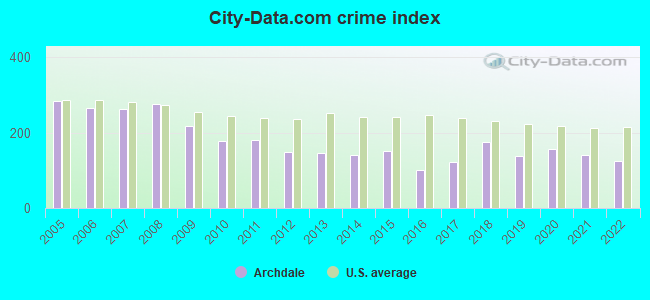
 Recent articles from our blog. Our writers, many of them Ph.D. graduates or candidates, create easy-to-read articles on a wide variety of topics.

 (4.9 miles
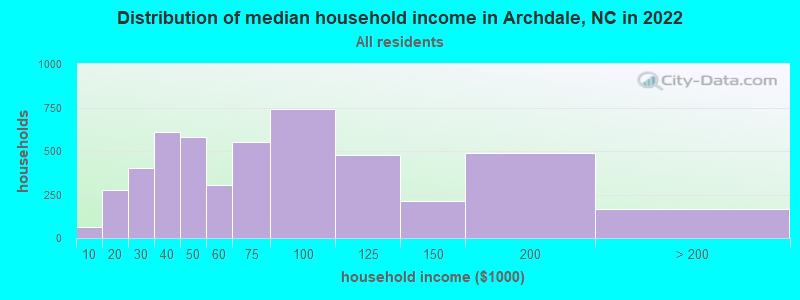
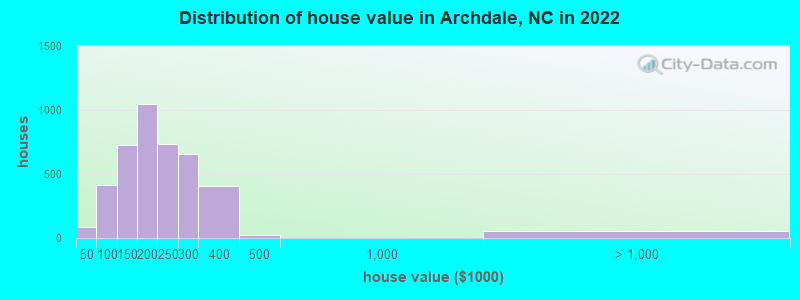
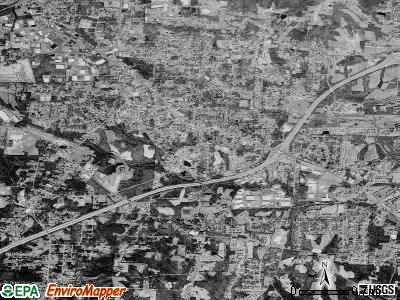
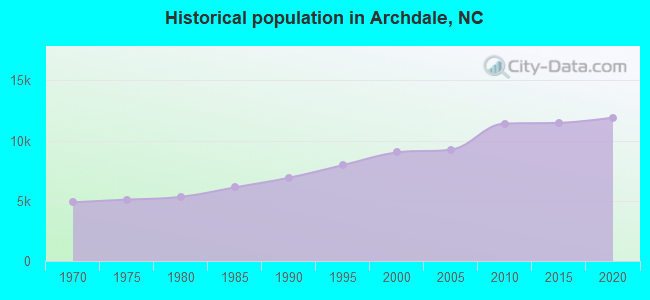
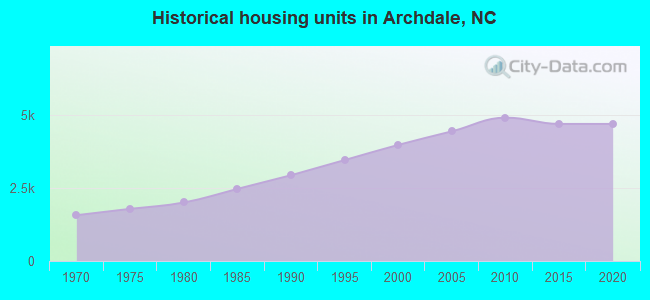
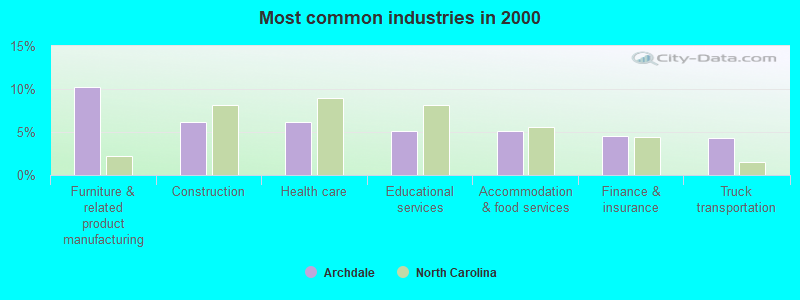
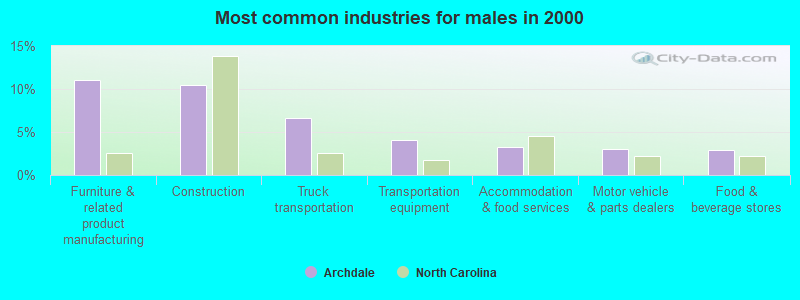
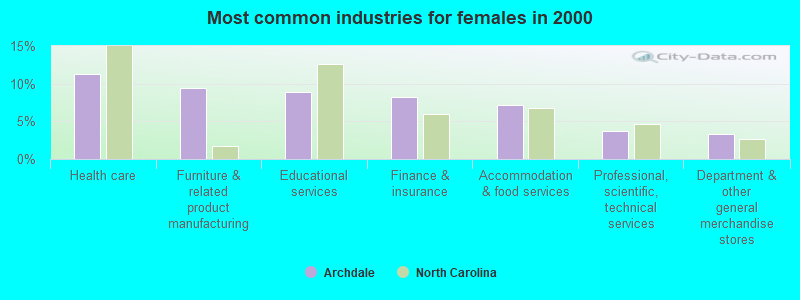
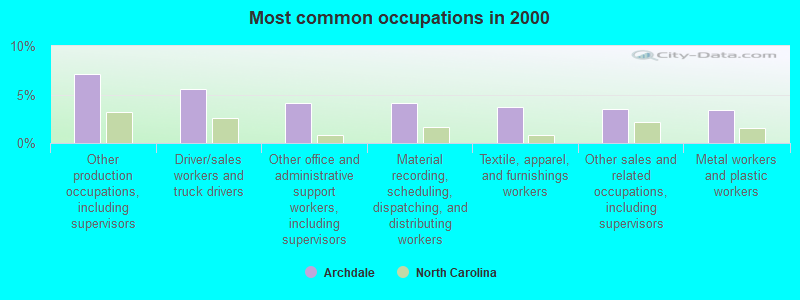
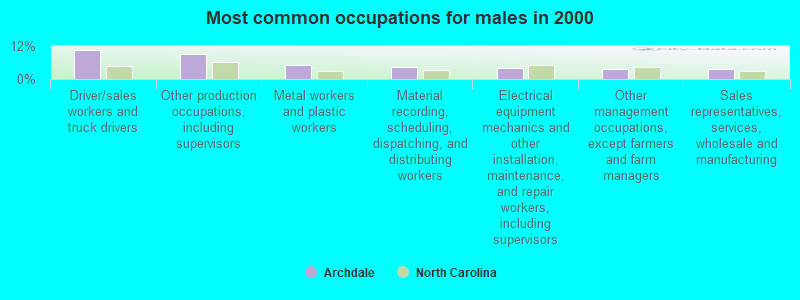
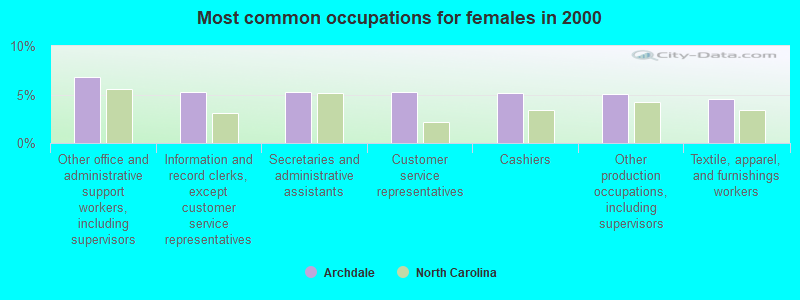
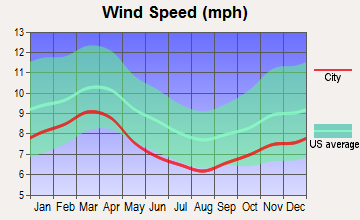
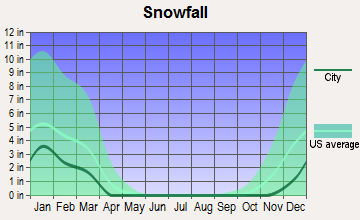
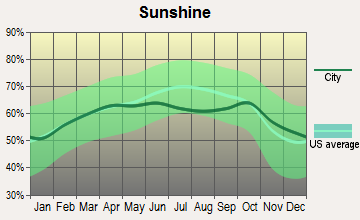
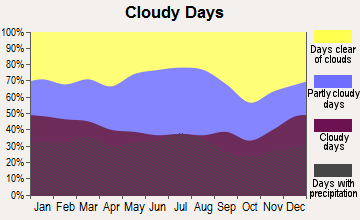
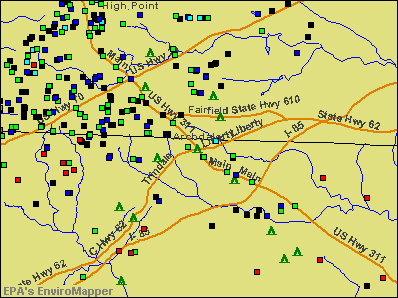

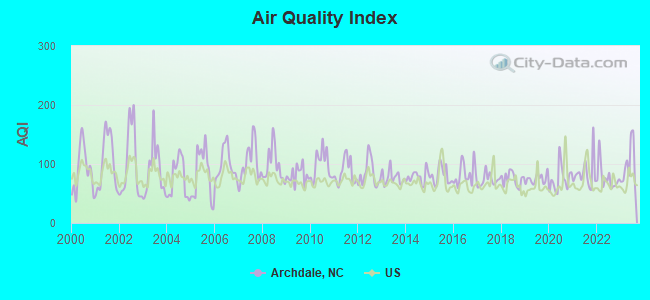
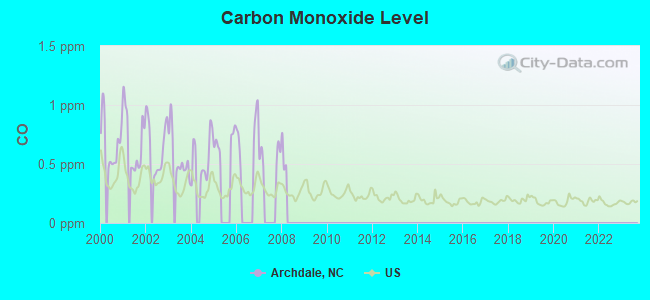
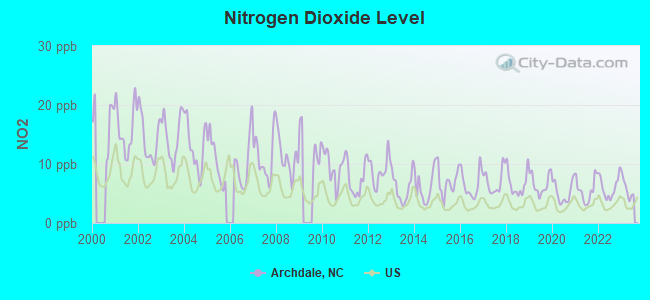
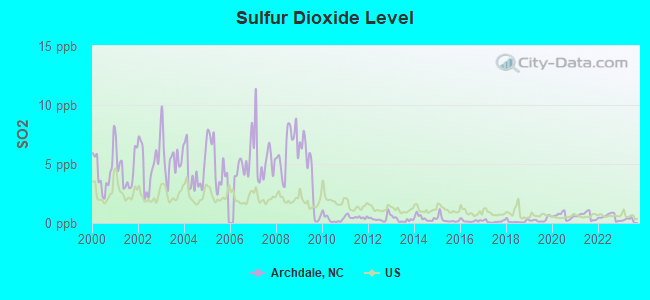
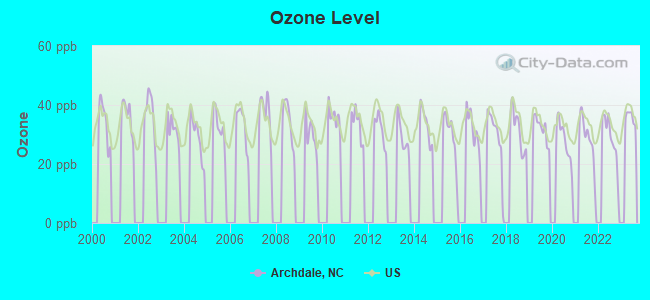
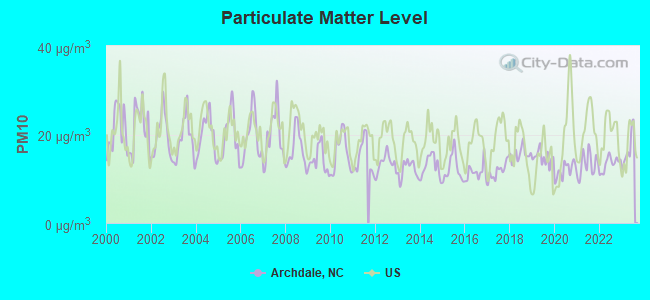
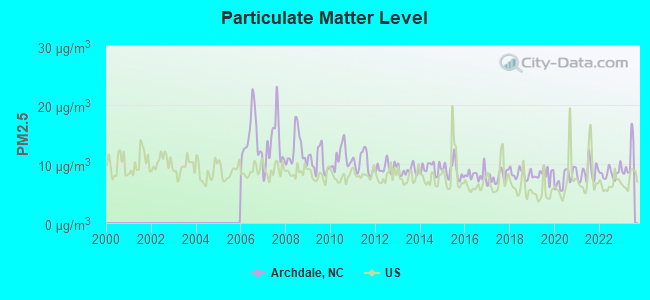
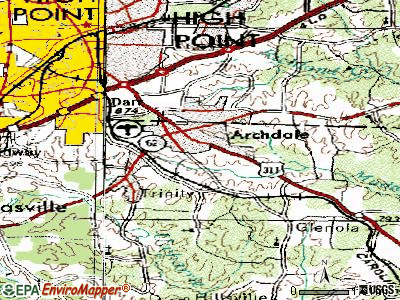
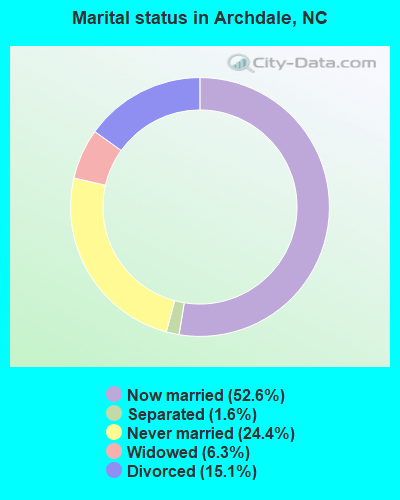
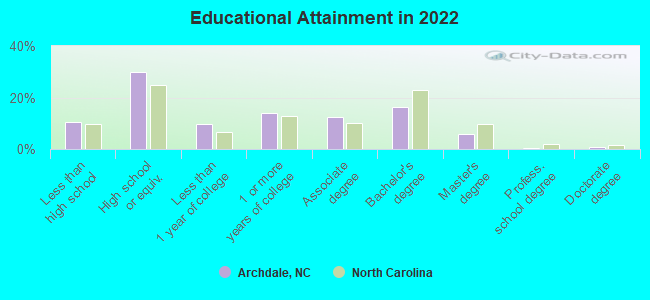
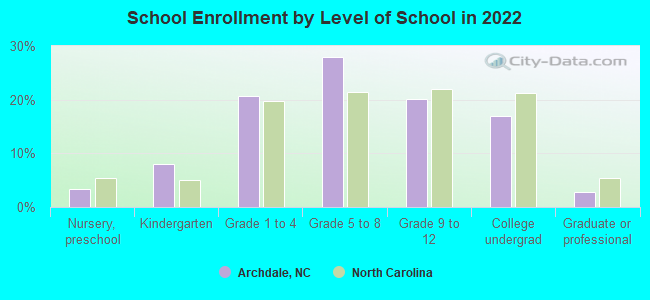
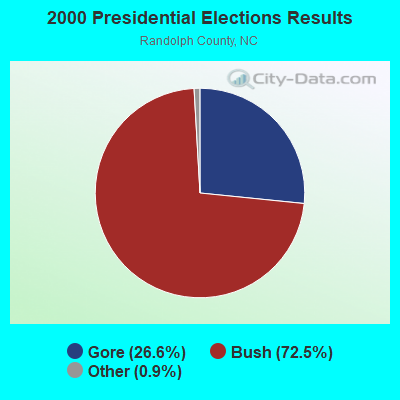
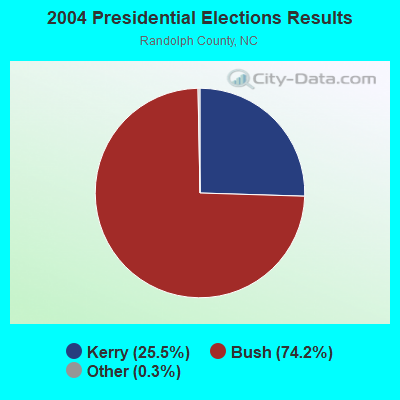

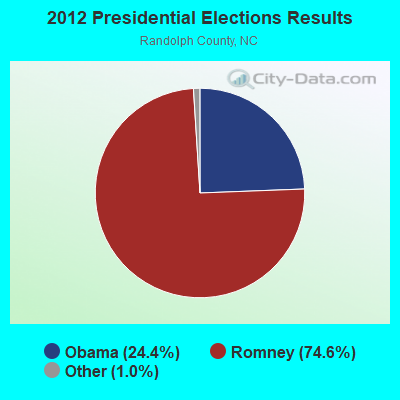
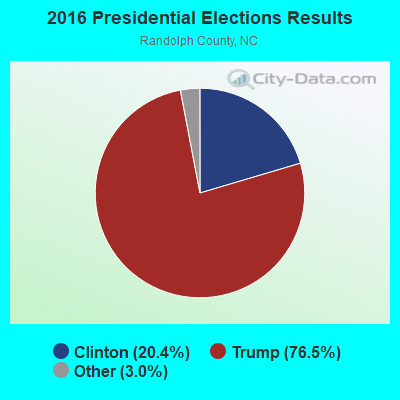
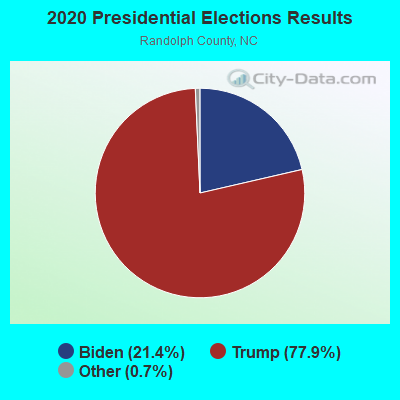
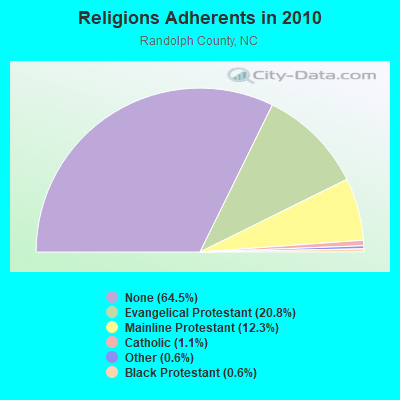
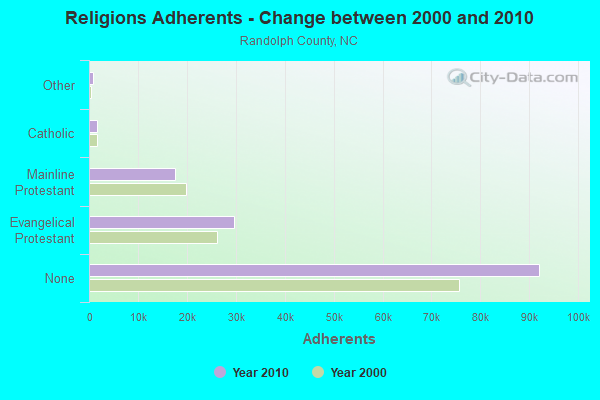
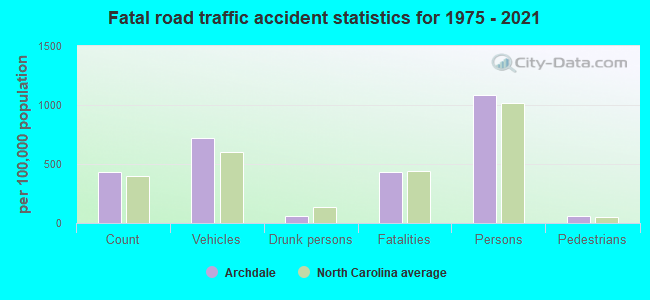
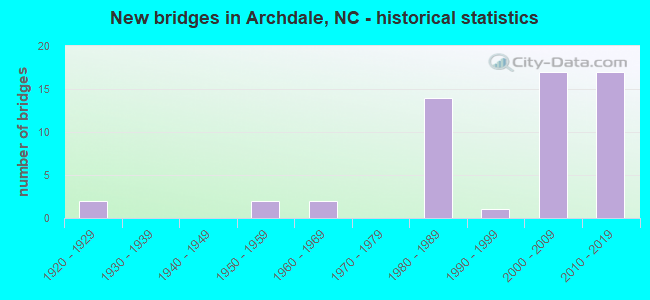
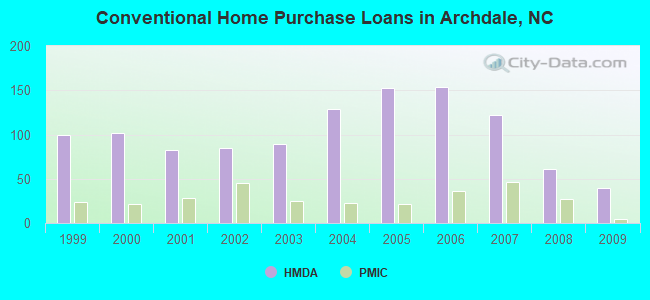
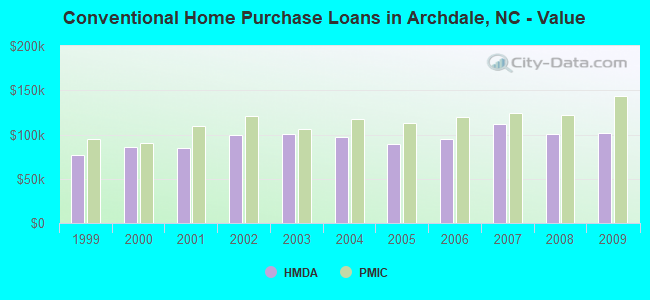
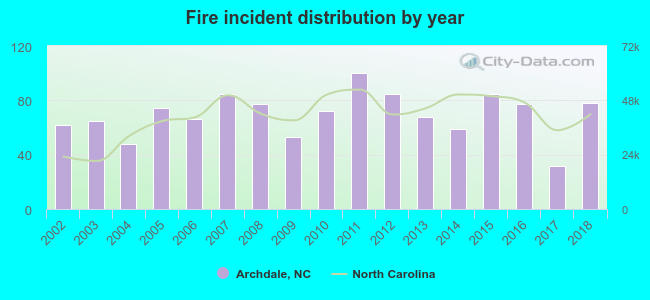 According to the data from the years 2002 - 2018 the average number of fires per year is 70. The highest number of reported fires - 100 took place in 2011, and the least - 32 in 2017. The data has an increasing trend.
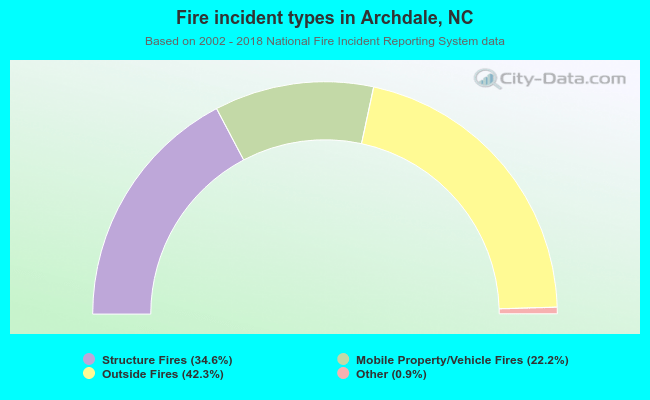 When looking into fire subcategories, the most incidents belonged to: Outside Fires (42.3%), and Structure Fires (34.6%).