Alexander City, Alabama Submit your own pictures of this city and show them to the world
OSM Map
General Map
Google Map
MSN Map
OSM Map
General Map
Google Map
MSN Map
OSM Map
General Map
Google Map
MSN Map
OSM Map
General Map
Google Map
MSN Map
Please wait while loading the map...
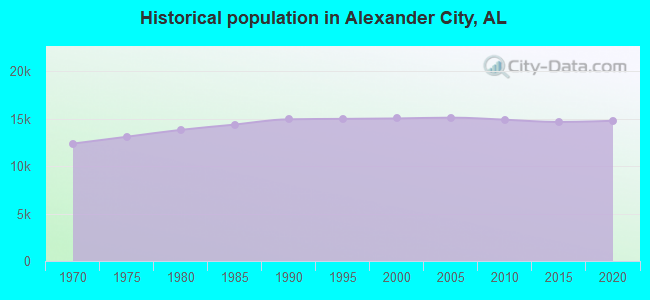
Population in 2022: 14,636 (62% urban, 38% rural). Population change since 2000: -2.5%Males: 7,189 Females: 7,447
March 2022 cost of living index in Alexander City: 77.7 (low, U.S. average is 100) Percentage of residents living in poverty in 2022: 21.1%for White Non-Hispanic residents , 37.0% for Black residents , 52.0% for Hispanic or Latino residents , 30.0% for other race residents , 70.1% for two or more races residents )
Profiles of local businesses
Business Search - 14 Million verified businesses
Data:
Median household income ($)
Median household income (% change since 2000)
Household income diversity
Ratio of average income to average house value (%)
Ratio of average income to average rent
Median household income ($) - White
Median household income ($) - Black or African American
Median household income ($) - Asian
Median household income ($) - Hispanic or Latino
Median household income ($) - American Indian and Alaska Native
Median household income ($) - Multirace
Median household income ($) - Other Race
Median household income for houses/condos with a mortgage ($)
Median household income for apartments without a mortgage ($)
Races - White alone (%)
Races - White alone (% change since 2000)
Races - Black alone (%)
Races - Black alone (% change since 2000)
Races - American Indian alone (%)
Races - American Indian alone (% change since 2000)
Races - Asian alone (%)
Races - Asian alone (% change since 2000)
Races - Hispanic (%)
Races - Hispanic (% change since 2000)
Races - Native Hawaiian and Other Pacific Islander alone (%)
Races - Native Hawaiian and Other Pacific Islander alone (% change since 2000)
Races - Two or more races (%)
Races - Two or more races (% change since 2000)
Races - Other race alone (%)
Races - Other race alone (% change since 2000)
Racial diversity
Unemployment (%)
Unemployment (% change since 2000)
Unemployment (%) - White
Unemployment (%) - Black or African American
Unemployment (%) - Asian
Unemployment (%) - Hispanic or Latino
Unemployment (%) - American Indian and Alaska Native
Unemployment (%) - Multirace
Unemployment (%) - Other Race
Population density (people per square mile)
Population - Males (%)
Population - Females (%)
Population - Males (%) - White
Population - Males (%) - Black or African American
Population - Males (%) - Asian
Population - Males (%) - Hispanic or Latino
Population - Males (%) - American Indian and Alaska Native
Population - Males (%) - Multirace
Population - Males (%) - Other Race
Population - Females (%) - White
Population - Females (%) - Black or African American
Population - Females (%) - Asian
Population - Females (%) - Hispanic or Latino
Population - Females (%) - American Indian and Alaska Native
Population - Females (%) - Multirace
Population - Females (%) - Other Race
Coronavirus confirmed cases (May 16, 2024)
Deaths caused by coronavirus (May 16, 2024)
Coronavirus confirmed cases (per 100k population) (May 16, 2024)
Deaths caused by coronavirus (per 100k population) (May 16, 2024)
Daily increase in number of cases (May 16, 2024)
Weekly increase in number of cases (May 16, 2024)
Cases doubled (in days) (May 16, 2024)
Hospitalized patients (Apr 18, 2022)
Negative test results (Apr 18, 2022)
Total test results (Apr 18, 2022)
COVID Vaccine doses distributed (per 100k population) (Sep 19, 2023)
COVID Vaccine doses administered (per 100k population) (Sep 19, 2023)
COVID Vaccine doses distributed (Sep 19, 2023)
COVID Vaccine doses administered (Sep 19, 2023)
Likely homosexual households (%)
Likely homosexual households (% change since 2000)
Likely homosexual households - Lesbian couples (%)
Likely homosexual households - Lesbian couples (% change since 2000)
Likely homosexual households - Gay men (%)
Likely homosexual households - Gay men (% change since 2000)
Cost of living index
Median gross rent ($)
Median contract rent ($)
Median monthly housing costs ($)
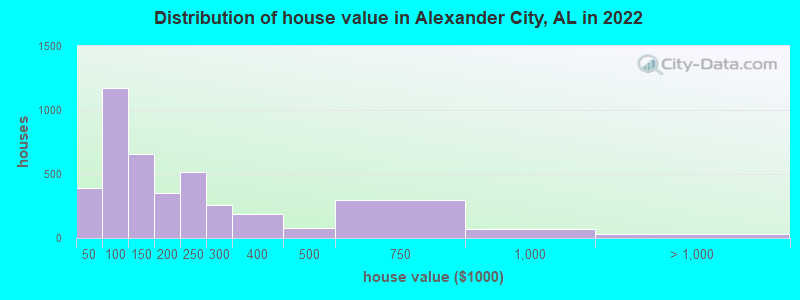
Median house or condo value ($)
Median house or condo value ($ change since 2000)
Mean house or condo value by units in structure - 1, detached ($)
Mean house or condo value by units in structure - 1, attached ($)
Mean house or condo value by units in structure - 2 ($)
Mean house or condo value by units in structure by units in structure - 3 or 4 ($)
Mean house or condo value by units in structure - 5 or more ($)
Mean house or condo value by units in structure - Boat, RV, van, etc. ($)
Mean house or condo value by units in structure - Mobile home ($)
Median house or condo value ($) - White
Median house or condo value ($) - Black or African American
Median house or condo value ($) - Asian
Median house or condo value ($) - Hispanic or Latino
Median house or condo value ($) - American Indian and Alaska Native
Median house or condo value ($) - Multirace
Median house or condo value ($) - Other Race
Median resident age
Resident age diversity
Median resident age - Males
Median resident age - Females
Median resident age - White
Median resident age - Black or African American
Median resident age - Asian
Median resident age - Hispanic or Latino
Median resident age - American Indian and Alaska Native
Median resident age - Multirace
Median resident age - Other Race
Median resident age - Males - White
Median resident age - Males - Black or African American
Median resident age - Males - Asian
Median resident age - Males - Hispanic or Latino
Median resident age - Males - American Indian and Alaska Native
Median resident age - Males - Multirace
Median resident age - Males - Other Race
Median resident age - Females - White
Median resident age - Females - Black or African American
Median resident age - Females - Asian
Median resident age - Females - Hispanic or Latino
Median resident age - Females - American Indian and Alaska Native
Median resident age - Females - Multirace
Median resident age - Females - Other Race
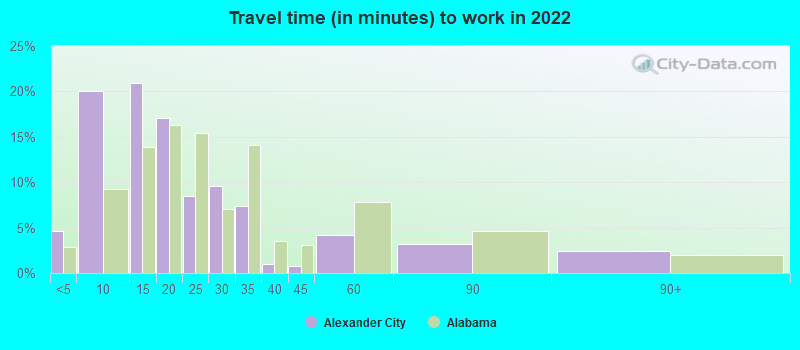
Commute - mean travel time to work (minutes)
Travel time to work - Less than 5 minutes (%)
Travel time to work - Less than 5 minutes (% change since 2000)
Travel time to work - 5 to 9 minutes (%)
Travel time to work - 5 to 9 minutes (% change since 2000)
Travel time to work - 10 to 19 minutes (%)
Travel time to work - 10 to 19 minutes (% change since 2000)
Travel time to work - 20 to 29 minutes (%)
Travel time to work - 20 to 29 minutes (% change since 2000)
Travel time to work - 30 to 39 minutes (%)
Travel time to work - 30 to 39 minutes (% change since 2000)
Travel time to work - 40 to 59 minutes (%)
Travel time to work - 40 to 59 minutes (% change since 2000)
Travel time to work - 60 to 89 minutes (%)
Travel time to work - 60 to 89 minutes (% change since 2000)
Travel time to work - 90 or more minutes (%)
Travel time to work - 90 or more minutes (% change since 2000)
Marital status - Never married (%)
Marital status - Now married (%)
Marital status - Separated (%)
Marital status - Widowed (%)
Marital status - Divorced (%)
Median family income ($)
Median family income (% change since 2000)
Median non-family income ($)
Median non-family income (% change since 2000)
Median per capita income ($)
Median per capita income (% change since 2000)
Median family income ($) - White
Median family income ($) - Black or African American
Median family income ($) - Asian
Median family income ($) - Hispanic or Latino
Median family income ($) - American Indian and Alaska Native
Median family income ($) - Multirace
Median family income ($) - Other Race
Median year house/condo built
Median year apartment built
Year house built - Built 2005 or later (%)
Year house built - Built 2000 to 2004 (%)
Year house built - Built 1990 to 1999 (%)
Year house built - Built 1980 to 1989 (%)
Year house built - Built 1970 to 1979 (%)
Year house built - Built 1960 to 1969 (%)
Year house built - Built 1950 to 1959 (%)
Year house built - Built 1940 to 1949 (%)
Year house built - Built 1939 or earlier (%)
Average household size
Household density (households per square mile)
Average household size - White
Average household size - Black or African American
Average household size - Asian
Average household size - Hispanic or Latino
Average household size - American Indian and Alaska Native
Average household size - Multirace
Average household size - Other Race
Occupied housing units (%)
Vacant housing units (%)
Owner occupied housing units (%)
Renter occupied housing units (%)
Vacancy status - For rent (%)
Vacancy status - For sale only (%)
Vacancy status - Rented or sold, not occupied (%)
Vacancy status - For seasonal, recreational, or occasional use (%)
Vacancy status - For migrant workers (%)
Vacancy status - Other vacant (%)
Residents with income below the poverty level (%)
Residents with income below 50% of the poverty level (%)
Children below poverty level (%)
Poor families by family type - Married-couple family (%)
Poor families by family type - Male, no wife present (%)
Poor families by family type - Female, no husband present (%)
Poverty status for native-born residents (%)
Poverty status for foreign-born residents (%)
Poverty among high school graduates not in families (%)
Poverty among people who did not graduate high school not in families (%)
Residents with income below the poverty level (%) - White
Residents with income below the poverty level (%) - Black or African American
Residents with income below the poverty level (%) - Asian
Residents with income below the poverty level (%) - Hispanic or Latino
Residents with income below the poverty level (%) - American Indian and Alaska Native
Residents with income below the poverty level (%) - Multirace
Residents with income below the poverty level (%) - Other Race
Air pollution - Air Quality Index (AQI)
Air pollution - CO
Air pollution - NO2
Air pollution - SO2
Air pollution - Ozone
Air pollution - PM10
Air pollution - PM25
Air pollution - Pb
Crime - Murders per 100,000 population
Crime - Rapes per 100,000 population
Crime - Robberies per 100,000 population
Crime - Assaults per 100,000 population
Crime - Burglaries per 100,000 population
Crime - Thefts per 100,000 population
Crime - Auto thefts per 100,000 population
Crime - Arson per 100,000 population
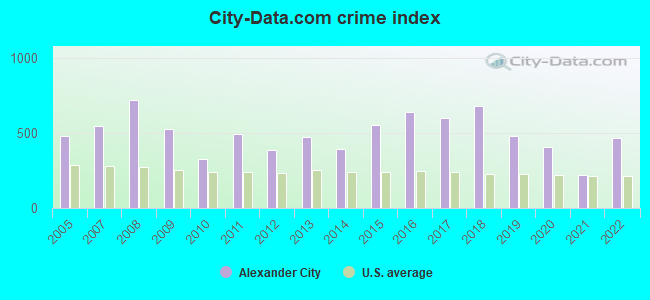
Crime - City-data.com crime index
Crime - Violent crime index
Crime - Property crime index
Crime - Murders per 100,000 population (5 year average)
Crime - Rapes per 100,000 population (5 year average)
Crime - Robberies per 100,000 population (5 year average)
Crime - Assaults per 100,000 population (5 year average)
Crime - Burglaries per 100,000 population (5 year average)
Crime - Thefts per 100,000 population (5 year average)
Crime - Auto thefts per 100,000 population (5 year average)
Crime - Arson per 100,000 population (5 year average)
Crime - City-data.com crime index (5 year average)
Crime - Violent crime index (5 year average)
Crime - Property crime index (5 year average)
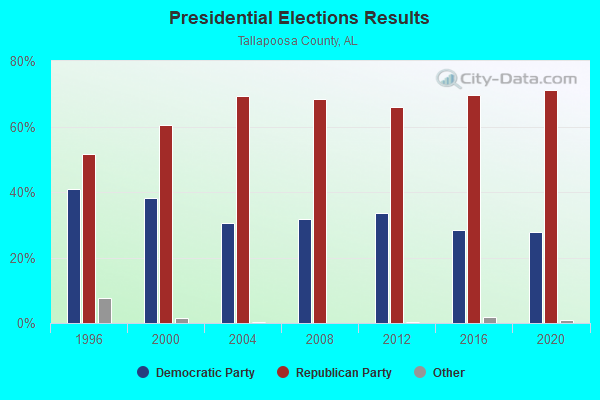
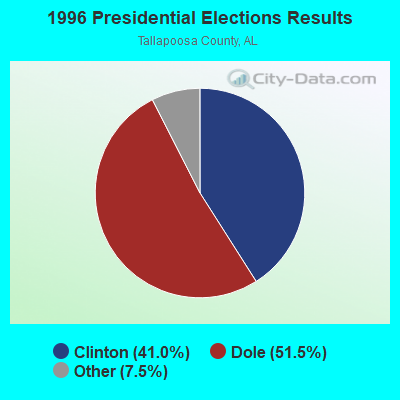
1996 Presidential Elections Results (%) - Democratic Party (Clinton)
1996 Presidential Elections Results (%) - Republican Party (Dole)
1996 Presidential Elections Results (%) - Other
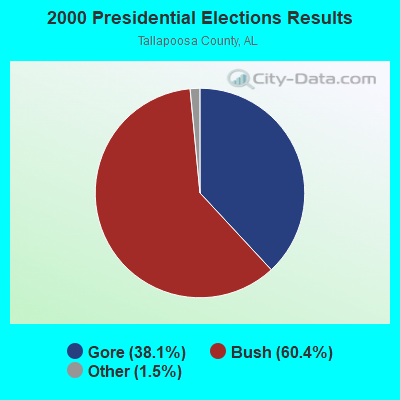
2000 Presidential Elections Results (%) - Democratic Party (Gore)
2000 Presidential Elections Results (%) - Republican Party (Bush)
2000 Presidential Elections Results (%) - Other
2004 Presidential Elections Results (%) - Democratic Party (Kerry)
2004 Presidential Elections Results (%) - Republican Party (Bush)
2004 Presidential Elections Results (%) - Other
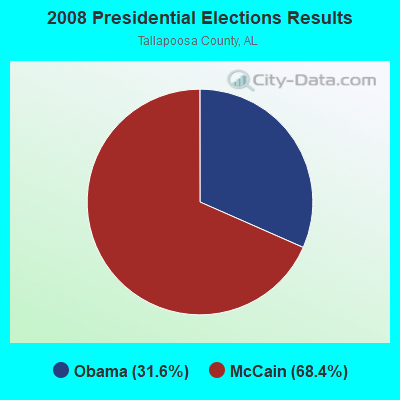
2008 Presidential Elections Results (%) - Democratic Party (Obama)
2008 Presidential Elections Results (%) - Republican Party (McCain)
2008 Presidential Elections Results (%) - Other
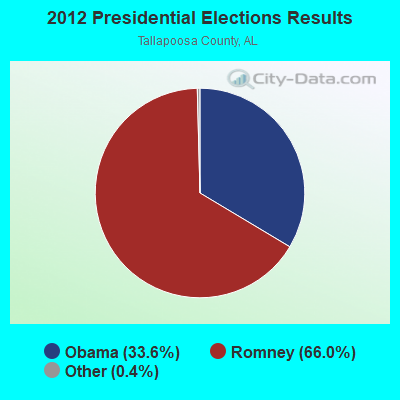
2012 Presidential Elections Results (%) - Democratic Party (Obama)
2012 Presidential Elections Results (%) - Republican Party (Romney)
2012 Presidential Elections Results (%) - Other
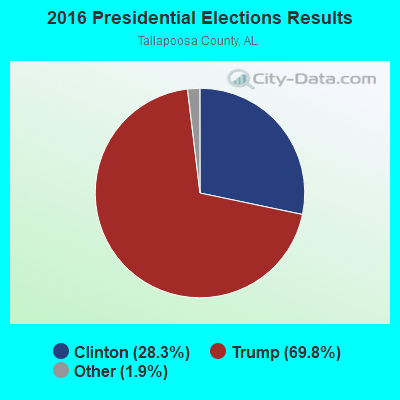
2016 Presidential Elections Results (%) - Democratic Party (Clinton)
2016 Presidential Elections Results (%) - Republican Party (Trump)
2016 Presidential Elections Results (%) - Other
2020 Presidential Elections Results (%) - Democratic Party (Biden)
2020 Presidential Elections Results (%) - Republican Party (Trump)
2020 Presidential Elections Results (%) - Other
Ancestries Reported - Arab (%)
Ancestries Reported - Czech (%)
Ancestries Reported - Danish (%)
Ancestries Reported - Dutch (%)
Ancestries Reported - English (%)
Ancestries Reported - French (%)
Ancestries Reported - French Canadian (%)
Ancestries Reported - German (%)
Ancestries Reported - Greek (%)
Ancestries Reported - Hungarian (%)
Ancestries Reported - Irish (%)
Ancestries Reported - Italian (%)
Ancestries Reported - Lithuanian (%)
Ancestries Reported - Norwegian (%)
Ancestries Reported - Polish (%)
Ancestries Reported - Portuguese (%)
Ancestries Reported - Russian (%)
Ancestries Reported - Scotch-Irish (%)
Ancestries Reported - Scottish (%)
Ancestries Reported - Slovak (%)
Ancestries Reported - Subsaharan African (%)
Ancestries Reported - Swedish (%)
Ancestries Reported - Swiss (%)
Ancestries Reported - Ukrainian (%)
Ancestries Reported - United States (%)
Ancestries Reported - Welsh (%)
Ancestries Reported - West Indian (%)
Ancestries Reported - Other (%)
Educational Attainment - No schooling completed (%)
Educational Attainment - Less than high school (%)
Educational Attainment - High school or equivalent (%)
Educational Attainment - Less than 1 year of college (%)
Educational Attainment - 1 or more years of college (%)
Educational Attainment - Associate degree (%)
Educational Attainment - Bachelor's degree (%)
Educational Attainment - Master's degree (%)
Educational Attainment - Professional school degree (%)
Educational Attainment - Doctorate degree (%)
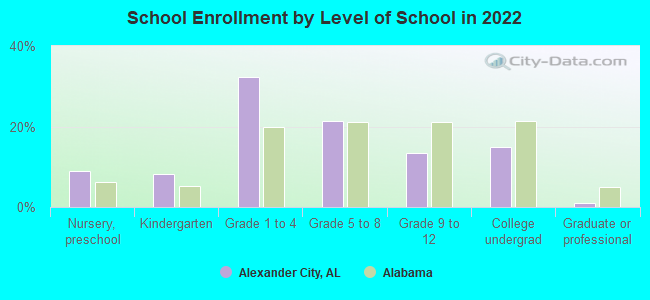
School Enrollment - Nursery, preschool (%)
School Enrollment - Kindergarten (%)
School Enrollment - Grade 1 to 4 (%)
School Enrollment - Grade 5 to 8 (%)
School Enrollment - Grade 9 to 12 (%)
School Enrollment - College undergrad (%)
School Enrollment - Graduate or professional (%)
School Enrollment - Not enrolled in school (%)
School enrollment - Public schools (%)
School enrollment - Private schools (%)
School enrollment - Not enrolled (%)
Median number of rooms in houses and condos
Median number of rooms in apartments
Housing units lacking complete plumbing facilities (%)
Housing units lacking complete kitchen facilities (%)
Density of houses
Urban houses (%)
Rural houses (%)
Households with people 60 years and over (%)
Households with people 65 years and over (%)
Households with people 75 years and over (%)
Households with one or more nonrelatives (%)
Households with no nonrelatives (%)
Population in households (%)
Family households (%)
Nonfamily households (%)
Population in families (%)
Family households with own children (%)
Median number of bedrooms in owner occupied houses
Mean number of bedrooms in owner occupied houses
Median number of bedrooms in renter occupied houses
Mean number of bedrooms in renter occupied houses
Median number of vehichles in owner occupied houses
Mean number of vehichles in owner occupied houses
Median number of vehichles in renter occupied houses
Mean number of vehichles in renter occupied houses
Mortgage status - with mortgage (%)
Mortgage status - with second mortgage (%)
Mortgage status - with home equity loan (%)
Mortgage status - with both second mortgage and home equity loan (%)
Mortgage status - without a mortgage (%)
Average family size
Average family size - White
Average family size - Black or African American
Average family size - Asian
Average family size - Hispanic or Latino
Average family size - American Indian and Alaska Native
Average family size - Multirace
Average family size - Other Race
Geographical mobility - Same house 1 year ago (%)
Geographical mobility - Moved within same county (%)
Geographical mobility - Moved from different county within same state (%)
Geographical mobility - Moved from different state (%)
Geographical mobility - Moved from abroad (%)
Place of birth - Born in state of residence (%)
Place of birth - Born in other state (%)
Place of birth - Native, outside of US (%)
Place of birth - Foreign born (%)
Housing units in structures - 1, detached (%)
Housing units in structures - 1, attached (%)
Housing units in structures - 2 (%)
Housing units in structures - 3 or 4 (%)
Housing units in structures - 5 to 9 (%)
Housing units in structures - 10 to 19 (%)
Housing units in structures - 20 to 49 (%)
Housing units in structures - 50 or more (%)
Housing units in structures - Mobile home (%)
Housing units in structures - Boat, RV, van, etc. (%)
House/condo owner moved in on average (years ago)
Renter moved in on average (years ago)
Year householder moved into unit - Moved in 1999 to March 2000 (%)
Year householder moved into unit - Moved in 1995 to 1998 (%)
Year householder moved into unit - Moved in 1990 to 1994 (%)
Year householder moved into unit - Moved in 1980 to 1989 (%)
Year householder moved into unit - Moved in 1970 to 1979 (%)
Year householder moved into unit - Moved in 1969 or earlier (%)
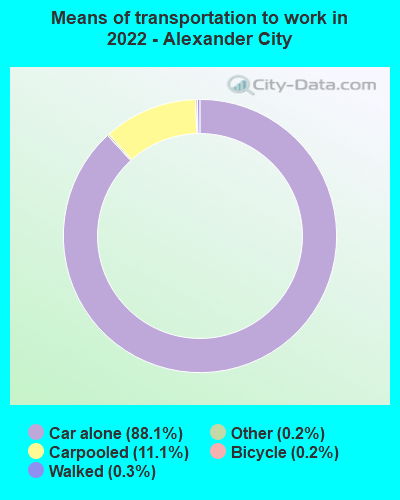
Means of transportation to work - Drove car alone (%)
Means of transportation to work - Carpooled (%)
Means of transportation to work - Public transportation (%)
Means of transportation to work - Bus or trolley bus (%)
Means of transportation to work - Streetcar or trolley car (%)
Means of transportation to work - Subway or elevated (%)
Means of transportation to work - Railroad (%)
Means of transportation to work - Ferryboat (%)
Means of transportation to work - Taxicab (%)
Means of transportation to work - Motorcycle (%)
Means of transportation to work - Bicycle (%)
Means of transportation to work - Walked (%)
Means of transportation to work - Other means (%)
Working at home (%)
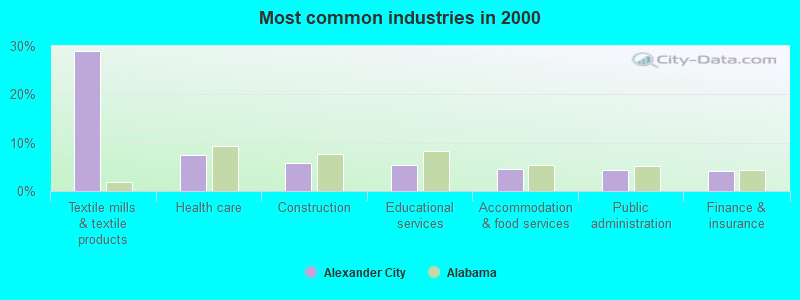
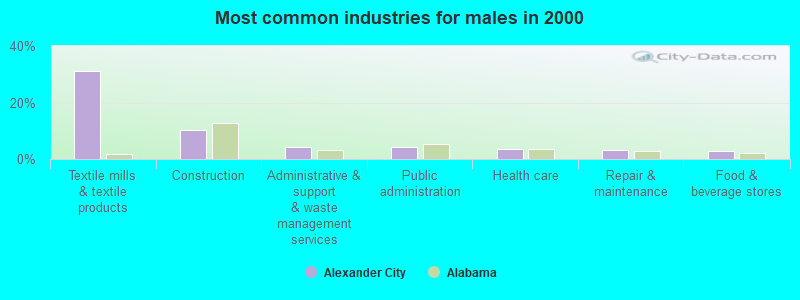
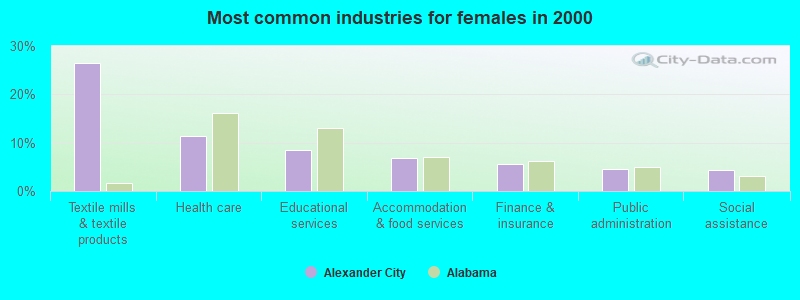
Industry diversity
Most Common Industries - Agriculture, forestry, fishing and hunting, and mining (%)
Most Common Industries - Agriculture, forestry, fishing and hunting (%)
Most Common Industries - Mining, quarrying, and oil and gas extraction (%)
Most Common Industries - Construction (%)
Most Common Industries - Manufacturing (%)
Most Common Industries - Wholesale trade (%)
Most Common Industries - Retail trade (%)
Most Common Industries - Transportation and warehousing, and utilities (%)
Most Common Industries - Transportation and warehousing (%)
Most Common Industries - Utilities (%)
Most Common Industries - Information (%)
Most Common Industries - Finance and insurance, and real estate and rental and leasing (%)
Most Common Industries - Finance and insurance (%)
Most Common Industries - Real estate and rental and leasing (%)
Most Common Industries - Professional, scientific, and management, and administrative and waste management services (%)
Most Common Industries - Professional, scientific, and technical services (%)
Most Common Industries - Management of companies and enterprises (%)
Most Common Industries - Administrative and support and waste management services (%)
Most Common Industries - Educational services, and health care and social assistance (%)
Most Common Industries - Educational services (%)
Most Common Industries - Health care and social assistance (%)
Most Common Industries - Arts, entertainment, and recreation, and accommodation and food services (%)
Most Common Industries - Arts, entertainment, and recreation (%)
Most Common Industries - Accommodation and food services (%)
Most Common Industries - Other services, except public administration (%)
Most Common Industries - Public administration (%)
Occupation diversity
Most Common Occupations - Management, business, science, and arts occupations (%)
Most Common Occupations - Management, business, and financial occupations (%)
Most Common Occupations - Management occupations (%)
Most Common Occupations - Business and financial operations occupations (%)
Most Common Occupations - Computer, engineering, and science occupations (%)
Most Common Occupations - Computer and mathematical occupations (%)
Most Common Occupations - Architecture and engineering occupations (%)
Most Common Occupations - Life, physical, and social science occupations (%)
Most Common Occupations - Education, legal, community service, arts, and media occupations (%)
Most Common Occupations - Community and social service occupations (%)
Most Common Occupations - Legal occupations (%)
Most Common Occupations - Education, training, and library occupations (%)
Most Common Occupations - Arts, design, entertainment, sports, and media occupations (%)
Most Common Occupations - Healthcare practitioners and technical occupations (%)
Most Common Occupations - Health diagnosing and treating practitioners and other technical occupations (%)
Most Common Occupations - Health technologists and technicians (%)
Most Common Occupations - Service occupations (%)
Most Common Occupations - Healthcare support occupations (%)
Most Common Occupations - Protective service occupations (%)
Most Common Occupations - Fire fighting and prevention, and other protective service workers including supervisors (%)
Most Common Occupations - Law enforcement workers including supervisors (%)
Most Common Occupations - Food preparation and serving related occupations (%)
Most Common Occupations - Building and grounds cleaning and maintenance occupations (%)
Most Common Occupations - Personal care and service occupations (%)
Most Common Occupations - Sales and office occupations (%)
Most Common Occupations - Sales and related occupations (%)
Most Common Occupations - Office and administrative support occupations (%)
Most Common Occupations - Natural resources, construction, and maintenance occupations (%)
Most Common Occupations - Farming, fishing, and forestry occupations (%)
Most Common Occupations - Construction and extraction occupations (%)
Most Common Occupations - Installation, maintenance, and repair occupations (%)
Most Common Occupations - Production, transportation, and material moving occupations (%)
Most Common Occupations - Production occupations (%)
Most Common Occupations - Transportation occupations (%)
Most Common Occupations - Material moving occupations (%)
People in Group quarters - Institutionalized population (%)
People in Group quarters - Correctional institutions (%)
People in Group quarters - Federal prisons and detention centers (%)
People in Group quarters - Halfway houses (%)
People in Group quarters - Local jails and other confinement facilities (including police lockups) (%)
People in Group quarters - Military disciplinary barracks (%)
People in Group quarters - State prisons (%)
People in Group quarters - Other types of correctional institutions (%)
People in Group quarters - Nursing homes (%)
People in Group quarters - Hospitals/wards, hospices, and schools for the handicapped (%)
People in Group quarters - Hospitals/wards and hospices for chronically ill (%)
People in Group quarters - Hospices or homes for chronically ill (%)
People in Group quarters - Military hospitals or wards for chronically ill (%)
People in Group quarters - Other hospitals or wards for chronically ill (%)
People in Group quarters - Hospitals or wards for drug/alcohol abuse (%)
People in Group quarters - Mental (Psychiatric) hospitals or wards (%)
People in Group quarters - Schools, hospitals, or wards for the mentally retarded (%)
People in Group quarters - Schools, hospitals, or wards for the physically handicapped (%)
People in Group quarters - Institutions for the deaf (%)
People in Group quarters - Institutions for the blind (%)
People in Group quarters - Orthopedic wards and institutions for the physically handicapped (%)
People in Group quarters - Wards in general hospitals for patients who have no usual home elsewhere (%)
People in Group quarters - Wards in military hospitals for patients who have no usual home elsewhere (%)
People in Group quarters - Juvenile institutions (%)
People in Group quarters - Long-term care (%)
People in Group quarters - Homes for abused, dependent, and neglected children (%)
People in Group quarters - Residential treatment centers for emotionally disturbed children (%)
People in Group quarters - Training schools for juvenile delinquents (%)
People in Group quarters - Short-term care, detention or diagnostic centers for delinquent children (%)
People in Group quarters - Type of juvenile institution unknown (%)
People in Group quarters - Noninstitutionalized population (%)
People in Group quarters - College dormitories (includes college quarters off campus) (%)
People in Group quarters - Military quarters (%)
People in Group quarters - On base (%)
People in Group quarters - Barracks, unaccompanied personnel housing (UPH), (Enlisted/Officer), ;and similar group living quarters for military personnel (%)
People in Group quarters - Transient quarters for temporary residents (%)
People in Group quarters - Military ships (%)
People in Group quarters - Group homes (%)
People in Group quarters - Homes or halfway houses for drug/alcohol abuse (%)
People in Group quarters - Homes for the mentally ill (%)
People in Group quarters - Homes for the mentally retarded (%)
People in Group quarters - Homes for the physically handicapped (%)
People in Group quarters - Other group homes (%)
People in Group quarters - Religious group quarters (%)
People in Group quarters - Dormitories (%)
People in Group quarters - Agriculture workers' dormitories on farms (%)
People in Group quarters - Job Corps and vocational training facilities (%)
People in Group quarters - Other workers' dormitories (%)
People in Group quarters - Crews of maritime vessels (%)
People in Group quarters - Other nonhousehold living situations (%)
People in Group quarters - Other noninstitutional group quarters (%)
Residents speaking English at home (%)
Residents speaking English at home - Born in the United States (%)
Residents speaking English at home - Native, born elsewhere (%)
Residents speaking English at home - Foreign born (%)
Residents speaking Spanish at home (%)
Residents speaking Spanish at home - Born in the United States (%)
Residents speaking Spanish at home - Native, born elsewhere (%)
Residents speaking Spanish at home - Foreign born (%)
Residents speaking other language at home (%)
Residents speaking other language at home - Born in the United States (%)
Residents speaking other language at home - Native, born elsewhere (%)
Residents speaking other language at home - Foreign born (%)
Class of Workers - Employee of private company (%)
Class of Workers - Self-employed in own incorporated business (%)
Class of Workers - Private not-for-profit wage and salary workers (%)
Class of Workers - Local government workers (%)
Class of Workers - State government workers (%)
Class of Workers - Federal government workers (%)
Class of Workers - Self-employed workers in own not incorporated business and Unpaid family workers (%)
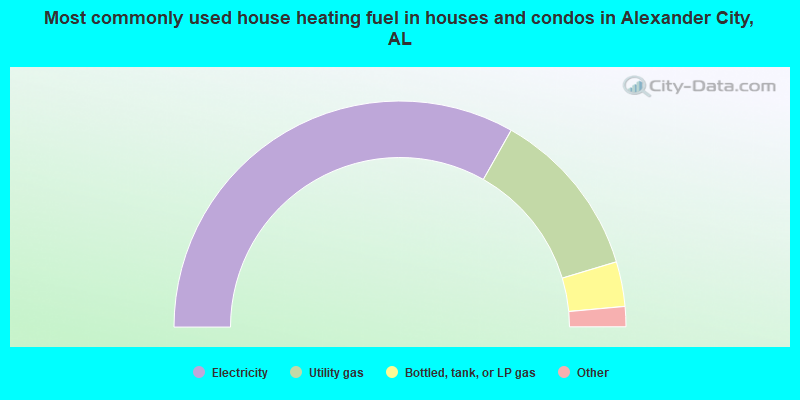
House heating fuel used in houses and condos - Utility gas (%)
House heating fuel used in houses and condos - Bottled, tank, or LP gas (%)
House heating fuel used in houses and condos - Electricity (%)
House heating fuel used in houses and condos - Fuel oil, kerosene, etc. (%)
House heating fuel used in houses and condos - Coal or coke (%)
House heating fuel used in houses and condos - Wood (%)
House heating fuel used in houses and condos - Solar energy (%)
House heating fuel used in houses and condos - Other fuel (%)
House heating fuel used in houses and condos - No fuel used (%)
House heating fuel used in apartments - Utility gas (%)
House heating fuel used in apartments - Bottled, tank, or LP gas (%)
House heating fuel used in apartments - Electricity (%)
House heating fuel used in apartments - Fuel oil, kerosene, etc. (%)
House heating fuel used in apartments - Coal or coke (%)
House heating fuel used in apartments - Wood (%)
House heating fuel used in apartments - Solar energy (%)
House heating fuel used in apartments - Other fuel (%)
House heating fuel used in apartments - No fuel used (%)
Armed forces status - In Armed Forces (%)
Armed forces status - Civilian (%)
Armed forces status - Civilian - Veteran (%)
Armed forces status - Civilian - Nonveteran (%)
Fatal accidents locations in years 2005-2021
Fatal accidents locations in 2005
Fatal accidents locations in 2006
Fatal accidents locations in 2007
Fatal accidents locations in 2008
Fatal accidents locations in 2009
Fatal accidents locations in 2010
Fatal accidents locations in 2011
Fatal accidents locations in 2012
Fatal accidents locations in 2013
Fatal accidents locations in 2014
Fatal accidents locations in 2015
Fatal accidents locations in 2016
Fatal accidents locations in 2017
Fatal accidents locations in 2018
Fatal accidents locations in 2019
Fatal accidents locations in 2020
Fatal accidents locations in 2021
Alcohol use - People drinking some alcohol every month (%)
Alcohol use - People not drinking at all (%)
Alcohol use - Average days/month drinking alcohol
Alcohol use - Average drinks/week
Alcohol use - Average days/year people drink much
Audiometry - Average condition of hearing (%)
Audiometry - People that can hear a whisper from across a quiet room (%)
Audiometry - People that can hear normal voice from across a quiet room (%)
Audiometry - Ears ringing, roaring, buzzing (%)
Audiometry - Had a job exposure to loud noise (%)
Audiometry - Had off-work exposure to loud noise (%)
Blood Pressure & Cholesterol - Has high blood pressure (%)
Blood Pressure & Cholesterol - Checking blood pressure at home (%)
Blood Pressure & Cholesterol - Frequently checking blood cholesterol (%)
Blood Pressure & Cholesterol - Has high cholesterol level (%)
Consumer Behavior - Money monthly spent on food at supermarket/grocery store
Consumer Behavior - Money monthly spent on food at other stores
Consumer Behavior - Money monthly spent on eating out
Consumer Behavior - Money monthly spent on carryout/delivered foods
Consumer Behavior - Income spent on food at supermarket/grocery store (%)
Consumer Behavior - Income spent on food at other stores (%)
Consumer Behavior - Income spent on eating out (%)
Consumer Behavior - Income spent on carryout/delivered foods (%)
Current Health Status - General health condition (%)
Current Health Status - Blood donors (%)
Current Health Status - Has blood ever tested for HIV virus (%)
Current Health Status - Left-handed people (%)
Dermatology - People using sunscreen (%)
Diabetes - Diabetics (%)
Diabetes - Had a blood test for high blood sugar (%)
Diabetes - People taking insulin (%)
Diet Behavior & Nutrition - Diet health (%)
Diet Behavior & Nutrition - Milk product consumption (# of products/month)
Diet Behavior & Nutrition - Meals not home prepared (#/week)
Diet Behavior & Nutrition - Meals from fast food or pizza place (#/week)
Diet Behavior & Nutrition - Ready-to-eat foods (#/month)
Diet Behavior & Nutrition - Frozen meals/pizza (#/month)
Drug Use - People that ever used marijuana or hashish (%)
Drug Use - Ever used hard drugs (%)
Drug Use - Ever used any form of cocaine (%)
Drug Use - Ever used heroin (%)
Drug Use - Ever used methamphetamine (%)
Health Insurance - People covered by health insurance (%)
Kidney Conditions-Urology - Avg. # of times urinating at night
Medical Conditions - People with asthma (%)
Medical Conditions - People with anemia (%)
Medical Conditions - People with psoriasis (%)
Medical Conditions - People with overweight (%)
Medical Conditions - Elderly people having difficulties in thinking or remembering (%)
Medical Conditions - People who ever received blood transfusion (%)
Medical Conditions - People having trouble seeing even with glass/contacts (%)
Medical Conditions - People with arthritis (%)
Medical Conditions - People with gout (%)
Medical Conditions - People with congestive heart failure (%)
Medical Conditions - People with coronary heart disease (%)
Medical Conditions - People with angina pectoris (%)
Medical Conditions - People who ever had heart attack (%)
Medical Conditions - People who ever had stroke (%)
Medical Conditions - People with emphysema (%)
Medical Conditions - People with thyroid problem (%)
Medical Conditions - People with chronic bronchitis (%)
Medical Conditions - People with any liver condition (%)
Medical Conditions - People who ever had cancer or malignancy (%)
Mental Health - People who have little interest in doing things (%)
Mental Health - People feeling down, depressed, or hopeless (%)
Mental Health - People who have trouble sleeping or sleeping too much (%)
Mental Health - People feeling tired or having little energy (%)
Mental Health - People with poor appetite or overeating (%)
Mental Health - People feeling bad about themself (%)
Mental Health - People who have trouble concentrating on things (%)
Mental Health - People moving or speaking slowly or too fast (%)
Mental Health - People having thoughts they would be better off dead (%)
Oral Health - Average years since last visit a dentist
Oral Health - People embarrassed because of mouth (%)
Oral Health - People with gum disease (%)
Oral Health - General health of teeth and gums (%)
Oral Health - Average days a week using dental floss/device
Oral Health - Average days a week using mouthwash for dental problem
Oral Health - Average number of teeth
Pesticide Use - Households using pesticides to control insects (%)
Pesticide Use - Households using pesticides to kill weeds (%)
Physical Activity - People doing vigorous-intensity work activities (%)
Physical Activity - People doing moderate-intensity work activities (%)
Physical Activity - People walking or bicycling (%)
Physical Activity - People doing vigorous-intensity recreational activities (%)
Physical Activity - People doing moderate-intensity recreational activities (%)
Physical Activity - Average hours a day doing sedentary activities
Physical Activity - Average hours a day watching TV or videos
Physical Activity - Average hours a day using computer
Physical Functioning - People having limitations keeping them from working (%)
Physical Functioning - People limited in amount of work they can do (%)
Physical Functioning - People that need special equipment to walk (%)
Physical Functioning - People experiencing confusion/memory problems (%)
Physical Functioning - People requiring special healthcare equipment (%)
Prescription Medications - Average number of prescription medicines taking
Preventive Aspirin Use - Adults 40+ taking low-dose aspirin (%)
Reproductive Health - Vaginal deliveries (%)
Reproductive Health - Cesarean deliveries (%)
Reproductive Health - Deliveries resulted in a live birth (%)
Reproductive Health - Pregnancies resulted in a delivery (%)
Reproductive Health - Women breastfeeding newborns (%)
Reproductive Health - Women that had a hysterectomy (%)
Reproductive Health - Women that had both ovaries removed (%)
Reproductive Health - Women that have ever taken birth control pills (%)
Reproductive Health - Women taking birth control pills (%)
Reproductive Health - Women that have ever used Depo-Provera or injectables (%)
Reproductive Health - Women that have ever used female hormones (%)
Sexual Behavior - People 18+ that ever had sex (vaginal, anal, or oral) (%)
Sexual Behavior - Males 18+ that ever had vaginal sex with a woman (%)
Sexual Behavior - Males 18+ that ever performed oral sex on a woman (%)
Sexual Behavior - Males 18+ that ever had anal sex with a woman (%)
Sexual Behavior - Males 18+ that ever had any sex with a man (%)
Sexual Behavior - Females 18+ that ever had vaginal sex with a man (%)
Sexual Behavior - Females 18+ that ever performed oral sex on a man (%)
Sexual Behavior - Females 18+ that ever had anal sex with a man (%)
Sexual Behavior - Females 18+ that ever had any kind of sex with a woman (%)
Sexual Behavior - Average age people first had sex
Sexual Behavior - Average number of female sex partners in lifetime (males 18+)
Sexual Behavior - Average number of female vaginal sex partners in lifetime (males 18+)
Sexual Behavior - Average age people first performed oral sex on a woman (18+)
Sexual Behavior - Average number of woman performed oral sex on in lifetime (18+)
Sexual Behavior - Average number of male sex partners in lifetime (males 18+)
Sexual Behavior - Average number of male anal sex partners in lifetime (males 18+)
Sexual Behavior - Average age people first performed oral sex on a man (18+)
Sexual Behavior - Average number of male oral sex partners in lifetime (18+)
Sexual Behavior - People using protection when performing oral sex (%)
Sexual Behavior - Average number of times people have vaginal or anal sex a year
Sexual Behavior - People having sex without condom (%)
Sexual Behavior - Average number of male sex partners in lifetime (females 18+)
Sexual Behavior - Average number of male vaginal sex partners in lifetime (females 18+)
Sexual Behavior - Average number of female sex partners in lifetime (females 18+)
Sexual Behavior - Circumcised males 18+ (%)
Sleep Disorders - Average hours sleeping at night
Sleep Disorders - People that has trouble sleeping (%)
Smoking-Cigarette Use - People smoking cigarettes (%)
Taste & Smell - People 40+ having problems with smell (%)
Taste & Smell - People 40+ having problems with taste (%)
Taste & Smell - People 40+ that ever had wisdom teeth removed (%)
Taste & Smell - People 40+ that ever had tonsils teeth removed (%)
Taste & Smell - People 40+ that ever had a loss of consciousness because of a head injury (%)
Taste & Smell - People 40+ that ever had a broken nose or other serious injury to face or skull (%)
Taste & Smell - People 40+ that ever had two or more sinus infections (%)
Weight - Average height (inches)
Weight - Average weight (pounds)
Weight - Average BMI
Weight - People that are obese (%)
Weight - People that ever were obese (%)
Weight - People trying to lose weight (%)
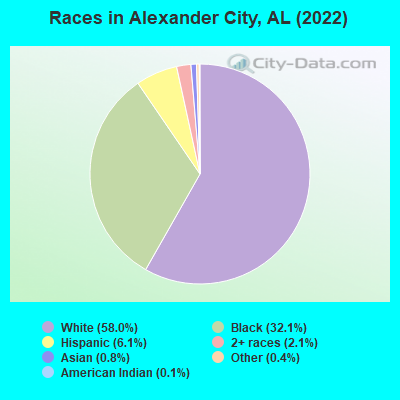
8,660 58.0% White alone 4,797 32.1% Black alone 905 6.1% Hispanic 308 2.1% Two or more races 118 0.8% Asian alone 55 0.4% Other race alone 16 0.1% American Indian alone
Officers per 1,000 residents here:
3.55Alabama average:
2.40
Latest news from Alexander City, AL collected exclusively by city-data.com from local newspapers, TV, and radio stations
Ancestries: American (12.7%), English (8.0%), Irish (5.3%), Scotch-Irish (3.8%), Italian (1.6%).
Current Local Time:
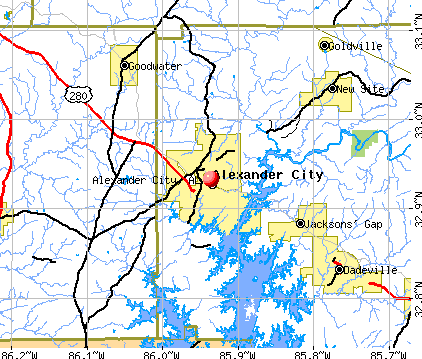
Land area: 38.8 square miles.
Population density: 377 people per square mile (very low).
459 residents are foreign born (2.1% Latin America , 0.6% Europe , 0.4% Asia ).
This city:
3.1%Alabama:
3.5%
Median real estate property taxes paid for housing units with mortgages in 2022: $499 (0.4%)Median real estate property taxes paid for housing units with no mortgage in 2022: $433 (0.3%)
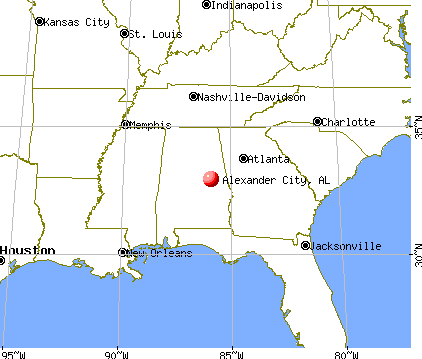
Nearest city with pop. 50,000+: Montgomery, AL
Nearest city with pop. 1,000,000+: Houston, TX
Nearest cities:
Latitude: 32.93 N, Longitude: 85.94 W
Daytime population change due to commuting: +2,234 (+15.0%)Workers who live and work in this city: 3,473 (63.8%)
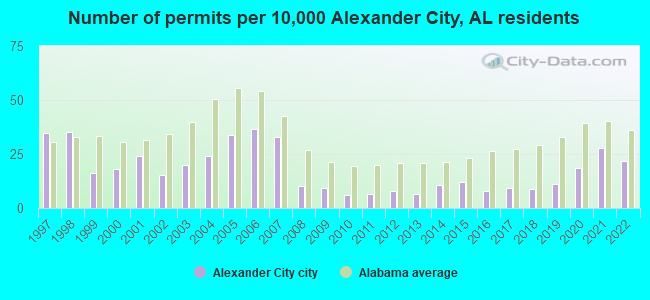
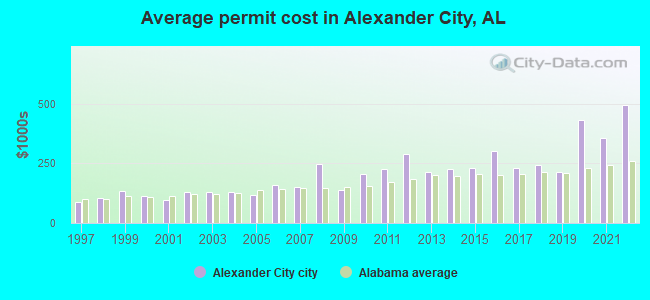
Single-family new house construction building permits:
2022: 33 buildings , average cost: $494,3002021: 42 buildings , average cost: $356,7002020: 28 buildings , average cost: $432,4002019: 17 buildings , average cost: $214,0002018: 13 buildings , average cost: $244,4002017: 14 buildings , average cost: $231,9002016: 12 buildings , average cost: $300,6002015: 18 buildings , average cost: $229,1002014: 16 buildings , average cost: $223,9002013: 10 buildings , average cost: $213,0002012: 12 buildings , average cost: $287,7002011: 10 buildings , average cost: $224,4002010: 9 buildings , average cost: $206,3002009: 14 buildings , average cost: $137,7002008: 15 buildings , average cost: $244,7002007: 49 buildings , average cost: $151,2002006: 55 buildings , average cost: $157,9002005: 51 buildings , average cost: $116,9002004: 36 buildings , average cost: $127,9002003: 30 buildings , average cost: $128,5002002: 23 buildings , average cost: $130,3002001: 36 buildings , average cost: $94,7002000: 27 buildings , average cost: $111,9001999: 24 buildings , average cost: $135,8001998: 53 buildings , average cost: $102,8001997: 52 buildings , average cost: $85,800Unemployment in December 2023:
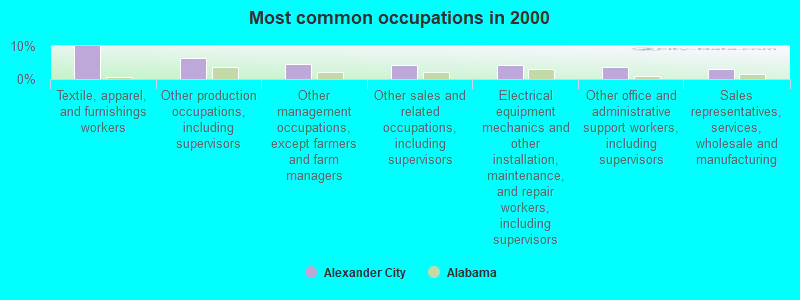
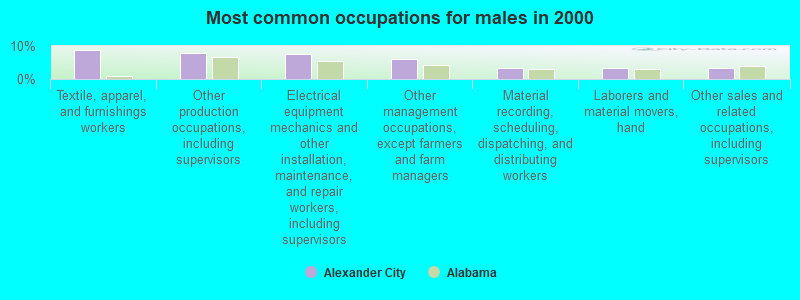
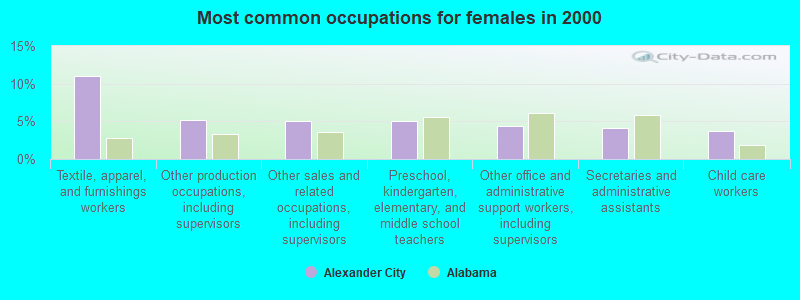
Most common occupations in Alexander City, AL (%)
Both Males Females
Textile, apparel, and furnishings workers (10.0%)
Other production occupations, including supervisors (6.4%)
Other management occupations, except farmers and farm managers (4.4%)
Other sales and related occupations, including supervisors (4.2%)
Electrical equipment mechanics and other installation, maintenance, and repair workers, including supervisors (4.1%)
Other office and administrative support workers, including supervisors (3.7%)
Sales representatives, services, wholesale and manufacturing (3.1%)
Textile, apparel, and furnishings workers (8.9%)
Other production occupations, including supervisors (7.8%)
Electrical equipment mechanics and other installation, maintenance, and repair workers, including supervisors (7.4%)
Other management occupations, except farmers and farm managers (6.0%)
Material recording, scheduling, dispatching, and distributing workers (3.4%)
Laborers and material movers, hand (3.4%)
Other sales and related occupations, including supervisors (3.4%)
Textile, apparel, and furnishings workers (11.1%)
Other production occupations, including supervisors (5.1%)
Other sales and related occupations, including supervisors (5.0%)
Preschool, kindergarten, elementary, and middle school teachers (5.0%)
Other office and administrative support workers, including supervisors (4.4%)
Secretaries and administrative assistants (4.2%)
Child care workers (3.7%)
Tornado activity:
Alexander City-area historical tornado activity is slightly below Alabama state average. It is 70% greater than the overall U.S. average.
On 5/1/1953, a category F4 (max. wind speeds 207-260 mph) tornado 19.8 miles away from the Alexander City city center killed 7 people and injured 12 people and caused between $50,000 and $500,000 in damages.
On 3/18/1996, a category F3 (max. wind speeds 158-206 mph) tornado 8.2 miles away from the city center caused $700,000 in damages.
Earthquake activity:
Alexander City-area historical earthquake activity is significantly above Alabama state average. It is 76% greater than the overall U.S. average. On 1/18/1999 at 07:00:53, a magnitude 4.8 (4.8 MB, 4.0 LG, Depth: 0.6 mi, Class: Light, Intensity: IV - V) earthquake occurred 83.0 miles away from the city center On 4/29/2003 at 08:59:39, a magnitude 4.9 (4.4 MB, 4.6 MW, 4.9 LG) earthquake occurred 109.4 miles away from Alexander City center On 10/24/1997 at 08:35:17, a magnitude 4.9 (4.8 MB, 4.2 MS, 4.9 LG, Depth: 6.2 mi) earthquake occurred 147.7 miles away from the city center On 4/29/2003 at 08:59:39, a magnitude 4.6 (4.6 MW, Depth: 12.3 mi) earthquake occurred 109.4 miles away from the city center On 6/24/1975 at 11:11:36, a magnitude 4.5 (4.5 MB) earthquake occurred 122.7 miles away from Alexander City center On 8/2/1974 at 08:52:09, a magnitude 4.9 (4.3 MB, 4.9 LG) earthquake occurred 209.4 miles away from the city center Magnitude types: regional Lg-wave magnitude (LG), body-wave magnitude (MB), surface-wave magnitude (MS), moment magnitude (MW) Natural disasters: The number of natural disasters in Tallapoosa County (14) is near the US average (15).Major Disasters (Presidential) Declared: 8Emergencies Declared: 5Storms: 6, Hurricanes: 5, Tornadoes: 5, Floods: 4, Winds: 4, Drought: 1, Snowfall: 1, Winter Storm: 1, Other: 1 (Note: some incidents may be assigned to more than one category). Main business address for: RUSSELL CORP KNIT OUTERWEAR MILLS ).
Hospitals and medical centers in Alexander City: FAITH HOSPICE (625 ALEX CITY SHOPPING CENTER DRIVE) RUSSELL HOSPITAL (Voluntary non-profit - Private, 3316 HIGHWAY 280) RUSSELL MEDICAL CENTER HOSPICE (3316 HIGHWAY 280) SOUTHERN CARE ALEXANDER CITY (137 FRANKLIN STREET) ADAMS NURSING HOME (1555 HILLABEE STREET)
BROWN NH (RT 1 BOX 838)
BROWN NURSING HOME (2334 WASHINGTON STREET)
CHAPMAN HEALTHCARE CENTER, INC (3701 DADEVILLE ROAD)
FMC ALEXANDER CITY (3368 HWY 280 BYPASS)
Airports located in Alexander City:
College/University in Alexander City: Central Alabama Community College Full-time enrollment: 1,489; Location: 1675 Cherokee Rd; Public; Website: www.cacc.edu)
Colleges/universities with over 2000 students nearest to Alexander City:
Southern Union State Community College (about 25 miles; Wadley, AL ; Full-time enrollment: 4,120)
Auburn University (about 35 miles; Auburn University, AL ; FT enrollment: 22,741)
Tuskegee University (about 38 miles; Tuskegee, AL ; FT enrollment: 2,810)
Faulkner University (about 42 miles; Montgomery, AL ; FT enrollment: 2,887)
Auburn University at Montgomery (about 42 miles; Montgomery, AL ; FT enrollment: 4,092)
Alabama State University (about 45 miles; Montgomery, AL ; FT enrollment: 5,457)
University of Montevallo (about 56 miles; Montevallo, AL ; FT enrollment: 2,826)
Public high school in Alexander City:
Private high school in Alexander City: FAITH CHRISTIAN ACADEMY Students: 51, Location: 425 FRANKLIN ST, Grades: PK-10)
Public elementary/middle schools in Alexander City:
See full list of schools located in Alexander City Library in Alexander City: ALEXANDER CITY - ADELIA MCCONNELL RUSSELL LIBRARY Operating income: $474,301; Location: 318 CHURCH STREET; 33,786 books ; 1,841 audio materials ; 3,902 video materials ; 2 local licensed databases ; 81 state licensed databases ; 87 print serial subscriptions )
User-submitted facts and corrections:
Birth place of Jim Phillips. He played football for Auburn University, and went on to play professional football in the NFL with the Los Angeles Rams and the Minnesota Vikings.
WRFS-AM owner is Joy Christian Communications, Inc. WRFS-AM is known locally as "Joy Christian Radio" WRFS-AM is at AM-1050 WRFS-AM is licensed to Alexander City, and is located in Alexander City. WRFS-AM is 1000watts non-directional.
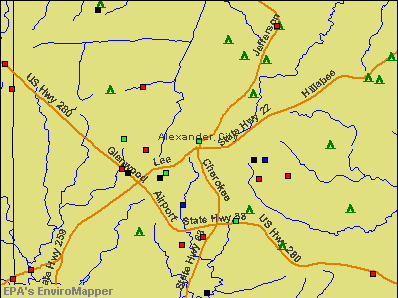
Notable locations in Alexander City: (A) , Midway Golf Club (B) , Dobbs Sewage Disposal Plant (C) , Christian Creek Sewage Disposal Plant (D) , Sugar Creek Filter Plant (E) , Duncan Community Center (F) , Alexander City Post Offie (G) , Alexander City City Hall (H) , Alexander City Fire Department Station 1 (I) , Alexander City Fire Department Station 2 (J) . Display/hide their locations on the map
Shopping Centers: (1) , Alexander City Shopping Center (2) . Display/hide their locations on the map
Churches in Alexander City include: (A) , Trinity Methodist Church (B) , Sunny Level Baptist Church (C) , Sixth Street Baptist Church (D) , Selena Baptist Church (E) , Sanctified Church (F) , Saint John the Apostle Catholic Church (G) , Saint James Episcopal Church (H) , Robinson Memorial Presbyterian Church (I) . Display/hide their locations on the map
Cemeteries: (1) , Bethel Cemetery (2) , Harper Cemetery (3) , Macedonia Cemetery (4) , Carver Heights Cemetery (5) , Hillview Cemetery (6) . Display/hide their locations on the map
Reservoirs: (A) , Moose Lodge Pond (B) , Gordans Pond (C) , Cobbs, Allen and Hall Reservoir (D) , Junior College Lake (E) . Display/hide their locations on the map
Park in Alexander City: (1) . Display/hide its location on the map
Tourist attraction: (1) . Display/hide its approximate location on the map
Hotels: (1) , Jameson Inn Alexander City (Sj) (4335 Highway 280) (2) , Mistletoe Bough Bed & Breakfast (497 Hillabee Street) (3) , Lake Martin Motel (4231 Dadeville Road) (4) , Alex City Motel (2595 Dadeville Road) (5) , Super 8 Motel (4000 Highway 280) (6) , Bob White Motel (930 Airport Drive) (7) , Best Western Horseshoe Inn (3146 Highway 280) (8) , Knights Inn Royal Inn (4000 Highway 280) (9) . Display/hide their approximate locations on the map
Birthplace of: Scottie Vines - 2005 NFL player (Detroit Lions, born : Apr 17, 1979), Terrell Owens - 2005 NFL player (Philadelphia Eagles, born : Dec 7, 1973), Eltoro Freeman - Football player, Lee Williams - PGA Tour Golf player (born : 12/27/81), Lee Williams (golfer) - Professional golfer, Jim Phillips (American football) - Football player, Johnny Watwood - Baseball player, Marquies Gunn - Player of and football, Nathan Poole - Football player, Roberta Alison - Female tennis player.
Tallapoosa County has a predicted average indoor radon screening level less than 2 pCi/L (pico curies per liter) - Low Potential Drinking water stations with addresses in Alexander City and their reported violations in the past:
RAY COMMUNITY WATER & FIRE PRO AUTHORITY (Population served: 1,296, Purch surface water):
Past health violations:
MCL, Average - Between OCT-2009 and DEC-2009, Contaminant: TTHM. Follow-up actions: St Public Notif requested (JAN-15-2010), St Violation/Reminder Notice (JAN-15-2010), St Public Notif received (FEB-16-2010), St Compliance achieved (JUL-07-2011)
Past monitoring violations:
3 routine major monitoring violations
Population served: 1,155, Purch surface water):
Past health violations:
MCL, Average - Between JUL-2009 and SEP-2009, Contaminant: TTHM. Follow-up actions: St Public Notif requested (OCT-16-2009), St Violation/Reminder Notice (OCT-16-2009), St Public Notif received (NOV-24-2009), St Compliance achieved (AUG-10-2010)
Past monitoring violations:
Monitoring and Reporting (DBP) - Between JAN-18-2014 and APR-15-2014, Contaminant: Total Haloacetic Acids (HAA5). Follow-up actions: St Violation/Reminder Notice (OCT-24-2013), St Public Notif requested (OCT-24-2013)
Monitoring and Reporting (DBP) - Between JAN-18-2014 and APR-15-2014, Contaminant: TTHM. Follow-up actions: St Violation/Reminder Notice (OCT-24-2013), St Public Notif requested (OCT-24-2013)
Monitoring and Reporting (DBP) - Between OCT-14-2013 and JAN-17-2014, Contaminant: Total Haloacetic Acids (HAA5). Follow-up actions: St Public Notif requested (OCT-24-2013), St Violation/Reminder Notice (OCT-24-2013), St Compliance achieved (MAY-02-2014)
Monitoring and Reporting (DBP) - Between OCT-14-2013 and JAN-17-2014, Contaminant: TTHM. Follow-up actions: St Public Notif requested (OCT-24-2013), St Violation/Reminder Notice (OCT-24-2013), St Compliance achieved (MAY-02-2014)
Monitoring and Reporting (DBP) - Between JUL-10-2013 and OCT-13-2013, Contaminant: Total Haloacetic Acids (HAA5). Follow-up actions: St Public Notif requested (OCT-24-2013), St Violation/Reminder Notice (OCT-24-2013), St Compliance achieved (FEB-21-2014)
One other older monitoring violation
Average household size: This city:
2.4 peopleAlabama:
2.5 people
Percentage of family households: This city:
66.8%Whole state:
67.8%
Percentage of households with unmarried partners: This city:
4.5%Whole state:
4.7%
Likely homosexual households (counted as self-reported same-sex unmarried-partner households)
Lesbian couples: 0.3% of all households Gay men: 0.2% of all households
272 people in nursing facilities/skilled-nursing facilities in 2010people in residential treatment centers for adults in 2010People in group quarters in Alexander City in 2000:
461 people in nursing homes
17 people in other noninstitutional group quarters
13 people in homes or halfway houses for drug/alcohol abuse
Banks with branches in Alexander City (2011 data):
USAmeriBank: Alexander Aliant Branch at 200 Alliant Parkway, branch established on 1900/05/24; Mill Square Branch at 1154 Lee Street, branch established on 1977/09/29. Info updated 2012/01/04: Bank assets: $2,120.8 mil, Deposits: $1,722.4 mil, headquarters in Largo, FL, positive income , Commercial Lending Specialization, 23 total offices , Holding Company: Usameribancorp, Inc.
Wells Fargo Bank, National Association: Marketplace Branch at 4316 280 By-Pass, branch established on 1989/07/24; Downtown Branch at 15 Jefferson Street, branch established on 1906/03/20. Info updated 2011/04/05: Bank assets: $1,161,490.0 mil, Deposits: $905,653.0 mil, headquarters in Sioux Falls, SD, positive income , 6395 total offices , Holding Company: Wells Fargo & Company
Regions Bank: Alexander City Branch at 3961 Highway 280, branch established on 2008/06/23. Info updated 2011/02/24: Bank assets: $123,368.2 mil, Deposits: $98,301.3 mil, headquarters in Birmingham, AL, positive income , Commercial Lending Specialization, 1778 total offices , Holding Company: Regions Financial Corporation
Branch Banking and Trust Company: Alex City/Cherokee Branch at 2055 Cherokee Road, branch established on 2000/01/04. Info updated 2010/03/29: Bank assets: $168,867.6 mil, Deposits: $127,549.5 mil, headquarters in Winston Salem, NC, positive income , Commercial Lending Specialization, 1793 total offices , Holding Company: Bb&T Corporation
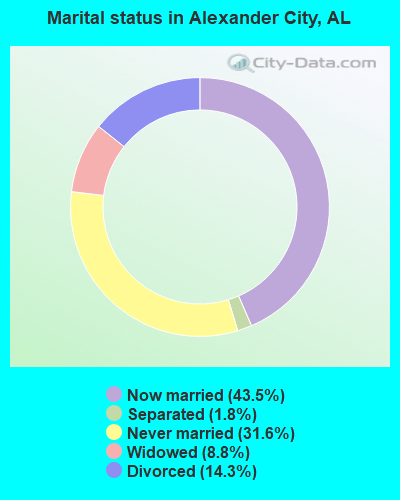
For population 15 years and over in Alexander City:
Never married: 31.6%Now married: 43.5%Separated: 1.8%Widowed: 8.8%Divorced: 14.3% For population 25 years and over in Alexander City:
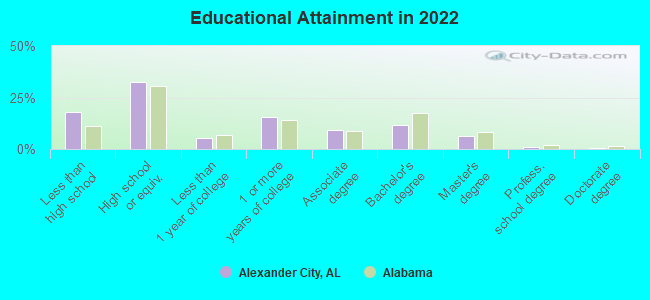
High school or higher: 80.3%Bachelor's degree or higher: 18.4%Graduate or professional degree: 7.2%Unemployed: 6.3%Mean travel time to work (commute): 19.9 minutes
Education Gini index (Inequality in education) Here:
12.8Alabama average:
11.5
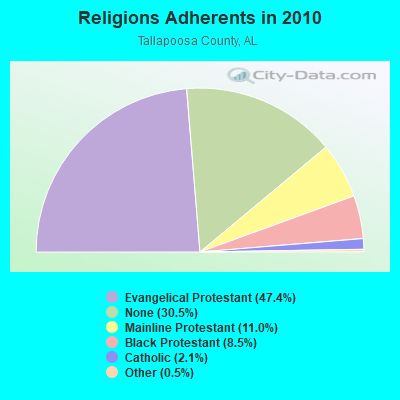
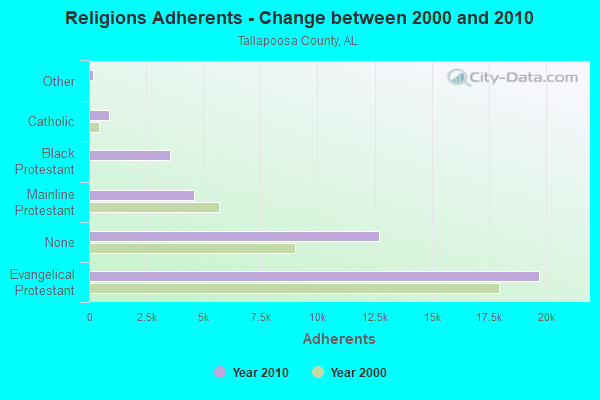
Religion statistics for Alexander City, AL (based on Tallapoosa County data)
Religion Adherents Congregations Evangelical Protestant 19,714 86 Mainline Protestant 4,580 33 Black Protestant 3,526 16 Catholic 894 1 Other 191 6 None 12,711 -
Source: Clifford Grammich, Kirk Hadaway, Richard Houseal, Dale E.Jones, Alexei Krindatch, Richie Stanley and Richard H.Taylor. 2012. 2010 U.S.Religion Census: Religious Congregations & Membership Study. Association of Statisticians of American Religious Bodies. Jones, Dale E., et al. 2002. Congregations and Membership in the United States 2000. Nashville, TN: Glenmary Research Center. Graphs represent county-level data
Food Environment Statistics: Number of grocery stores : 5Tallapoosa County :
1.23 / 10,000 pop.Alabama :
1.89 / 10,000 pop.
Number of supercenters and club stores : 1This county :
0.25 / 10,000 pop.State :
0.20 / 10,000 pop.
Number of convenience stores (no gas) : 2Tallapoosa County :
0.49 / 10,000 pop.Alabama :
0.65 / 10,000 pop.
Number of convenience stores (with gas) : 32Tallapoosa County :
7.85 / 10,000 pop.State :
6.32 / 10,000 pop.
Number of full-service restaurants : 25Here :
6.13 / 10,000 pop.State :
5.75 / 10,000 pop.
Adult diabetes rate : This county :
14.2%Alabama :
11.8%
Adult obesity rate : Tallapoosa County :
33.0%Alabama :
31.7%
Low-income preschool obesity rate : This county :
15.0%State :
13.5%
Health and Nutrition:
Average overall health of teeth and gums : This city:
44.7%State:
45.7%
People feeling badly about themselves : This city:
20.8%State:
20.7%
People not drinking alcohol at all : Alexander City:
12.3%Alabama:
11.0%
Average hours sleeping at night : Alexander City:
6.8State:
6.8
General health condition : Alexander City:
53.6%State:
55.2%
Average condition of hearing : Alexander City:
77.6%Alabama:
79.3%
More about Health and Nutrition of Alexander City, AL Residents
Local government employment and payroll (March 2022)
Function
Full-time employees
Monthly full-time payroll
Average yearly full-time wage
Part-time employees
Monthly part-time payroll
Police Protection - Officers
48 $191,875 $47,969 0 $0 Firefighters
43 $171,350 $47,819 10 $22,365 Other and Unallocable
30 $85,920 $34,368 0 $0 Parks and Recreation
28 $74,793 $32,054 0 $0 Sewerage
27 $90,649 $40,288 0 $0 Water Supply
18 $59,786 $39,857 0 $0 Police - Other
15 $44,854 $35,883 0 $0 Financial Administration
14 $60,053 $51,474 0 $0 Electric Power
13 $52,646 $48,596 0 $0 Streets and Highways
13 $39,454 $36,419 0 $0 Other Government Administration
11 $46,328 $50,540 9 $6,906 Solid Waste Management
9 $23,027 $30,703 0 $0 Gas Supply
8 $24,961 $37,442 0 $0 Local Libraries
7 $19,388 $33,237 1 $1,860 Welfare
2 $5,669 $34,014 2 $3,093 Fire - Other
2 $7,969 $47,814 0 $0 Judicial and Legal
2 $7,583 $45,498 0 $0 Airports
1 $5,015 $60,180 1 $1,462
Totals for Government
291 $1,011,320 $41,704 23 $35,685
Alexander City government finances - Expenditure in 2021 (per resident):
Current Operations - Electric Utilities: $13,389,000 ($914.80)
Solid Waste Management: $6,978,000 ($476.77)Water Utilities: $5,625,000 ($384.33)Sewerage: $4,921,000 ($336.23)Central Staff Services: $4,753,000 ($324.75)Local Fire Protection: $4,600,000 ($314.29)Gas Utilities: $2,154,000 ($147.17)Parks and Recreation: $1,637,000 ($111.85)General Public Buildings: $1,181,000 ($80.69)Financial Administration: $856,000 ($58.49)Police Protection: $539,000 ($36.83)Libraries: $510,000 ($34.85)Air Transportation: $385,000 ($26.31)Judicial and Legal Services: $238,000 ($16.26)
Alexander City government finances - Revenue in 2021 (per resident):
Charges - Sewerage: $2,703,000 ($184.68)
Solid Waste Management: $1,136,000 ($77.62)Other: $471,000 ($32.18)Air Transportation: $359,000 ($24.53)Parks and Recreation: $69,000 ($4.71)Federal Intergovernmental - Other: $48,000 ($3.28)
Miscellaneous - General Revenue - Other: $5,452,000 ($372.51)
Fines and Forfeits: $310,000 ($21.18)Sale of Property: $247,000 ($16.88)Rents: $16,000 ($1.09)Interest Earnings: $8,000 ($0.55)Revenue - Electric Utilities: $13,944,000 ($952.72)
Water Utilities: $6,523,000 ($445.68)Gas Utilities: $2,403,000 ($164.18)State Intergovernmental - Other: $342,000 ($23.37)
Tax - General Sales and Gross Receipts: $11,569,000 ($790.45)
Occupation and Business License - Other: $2,295,000 ($156.81)Property: $1,409,000 ($96.27)Alcoholic Beverage Sales: $357,000 ($24.39)Motor Fuels Sales: $147,000 ($10.04)Tobacco Products Sales: $130,000 ($8.88)
Alexander City government finances - Debt in 2021 (per resident):
Long Term Debt - Issue, Unspecified Public Purpose: $9,000,000 ($614.92)
Outstanding Unspecified Public Purpose: $9,000,000 ($614.92)
Alexander City government finances - Cash and Securities in 2021 (per resident):
Bond Funds - Cash and Securities: $9,000,000 ($614.92)
Businesses in Alexander City, AL
Name Count Name Count
Advance Auto Parts 1 McDonald's 1 Arby's 1 Nike 1 AutoZone 1 Pizza Hut 1 Best Western 1 RadioShack 1 Burger King 1 Rite Aid 1 Comfort Inn 1 Ruby Tuesday 1 Domino's Pizza 1 SONIC Drive-In 1 FedEx 3 Subway 1 Ford 1 T-Mobile 1 H&R Block 1 Taco Bell 1 Hilton 1 U-Haul 3 Home Depot 1 UPS 2 KFC 1 Verizon Wireless 2 La-Z-Boy 1 Walmart 1 Lane Furniture 1
Strongest AM radio stations in Alexander City:
WRFS (1050 AM; 1 kW; ALEXANDER CITY, AL)
WJOX (690 AM; 50 kW; BIRMINGHAM, AL; Owner: CITADEL BROADCASTING COMPANY)
WNSI (810 AM; 50 kW; JACKSONVILLE, AL; Owner: UNITED BROADCASTING NETWORK, INC.)
WDJC (850 AM; 50 kW; BIRMINGHAM, AL; Owner: KIMTRON, INC.)
WKNG (1060 AM; daytime; 50 kW; TALLAPOOSA, GA; Owner: WKNG, INC.)
WZZX (780 AM; daytime; 5 kW; LINEVILLE, AL; Owner: ROBERT A. PERRY)
WAPI (1070 AM; 50 kW; BIRMINGHAM, AL; Owner: CITADEL BROADCASTING COMPANY)
WMSP (740 AM; 10 kW; MONTGOMERY, AL; Owner: CUMULUS LICENSING CORP.)
WGST (640 AM; 50 kW; ATLANTA, GA; Owner: CITICASTERS LICENSES, L.P.)
WACV (1170 AM; 10 kW; MONTGOMERY, AL; Owner: MONTGOMERY BROADCAST PROPERTIES, LTD)
WDLK (1450 AM; 1 kW; DADEVILLE, AL; Owner: PROGRESSIVE UNITED COMMUNICATIONS, INC.)
WCNN (680 AM; 50 kW; NORTH ATLANTA, GA; Owner: DICKEY BROADCASTING COMPANY)
WSB (750 AM; 50 kW; ATLANTA, GA; Owner: CXR HOLDINGS, INC.)
Strongest FM radio stations in Alexander City:
WZLM (97.3 FM; DADEVILLE, AL; Owner: GREAT SOUTH RFDC, LLC)
WLWI-FM (92.3 FM; MONTGOMERY, AL; Owner: CUMULUS LICENSING CORP.)
WTBJ (91.3 FM; OXFORD, AL; Owner: TRINITY CHRISTIAN ACADEMY)
WELL-FM (88.7 FM; DADEVILLE, AL; Owner: TIGER COMMUNICATIONS EDUCATIONAL FOUNDATION, INC.)
WSTH-FM (106.1 FM; ALEXANDER CITY, AL; Owner: CLEAR CHANNEL BROADCASTING LICENSES, INC.)
WMXS (103.3 FM; MONTGOMERY, AL; Owner: CUMULUS LICENSING CORP.)
WBAM-FM (98.9 FM; MONTGOMERY, AL; Owner: DEEP SOUTH BROADCASTING COMPANY)
WHHY-FM (101.9 FM; MONTGOMERY, AL; Owner: CUMULUS LICENSING CORP.)
WQNR (99.9 FM; TALLASSEE, AL; Owner: TIGER COMMUNICATIONS, INC.)
WASZ (95.5 FM; ASHLAND, AL; Owner: WILLIAMS COMMUNICATIONS, INC.)
WTRB-FM (98.3 FM; SYLACAUGA, AL; Owner: WILLIAMS COMMUNICATIONS, INC.)
WTDR (92.7 FM; TALLADEGA, AL; Owner: JACOBS BROADCAST GROUP, INC.)
TV broadcast stations around Alexander City:
WAXC-LP (Channel 64; ALEXANDER CITY, AL; Owner: CABLE VIDEO PRODUCTIONS, INC.)
WNCF (Channel 32; MONTGOMERY, AL; Owner: CHANNEL 32 MONTGOMERY LLC)
WSWS-TV (Channel 66; OPELIKA, AL; Owner: PAPPAS TELECASTING OF OPELIKA)
WMCF-TV (Channel 45; MONTGOMERY, AL; Owner: TRINITY BROADCASTING NETWORK)
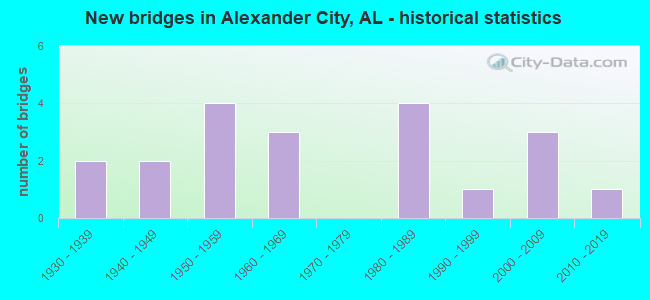
National Bridge Inventory (NBI) Statistics 20 Number of bridges308ft / 94.4m Total length $39,301,000 Total costs80,355 Total average daily traffic5,084 Total average daily truck traffic
New bridges - historical statistics
2 1930-1939 2 1940-1949 4 1950-1959 3 1960-1969 4 1980-1989 1 1990-1999 3 2000-2009 1 2010-2019
See full National Bridge Inventory statistics for Alexander City, AL
Fire-safe hotels and motels in Alexander City, Alabama:
Royal Inn, 4000 Hwy 280, Alexander City, Alabama 35010 Phone: (256) 329-8858, Fax: (256) 329-8858
Baymont Inn & Suites, 4335 Hwy 280, Alexander City, Alabama 35010 Phone: (256) 234-7099
Bob White Motel, 930 Airport Dr, Alexander City, Alabama 35010 Phone: (256) 234-4215
Comfort Inn, 2945 Hwy 280, Alexander City, Alabama 35010 Phone: (256) 234-5900, Fax: (256) 234-5918
Hampton Inn Alexander City, 1551 Elkahatchee Rd, Alexander City, Alabama 35010 Phone: (256) 234-2244, Fax: (256) 234-2242
Days Inn, 3146 Hwy 280, Alexander City, Alabama 35010 Phone: (256) 234-6311, Fax: (256) 234-6314
All 6 fire-safe hotels and motels in Alexander City, Alabama
Most common first names in Alexander City, AL among deceased individuals Name Count Lived (average)
James 269 70.5 years Mary 247 78.3 years William 202 74.1 years John 199 73.3 years Willie 132 72.6 years Robert 114 70.4 years Annie 113 76.8 years Thomas 85 71.5 years Charles 79 68.6 years George 78 73.9 years
Most common last names in Alexander City, AL among deceased individuals Last name Count Lived (average)
Smith 173 75.8 years Jones 121 74.4 years Thomas 94 77.4 years Brown 75 73.7 years Fuller 70 74.5 years Davis 63 72.3 years Robinson 60 74.3 years Baker 59 75.6 years Jackson 56 72.9 years Russell 56 70.8 years
Alexander City compared to Alabama state average:
Unemployed percentage below state average. Length of stay since moving in above state average. Number of college students below state average. Alexander City on our top lists :
#29 on the list of "Top 101 cities with the most full-time firefighters per 1000 residents (population 5,000+)"
#31 on the list of "Top 101 cities with largest percentage of females in industries: manufacturing (population 5,000+)"
#41 on the list of "Top 101 cities with largest percentage of females in occupations: production occupations (population 5,000+)"
#44 on the list of "Top 101 cities with largest percentage of males in industries: manufacturing (population 5,000+)"
#72 on the list of "Top 101 cities with largest percentage of males in occupations: production occupations (population 5,000+)"
#76 on the list of "Top 101 cities with largest percentage of females in occupations: architecture and engineering occupations (population 5,000+)"
#86 on the list of "Top 101 cities with the most full-time local library workers per 1000 residents (population 5,000+)"
#67 on the list of "Top 101 counties with the lowest ground withdrawal of fresh water for public supply"
Top Patent Applicants
James Mark Chappell (2)
Jerry Dwayne Britton (1)
Michael W. Johnston (1)
Eric Branch (1)
Melvin Merri Palmer, Jr. (1)
Charles Harbison (1)
Charles Joseph Zimmerman (1)
Michael Adams (1)
Melvin Palmer, Jr. (1)
Leanne Price (1)
Total of 10 patent applications in 2008-2024.


 Recent articles from our blog. Our writers, many of them Ph.D. graduates or candidates, create easy-to-read articles on a wide variety of topics.

 (44.3 miles
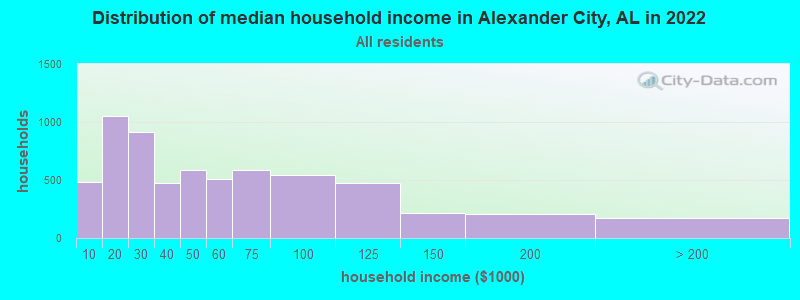


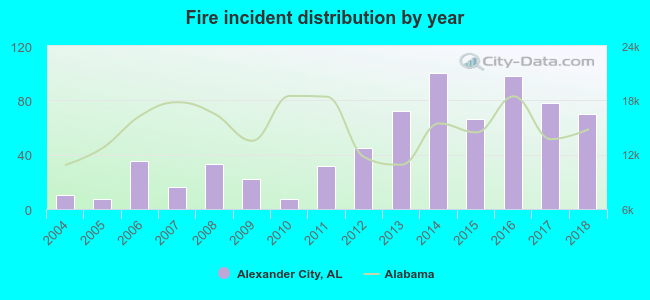 According to the data from the years 2004 - 2018 the average number of fires per year is 46. The highest number of reported fires - 100 took place in 2014, and the least - 7 in 2005. The data has a rising trend.
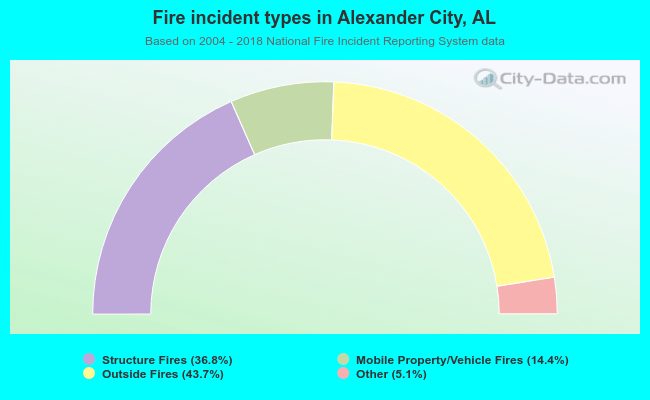 When looking into fire subcategories, the most incidents belonged to: Outside Fires (43.7%), and Structure Fires (36.8%).