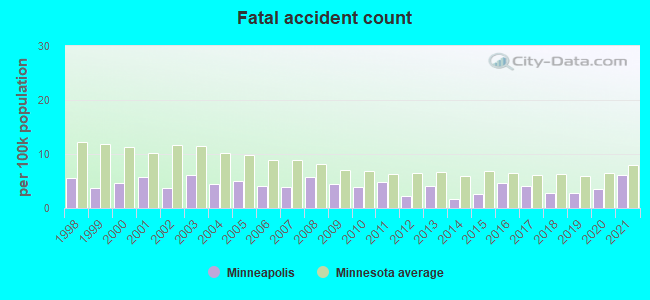
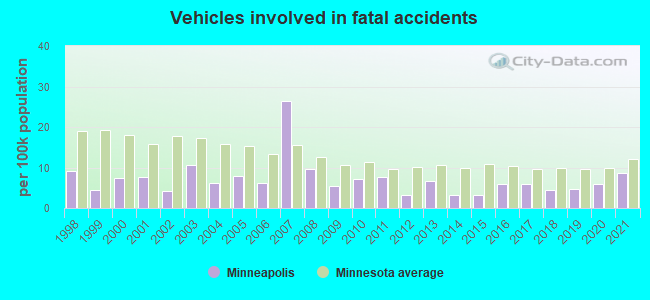
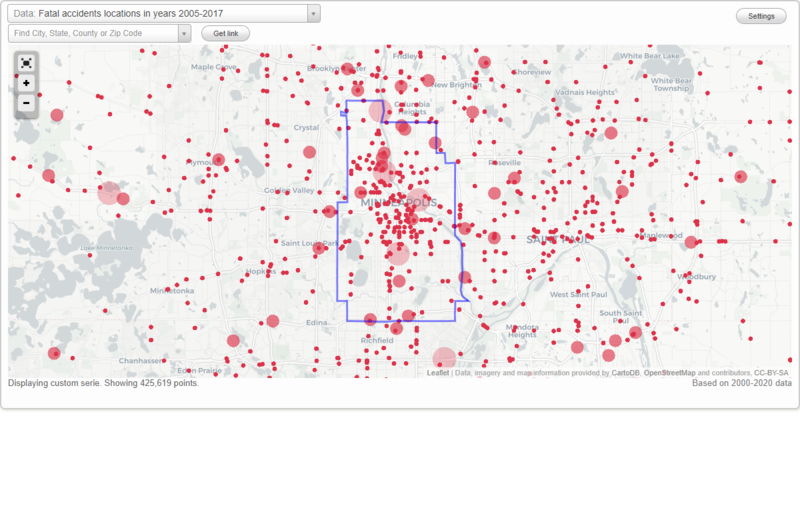
Fatal car crashes and road traffic accidents in Minneapolis, Minnesota
- Fatal car crash and road traffic accident statistics for 2021
- Fatal accident count26
- Vehicles involved in fatal accidents37
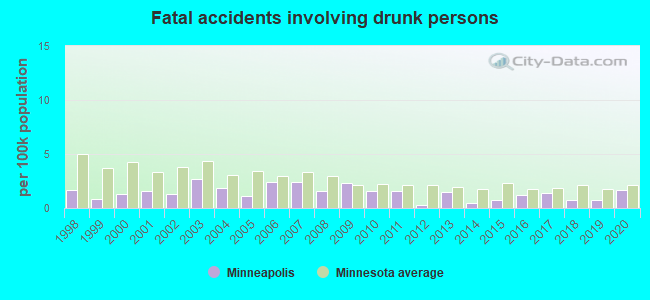
- Fatal accidents involving drunk persons0
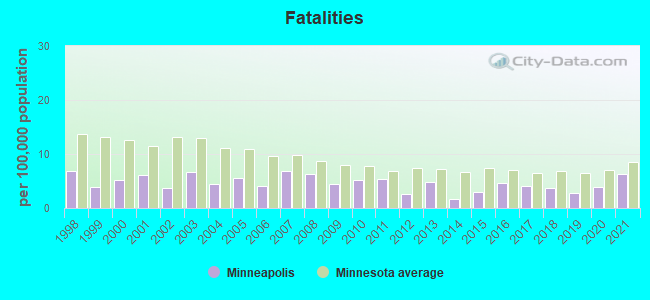
- Fatalities27
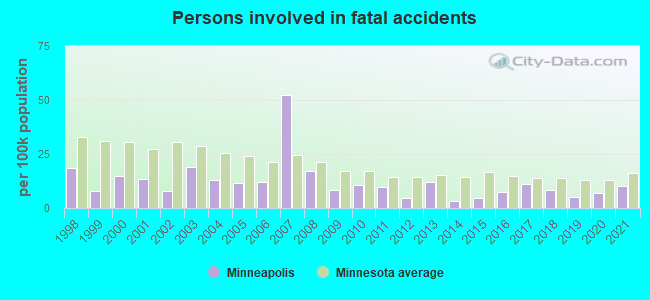
- Persons involved in fatal accidents44
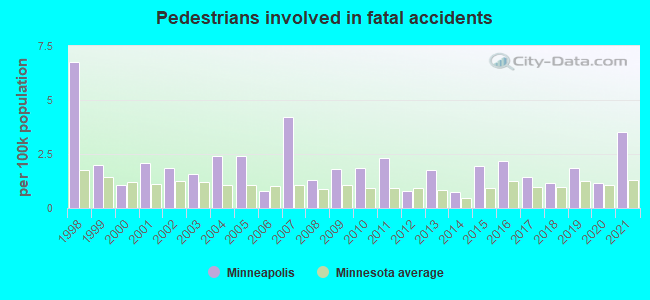
- Pedestrians involved in fatal accidents15
- Fatal car crash and road traffic accident statistics for 2020
- Fatal accident count15
- Vehicles involved in fatal accidents25
- Fatal accidents involving drunk persons7
- Fatalities17
- Persons involved in fatal accidents30
- Pedestrians involved in fatal accidents5
- Fatal car crash and road traffic accident statistics for 2019
- Fatal accident count12
- Vehicles involved in fatal accidents20
- Fatal accidents involving drunk persons3
- Fatalities12
- Persons involved in fatal accidents22
- Pedestrians involved in fatal accidents8
- Fatal car crash and road traffic accident statistics for 2018
- Fatal accident count12
- Vehicles involved in fatal accidents19
- Fatal accidents involving drunk persons3
- Fatalities16
- Persons involved in fatal accidents36
- Pedestrians involved in fatal accidents5
Data:
Latest news about accidents in Minneapolis, MN collected exclusively by city-data.com from local newspapers, TV, and radio stations
No street view available for this location
Minneapolis fatal accident statistics for 1998 - 2021
Average EMS response time
- Minneapolis(Based on 611 reports) 6.2 mins
- Hennepin County(Based on 1,626 reports) 7.3 mins
- Minnesota(Based on 15,552 reports) 10.3 mins
Average hospital transport time
- Minneapolis(Based on 278 reports) 19.8 mins
- Hennepin County(Based on 704 reports) 29.1 mins
- Minnesota(Based on 6,781 reports) 36.5 mins
Dark - Lighted
- Minneapolis(Based on 1,052 reports) 47.0%
- Hennepin County(Based on 2,676 reports) 35.0%
- Minnesota(Based on 23,408 reports) 13.2%
Daylight
- Minneapolis(Based on 1,052 reports) 43.5%
- Hennepin County(Based on 2,676 reports) 48.5%
- Minnesota(Based on 23,408 reports) 50.7%
Dark - Not Lighted
- Minneapolis(Based on 1,052 reports) 4.8%
- Hennepin County(Based on 2,676 reports) 11.5%
- Minnesota(Based on 23,408 reports) 30.6%
Dusk
- Minneapolis(Based on 1,052 reports) 2.3%
- Hennepin County(Based on 2,676 reports) 2.4%
- Minnesota(Based on 23,408 reports) 2.6%
Dawn
- Minneapolis(Based on 1,052 reports) 1.4%
- Hennepin County(Based on 2,676 reports) 1.5%
- Minnesota(Based on 23,408 reports) 1.9%
Dark - Unknown Lighting
- Minneapolis(Based on 1,052 reports) 1.0%
- Hennepin County(Based on 2,676 reports) 1.1%
- Minnesota(Based on 23,408 reports) 1.1%
Clear
- Minneapolis(Based on 1,051 reports) 86.6%
- Hennepin County(Based on 2,686 reports) 84.6%
- Minnesota(Based on 23,561 reports) 81.7%
Rain
- Minneapolis(Based on 1,051 reports) 7.1%
- Hennepin County(Based on 2,686 reports) 6.3%
- Minnesota(Based on 23,561 reports) 5.2%
Unknown
- Minneapolis(Based on 1,051 reports) 4.3%
- Hennepin County(Based on 2,686 reports) 4.8%
- Minnesota(Based on 23,561 reports) 4.3%
Snow
- Minneapolis(Based on 1,051 reports) 1.6%
- Hennepin County(Based on 2,686 reports) 2.9%
- Minnesota(Based on 23,561 reports) 4.9%
Sleet or Hail
- Minneapolis(Based on 1,051 reports) 0.8%
- Hennepin County(Based on 2,686 reports) 0.9%
- Minnesota(Based on 23,561 reports) 1.2%
Cloudy
- Minneapolis(Based on 1,051 reports) 0.4%
- Hennepin County(Based on 2,686 reports) 0.6%
- Minnesota(Based on 23,561 reports) 1.2%
Blowing Snow
- Minneapolis(Based on 1,051 reports) 0.1%
- Hennepin County(Based on 2,686 reports) 0.1%
- Minnesota(Based on 23,561 reports) 0.3%
Fog, Smog, Smoke
- Minneapolis(Based on 1,051 reports) 0.1%
- Hennepin County(Based on 2,686 reports) 0.3%
- Minnesota(Based on 23,561 reports) 1.5%

Minneapolis fatal car crash and road traffic accident list for 2021
- Fatal accident count26
- Vehicles involved in fatal accidents37
- Fatalities27
- Persons involved in fatal accidents44
- Pedestrians involved in fatal accidents15
Average EMS response time
- Minneapolis(Based on 24 reports) 6.0 mins
- Hennepin County(Based on 57 reports) 8.7 mins
- Minnesota(Based on 402 reports) 10.2 mins
Average hospital transport time
- Minneapolis(Based on 14 reports) 14.9 mins
- Hennepin County(Based on 33 reports) 21.5 mins
- Minnesota(Based on 202 reports) 34.3 mins
Dark - Lighted
- Minneapolis(Based on 26 reports) 61.5%
- Hennepin County(Based on 68 reports) 45.6%
- Minnesota(Based on 447 reports) 17.4%
Daylight
- Minneapolis(Based on 26 reports) 38.5%
- Hennepin County(Based on 68 reports) 44.1%
- Minnesota(Based on 447 reports) 53.9%
Clear
- Minneapolis(Based on 26 reports) 76.9%
- Hennepin County(Based on 68 reports) 75.0%
- Minnesota(Based on 443 reports) 73.1%
Rain
- Minneapolis(Based on 26 reports) 11.5%
- Hennepin County(Based on 68 reports) 7.4%
- Minnesota(Based on 443 reports) 5.6%
Unknown
- Minneapolis(Based on 26 reports) 11.5%
- Hennepin County(Based on 68 reports) 13.2%
- Minnesota(Based on 443 reports) 14.0%
| # | Date | Location | Vehicles | Drunk persons | Fatalites | Persons | Pedestrians |
|---|
| 1 | Jan 12, 2021 02:06 PM | Cr-153 Lowry Ave N, Ne Arthur St | 1 | - | 1
| 1 | 1 |
| 2 | Feb 26, 2021 01:27 AM | Cr-152 Cedar Ave S | 1 | - | 1
| 1 | - |
| 3 | Mar 4, 2021 05:42 PM | 30th Ave N | 1 | - | 1
| 1 | 1 |
| 4 | Mar 11, 2021 10:22 AM | 37th Ave N | 1 | - | 1
| 3 | - |
| 5 | Apr 6, 2021 07:53 PM | I-35w | 1 | - | 1
| 1 | - |
| 6 | Apr 18, 2021 09:39 PM | I-94 | 1 | - | 2
| 3 | - |
| 7 | May 15, 2021 02:38 AM | I-94 | 1 | - | 1
| 1 | - |
| 8 | May 19, 2021 08:31 PM | I-35w | 2 | - | 1
| 3 | - |
| 9 | May 24, 2021 05:42 PM | Marquette Ave S, 10th St S | 2 | - | 1
| 2 | 2 |
| 10 | May 28, 2021 10:23 PM | Cr-81 Broadway Ave N, Sheridan Ave N | 1 | - | 1
| 2 | 1 |
| 11 | May 29, 2021 02:49 AM | Cr-153 Lowry Ave E, Ne Grand St | 1 | - | 1
| 2 | - |
| 12 | Jun 13, 2021 11:43 PM | Cr-3 W Lake St, Grand Ave S | 2 | - | 1
| 1 | 4 |
| 13 | Jun 15, 2021 08:35 PM | Fremont Ave N, 51st Ave N | 4 | - | 1
| 1 | 1 |
| 14 | Jul 6, 2021 00:31 AM | Cr-152 Lyndale Ave N, Washington Ave N | 3 | - | 1
| 3 | - |
| 15 | Jun 24, 2021 03:00 PM | I-394 | 2 | - | 1
| 3 | - |
| 16 | Jul 29, 2021 01:22 AM | Lyndale Ave N | 2 | - | 1
| 3 | 1 |
| 17 | Aug 4, 2021 07:08 AM | I-94 | 1 | - | 1
| 2 | - |
| 18 | Aug 21, 2021 01:22 AM | Cr-3 E Lake St, Bloomington Ave S | 1 | - | 1
| 1 | 1 |
| 19 | Sep 20, 2021 09:55 PM | Sr-55, E 50th St | 1 | - | 1
| 1 | 1 |
| 20 | Oct 16, 2021 07:41 PM | I-35w | 1 | - | 1
| 1 | - |
| 21 | Oct 11, 2021 02:25 PM | Cr-81 W Broadway Ave, N Aldrich Ave | 1 | - | 1
| 1 | 1 |
| 22 | Oct 6, 2021 12:32 AM | I-94 | 1 | - | 1
| 2 | - |
| 23 | Nov 27, 2021 09:25 PM | W 36th St, Colfax Ave S | 1 | - | 1
| 1 | - |
| 24 | Nov 29, 2021 08:55 PM | Cr-3 E Lake St, Cr-152 Cedar Ave S | 2 | - | 1
| 2 | - |
| 25 | Dec 9, 2021 00:10 AM | Lyndale Ave N | 1 | - | 1
| 1 | - |
| 26 | Sep 4, 2021 01:28 PM | 15th Ave S | 1 | - | 1
| 1 | 1 |
Minneapolis fatal car crash and road traffic accident list for 2020
- Fatal accident count15
- Vehicles involved in fatal accidents25
- Fatal accidents involving drunk persons7
- Fatalities17
- Persons involved in fatal accidents30
- Pedestrians involved in fatal accidents5
Average EMS response time
- Minneapolis(Based on 14 reports) 5.8 mins
- Hennepin County(Based on 32 reports) 6.9 mins
- Minnesota(Based on 323 reports) 10.0 mins
Average hospital transport time
- Minneapolis(Based on 8 reports) 12.0 mins
- Hennepin County(Based on 18 reports) 25.0 mins
- Minnesota(Based on 175 reports) 36.3 mins
Dark - Lighted
- Minneapolis(Based on 15 reports) 46.7%
- Hennepin County(Based on 40 reports) 37.5%
- Minnesota(Based on 364 reports) 13.5%
Daylight
- Minneapolis(Based on 15 reports) 33.3%
- Hennepin County(Based on 40 reports) 50.0%
- Minnesota(Based on 364 reports) 52.5%
Dark - Not Lighted
- Minneapolis(Based on 15 reports) 6.7%
- Hennepin County(Based on 40 reports) 7.5%
- Minnesota(Based on 364 reports) 27.7%
Dawn
- Minneapolis(Based on 15 reports) 6.7%
- Hennepin County(Based on 40 reports) 2.5%
- Minnesota(Based on 364 reports) 1.4%
Dusk
- Minneapolis(Based on 15 reports) 6.7%
- Hennepin County(Based on 40 reports) 2.5%
- Minnesota(Based on 364 reports) 3.8%
Clear
- Minneapolis(Based on 15 reports) 66.7%
- Hennepin County(Based on 40 reports) 65.0%
- Minnesota(Based on 361 reports) 74.2%
Rain
- Minneapolis(Based on 15 reports) 20.0%
- Hennepin County(Based on 40 reports) 10.0%
- Minnesota(Based on 361 reports) 5.5%
Unknown
- Minneapolis(Based on 15 reports) 13.3%
- Hennepin County(Based on 40 reports) 22.5%
- Minnesota(Based on 361 reports) 13.0%
| # | Date | Location | Vehicles | Drunk persons | Fatalites | Persons | Pedestrians |
|---|
| 1 | Jan 10, 2020 06:25 AM | Cr-3 Lake St, Pleasant Ave | 1 | - | 1
| 1 | 1 |
| 2 | Feb 5, 2020 03:10 AM | Sr-55 Hiawatha Ave, E 26th St | 1 | - | 1
| 1 | 1 |
| 3 | Mar 18, 2020 01:07 AM | I-94 | 2 | - | 1
| 2 | - |
| 4 | Mar 28, 2020 09:15 PM | Sr-55 Olson Memorial Hwy | 1 | 1
| 1 | 1 | - |
| 5 | Apr 19, 2020 02:22 PM | E 52nd St, 42nd Ave S | 3 | - | 1
| 3 | - |
| 6 | Jun 8, 2020 05:19 AM | Cr-153 Lowry Ave N, Cr-23 Marshall St Ne | 3 | 1
| 1 | 5 | - |
| 7 | Jun 23, 2020 04:14 PM | Emerson Ave N | 1 | 1
| 1 | 1 | 1 |
| 8 | Jun 29, 2020 11:32 PM | I-94 | 1 | 1
| 1 | 1 | - |
| 9 | Jul 9, 2020 02:21 PM | Cr-57 51st Ave N | 1 | - | 1
| 1 | - |
| 10 | Jul 13, 2020 08:05 PM | Emerson Ave N | 5 | 1
| 1 | 4 | - |
| 11 | Aug 31, 2020 04:34 PM | Sr-55 Olson Memorial Hwy, Bryant Ave N | 1 | - | 1
| 1 | 1 |
| 12 | Sep 12, 2020 03:42 AM | Cr-152 Cedar Ave S, E 26th St | 2 | 1
| 1 | 4 | - |
| 13 | Oct 5, 2020 01:46 AM | Emerson Ave N | 1 | 1
| 3 | 3 | - |
| 14 | Nov 4, 2020 09:05 AM | Cr-5 E Franklyn Ave, Chicago Ave S | 1 | - | 1
| 1 | 1 |
| 15 | Dec 11, 2020 04:57 AM | Cr-152 Cedar St | 1 | - | 1
| 1 | - |
Minneapolis fatal car crash and road traffic accident list for 2019
- Fatal accident count12
- Vehicles involved in fatal accidents20
- Fatal accidents involving drunk persons3
- Fatalities12
- Persons involved in fatal accidents22
- Pedestrians involved in fatal accidents8
Average EMS response time
- Minneapolis(Based on 11 reports) 7.5 mins
- Hennepin County(Based on 34 reports) 7.0 mins
- Minnesota(Based on 308 reports) 8.9 mins
Average hospital transport time
- Minneapolis(Based on 6 reports) 32.7 mins
- Hennepin County(Based on 16 reports) 30.5 mins
- Minnesota(Based on 171 reports) 34.5 mins
Dark - Lighted
- Minneapolis(Based on 12 reports) 50.0%
- Hennepin County(Based on 38 reports) 42.1%
- Minnesota(Based on 331 reports) 14.8%
Daylight
- Minneapolis(Based on 12 reports) 33.3%
- Hennepin County(Based on 38 reports) 44.7%
- Minnesota(Based on 331 reports) 61.3%
Dark - Not Lighted
- Minneapolis(Based on 12 reports) 16.7%
- Hennepin County(Based on 38 reports) 10.5%
- Minnesota(Based on 331 reports) 20.5%
Unknown
- Minneapolis(Based on 11 reports) 72.7%
- Hennepin County(Based on 37 reports) 40.5%
- Minnesota(Based on 326 reports) 20.6%
Snow
- Minneapolis(Based on 11 reports) 18.2%
- Hennepin County(Based on 37 reports) 5.4%
- Minnesota(Based on 326 reports) 3.4%
Clear
- Minneapolis(Based on 11 reports) 18.2%
- Hennepin County(Based on 37 reports) 54.1%
- Minnesota(Based on 326 reports) 70.6%
Rain
- Minneapolis(Based on 11 reports) 18.2%
- Hennepin County(Based on 37 reports) 10.8%
- Minnesota(Based on 326 reports) 4.3%
| # | Date | Location | Vehicles | Drunk persons | Fatalites | Persons | Pedestrians |
|---|
| 1 | Mar 31, 2019 09:08 PM | I-94 | 2 | 1
| 1 | 5 | - |
| 2 | Apr 24, 2019 09:02 PM | Cr-152 Washington Ave N, Dowling Ave N | 2 | - | 1
| 3 | - |
| 3 | Jul 23, 2019 11:43 PM | Dowling Ave N, Humboldt Ave N | 1 | - | 1
| 1 | 1 |
| 4 | Jul 14, 2019 07:36 PM | I-35 | 1 | 1
| 1 | 1 | - |
| 5 | Jun 24, 2019 01:03 PM | Olson Memorial Pkwy, N 7th St | 2 | - | 1
| 2 | - |
| 6 | Aug 29, 2019 04:35 PM | 41st Ave N, Alleyway | 1 | - | 1
| 1 | 1 |
| 7 | Sep 25, 2019 01:00 AM | Ne Columbia Ave | 1 | - | 1
| 1 | 1 |
| 8 | Oct 13, 2019 01:16 AM | Cr-22 Lyndale Ave S | 1 | - | 1
| 1 | 1 |
| 9 | Oct 17, 2019 10:48 PM | Newton Ave N | 6 | 1
| 1 | 4 | - |
| 10 | Nov 9, 2019 05:50 PM | 2nd St N, 5th Ave N | 1 | - | 1
| 1 | 2 |
| 11 | Nov 20, 2019 04:15 PM | 12th St N, W Linden St | 1 | - | 1
| 1 | 1 |
| 12 | Nov 21, 2019 06:46 AM | Sr-55 | 1 | - | 1
| 1 | 1 |
Minneapolis fatal car crash and road traffic accident list for 2018
- Fatal accident count12
- Vehicles involved in fatal accidents19
- Fatal accidents involving drunk persons3
- Fatalities16
- Persons involved in fatal accidents36
- Pedestrians involved in fatal accidents5
Average EMS response time
- Minneapolis(Based on 11 reports) 6.6 mins
- Hennepin County(Based on 44 reports) 8.0 mins
- Minnesota(Based on 308 reports) 10.1 mins
Average hospital transport time
- Minneapolis(Based on 10 reports) 15.0 mins
- Hennepin County(Based on 32 reports) 25.7 mins
- Minnesota(Based on 180 reports) 36.4 mins
Dark - Lighted
- Minneapolis(Based on 12 reports) 66.7%
- Hennepin County(Based on 52 reports) 34.6%
- Minnesota(Based on 345 reports) 18.3%
Daylight
- Minneapolis(Based on 12 reports) 33.3%
- Hennepin County(Based on 52 reports) 48.1%
- Minnesota(Based on 345 reports) 55.4%
Clear
- Minneapolis(Based on 12 reports) 66.7%
- Hennepin County(Based on 52 reports) 61.5%
- Minnesota(Based on 343 reports) 66.2%
Unknown
- Minneapolis(Based on 12 reports) 25.0%
- Hennepin County(Based on 52 reports) 30.8%
- Minnesota(Based on 343 reports) 20.7%
Snow
- Minneapolis(Based on 12 reports) 8.3%
- Hennepin County(Based on 52 reports) 5.8%
- Minnesota(Based on 343 reports) 6.4%
| # | Date | Location | Vehicles | Drunk persons | Fatalites | Persons | Pedestrians |
|---|
| 1 | Feb 1, 2018 08:24 PM | Penn Ave S | 1 | 1
| 1 | 1 | 1 |
| 2 | Mar 16, 2018 09:26 PM | Plymouth Ave N, Lyndale Ave N | 2 | 1
| 1 | 3 | - |
| 3 | Feb 28, 2018 07:07 PM | Cr-43 Lagoon Ave S, James Ave S | 1 | - | 1
| 1 | 1 |
| 4 | Apr 15, 2018 05:44 PM | I-94 | 2 | - | 1
| 4 | - |
| 5 | May 31, 2018 10:19 PM | 2nd St N | 1 | - | 1
| 1 | - |
| 6 | Jun 15, 2018 07:52 PM | Alley | 3 | 1
| 2 | 4 | - |
| 7 | Jul 7, 2018 05:46 PM | Cr-48 26th Ave S, 22nd St E | 1 | - | 1
| 3 | 1 |
| 8 | Jul 16, 2018 11:30 PM | Hennepin Ave S, W Franklin Ave | 2 | - | 1
| 4 | 1 |
| 9 | Sep 16, 2018 02:16 PM | I-94 Ramp | 1 | - | 1
| 3 | - |
| 10 | Sep 23, 2018 01:16 AM | Cr-152 Cedar Ave S, 35th St E | 3 | - | 3
| 8 | - |
| 11 | Oct 24, 2018 06:56 AM | 26th St E, 14th Ave S | 1 | - | 1
| 1 | 1 |
| 12 | Dec 2, 2018 09:27 PM | I-94 Ramp 2200006594720234-I | 1 | - | 2
| 3 | - |
Minneapolis fatal car crash and road traffic accident list for 2017
- Fatal accident count17
- Vehicles involved in fatal accidents25
- Fatal accidents involving drunk persons6
- Fatalities17
- Persons involved in fatal accidents47
- Pedestrians involved in fatal accidents6
Average EMS response time
- Minneapolis(Based on 17 reports) 4.9 mins
- Hennepin County(Based on 41 reports) 6.3 mins
- Minnesota(Based on 295 reports) 10.0 mins
Average hospital transport time
- Minneapolis(Based on 14 reports) 18.0 mins
- Hennepin County(Based on 32 reports) 25.5 mins
- Minnesota(Based on 197 reports) 33.4 mins
Dark - Lighted
- Minneapolis(Based on 17 reports) 64.7%
- Hennepin County(Based on 43 reports) 39.5%
- Minnesota(Based on 337 reports) 16.0%
Daylight
- Minneapolis(Based on 17 reports) 35.3%
- Hennepin County(Based on 43 reports) 55.8%
- Minnesota(Based on 337 reports) 61.7%
Clear
- Minneapolis(Based on 17 reports) 70.6%
- Hennepin County(Based on 43 reports) 69.8%
- Minnesota(Based on 336 reports) 66.4%
Unknown
- Minneapolis(Based on 17 reports) 23.5%
- Hennepin County(Based on 43 reports) 18.6%
- Minnesota(Based on 336 reports) 22.3%
Rain
- Minneapolis(Based on 17 reports) 11.8%
- Hennepin County(Based on 43 reports) 14.0%
- Minnesota(Based on 336 reports) 7.4%
| # | Date | Location | Vehicles | Drunk persons | Fatalites | Persons | Pedestrians |
|---|
| 1 | Feb 5, 2017 01:42 AM | I-35w | 2 | 1
| 1 | 8 | - |
| 2 | Feb 20, 2017 07:48 PM | I-35 | 1 | - | 1
| 5 | - |
| 3 | Feb 24, 2017 06:05 PM | Newton Ave N, 29th Ave N | 3 | 1
| 1 | 2 | - |
| 4 | Apr 30, 2017 09:28 AM | W 26th St, Blaisdell Ave S | 4 | - | 1
| 9 | - |
| 5 | May 11, 2017 10:22 PM | Sr-65 Central Ave Ne, Cr-153 Lowry Ave Ne | 2 | 1
| 1 | 3 | - |
| 6 | Jun 1, 2017 05:56 PM | Cr-33 Park Ave, E 15th St | 2 | 1
| 1 | 3 | - |
| 7 | Jun 2, 2017 08:32 PM | 17th Ave S | 1 | - | 1
| 2 | 1 |
| 8 | Jul 26, 2017 09:58 PM | Cr-152 41st Ave N | 1 | - | 1
| 2 | - |
| 9 | Aug 17, 2017 05:42 AM | Cr-153 Lowry Ave Ne, 2nd St N | 1 | - | 1
| 1 | 1 |
| 10 | Sep 11, 2017 06:11 PM | Sr-55, Morgan Ave North | 1 | - | 1
| 1 | 1 |
| 11 | Sep 17, 2017 03:47 AM | Cr-27 Stinson Blvd | 1 | - | 1
| 2 | - |
| 12 | Oct 17, 2017 11:25 PM | I-94 Ramp 923, Sr-55 | 1 | - | 1
| 1 | - |
| 13 | Oct 18, 2017 02:13 PM | Cr-36 University Ave Se, Huron St Se | 1 | - | 1
| 1 | 1 |
| 14 | Nov 6, 2017 02:26 AM | I-35w | 1 | 1
| 1 | 2 | - |
| 15 | Dec 26, 2017 02:37 AM | 4th St S | 1 | 1
| 1 | 3 | - |
| 16 | Sep 7, 2017 01:11 PM | Hennepin Ave, 10th St N | 1 | - | 1
| 1 | 1 |
| 17 | Dec 19, 2017 08:42 PM | 1st St N | 1 | - | 1
| 1 | 1 |
Minneapolis fatal car crash and road traffic accident list for 2016
- Fatal accident count19
- Vehicles involved in fatal accidents25
- Fatal accidents involving drunk persons5
- Fatalities19
- Persons involved in fatal accidents30
- Pedestrians involved in fatal accidents9
Average EMS response time
- Minneapolis(Based on 17 reports) 5.1 mins
- Hennepin County(Based on 36 reports) 7.0 mins
- Minnesota(Based on 317 reports) 9.6 mins
Average hospital transport time
- Minneapolis(Based on 13 reports) 16.2 mins
- Hennepin County(Based on 24 reports) 22.0 mins
- Minnesota(Based on 198 reports) 34.2 mins
Dark - Lighted
- Minneapolis(Based on 19 reports) 52.6%
- Hennepin County(Based on 43 reports) 41.9%
- Minnesota(Based on 355 reports) 16.3%
Daylight
- Minneapolis(Based on 19 reports) 47.4%
- Hennepin County(Based on 43 reports) 51.2%
- Minnesota(Based on 355 reports) 53.8%
Clear
- Minneapolis(Based on 19 reports) 52.6%
- Hennepin County(Based on 43 reports) 51.2%
- Minnesota(Based on 352 reports) 59.4%
Unknown
- Minneapolis(Based on 19 reports) 26.3%
- Hennepin County(Based on 43 reports) 32.6%
- Minnesota(Based on 352 reports) 28.4%
Rain
- Minneapolis(Based on 19 reports) 15.8%
- Hennepin County(Based on 43 reports) 9.3%
- Minnesota(Based on 352 reports) 6.5%
Snow
- Minneapolis(Based on 19 reports) 5.3%
- Hennepin County(Based on 43 reports) 4.7%
- Minnesota(Based on 352 reports) 4.5%
Blowing Snow
- Minneapolis(Based on 19 reports) 5.3%
- Hennepin County(Based on 43 reports) 2.3%
- Minnesota(Based on 352 reports) 1.4%
| # | Date | Location | Vehicles | Drunk persons | Fatalites | Persons | Pedestrians |
|---|
| 1 | Feb 2, 2016 04:43 PM | Hennepin Ave, 8th St N | 1 | - | 1
| 1 | 1 |
| 2 | Feb 16, 2016 05:25 PM | 30th Ave | 1 | - | 1
| 1 | 1 |
| 3 | Apr 14, 2016 01:20 AM | Cr-36 University Ave | 1 | - | 1
| 1 | - |
| 4 | Apr 4, 2016 05:51 PM | I-94 | 3 | - | 1
| 7 | - |
| 5 | Apr 22, 2016 01:39 AM | Sr-62 | 1 | - | 1
| 1 | - |
| 6 | May 2, 2016 03:28 AM | I-394 | 2 | 1
| 1 | 2 | - |
| 7 | May 18, 2016 02:10 AM | Cr-2 Penn Ave N, Cr-81 W Broadway Ave | 2 | 1
| 1 | 2 | - |
| 8 | May 24, 2016 10:44 AM | I-94, I-394 | 1 | - | 1
| 1 | 1 |
| 9 | May 20, 2016 00:25 AM | Sr-55 Olson Memorial Hwy | 1 | 1
| 1 | 1 | - |
| 10 | Jun 19, 2016 01:06 PM | Cr-66 Broadway St Ne | 1 | - | 1
| 1 | 1 |
| 11 | Jul 17, 2016 01:44 AM | I-94 Ramp 231b | 1 | 1
| 1 | 1 | - |
| 12 | Aug 10, 2016 08:10 PM | Cr-66 Broadway St Ne | 1 | 1
| 1 | 1 | - |
| 13 | Sep 6, 2016 03:25 PM | E 24th St, 15th Ave S | 2 | - | 1
| 3 | - |
| 14 | Sep 10, 2016 10:45 PM | Sr-47 University Ave Ne, 16th Ave Ne | 1 | - | 1
| 1 | 1 |
| 15 | Oct 3, 2016 12:39 AM | Sr-47 University Ave Ne, 7th Ave Ne | 2 | - | 1
| 2 | - |
| 16 | Oct 17, 2016 03:59 PM | 11th St N, Hawthorne Ave | 1 | - | 1
| 1 | 1 |
| 17 | Oct 18, 2016 08:35 AM | Cr-81 W Broadway Ave, Sheridan Ave N | 1 | - | 1
| 1 | 1 |
| 18 | Nov 27, 2016 05:05 PM | Nicollet Ave S, E 43rd St | 1 | - | 1
| 1 | 1 |
| 19 | Dec 31, 2016 03:26 AM | I-35w | 1 | - | 1
| 1 | 1 |
Minneapolis fatal car crash and road traffic accident list for 2015
- Fatal accident count11
- Vehicles involved in fatal accidents13
- Fatal accidents involving drunk persons3
- Fatalities12
- Persons involved in fatal accidents20
- Pedestrians involved in fatal accidents8
Average EMS response time
- Minneapolis(Based on 9 reports) 6.8 mins
- Hennepin County(Based on 21 reports) 8.4 mins
- Minnesota(Based on 265 reports) 10.1 mins
Average hospital transport time
- Minneapolis(Based on 5 reports) 15.6 mins
- Hennepin County(Based on 11 reports) 25.5 mins
- Minnesota(Based on 114 reports) 30.6 mins
Dark - Lighted
- Minneapolis(Based on 11 reports) 54.5%
- Hennepin County(Based on 31 reports) 32.3%
- Minnesota(Based on 366 reports) 13.7%
Dawn
- Minneapolis(Based on 11 reports) 18.2%
- Hennepin County(Based on 31 reports) 9.7%
- Minnesota(Based on 366 reports) 3.6%
Daylight
- Minneapolis(Based on 11 reports) 18.2%
- Hennepin County(Based on 31 reports) 51.6%
- Minnesota(Based on 366 reports) 58.7%
Dark - Not Lighted
- Minneapolis(Based on 11 reports) 9.1%
- Hennepin County(Based on 31 reports) 3.2%
- Minnesota(Based on 366 reports) 18.3%
Clear
- Minneapolis(Based on 11 reports) 81.8%
- Hennepin County(Based on 31 reports) 61.3%
- Minnesota(Based on 369 reports) 66.9%
Unknown
- Minneapolis(Based on 11 reports) 18.2%
- Hennepin County(Based on 31 reports) 35.5%
- Minnesota(Based on 369 reports) 27.1%
| # | Date | Location | Vehicles | Drunk persons | Fatalites | Persons | Pedestrians |
|---|
| 1 | Feb 7, 2015 02:20 AM | Sr-47 | 1 | 1
| 2 | 5 | - |
| 2 | Mar 2, 2015 06:05 AM | I-35w | 1 | - | 1
| 1 | 1 |
| 3 | Mar 13, 2015 03:08 AM | I-94 | 1 | - | 1
| 2 | 1 |
| 4 | May 28, 2015 01:58 PM | 35th St E, 2nd Ave S | 2 | - | 1
| 2 | - |
| 5 | Jun 5, 2015 10:58 PM | Cr-152 Cedar Ave S, 27 St E | 1 | - | 1
| 1 | 1 |
| 6 | Jul 8, 2015 03:42 PM | Sr-65 3rd Ave S, 2nd St S | 1 | - | 1
| 1 | 1 |
| 7 | Aug 4, 2015 06:28 AM | Cr-27 Stinson Blvd, 37th Ave Ne | 1 | - | 1
| 1 | 1 |
| 8 | Sep 20, 2015 03:05 AM | I-94 | 1 | 1
| 1 | 2 | 1 |
| 9 | Oct 31, 2015 09:25 PM | Victory Memorial Dr | 1 | - | 1
| 2 | 1 |
| 10 | Nov 8, 2015 06:04 PM | Cr-66 Broadway Ave Ne | 2 | 1
| 1 | 2 | - |
| 11 | Dec 31, 2015 09:25 PM | Lyndale Ave N | 1 | - | 1
| 1 | 1 |
Minneapolis fatal car crash and road traffic accident list for 2014
- Fatal accident count7
- Vehicles involved in fatal accidents13
- Fatal accidents involving drunk persons2
- Fatalities7
- Persons involved in fatal accidents14
- Pedestrians involved in fatal accidents3
Average EMS response time
- Minneapolis(Based on 6 reports) 7.3 mins
- Hennepin County(Based on 25 reports) 8.3 mins
- Minnesota(Based on 227 reports) 11.5 mins
Average hospital transport time
- Minneapolis(Based on 2 reports) 10.0 mins
- Hennepin County(Based on 14 reports) 29.1 mins
- Minnesota(Based on 103 reports) 31.2 mins
Dark - Lighted
- Minneapolis(Based on 7 reports) 57.1%
- Hennepin County(Based on 31 reports) 35.5%
- Minnesota(Based on 315 reports) 10.5%
Daylight
- Minneapolis(Based on 7 reports) 28.6%
- Hennepin County(Based on 31 reports) 51.6%
- Minnesota(Based on 315 reports) 60.3%
Dark - Not Lighted
- Minneapolis(Based on 7 reports) 14.3%
- Hennepin County(Based on 31 reports) 6.5%
- Minnesota(Based on 315 reports) 21.3%
Clear
- Minneapolis(Based on 7 reports) 71.4%
- Hennepin County(Based on 31 reports) 54.8%
- Minnesota(Based on 320 reports) 56.3%
Unknown
- Minneapolis(Based on 7 reports) 28.6%
- Hennepin County(Based on 31 reports) 38.7%
- Minnesota(Based on 320 reports) 29.7%
| # | Date | Location | Vehicles | Drunk persons | Fatalites | Persons | Pedestrians |
|---|
| 1 | Feb 3, 2014 09:50 PM | Cr-5 Franklin Ave W | 2 | 1
| 1 | 1 | 1 |
| 2 | Feb 12, 2014 06:18 PM | Cr-25 Lake St. W, Market Plaza | 1 | - | 1
| 1 | 1 |
| 3 | Apr 25, 2014 10:10 PM | Cr-81 W Broadway Ave | 1 | - | 1
| 1 | 1 |
| 4 | Jun 4, 2014 04:39 PM | Cr-2 Penn Ave N, 23rd Ave N | 3 | - | 1
| 3 | - |
| 5 | Jun 5, 2014 09:27 PM | I-94, I-94 Ramp Nb From Dowling Ave | 2 | - | 1
| 2 | - |
| 6 | Jun 28, 2014 04:02 AM | I-394 | 2 | 1
| 1 | 3 | - |
| 7 | Aug 24, 2014 02:04 PM | I-35w, Cr-152 Washington Ave | 2 | - | 1
| 3 | - |
Minneapolis fatal car crash and road traffic accident list for 2013
- Fatal accident count16
- Vehicles involved in fatal accidents27
- Fatal accidents involving drunk persons6
- Fatalities19
- Persons involved in fatal accidents48
- Pedestrians involved in fatal accidents7
Average EMS response time
- Minneapolis(Based on 11 reports) 4.7 mins
- Hennepin County(Based on 23 reports) 5.6 mins
- Minnesota(Based on 254 reports) 10.4 mins
Average hospital transport time
- Minneapolis(Based on 7 reports) 11.7 mins
- Hennepin County(Based on 14 reports) 17.1 mins
- Minnesota(Based on 135 reports) 30.5 mins
Dark - Lighted
- Minneapolis(Based on 15 reports) 60.0%
- Hennepin County(Based on 35 reports) 40.0%
- Minnesota(Based on 347 reports) 10.1%
Daylight
- Minneapolis(Based on 15 reports) 33.3%
- Hennepin County(Based on 35 reports) 48.6%
- Minnesota(Based on 347 reports) 61.7%
Dusk
- Minneapolis(Based on 15 reports) 6.7%
- Hennepin County(Based on 35 reports) 8.6%
- Minnesota(Based on 347 reports) 3.5%
Clear
- Minneapolis(Based on 15 reports) 60.0%
- Hennepin County(Based on 35 reports) 62.9%
- Minnesota(Based on 350 reports) 58.3%
Unknown
- Minneapolis(Based on 15 reports) 40.0%
- Hennepin County(Based on 35 reports) 31.4%
- Minnesota(Based on 350 reports) 33.7%
| # | Date | Location | Vehicles | Drunk persons | Fatalites | Persons | Pedestrians |
|---|
| 1 | Mar 22, 2013 06:25 PM | E 26th St | 1 | - | 1
| 1 | - |
| 2 | Mar 23, 2013 02:32 AM | 32nd St E | 1 | - | 1
| 1 | 1 |
| 3 | Mar 23, 2013 01:05 PM | Fremont Ave N, 22nd Ave N | 2 | - | 1
| 4 | - |
| 4 | Mar 30, 2013 02:17 AM | Cr-3 Lake St E, Cr-152 Cedar Ave S | 1 | 1
| 1 | 3 | 1 |
| 5 | Apr 7, 2013 01:04 PM | I-94 | 3 | - | 3
| 11 | - |
| 6 | May 10, 2013 04:05 PM | 26th St W, Blaisdell Ave S | 2 | - | 1
| 3 | - |
| 7 | May 19, 2013 03:04 AM | 27th St W, Emerson Ave S | 2 | 1
| 1 | 2 | - |
| 8 | Jul 3, 2013 10:30 PM | 28th St W, Pleasant Ave S | 1 | - | 1
| 1 | 1 |
| 9 | Jul 11, 2013 09:33 PM | Sr-55 Olson Memorial Hwy, James Ave N | 2 | - | 1
| 2 | 1 |
| 10 | Aug 15, 2013 01:10 AM | 26th St E, Bloomington Ave S | 2 | 1
| 1 | 5 | - |
| 11 | Aug 23, 2013 09:20 PM | Sr-55 Olson Memorial Hwy, Van While Memorial Blvd | 1 | - | 1
| 1 | 1 |
| 12 | Sep 9, 2013 00:58 AM | Sr-65 Central Ave Ne, Old Us-12 Se 4th St | 2 | 1
| 1 | 3 | - |
| 13 | Sep 12, 2013 06:34 PM | 1st St S, Marquette Ave | 1 | - | 1
| 1 | 1 |
| 14 | Nov 3, 2013 01:00 AM | Sr-55 Olson Memoriol Hwy, Morgan Ave N | 4 | 1
| 2 | 7 | - |
| 15 | Aug 12, 2013 09:33 PM | W River Pkwy | 1 | 1
| 1 | 1 | - |
| 16 | Dec 20, 2013 09:44 PM | Cr-152 Osseo Rd, 49th Ave N | 1 | - | 1
| 2 | 1 |
Minneapolis fatal car crash and road traffic accident list for 2012
- Fatal accident count9
- Vehicles involved in fatal accidents13
- Fatal accidents involving drunk persons1
- Fatalities10
- Persons involved in fatal accidents19
- Pedestrians involved in fatal accidents3
Average EMS response time
- Minneapolis(Based on 7 reports) 5.6 mins
- Hennepin County(Based on 19 reports) 6.1 mins
- Minnesota(Based on 236 reports) 10.5 mins
Average hospital transport time
- Minneapolis(Based on 3 reports) 11.0 mins
- Hennepin County(Based on 7 reports) 21.6 mins
- Minnesota(Based on 97 reports) 30.2 mins
Daylight
- Minneapolis(Based on 9 reports) 55.6%
- Hennepin County(Based on 31 reports) 67.7%
- Minnesota(Based on 337 reports) 57.6%
Dark - Lighted
- Minneapolis(Based on 9 reports) 33.3%
- Hennepin County(Based on 31 reports) 22.6%
- Minnesota(Based on 337 reports) 9.2%
Dusk
- Minneapolis(Based on 9 reports) 11.1%
- Hennepin County(Based on 31 reports) 3.2%
- Minnesota(Based on 337 reports) 2.7%
Clear
- Minneapolis(Based on 9 reports) 66.7%
- Hennepin County(Based on 31 reports) 77.4%
- Minnesota(Based on 339 reports) 64.0%
Unknown
- Minneapolis(Based on 9 reports) 33.3%
- Hennepin County(Based on 31 reports) 22.6%
- Minnesota(Based on 339 reports) 28.6%
Rain
- Minneapolis(Based on 9 reports) 11.1%
- Hennepin County(Based on 31 reports) 3.2%
- Minnesota(Based on 339 reports) 4.7%
| # | Date | Location | Vehicles | Drunk persons | Fatalites | Persons | Pedestrians |
|---|
| 1 | Mar 29, 2012 09:50 AM | Cr-3 E Lake St, 27th Ave S | 2 | - | 1
| 3 | - |
| 2 | Apr 24, 2012 05:50 PM | Cr-3 Excelsior Blvd, 32nd Ave W | 2 | - | 1
| 2 | - |
| 3 | Jun 9, 2012 12:23 AM | I-94 | 1 | - | 1
| 1 | - |
| 4 | Jul 10, 2012 07:42 AM | Us-55 Olson Memorial Hwy, Lundale Ave S | 2 | - | 1
| 2 | - |
| 5 | Jul 20, 2012 04:25 AM | Sr-65 | 1 | 1
| 1 | 1 | - |
| 6 | Sep 30, 2012 06:57 PM | E 26th St, 11th Ave S | 1 | - | 1
| 1 | 1 |
| 7 | Oct 27, 2012 02:40 AM | 9rd Ave N, 1st St N | 1 | - | 1
| 1 | 1 |
| 8 | Nov 21, 2012 05:30 PM | Sr-55 Olson Memorial Hwy, Oaklake Ave N | 1 | - | 1
| 1 | 1 |
| 9 | Dec 14, 2012 02:25 PM | Cr-153 Lowry Ave N, 2nd St N | 2 | - | 2
| 7 | - |
Minneapolis fatal car crash and road traffic accident list for 2011
- Fatal accident count19
- Vehicles involved in fatal accidents30
- Fatal accidents involving drunk persons6
- Fatalities21
- Persons involved in fatal accidents38
- Pedestrians involved in fatal accidents9
Average EMS response time
- Minneapolis(Based on 14 reports) 5.8 mins
- Hennepin County(Based on 24 reports) 7.1 mins
- Minnesota(Based on 221 reports) 11.0 mins
Average hospital transport time
- Minneapolis(Based on 8 reports) 19.1 mins
- Hennepin County(Based on 15 reports) 23.9 mins
- Minnesota(Based on 119 reports) 34.7 mins
Dark - Lighted
- Minneapolis(Based on 19 reports) 57.9%
- Hennepin County(Based on 38 reports) 44.7%
- Minnesota(Based on 328 reports) 12.8%
Daylight
- Minneapolis(Based on 19 reports) 42.1%
- Hennepin County(Based on 38 reports) 47.4%
- Minnesota(Based on 328 reports) 57.0%
Clear
- Minneapolis(Based on 19 reports) 73.7%
- Hennepin County(Based on 38 reports) 71.1%
- Minnesota(Based on 329 reports) 59.9%
Unknown
- Minneapolis(Based on 19 reports) 15.8%
- Hennepin County(Based on 38 reports) 21.1%
- Minnesota(Based on 329 reports) 27.7%
Rain
- Minneapolis(Based on 19 reports) 10.5%
- Hennepin County(Based on 38 reports) 5.3%
- Minnesota(Based on 329 reports) 4.3%
Snow
- Minneapolis(Based on 19 reports) 5.3%
- Hennepin County(Based on 38 reports) 5.3%
- Minnesota(Based on 329 reports) 5.8%
Sleet or Hail
- Minneapolis(Based on 19 reports) 5.3%
- Hennepin County(Based on 38 reports) 2.6%
- Minnesota(Based on 329 reports) 1.8%
| # | Date | Location | Vehicles | Drunk persons | Fatalites | Persons | Pedestrians |
|---|
| 1 | Jan 4, 2011 01:10 PM | E 46 St 0427000046, Park Ave S | 2 | - | 2
| 3 | - |
| 2 | Apr 13, 2011 04:03 PM | Upton Abe 0525850201 | 2 | - | 1
| 1 | - |
| 3 | Apr 19, 2011 11:55 PM | I-94 0100000094 | 2 | 1
| 2 | 2 | - |
| 4 | Apr 15, 2011 09:30 PM | Hennepin 0525850425, Lake St | 1 | - | 1
| 3 | 1 |
| 5 | Apr 21, 2011 07:48 AM | 4 St Se 0427000037, 15 Ave Se | 1 | - | 1
| 1 | 1 |
| 6 | May 25, 2011 06:22 PM | Lake St E 0427000003, 40th Ave S | 3 | 1
| 1 | 6 | - |
| 7 | Jun 17, 2011 10:24 PM | I-35w, Sr-62 Entrance Ramp | 1 | 1
| 1 | 2 | - |
| 8 | Jun 13, 2011 11:55 PM | Upton Avn 1025850306, 21 Ave N | 1 | 1
| 1 | 3 | - |
| 9 | Jul 21, 2011 07:18 PM | 5 St S 0525850218, 11 Ave S | 1 | - | 1
| 1 | 1 |
| 10 | Aug 10, 2011 06:24 AM | I-94 | 4 | - | 1
| 4 | - |
| 11 | Aug 29, 2011 02:55 PM | I-94 | 3 | - | 1
| 3 | - |
| 12 | Aug 5, 2011 01:29 AM | I-94, Hennepin Ave | 1 | 1
| 1 | 1 | - |
| 13 | Sep 21, 2011 00:18 AM | I-94 | 1 | - | 1
| 1 | 1 |
| 14 | Aug 23, 2011 11:10 PM | I-94 | 2 | - | 1
| 1 | 1 |
| 15 | Oct 25, 2011 01:50 AM | 31st St E, Chicago Ave S | 1 | 1
| 1 | 1 | - |
| 16 | Nov 4, 2011 06:57 AM | Cr-5 Franklin Ave, E Stevens St | 1 | - | 1
| 1 | 1 |
| 17 | Nov 12, 2011 10:50 AM | West River Pkwy, Franklin Ave | 1 | - | 1
| 2 | 1 |
| 18 | Dec 25, 2011 10:17 PM | Us-952a | 1 | - | 1
| 1 | 1 |
| 19 | Dec 30, 2011 06:23 PM | Cr-33 Park Ave, 27th St E | 1 | - | 1
| 1 | 1 |
Minneapolis fatal car crash and road traffic accident list for 2010
- Fatal accident count15
- Vehicles involved in fatal accidents27
- Fatal accidents involving drunk persons6
- Fatalities20
- Persons involved in fatal accidents41
- Pedestrians involved in fatal accidents7
Average EMS response time
- Minneapolis(Based on 13 reports) 5.2 mins
- Hennepin County(Based on 25 reports) 5.5 mins
- Minnesota(Based on 267 reports) 10.4 mins
Average hospital transport time
- Minneapolis(Based on 10 reports) 19.8 mins
- Hennepin County(Based on 17 reports) 24.7 mins
- Minnesota(Based on 140 reports) 29.7 mins
Daylight
- Minneapolis(Based on 15 reports) 60.0%
- Hennepin County(Based on 33 reports) 60.6%
- Minnesota(Based on 356 reports) 64.6%
Dark - Lighted
- Minneapolis(Based on 15 reports) 26.7%
- Hennepin County(Based on 33 reports) 27.3%
- Minnesota(Based on 356 reports) 9.8%
Dark - Unknown Lighting
- Minneapolis(Based on 15 reports) 13.3%
- Hennepin County(Based on 33 reports) 6.1%
- Minnesota(Based on 356 reports) 1.7%
Clear
- Minneapolis(Based on 15 reports) 73.3%
- Hennepin County(Based on 33 reports) 69.7%
- Minnesota(Based on 357 reports) 64.4%
Unknown
- Minneapolis(Based on 15 reports) 26.7%
- Hennepin County(Based on 33 reports) 24.2%
- Minnesota(Based on 357 reports) 25.2%
Rain
- Minneapolis(Based on 15 reports) 6.7%
- Hennepin County(Based on 33 reports) 9.1%
- Minnesota(Based on 357 reports) 5.6%
Snow
- Minneapolis(Based on 15 reports) 6.7%
- Hennepin County(Based on 33 reports) 6.1%
- Minnesota(Based on 357 reports) 4.8%
| # | Date | Location | Vehicles | Drunk persons | Fatalites | Persons | Pedestrians |
|---|
| 1 | Jan 28, 2010 10:10 PM | 60 St E 0525850271 | 1 | 1
| 2 | 3 | - |
| 2 | Feb 23, 2010 08:44 AM | Sr-121 0300000121, Sr-61 Wb Ent Ramp | 2 | - | 2
| 3 | - |
| 3 | Mar 16, 2010 08:03 PM | Minnehaha 1025851121, Bloomington Ave S | 1 | - | 1
| 1 | 1 |
| 4 | Jun 18, 2010 04:28 PM | I-94 0100000094, Washington Ave N | 2 | - | 1
| 2 | - |
| 5 | Jul 13, 2010 03:34 AM | 29 Av Ne 0525850242 | 1 | - | 2
| 5 | - |
| 6 | Aug 22, 2010 08:10 AM | Upton Ave 1025850306, Golden Valley Rd | 5 | 1
| 1 | 1 | - |
| 7 | Aug 28, 2010 02:35 AM | Marshall 0427000023 | 1 | - | 1
| 2 | - |
| 8 | Aug 30, 2010 04:23 PM | Sr-65, Hennepin Ane | 3 | - | 1
| 4 | - |
| 9 | Aug 30, 2010 02:45 PM | Monroe St 0525850193, 15th Ave Ne | 1 | 1
| 1 | 1 | 1 |
| 10 | Sep 20, 2010 11:06 PM | 35 St E 0525850249, 18 Ave S | 3 | 1
| 1 | 5 | - |
| 11 | Oct 25, 2010 02:05 PM | 1st Ave N 0525850350, 5th St N | 1 | - | 1
| 1 | 1 |
| 12 | Oct 24, 2010 02:44 AM | 4th St Se 0427000037 | 1 | 1
| 1 | 1 | 2 |
| 13 | Nov 3, 2010 10:15 AM | Franklin 0427000005, 14th Ave S | 1 | - | 1
| 6 | 1 |
| 14 | Nov 23, 2010 09:30 AM | Lake St 0427000003, Blaisdell Ave S | 1 | - | 1
| 1 | 1 |
| 15 | Dec 5, 2010 00:33 AM | Wbroadway 0427000066, W 2nd St | 3 | 1
| 3 | 5 | - |
Minneapolis fatal car crash and road traffic accident list for 2009
- Fatal accident count17
- Vehicles involved in fatal accidents21
- Fatal accidents involving drunk persons9
- Fatalities17
- Persons involved in fatal accidents32
- Pedestrians involved in fatal accidents7
Average EMS response time
- Minneapolis(Based on 13 reports) 6.5 mins
- Hennepin County(Based on 30 reports) 7.5 mins
- Minnesota(Based on 272 reports) 10.3 mins
Average hospital transport time
- Minneapolis(Based on 4 reports) 15.5 mins
- Hennepin County(Based on 16 reports) 26.0 mins
- Minnesota(Based on 152 reports) 31.3 mins
Dark - Lighted
- Minneapolis(Based on 17 reports) 64.7%
- Hennepin County(Based on 42 reports) 38.1%
- Minnesota(Based on 366 reports) 15.3%
Daylight
- Minneapolis(Based on 17 reports) 29.4%
- Hennepin County(Based on 42 reports) 50.0%
- Minnesota(Based on 366 reports) 61.2%
Dawn
- Minneapolis(Based on 17 reports) 5.9%
- Hennepin County(Based on 42 reports) 2.4%
- Minnesota(Based on 366 reports) 4.4%
Clear
- Minneapolis(Based on 17 reports) 94.1%
- Hennepin County(Based on 42 reports) 85.7%
- Minnesota(Based on 371 reports) 82.2%
Sleet or Hail
- Minneapolis(Based on 17 reports) 5.9%
- Hennepin County(Based on 42 reports) 2.4%
- Minnesota(Based on 371 reports) 2.2%
| # | Date | Location | Vehicles | Drunk persons | Fatalites | Persons | Pedestrians |
|---|
| 1 | Feb 25, 2009 06:35 PM | Minnehaha 0427000048, 46th St | 1 | - | 1
| 2 | 1 |
| 2 | Feb 26, 2009 04:36 AM | Sr-55 0300000055, 26th St E | 3 | 2
| 1 | 4 | - |
| 3 | Mar 7, 2009 02:14 AM | 36 Ave N 1025850073, Near Dupont Ave N | 1 | 1
| 1 | 2 | - |
| 4 | Apr 10, 2009 07:40 AM | E Calhoun 0525850201, Near W 36th St | 1 | - | 1
| 1 | - |
| 5 | Feb 25, 2009 00:48 AM | I-35w 010000035w, I-94 | 2 | 1
| 1 | 2 | - |
| 6 | May 20, 2009 07:40 AM | Park Ave 0427000033, 14th St E | 1 | - | 1
| 2 | 1 |
| 7 | May 26, 2009 02:20 PM | Park Av S 0427000033, E 15th St | 1 | - | 1
| 2 | 1 |
| 8 | Jun 2, 2009 01:18 AM | Washingtn 0427000152, 2 St N | 1 | 1
| 1 | 1 | - |
| 9 | Jun 14, 2009 00:10 AM | Lake St E 0427000003, Near 39th Ave S | 1 | 1
| 1 | 2 | 1 |
| 10 | Apr 15, 2009 00:06 AM | I-94ramp 0100000094, I-35w | 1 | 1
| 1 | 2 | - |
| 11 | Aug 3, 2009 03:37 PM | 35 St W 052850249, Near Hiawatha Ave | 1 | - | 1
| 1 | - |
| 12 | Aug 13, 2009 00:49 AM | I-35w 010000035w, Near 35th St Ext Rmp | 1 | - | 1
| 2 | 1 |
| 13 | Sep 23, 2009 03:33 PM | 7th St N 0525850221, 11th Ave N | 2 | - | 1
| 2 | - |
| 14 | Oct 11, 2009 00:57 AM | 31st St 0525850366, Nicollet Ave S | 1 | 1
| 1 | 2 | - |
| 15 | Oct 16, 2009 06:30 AM | 46 St E 0525850427, 36 Ave S | 1 | - | 1
| 2 | 1 |
| 16 | Oct 22, 2009 09:42 PM | Minnehaha 0427000048, 31 St E | 1 | - | 1
| 2 | 1 |
| 17 | Sep 9, 2009 04:57 AM | I-35 010000035w, Near 50th St Brdg | 1 | 1
| 1 | 1 | - |
Minneapolis fatal car crash and road traffic accident list for 2008
- Fatal accident count22
- Vehicles involved in fatal accidents37
- Fatal accidents involving drunk persons6
- Fatalities24
- Persons involved in fatal accidents65
- Pedestrians involved in fatal accidents5
Average EMS response time
- Minneapolis(Based on 7 reports) 5.0 mins
- Hennepin County(Based on 23 reports) 7.7 mins
- Minnesota(Based on 263 reports) 10.4 mins
Average hospital transport time
- Minneapolis(Based on 5 reports) 30.8 mins
- Hennepin County(Based on 16 reports) 42.0 mins
- Minnesota(Based on 146 reports) 40.0 mins
Daylight
- Minneapolis(Based on 22 reports) 45.5%
- Hennepin County(Based on 49 reports) 44.9%
- Minnesota(Based on 417 reports) 54.7%
Dark - Lighted
- Minneapolis(Based on 22 reports) 40.9%
- Hennepin County(Based on 49 reports) 38.8%
- Minnesota(Based on 417 reports) 12.2%
Dawn
- Minneapolis(Based on 22 reports) 9.1%
- Hennepin County(Based on 49 reports) 6.1%
- Minnesota(Based on 417 reports) 3.1%
Dusk
- Minneapolis(Based on 22 reports) 4.5%
- Hennepin County(Based on 49 reports) 2.0%
- Minnesota(Based on 417 reports) 2.9%
Clear
- Minneapolis(Based on 22 reports) 90.9%
- Hennepin County(Based on 50 reports) 88.0%
- Minnesota(Based on 421 reports) 82.2%
Rain
- Minneapolis(Based on 22 reports) 9.1%
- Hennepin County(Based on 50 reports) 4.0%
- Minnesota(Based on 421 reports) 5.5%
| # | Date | Location | Vehicles | Drunk persons | Fatalites | Persons | Pedestrians |
|---|
| 1 | Jan 23, 2008 01:15 PM | 33 0427000033, 33 St E | 1 | - | 1
| 2 | 1 |
| 2 | Jan 27, 2008 00:40 AM | Sr-62 0300000062, Portland Ave | 1 | - | 1
| 2 | - |
| 3 | Mar 7, 2008 06:59 PM | 53 Ave N 0528580273, James St N | 3 | 1
| 1 | 5 | - |
| 4 | Mar 28, 2008 08:20 PM | 33 0427000033, 24 St E | 2 | 1
| 1 | 2 | - |
| 5 | Apr 6, 2008 08:08 AM | 3 0427000003, Stevens Ave S | 2 | - | 1
| 4 | - |
| 6 | May 16, 2008 09:56 PM | I-94 0100000094, 20 Ave | 2 | - | 1
| 7 | - |
| 7 | Apr 17, 2008 00:14 AM | I-94 0100000094, Hiawatha Ave | 1 | - | 2
| 4 | - |
| 8 | Jul 15, 2008 11:45 AM | 36 0427000036, Malcolm St Se | 2 | - | 1
| 2 | - |
| 9 | Jun 9, 2008 01:52 PM | I-94, I-394 | 4 | - | 1
| 5 | - |
| 10 | Aug 1, 2008 03:00 PM | Columbia 1025850109, Near 5th St Ne | 1 | - | 2
| 2 | - |
| 11 | Mar 7, 2008 06:26 AM | I-35w 010000035w, Near 46 St | 3 | - | 1
| 3 | - |
| 12 | Sep 11, 2008 04:22 AM | 3 0427000003, Near 32nd St W | 1 | - | 1
| 2 | 1 |
| 13 | Sep 21, 2008 01:42 PM | 33 0427000033, 31st St E | 3 | 1
| 1 | 6 | - |
| 14 | Oct 1, 2008 02:25 AM | Washingtn 0427000152, Near 12th Ave N | 1 | 1
| 1 | 2 | - |
| 15 | Oct 2, 2008 03:19 AM | Portland 0427000035, Near 24th St E | 1 | - | 1
| 2 | 1 |
| 16 | Aug 28, 2008 12:20 AM | Riverside 0525850198, 9th St S (I-94 Ent) | 2 | - | 1
| 3 | - |
| 17 | Oct 12, 2008 02:50 PM | 3rd Ave S 0525850305, 4th St S | 1 | - | 1
| 2 | - |
| 18 | Oct 19, 2008 06:30 PM | Upton Ave 0525850201, W 46th St | 2 | 1
| 1 | 2 | - |
| 19 | Apr 16, 2008 05:20 AM | 42 St E 0525850260, 14th Ave S | 1 | - | 1
| 1 | - |
| 20 | Nov 29, 2008 05:00 PM | Broadway 0427000066, Main St Ne | 1 | - | 1
| 4 | 1 |
| 21 | Sep 23, 2008 09:55 AM | 5th St S 1025852197, Nicollet Mall | 1 | - | 1
| 2 | 1 |
| 22 | Oct 25, 2008 05:29 AM | 46 Th 0427000046, Stevens Ave S | 1 | 1
| 1 | 1 | - |
Minneapolis fatal car crash and road traffic accident list for 2007
- Fatal accident count15
- Vehicles involved in fatal accidents100
- Fatal accidents involving drunk persons9
- Fatalities26
- Persons involved in fatal accidents198
- Pedestrians involved in fatal accidents16
Average EMS response time
- Minneapolis(Based on 5 reports) 6.2 mins
- Hennepin County(Based on 12 reports) 5.4 mins
- Minnesota(Based on 176 reports) 10.9 mins
Average hospital transport time
- Minneapolis(Based on 2 reports) 18.5 mins
- Hennepin County(Based on 8 reports) 74.4 mins
- Minnesota(Based on 95 reports) 52.5 mins
Dark - Lighted
- Minneapolis(Based on 15 reports) 53.3%
- Hennepin County(Based on 37 reports) 35.1%
- Minnesota(Based on 460 reports) 10.7%
Daylight
- Minneapolis(Based on 15 reports) 46.7%
- Hennepin County(Based on 37 reports) 54.1%
- Minnesota(Based on 460 reports) 56.3%
Clear
- Minneapolis(Based on 15 reports) 100.0%
- Hennepin County(Based on 37 reports) 97.3%
- Minnesota(Based on 463 reports) 88.3%
| # | Date | Location | Vehicles | Drunk persons | Fatalites | Persons | Pedestrians |
|---|
| 1 | Jan 11, 2007 02:10 AM | 159, 15 Street | 1 | - | 1
| 2 | 1 |
| 2 | Oct 23, 2007 09:00 AM | 11aves 0525850213, 15sts | 1 | - | 1
| 2 | 1 |
| 3 | Aug 17, 2007 07:10 PM | E25st 0525850238, S30ave | 1 | - | 1
| 12 | 11 |
| 4 | Sep 6, 2007 09:59 AM | 3 0427000003, Dean Pkwy | 1 | - | 1
| 2 | 1 |
| 5 | Jul 27, 2007 06:18 PM | 22 Av N 1025850233, Aldrich Av N | 1 | - | 1
| 1 | - |
| 6 | Nov 9, 2007 02:08 AM | 152 0427000152, Washington Ave N | 1 | 1
| 1 | 1 | - |
| 7 | Dec 10, 2007 09:40 PM | 66 0427000066, Quincy St Ne | 1 | - | 1
| 2 | 1 |
| 8 | Nov 1, 2007 12:20 AM | Allyway, 27 Ave N | 1 | - | 1
| 3 | 1 |
| 9 | Nov 7, 2007 07:30 PM | 54th St 0525850321, Near 43 Ave S | 1 | - | 1
| 1 | - |
| 10 | May 19, 2007 02:49 AM | I-35w 010000035w, Diamond Lake Rd | 1 | - | 1
| 2 | - |
| 11 | Apr 2, 2007 02:05 AM | 2nd St Ne 0525850226, 10th Ave Ne | 2 | - | 1
| 3 | - |
| 12 | Apr 8, 2007 04:05 PM | 6 St S 0525850219, 11 Ave S | 3 | 1
| 1 | 3 | - |
| 13 | Aug 1, 2007 06:06 PM | I-35w 010000035w, Mississippi River | 80 | 5
| 12 | 158 | - |
| 14 | Apr 14, 2007 02:02 AM | I-35w 010000035w, Hwy 55 | 1 | 1
| 1 | 3 | - |
| 15 | Aug 31, 2007 09:11 PM | 33 0427000033, 28 St E | 4 | 1
| 1 | 3 | - |
Minneapolis fatal car crash and road traffic accident list for 2006
- Fatal accident count15
- Vehicles involved in fatal accidents23
- Fatal accidents involving drunk persons9
- Fatalities15
- Persons involved in fatal accidents45
- Pedestrians involved in fatal accidents3
Average EMS response time
- Minneapolis(Based on 9 reports) 5.9 mins
- Hennepin County(Based on 21 reports) 6.4 mins
- Minnesota(Based on 266 reports) 10.5 mins
Average hospital transport time
- Minneapolis(Based on 6 reports) 18.2 mins
- Hennepin County(Based on 13 reports) 21.8 mins
- Minnesota(Based on 152 reports) 42.2 mins
Dark - Lighted
- Minneapolis(Based on 15 reports) 60.0%
- Hennepin County(Based on 38 reports) 47.4%
- Minnesota(Based on 454 reports) 12.8%
Dark - Not Lighted
- Minneapolis(Based on 15 reports) 20.0%
- Hennepin County(Based on 38 reports) 7.9%
- Minnesota(Based on 454 reports) 29.3%
Daylight
- Minneapolis(Based on 15 reports) 20.0%
- Hennepin County(Based on 38 reports) 42.1%
- Minnesota(Based on 454 reports) 54.2%
Clear
- Minneapolis(Based on 15 reports) 93.3%
- Hennepin County(Based on 38 reports) 94.7%
- Minnesota(Based on 456 reports) 87.1%
Rain
- Minneapolis(Based on 15 reports) 6.7%
- Hennepin County(Based on 38 reports) 5.3%
- Minnesota(Based on 456 reports) 6.4%
| # | Date | Location | Vehicles | Drunk persons | Fatalites | Persons | Pedestrians |
|---|
| 1 | Feb 12, 2006 02:10 AM | 197, James Ave. N. | 2 | 1
| 1 | 9 | - |
| 2 | Feb 18, 2006 01:26 AM | I-35w | 2 | 1
| 1 | 2 | - |
| 3 | Feb 23, 2006 01:10 AM | 33, 26 Street | 3 | - | 1
| 3 | - |
| 4 | Mar 29, 2006 07:34 AM | I-94 | 2 | - | 1
| 2 | - |
| 5 | Apr 12, 2006 08:18 PM | 240, 26 Ave | 1 | - | 1
| 2 | - |
| 6 | May 18, 2006 09:11 AM | I-94 | 1 | 1
| 1 | 1 | - |
| 7 | Jul 24, 2006 11:33 AM | I-94 | 1 | 1
| 1 | 2 | - |
| 8 | Aug 17, 2006 06:40 AM | 36, Washington Avenue | 1 | - | 1
| 2 | 1 |
| 9 | Aug 26, 2006 02:27 AM | Sr-55, 35 Street | 3 | 2
| 1 | 5 | - |
| 10 | Sep 9, 2006 02:58 AM | I-35w | 1 | - | 1
| 2 | - |
| 11 | Oct 2, 2006 07:48 PM | 271 | 1 | - | 1
| 2 | - |
| 12 | Jun 8, 2006 11:02 PM | M2008, Lake Street W. | 1 | 1
| 1 | 3 | 2 |
| 13 | Sep 9, 2006 03:00 AM | Sr-55, 26 Street E. | 2 | 1
| 1 | 6 | - |
| 14 | Sep 29, 2006 02:11 AM | 272 | 1 | - | 1
| 3 | - |
| 15 | Jul 15, 2006 02:06 AM | 52 | 1 | 1
| 1 | 1 | - |
Minneapolis fatal car crash and road traffic accident list for 2005
- Fatal accident count19
- Vehicles involved in fatal accidents30
- Fatal accidents involving drunk persons4
- Fatalities21
- Persons involved in fatal accidents43
- Pedestrians involved in fatal accidents9
Average EMS response time
- Minneapolis(Based on 10 reports) 6.5 mins
- Hennepin County(Based on 28 reports) 7.6 mins
- Minnesota(Based on 322 reports) 10.9 mins
Average hospital transport time
- Minneapolis(Based on 9 reports) 18.1 mins
- Hennepin County(Based on 18 reports) 19.8 mins
- Minnesota(Based on 206 reports) 36.6 mins
Daylight
- Minneapolis(Based on 19 reports) 63.2%
- Hennepin County(Based on 47 reports) 48.9%
- Minnesota(Based on 498 reports) 56.4%
Dark - Lighted
- Minneapolis(Based on 19 reports) 21.1%
- Hennepin County(Based on 47 reports) 31.9%
- Minnesota(Based on 498 reports) 11.0%
Dawn
- Minneapolis(Based on 19 reports) 10.5%
- Hennepin County(Based on 47 reports) 6.4%
- Minnesota(Based on 498 reports) 2.2%
Dark - Not Lighted
- Minneapolis(Based on 19 reports) 5.3%
- Hennepin County(Based on 47 reports) 12.8%
- Minnesota(Based on 498 reports) 28.9%
Clear
- Minneapolis(Based on 19 reports) 94.7%
- Hennepin County(Based on 47 reports) 95.7%
- Minnesota(Based on 500 reports) 87.6%
Snow
- Minneapolis(Based on 19 reports) 5.3%
- Hennepin County(Based on 47 reports) 2.1%
- Minnesota(Based on 500 reports) 5.0%
| # | Date | Location | Vehicles | Drunk persons | Fatalites | Persons | Pedestrians |
|---|
| 1 | Jan 3, 2005 05:00 AM | 5, Columbus Avenue | 1 | - | 1
| 2 | 1 |
| 2 | Feb 3, 2005 11:28 PM | I-35w | 1 | 1
| 1 | 1 | - |
| 3 | Apr 24, 2005 11:10 PM | 249, 35 | 3 | - | 3
| 4 | - |
| 4 | Apr 25, 2005 01:55 PM | M1398, 6th Street | 1 | - | 1
| 2 | 1 |
| 5 | May 30, 2005 04:59 PM | 152, Osseo | 2 | 1
| 1 | 4 | - |
| 6 | Jun 2, 2005 08:55 AM | 152, 28th Street | 2 | - | 1
| 2 | - |
| 7 | Jul 3, 2005 05:45 AM | 153 | 1 | 1
| 1 | 1 | - |
| 8 | Apr 20, 2005 09:43 AM | I-35w | 1 | - | 1
| 1 | - |
| 9 | Aug 16, 2005 01:34 PM | I-35w | 1 | - | 1
| 2 | 1 |
| 10 | Sep 2, 2005 04:50 PM | 213 | 1 | - | 1
| 3 | 2 |
| 11 | Sep 7, 2005 03:20 PM | 201, 43 Street | 1 | - | 1
| 2 | 1 |
| 12 | Dec 11, 2005 07:45 AM | 160, 28 Street | 2 | - | 1
| 2 | - |
| 13 | Nov 2, 2005 07:05 PM | I-35w | 1 | 1
| 1 | 1 | - |
| 14 | Dec 25, 2005 05:30 AM | 1686 | 1 | - | 1
| 2 | - |
| 15 | Dec 8, 2005 08:20 PM | M802 | 3 | - | 1
| 3 | 2 |
| 16 | Aug 29, 2005 02:05 PM | 370, Oak Grove Street | 2 | - | 1
| 3 | - |
| 17 | Oct 18, 2005 09:44 AM | 430, 36 Street | 1 | - | 1
| 2 | 1 |
| 18 | Oct 18, 2005 09:58 AM | 262, Washburn Ave. N. | 2 | - | 1
| 4 | - |
| 19 | Oct 29, 2005 01:03 PM | 190, 24 Street | 3 | - | 1
| 2 | - |
Minneapolis fatal car crash and road traffic accident list for 2004
- Fatal accident count17
- Vehicles involved in fatal accidents23
- Fatal accidents involving drunk persons7
- Fatalities17
- Persons involved in fatal accidents48
- Pedestrians involved in fatal accidents9
Average EMS response time
- Minneapolis(Based on 7 reports) 5.0 mins
- Hennepin County(Based on 23 reports) 6.3 mins
- Minnesota(Based on 347 reports) 10.2 mins
Average hospital transport time
- Minneapolis(Based on 6 reports) 18.7 mins
- Hennepin County(Based on 19 reports) 40.4 mins
- Minnesota(Based on 252 reports) 43.6 mins
Daylight
- Minneapolis(Based on 17 reports) 58.8%
- Hennepin County(Based on 48 reports) 60.4%
- Minnesota(Based on 517 reports) 58.6%
Dark - Lighted
- Minneapolis(Based on 17 reports) 23.5%
- Hennepin County(Based on 48 reports) 29.2%
- Minnesota(Based on 517 reports) 10.1%
Dark - Not Lighted
- Minneapolis(Based on 17 reports) 17.6%
- Hennepin County(Based on 48 reports) 8.3%
- Minnesota(Based on 517 reports) 25.5%
Clear
- Minneapolis(Based on 17 reports) 82.4%
- Hennepin County(Based on 48 reports) 83.3%
- Minnesota(Based on 520 reports) 84.8%
Rain
- Minneapolis(Based on 17 reports) 11.8%
- Hennepin County(Based on 48 reports) 8.3%
- Minnesota(Based on 520 reports) 5.8%
Cloudy
- Minneapolis(Based on 17 reports) 5.9%
- Hennepin County(Based on 48 reports) 4.2%
- Minnesota(Based on 520 reports) 1.2%
| # | Date | Location | Vehicles | Drunk persons | Fatalites | Persons | Pedestrians |
|---|
| 1 | Mar 27, 2004 02:20 PM | 31 | 1 | - | 1
| 1 | - |
| 2 | Apr 22, 2004 02:00 AM | Sr-55 | 1 | - | 1
| 2 | 1 |
| 3 | Jun 25, 2004 06:01 AM | I-94 | 1 | 1
| 1 | 1 | - |
| 4 | May 11, 2004 01:26 AM | Sr-62 | 1 | 1
| 1 | 1 | - |
| 5 | Jun 17, 2004 10:34 AM | 175, 41st Avenue | 2 | - | 1
| 2 | - |
| 6 | Jul 18, 2004 02:34 PM | 46, 46 | 2 | 2
| 1 | 4 | - |
| 7 | Jul 29, 2004 10:28 PM | 152 | 1 | 1
| 1 | 7 | 1 |
| 8 | Aug 1, 2004 10:10 PM | I-94 | 1 | 1
| 1 | 1 | - |
| 9 | Aug 6, 2004 03:49 PM | Sr-65 | 1 | - | 1
| 2 | - |
| 10 | Aug 15, 2004 01:06 AM | Sr-47, 23rd Avenue | 2 | - | 1
| 3 | - |
| 11 | Aug 22, 2004 12:17 AM | I-94 | 3 | - | 1
| 10 | 2 |
| 12 | Sep 11, 2004 10:45 AM | M305 | 1 | 1
| 1 | 2 | 1 |
| 13 | Sep 25, 2004 01:13 PM | 42 | 1 | - | 1
| 1 | - |
| 14 | Nov 15, 2004 05:48 PM | 153 | 2 | - | 1
| 4 | 1 |
| 15 | Nov 6, 2004 10:44 PM | 350, 4th Street N. | 1 | - | 1
| 5 | 3 |
| 16 | Nov 26, 2004 03:35 PM | 22 | 1 | - | 1
| 1 | - |
| 17 | Dec 24, 2004 03:40 PM | Sr-55, 42nd Street | 1 | - | 1
| 1 | - |
Minneapolis fatal car crash and road traffic accident list for 2003
- Fatal accident count23
- Vehicles involved in fatal accidents40
- Fatal accidents involving drunk persons10
- Fatalities25
- Persons involved in fatal accidents71
- Pedestrians involved in fatal accidents6
Average EMS response time
- Minneapolis(Based on 6 reports) 4.7 mins
- Hennepin County(Based on 23 reports) 8.4 mins
- Minnesota(Based on 370 reports) 11.5 mins
Average hospital transport time
- Minneapolis(Based on 4 reports) 21.5 mins
- Hennepin County(Based on 15 reports) 54.7 mins
- Minnesota(Based on 279 reports) 42.6 mins
Daylight
- Minneapolis(Based on 23 reports) 47.8%
- Hennepin County(Based on 57 reports) 47.4%
- Minnesota(Based on 577 reports) 50.6%
Dark - Lighted
- Minneapolis(Based on 23 reports) 47.8%
- Hennepin County(Based on 57 reports) 36.8%
- Minnesota(Based on 577 reports) 13.7%
Dark - Not Lighted
- Minneapolis(Based on 23 reports) 4.3%
- Hennepin County(Based on 57 reports) 12.3%
- Minnesota(Based on 577 reports) 31.9%
Clear
- Minneapolis(Based on 23 reports) 95.7%
- Hennepin County(Based on 57 reports) 94.7%
- Minnesota(Based on 583 reports) 85.4%
Rain
- Minneapolis(Based on 23 reports) 4.3%
- Hennepin County(Based on 57 reports) 1.8%
- Minnesota(Based on 583 reports) 2.9%
| # | Date | Location | Vehicles | Drunk persons | Fatalites | Persons | Pedestrians |
|---|
| 1 | Jan 1, 2003 09:05 AM | 165 | 2 | - | 1
| 2 | - |
| 2 | Jan 12, 2003 01:00 AM | 3 | 1 | - | 1
| 4 | - |
| 3 | Mar 2, 2003 04:43 AM | I-35w | 2 | 2
| 1 | 4 | - |
| 4 | Jan 31, 2003 10:59 AM | 247 | 1 | - | 1
| 2 | 1 |
| 5 | Apr 6, 2003 09:19 PM | Dean Court | 1 | 1
| 1 | 1 | - |
| 6 | May 20, 2003 00:27 AM | 239 | 2 | 1
| 1 | 7 | - |
| 7 | May 25, 2003 10:16 PM | 175 | 2 | 1
| 1 | 7 | - |
| 8 | Jun 16, 2003 11:05 AM | 5 | 1 | - | 1
| 2 | 1 |
| 9 | Jun 17, 2003 12:00 AM | Us-169 | 1 | - | 1
| 3 | 1 |
| 10 | Jun 23, 2003 07:34 PM | M44 | 1 | - | 1
| 2 | 1 |
| 11 | Jun 29, 2003 02:35 AM | I-94 | 1 | 1
| 1 | 2 | 1 |
| 12 | Jul 7, 2003 04:27 PM | M79 | 2 | - | 1
| 2 | - |
| 13 | Jul 11, 2003 05:43 PM | 241 | 3 | - | 1
| 3 | - |
| 14 | Jul 11, 2003 07:20 AM | I-35w | 7 | - | 1
| 8 | - |
| 15 | Jul 14, 2003 11:23 AM | 23 | 2 | - | 1
| 2 | - |
| 16 | Jul 24, 2003 02:15 AM | M898 | 1 | - | 2
| 2 | - |
| 17 | Jul 26, 2003 03:22 PM | I-35w | 1 | 1
| 1 | 1 | - |
| 18 | Aug 27, 2003 00:38 AM | I-94 | 1 | 1
| 1 | 2 | - |
| 19 | Sep 4, 2003 11:11 PM | 40 | 2 | 1
| 1 | 3 | - |
| 20 | Sep 30, 2003 01:42 AM | I-94 | 2 | 1
| 2 | 3 | - |
| 21 | Sep 19, 2003 04:40 PM | Parking Lot Aisle | 1 | - | 1
| 3 | 1 |
| 22 | Sep 12, 2003 00:43 AM | 283 | 2 | - | 1
| 2 | - |
| 23 | Apr 29, 2003 01:38 AM | I-35w | 1 | - | 1
| 4 | - |
Minneapolis fatal car crash and road traffic accident list for 2002
- Fatal accident count14
- Vehicles involved in fatal accidents16
- Fatal accidents involving drunk persons5
- Fatalities14
- Persons involved in fatal accidents30
- Pedestrians involved in fatal accidents7
Average EMS response time
- Minneapolis(Based on 11 reports) 5.5 mins
- Hennepin County(Based on 39 reports) 7.3 mins
- Minnesota(Based on 443 reports) 10.9 mins
Average hospital transport time
- Minneapolis(Based on 10 reports) 32.2 mins
- Hennepin County(Based on 30 reports) 46.8 mins
- Minnesota(Based on 318 reports) 43.3 mins
Daylight
- Minneapolis(Based on 14 reports) 57.1%
- Hennepin County(Based on 56 reports) 64.3%
- Minnesota(Based on 586 reports) 49.7%
Dark - Lighted
- Minneapolis(Based on 14 reports) 42.9%
- Hennepin County(Based on 56 reports) 25.0%
- Minnesota(Based on 586 reports) 11.1%
Clear
- Minneapolis(Based on 14 reports) 92.9%
- Hennepin County(Based on 56 reports) 91.1%
- Minnesota(Based on 590 reports) 86.4%
Rain
- Minneapolis(Based on 14 reports) 7.1%
- Hennepin County(Based on 56 reports) 3.6%
- Minnesota(Based on 590 reports) 3.6%
| # | Date | Location | Vehicles | Drunk persons | Fatalites | Persons | Pedestrians |
|---|
| 1 | Jan 5, 2002 02:04 AM | M1608 | 1 | 1
| 1 | 1 | - |
| 2 | May 16, 2002 08:40 AM | 153 | 1 | - | 1
| 2 | 1 |
| 3 | Jun 2, 2002 02:00 PM | 152 | 1 | - | 1
| 3 | 1 |
| 4 | Jun 7, 2002 01:06 PM | I-35w | 2 | - | 1
| 2 | - |
| 5 | Jun 15, 2002 03:52 AM | I-35w | 1 | 1
| 1 | 1 | - |
| 6 | Apr 6, 2002 02:25 PM | Shopping Center Road | 1 | - | 1
| 2 | 1 |
| 7 | May 11, 2002 08:11 PM | I-94 | 1 | 1
| 1 | 1 | - |
| 8 | Aug 9, 2002 04:25 PM | M1589 | 2 | - | 1
| 3 | - |
| 9 | Aug 23, 2002 09:00 PM | I-94 | 1 | 1
| 1 | 1 | - |
| 10 | Sep 10, 2002 01:30 AM | 213 | 1 | 1
| 1 | 2 | 1 |
| 11 | Sep 10, 2002 05:15 PM | 152 | 1 | - | 1
| 2 | 1 |
| 12 | Dec 5, 2002 02:03 PM | 430 | 1 | - | 1
| 7 | 1 |
| 13 | Dec 11, 2002 06:55 PM | 425 | 1 | - | 1
| 2 | 1 |
| 14 | Nov 29, 2002 01:21 PM | Sr-55 | 1 | - | 1
| 1 | - |
Minneapolis fatal car crash and road traffic accident list for 2001
- Fatal accident count22
- Vehicles involved in fatal accidents29
- Fatal accidents involving drunk persons6
- Fatalities23
- Persons involved in fatal accidents51
- Pedestrians involved in fatal accidents8
Average EMS response time
- Minneapolis(Based on 18 reports) 7.6 mins
- Hennepin County(Based on 48 reports) 7.5 mins
- Minnesota(Based on 396 reports) 10.4 mins
Average hospital transport time
- Minneapolis(Based on 17 reports) 19.4 mins
- Hennepin County(Based on 42 reports) 28.1 mins
- Minnesota(Based on 301 reports) 39.2 mins
Daylight
- Minneapolis(Based on 22 reports) 54.5%
- Hennepin County(Based on 63 reports) 50.8%
- Minnesota(Based on 500 reports) 53.2%
Dark - Lighted
- Minneapolis(Based on 22 reports) 40.9%
- Hennepin County(Based on 63 reports) 38.1%
- Minnesota(Based on 500 reports) 14.6%
Dawn
- Minneapolis(Based on 22 reports) 4.5%
- Hennepin County(Based on 63 reports) 1.6%
- Minnesota(Based on 500 reports) 2.6%
Clear
- Minneapolis(Based on 22 reports) 86.4%
- Hennepin County(Based on 63 reports) 85.7%
- Minnesota(Based on 508 reports) 83.7%
Rain
- Minneapolis(Based on 22 reports) 9.1%
- Hennepin County(Based on 63 reports) 6.3%
- Minnesota(Based on 508 reports) 5.3%
Cloudy
- Minneapolis(Based on 22 reports) 4.5%
- Hennepin County(Based on 63 reports) 1.6%
- Minnesota(Based on 508 reports) 2.0%
| # | Date | Location | Vehicles | Drunk persons | Fatalites | Persons | Pedestrians |
|---|
| 1 | Jan 6, 2001 06:00 PM | I-35w | 1 | - | 2
| 2 | - |
| 2 | Mar 14, 2001 09:51 AM | 283 | 1 | - | 1
| 2 | 1 |
| 3 | Mar 15, 2001 06:00 PM | 5 | 3 | 1
| 1 | 4 | - |
| 4 | May 25, 2001 08:18 PM | I-35w | 1 | 1
| 1 | 1 | - |
| 5 | May 6, 2001 08:20 PM | M1136 | 1 | - | 1
| 2 | 1 |
| 6 | Jul 21, 2001 00:30 AM | 122 | 1 | - | 1
| 1 | - |
| 7 | Mar 17, 2001 11:15 AM | 241 | 1 | 1
| 1 | 2 | - |
| 8 | Aug 7, 2001 02:57 AM | I-35w | 1 | 1
| 1 | 4 | - |
| 9 | Aug 12, 2001 02:28 AM | I-94 | 1 | 1
| 1 | 2 | - |
| 10 | Aug 13, 2001 06:27 PM | Sr-7 | 2 | - | 1
| 2 | - |
| 11 | Aug 14, 2001 07:37 AM | 36 | 1 | - | 1
| 2 | 1 |
| 12 | Sep 25, 2001 06:22 AM | 152 | 1 | - | 1
| 2 | 1 |
| 13 | Oct 8, 2001 12:07 AM | 27 | 1 | - | 1
| 1 | - |
| 14 | Oct 12, 2001 05:02 PM | 302 | 1 | - | 1
| 2 | 1 |
| 15 | Nov 6, 2001 08:52 AM | Sr-55 | 3 | - | 1
| 3 | - |
| 16 | Sep 15, 2001 03:19 PM | 366 | 2 | - | 1
| 6 | - |
| 17 | Sep 20, 2001 08:17 PM | 153 | 1 | - | 1
| 3 | 1 |
| 18 | Oct 11, 2001 10:23 AM | 5 | 1 | - | 1
| 2 | 1 |
| 19 | Oct 20, 2001 02:35 AM | 247 | 1 | 1
| 1 | 1 | - |
| 20 | Nov 9, 2001 08:02 AM | I-35w | 1 | - | 1
| 1 | - |
| 21 | Nov 9, 2001 09:50 AM | Sr-55 | 2 | - | 1
| 2 | - |
| 22 | Nov 21, 2001 11:56 AM | 167 | 1 | - | 1
| 4 | 1 |
Minneapolis fatal car crash and road traffic accident list for 2000
- Fatal accident count18
- Vehicles involved in fatal accidents28
- Fatal accidents involving drunk persons5
- Fatalities20
- Persons involved in fatal accidents56
- Pedestrians involved in fatal accidents4
Average EMS response time
- Minneapolis(Based on 17 reports) 5.9 mins
- Hennepin County(Based on 40 reports) 7.3 mins
- Minnesota(Based on 440 reports) 10.8 mins
Average hospital transport time
- Minneapolis(Based on 10 reports) 19.3 mins
- Hennepin County(Based on 29 reports) 33.5 mins
- Minnesota(Based on 328 reports) 38.2 mins
Dark - Lighted
- Minneapolis(Based on 18 reports) 50.0%
- Hennepin County(Based on 47 reports) 40.4%
- Minnesota(Based on 555 reports) 12.1%
Daylight
- Minneapolis(Based on 18 reports) 44.4%
- Hennepin County(Based on 47 reports) 44.7%
- Minnesota(Based on 555 reports) 53.9%
Dawn
- Minneapolis(Based on 18 reports) 5.6%
- Hennepin County(Based on 47 reports) 4.3%
- Minnesota(Based on 555 reports) 3.2%
Clear
- Minneapolis(Based on 18 reports) 83.3%
- Hennepin County(Based on 47 reports) 85.1%
- Minnesota(Based on 557 reports) 83.7%
Rain
- Minneapolis(Based on 18 reports) 16.7%
- Hennepin County(Based on 47 reports) 8.5%
- Minnesota(Based on 557 reports) 5.2%
| # | Date | Location | Vehicles | Drunk persons | Fatalites | Persons | Pedestrians |
|---|
| 1 | Feb 11, 2000 11:50 PM | 253 | 2 | 1
| 2 | 6 | - |
| 2 | Feb 23, 2000 12:27 AM | 350 | 1 | - | 1
| 2 | 1 |
| 3 | Feb 27, 2000 03:24 AM | I-35w | 1 | - | 1
| 6 | - |
| 4 | Mar 22, 2000 05:33 AM | 321 | 1 | - | 1
| 2 | 1 |
| 5 | May 18, 2000 02:19 PM | 312 | 1 | - | 1
| 2 | - |
| 6 | Mar 6, 2000 01:20 AM | 37 | 1 | - | 1
| 2 | - |
| 7 | Apr 14, 2000 08:16 AM | Sr-55 | 3 | - | 1
| 3 | - |
| 8 | Jul 13, 2000 08:47 AM | M1606 | 1 | - | 1
| 1 | - |
| 9 | Jul 25, 2000 08:50 PM | 251 | 2 | 1
| 1 | 3 | - |
| 10 | Aug 10, 2000 07:30 PM | Sr-47 | 2 | 1
| 2 | 3 | - |
| 11 | Aug 12, 2000 02:49 PM | 253 | 1 | - | 1
| 1 | - |
| 12 | Aug 22, 2000 11:38 PM | 46 | 2 | 1
| 1 | 3 | - |
| 13 | Sep 4, 2000 11:00 AM | I-94 | 1 | - | 1
| 1 | - |
| 14 | Sep 5, 2000 08:05 AM | 320 | 1 | - | 1
| 2 | 1 |
| 15 | Sep 30, 2000 00:40 AM | I-94 | 4 | 1
| 1 | 8 | - |
| 16 | Oct 26, 2000 12:43 AM | 40 | 1 | - | 1
| 4 | 1 |
| 17 | Nov 11, 2000 05:32 AM | I-94 | 1 | - | 1
| 3 | - |
| 18 | Nov 11, 2000 00:58 AM | 152 | 2 | - | 1
| 4 | - |
Minneapolis fatal car crash and road traffic accident list for 1999
- Fatal accident count13
- Vehicles involved in fatal accidents16
- Fatal accidents involving drunk persons3
- Fatalities14
- Persons involved in fatal accidents28
- Pedestrians involved in fatal accidents7
Average EMS response time
- Minneapolis(Based on 11 reports) 5.6 mins
- Hennepin County(Based on 29 reports) 7.2 mins
- Minnesota(Based on 419 reports) 10.8 mins
Average hospital transport time
- Minneapolis(Based on 7 reports) 15.0 mins
- Hennepin County(Based on 22 reports) 22.6 mins
- Minnesota(Based on 318 reports) 38.7 mins
Dark - Lighted
- Minneapolis(Based on 13 reports) 61.5%
- Hennepin County(Based on 39 reports) 41.0%
- Minnesota(Based on 563 reports) 10.7%
Daylight
- Minneapolis(Based on 13 reports) 30.8%
- Hennepin County(Based on 39 reports) 48.7%
- Minnesota(Based on 563 reports) 57.0%
Dark - Not Lighted
- Minneapolis(Based on 13 reports) 7.7%
- Hennepin County(Based on 39 reports) 7.7%
- Minnesota(Based on 563 reports) 25.9%
Clear
- Minneapolis(Based on 13 reports) 92.3%
- Hennepin County(Based on 39 reports) 89.7%
- Minnesota(Based on 567 reports) 86.6%
Rain
- Minneapolis(Based on 13 reports) 7.7%
- Hennepin County(Based on 39 reports) 5.1%
- Minnesota(Based on 567 reports) 4.9%
| # | Date | Location | Vehicles | Drunk persons | Fatalites | Persons | Pedestrians |
|---|
| 1 | Feb 14, 1999 00:27 AM | 152 | 1 | - | 1
| 1 | - |
| 2 | Mar 16, 1999 03:16 PM | I-94 | 1 | 1
| 1 | 1 | - |
| 3 | Mar 18, 1999 07:03 PM | 189 | 2 | - | 1
| 4 | - |
| 4 | Apr 2, 1999 00:22 AM | I-94 | 1 | - | 1
| 2 | 1 |
| 5 | May 2, 1999 00:15 AM | 165 | 1 | - | 1
| 2 | 1 |
| 6 | May 14, 1999 01:12 PM | 313 | 1 | - | 1
| 2 | 1 |
| 7 | Jun 16, 1999 10:41 PM | I-394 | 1 | - | 1
| 1 | - |
| 8 | Jul 12, 1999 02:15 PM | 189 | 1 | - | 1
| 2 | 1 |
| 9 | Aug 10, 1999 03:15 PM | Sr-56 | 2 | - | 1
| 3 | - |
| 10 | Sep 29, 1999 06:15 AM | Sr-55 | 1 | - | 1
| 2 | 1 |
| 11 | Dec 9, 1999 10:20 PM | 22 | 1 | - | 1
| 3 | 1 |
| 12 | Nov 23, 1999 02:40 AM | I-394 | 1 | - | 1
| 2 | 1 |
| 13 | Nov 9, 1999 00:58 AM | 251 | 2 | 2
| 2 | 3 | - |
Minneapolis fatal car crash and road traffic accident list for 1998
- Fatal accident count20
- Vehicles involved in fatal accidents32
- Fatal accidents involving drunk persons6
- Fatalities24
- Persons involved in fatal accidents66
- Pedestrians involved in fatal accidents24
Average EMS response time
- Minneapolis(Based on 18 reports) 5.3 mins
- Hennepin County(Based on 53 reports) 6.7 mins
- Minnesota(Based on 473 reports) 10.4 mins
Average hospital transport time
- Minneapolis(Based on 16 reports) 15.4 mins
- Hennepin County(Based on 46 reports) 23.6 mins
- Minnesota(Based on 377 reports) 35.6 mins
Dark - Lighted
- Minneapolis(Based on 20 reports) 50.0%
- Hennepin County(Based on 62 reports) 29.0%
- Minnesota(Based on 571 reports) 12.3%
Daylight
- Minneapolis(Based on 20 reports) 45.0%
- Hennepin County(Based on 62 reports) 61.3%
- Minnesota(Based on 571 reports) 52.9%
Dusk
- Minneapolis(Based on 20 reports) 5.0%
- Hennepin County(Based on 62 reports) 1.6%
- Minnesota(Based on 571 reports) 3.2%
Clear
- Minneapolis(Based on 20 reports) 95.0%
- Hennepin County(Based on 62 reports) 93.5%
- Minnesota(Based on 575 reports) 86.4%
Rain
- Minneapolis(Based on 20 reports) 5.0%
- Hennepin County(Based on 62 reports) 3.2%
- Minnesota(Based on 575 reports) 3.7%
| # | Date | Location | Vehicles | Drunk persons | Fatalites | Persons | Pedestrians |
|---|
| 1 | Feb 13, 1998 04:30 PM | 33 | 1 | - | 1
| 3 | 1 |
| 2 | Mar 28, 1998 06:52 PM | Hiawatha Lane | 1 | 1
| 1 | 2 | 1 |
| 3 | May 23, 1998 09:20 AM | 430 | 2 | - | 1
| 3 | - |
| 4 | May 28, 1998 00:10 AM | I-35w | 2 | 1
| 1 | 2 | - |
| 5 | Jul 2, 1998 01:55 PM | 160 | 5 | - | 2
| 6 | - |
| 6 | Aug 24, 1998 00:30 AM | I-94 | 2 | 1
| 2 | 4 | 1 |
| 7 | Sep 4, 1998 06:00 AM | 23 | 3 | - | 1
| 3 | - |
| 8 | Sep 4, 1998 02:41 AM | I-35w | 1 | 1
| 1 | 1 | - |
| 9 | Sep 27, 1998 11:11 PM | I-94 | 1 | - | 1
| 1 | - |
| 10 | Dec 4, 1998 06:15 PM | M1900 | 1 | - | 2
| 15 | 13 |
| 11 | Sep 20, 1998 10:25 AM | 3 | 1 | - | 1
| 3 | 2 |
| 12 | Sep 25, 1998 11:12 AM | 237 | 2 | - | 1
| 2 | - |
| 13 | Sep 14, 1998 10:20 PM | Sr-55 | 1 | - | 1
| 3 | 1 |
| 14 | May 26, 1998 04:33 PM | 35 | 1 | - | 1
| 3 | 1 |
| 15 | Oct 23, 1998 05:14 PM | Sr-65 | 1 | - | 1
| 2 | 1 |
| 16 | Nov 3, 1998 08:03 PM | 296 | 1 | - | 1
| 2 | 1 |
| 17 | Nov 27, 1998 00:39 AM | 250 | 2 | - | 2
| 4 | - |
| 18 | Nov 28, 1998 02:24 AM | 226 | 2 | 1
| 1 | 2 | - |
| 19 | Dec 1, 1998 08:25 AM | 289 | 1 | - | 1
| 3 | 1 |
| 20 | Dec 11, 1998 01:11 AM | M941 | 1 | 1
| 1 | 2 | 1 |
Minneapolis fatal car crash and road traffic accident list for 1997
- Fatal accident count23
- Vehicles involved in fatal accidents31
- Fatal accidents involving drunk persons6
- Fatalities23
- Persons involved in fatal accidents56
- Pedestrians involved in fatal accidents13
Average EMS response time
- Minneapolis(Based on 17 reports) 12.9 mins
- Hennepin County(Based on 40 reports) 9.8 mins
- Minnesota(Based on 390 reports) 11.7 mins
Average hospital transport time
- Minneapolis(Based on 15 reports) 21.2 mins
- Hennepin County(Based on 33 reports) 26.6 mins
- Minnesota(Based on 295 reports) 35.7 mins
Daylight
- Minneapolis(Based on 23 reports) 56.5%
- Hennepin County(Based on 58 reports) 51.7%
- Minnesota(Based on 522 reports) 56.3%
Dark - Lighted
- Minneapolis(Based on 23 reports) 30.4%
- Hennepin County(Based on 58 reports) 29.3%
- Minnesota(Based on 522 reports) 10.7%
Dusk
- Minneapolis(Based on 23 reports) 8.7%
- Hennepin County(Based on 58 reports) 6.9%
- Minnesota(Based on 522 reports) 4.4%
Dark - Not Lighted
- Minneapolis(Based on 23 reports) 4.3%
- Hennepin County(Based on 58 reports) 10.3%
- Minnesota(Based on 522 reports) 26.2%
Clear
- Minneapolis(Based on 23 reports) 87.0%
- Hennepin County(Based on 58 reports) 93.1%
- Minnesota(Based on 528 reports) 82.4%
Snow
- Minneapolis(Based on 23 reports) 4.3%
- Hennepin County(Based on 58 reports) 3.4%
- Minnesota(Based on 528 reports) 7.4%
Rain
- Minneapolis(Based on 23 reports) 4.3%
- Hennepin County(Based on 58 reports) 1.7%
- Minnesota(Based on 528 reports) 3.6%
Sleet or Hail
- Minneapolis(Based on 23 reports) 4.3%
- Hennepin County(Based on 58 reports) 1.7%
- Minnesota(Based on 528 reports) 2.1%
| # | Date | Location | Vehicles | Drunk persons | Fatalites | Persons | Pedestrians |
|---|
| 1 | Jan 31, 1997 00:32 AM | 5 | 1 | 1
| 1 | 1 | - |
| 2 | Feb 12, 1997 03:51 AM | M1222 | 1 | 1
| 1 | 1 | - |
| 3 | Mar 21, 1997 11:39 AM | 55 | 3 | - | 1
| 4 | - |
| 4 | Apr 13, 1997 07:35 PM | 6 | 1 | - | 1
| 2 | 1 |
| 5 | May 2, 1997 12:05 AM | 218 | 2 | - | 1
| 2 | - |
| 6 | Jun 18, 1997 08:04 PM | 52 | 1 | - | 1
| 2 | 1 |
| 7 | Jun 5, 1997 05:10 PM | M644 | 1 | - | 1
| 2 | 1 |
| 8 | Aug 7, 1997 11:00 PM | I394 | 1 | - | 1
| 2 | 1 |
| 9 | Aug 15, 1997 05:51 PM | 65 | 2 | 1
| 1 | 3 | - |
| 10 | Aug 23, 1997 02:22 PM | 2 | 1 | - | 1
| 2 | 1 |
| 11 | Sep 2, 1997 02:29 PM | 22 | 1 | - | 1
| 2 | 1 |
| 12 | Sep 2, 1997 12:50 AM | 158 | 2 | - | 1
| 3 | - |
| 13 | Sep 16, 1997 04:17 PM | 3 | 1 | - | 1
| 1 | - |
| 14 | Sep 21, 1997 12:21 AM | 342 | 1 | - | 1
| 4 | 1 |
| 15 | Sep 27, 1997 00:01 AM | 152 | 1 | - | 1
| 2 | 1 |
| 16 | Oct 5, 1997 06:40 PM | 163 | 2 | 1
| 1 | 4 | - |
| 17 | Oct 12, 1997 03:57 AM | 952a | 1 | - | 1
| 2 | 1 |
| 18 | Oct 18, 1997 07:50 PM | 25 | 1 | - | 1
| 5 | 1 |
| 19 | Oct 17, 1997 08:34 AM | 313 | 1 | - | 1
| 2 | 1 |
| 20 | Oct 24, 1997 11:10 PM | 211 | 2 | 2
| 1 | 3 | - |
| 21 | Oct 23, 1997 06:41 PM | 124 | 2 | - | 1
| 2 | - |
| 22 | Nov 2, 1997 07:33 AM | I35w | 1 | - | 1
| 3 | 1 |
| 23 | Aug 26, 1997 04:37 PM | M1355 | 1 | - | 1
| 2 | 1 |
Minneapolis fatal car crash and road traffic accident list for 1996
- Fatal accident count12
- Vehicles involved in fatal accidents16
- Fatal accidents involving drunk persons6
- Fatalities14
- Persons involved in fatal accidents25
- Pedestrians involved in fatal accidents1
Average EMS response time
- Minneapolis(Based on 9 reports) 6.8 mins
- Hennepin County(Based on 35 reports) 7.8 mins
- Minnesota(Based on 420 reports) 10.4 mins
Average hospital transport time
- Minneapolis(Based on 10 reports) 18.9 mins
- Hennepin County(Based on 27 reports) 25.1 mins
- Minnesota(Based on 305 reports) 38.3 mins
Daylight
- Minneapolis(Based on 12 reports) 58.3%
- Hennepin County(Based on 47 reports) 63.8%
- Minnesota(Based on 502 reports) 54.2%
Dark - Lighted
- Minneapolis(Based on 12 reports) 33.3%
- Hennepin County(Based on 47 reports) 23.4%
- Minnesota(Based on 502 reports) 11.2%
Dusk
- Minneapolis(Based on 12 reports) 8.3%
- Hennepin County(Based on 47 reports) 6.4%
- Minnesota(Based on 502 reports) 3.6%
Clear
- Minneapolis(Based on 12 reports) 83.3%
- Hennepin County(Based on 47 reports) 93.6%
- Minnesota(Based on 503 reports) 82.7%
Rain
- Minneapolis(Based on 12 reports) 8.3%
- Hennepin County(Based on 47 reports) 4.3%
- Minnesota(Based on 503 reports) 5.0%
Snow
- Minneapolis(Based on 12 reports) 8.3%
- Hennepin County(Based on 47 reports) 2.1%
- Minnesota(Based on 503 reports) 8.2%
| # | Date | Location | Vehicles | Drunk persons | Fatalites | Persons | Pedestrians |
|---|
| 1 | Feb 1, 1996 09:42 PM | 65 | 1 | 1
| 1 | 1 | - |
| 2 | Mar 4, 1996 10:55 AM | 46 | 1 | - | 1
| 2 | - |
| 3 | Mar 11, 1996 02:03 AM | I94 | 2 | 1
| 1 | 3 | - |
| 4 | Apr 6, 1996 02:45 AM | 152 | 1 | 1
| 1 | 1 | - |
| 5 | Apr 8, 1996 04:10 PM | M244 | 1 | - | 1
| 2 | - |
| 6 | May 2, 1996 05:45 PM | 22 | 3 | - | 1
| 3 | - |
| 7 | May 8, 1996 04:05 PM | 240 | 1 | - | 1
| 3 | - |
| 8 | May 9, 1996 12:30 AM | 302 | 1 | - | 1
| 2 | 1 |
| 9 | Aug 4, 1996 06:12 PM | I35w | 1 | 1
| 1 | 1 | - |
| 10 | Aug 11, 1996 03:47 PM | I94 | 2 | - | 1
| 3 | - |
| 11 | Sep 14, 1996 05:07 PM | I35w | 1 | 1
| 2 | 2 | - |
| 12 | Oct 21, 1996 00:23 AM | M701 | 1 | 1
| 2 | 2 | - |
Minneapolis fatal car crash and road traffic accident list for 1995
- Fatal accident count12
- Vehicles involved in fatal accidents19
- Fatal accidents involving drunk persons6
- Fatalities15
- Persons involved in fatal accidents35
- Pedestrians involved in fatal accidents4
Average EMS response time
- Minneapolis(Based on 9 reports) 7.1 mins
- Hennepin County(Based on 34 reports) 8.5 mins
- Minnesota(Based on 416 reports) 9.9 mins
Average hospital transport time
- Minneapolis(Based on 6 reports) 22.2 mins
- Hennepin County(Based on 24 reports) 32.0 mins
- Minnesota(Based on 300 reports) 37.6 mins
Dark - Lighted
- Minneapolis(Based on 12 reports) 75.0%
- Hennepin County(Based on 48 reports) 37.5%
- Minnesota(Based on 508 reports) 13.2%
Daylight
- Minneapolis(Based on 12 reports) 16.7%
- Hennepin County(Based on 48 reports) 47.9%
- Minnesota(Based on 508 reports) 52.2%
Dusk
- Minneapolis(Based on 12 reports) 8.3%
- Hennepin County(Based on 48 reports) 2.1%
- Minnesota(Based on 508 reports) 5.5%
Clear
- Minneapolis(Based on 12 reports) 83.3%
- Hennepin County(Based on 48 reports) 87.5%
- Minnesota(Based on 515 reports) 79.2%
Snow
- Minneapolis(Based on 12 reports) 8.3%
- Hennepin County(Based on 48 reports) 6.3%
- Minnesota(Based on 515 reports) 7.2%
Sleet or Hail
- Minneapolis(Based on 12 reports) 8.3%
- Hennepin County(Based on 48 reports) 2.1%
- Minnesota(Based on 515 reports) 2.3%
| # | Date | Location | Vehicles | Drunk persons | Fatalites | Persons | Pedestrians |
|---|
| 1 | Jan 22, 1995 00:20 AM | I94 | 1 | 1
| 1 | 1 | - |
| 2 | Feb 11, 1995 08:17 PM | 190 | 4 | - | 1
| 7 | - |
| 3 | Mar 25, 1995 04:31 AM | 249 | 2 | 2
| 3 | 5 | - |
| 4 | May 20, 1995 00:35 AM | 47 | 1 | 1
| 1 | 1 | - |
| 5 | Jun 2, 1995 11:09 PM | 5 | 1 | - | 1
| 2 | 1 |
| 6 | Jun 18, 1995 09:24 PM | I35w | 2 | 1
| 1 | 3 | - |
| 7 | Jun 5, 1995 08:17 PM | M26 | 1 | 1
| 2 | 2 | - |
| 8 | Aug 11, 1995 02:06 PM | 213 | 2 | - | 1
| 7 | - |
| 9 | Sep 22, 1995 04:57 AM | 952b | 1 | - | 1
| 1 | - |
| 10 | Sep 22, 1995 05:32 AM | 952a | 2 | - | 1
| 2 | 1 |
| 11 | Oct 13, 1995 06:00 AM | 47 | 1 | - | 1
| 2 | 1 |
| 12 | Nov 21, 1995 07:53 PM | 47 | 1 | - | 1
| 2 | 1 |
Minneapolis fatal car crash and road traffic accident list for 1994
- Fatal accident count25
- Vehicles involved in fatal accidents35
- Fatal accidents involving drunk persons6
- Fatalities26
- Persons involved in fatal accidents53
- Pedestrians involved in fatal accidents10
Average EMS response time
- Minneapolis(Based on 13 reports) 5.1 mins
- Hennepin County(Based on 32 reports) 6.4 mins
- Minnesota(Based on 329 reports) 10.5 mins
Average hospital transport time
- Minneapolis(Based on 10 reports) 12.2 mins
- Hennepin County(Based on 23 reports) 28.7 mins
- Minnesota(Based on 224 reports) 31.6 mins
Daylight
- Minneapolis(Based on 25 reports) 52.0%
- Hennepin County(Based on 59 reports) 57.6%
- Minnesota(Based on 549 reports) 56.8%
Dark - Lighted
- Minneapolis(Based on 25 reports) 32.0%
- Hennepin County(Based on 59 reports) 25.4%
- Minnesota(Based on 549 reports) 9.1%
Dusk
- Minneapolis(Based on 25 reports) 8.0%
- Hennepin County(Based on 59 reports) 5.1%
- Minnesota(Based on 549 reports) 2.4%
Dark - Not Lighted
- Minneapolis(Based on 25 reports) 8.0%
- Hennepin County(Based on 59 reports) 10.2%
- Minnesota(Based on 549 reports) 29.5%
Clear
- Minneapolis(Based on 25 reports) 88.0%
- Hennepin County(Based on 59 reports) 91.5%
- Minnesota(Based on 552 reports) 85.1%
Rain
- Minneapolis(Based on 25 reports) 12.0%
- Hennepin County(Based on 59 reports) 6.8%
- Minnesota(Based on 552 reports) 4.5%
| # | Date | Location | Vehicles | Drunk persons | Fatalites | Persons | Pedestrians |
|---|
| 1 | Jan 7, 1994 07:24 PM | 57 | 1 | - | 1
| 2 | 1 |
| 2 | Jan 11, 1994 12:07 AM | M1355 | 1 | - | 1
| 1 | - |
| 3 | Feb 4, 1994 08:30 AM | 221 | 2 | - | 1
| 3 | - |
| 4 | Feb 14, 1994 12:13 AM | 348 | 1 | - | 1
| 2 | 1 |
| 5 | Apr 16, 1994 03:50 PM | 952a | 1 | - | 1
| 1 | - |
| 6 | Mar 26, 1994 05:33 PM | M176 | 1 | - | 1
| 2 | 1 |
| 7 | Apr 16, 1994 04:15 PM | I35w | 1 | - | 1
| 1 | - |
| 8 | Apr 21, 1994 07:47 PM | I94 | 1 | - | 1
| 1 | - |
| 9 | May 7, 1994 01:30 AM | 35 | 2 | 1
| 1 | 4 | - |
| 10 | May 24, 1994 09:50 PM | 2 | 1 | - | 1
| 2 | 1 |
| 11 | May 28, 1994 08:32 PM | M2039 | 1 | - | 1
| 2 | 1 |
| 12 | Jun 3, 1994 07:15 AM | 20 | 2 | - | 1
| 2 | - |
| 13 | Jun 17, 1994 01:08 PM | 55 | 1 | - | 1
| 2 | 1 |
| 14 | Jun 26, 1994 05:20 PM | 52 | 1 | - | 1
| 2 | 1 |
| 15 | Jun 26, 1994 05:42 PM | 241 | 2 | 1
| 1 | 5 | - |
| 16 | Aug 11, 1994 10:30 PM | I94 | 2 | 1
| 2 | 3 | - |
| 17 | Aug 15, 1994 07:35 PM | 2 | 1 | 1
| 1 | 1 | - |
| 18 | Aug 31, 1994 10:03 AM | 215 | 1 | - | 1
| 1 | - |
| 19 | Sep 22, 1994 02:23 AM | 289 | 1 | - | 1
| 2 | 1 |
| 20 | Sep 29, 1994 09:32 PM | 47 | 2 | 1
| 1 | 2 | - |
| 21 | Oct 4, 1994 06:20 PM | 21 | 3 | - | 1
| 4 | - |
| 22 | Nov 17, 1994 10:25 AM | 260 | 1 | - | 1
| 1 | - |
| 23 | Dec 2, 1994 05:13 PM | 152 | 1 | - | 1
| 2 | 1 |
| 24 | Dec 25, 1994 01:22 AM | I35w | 2 | 1
| 1 | 2 | - |
| 25 | May 15, 1994 11:25 PM | 4 | 2 | - | 1
| 3 | 1 |
Minneapolis fatal car crash and road traffic accident list for 1993
- Fatal accident count26
- Vehicles involved in fatal accidents38
- Fatal accidents involving drunk persons8
- Fatalities26
- Persons involved in fatal accidents73
- Pedestrians involved in fatal accidents12
Average EMS response time
- Minneapolis(Based on 21 reports) 4.9 mins
- Hennepin County(Based on 43 reports) 6.0 mins
- Minnesota(Based on 381 reports) 9.7 mins
Average hospital transport time
- Minneapolis(Based on 14 reports) 14.9 mins
- Hennepin County(Based on 31 reports) 31.1 mins
- Minnesota(Based on 291 reports) 34.4 mins
Dark - Lighted
- Minneapolis(Based on 26 reports) 46.2%
- Hennepin County(Based on 59 reports) 32.2%
- Minnesota(Based on 476 reports) 9.9%
Daylight
- Minneapolis(Based on 26 reports) 42.3%
- Hennepin County(Based on 59 reports) 50.8%
- Minnesota(Based on 476 reports) 51.7%
Dusk
- Minneapolis(Based on 26 reports) 7.7%
- Hennepin County(Based on 59 reports) 6.8%
- Minnesota(Based on 476 reports) 2.9%
Dawn
- Minneapolis(Based on 26 reports) 3.8%
- Hennepin County(Based on 59 reports) 1.7%
- Minnesota(Based on 476 reports) 1.5%
Clear
- Minneapolis(Based on 26 reports) 88.5%
- Hennepin County(Based on 59 reports) 79.7%
- Minnesota(Based on 477 reports) 78.4%
Rain
- Minneapolis(Based on 26 reports) 7.7%
- Hennepin County(Based on 59 reports) 6.8%
- Minnesota(Based on 477 reports) 6.7%
Sleet or Hail
- Minneapolis(Based on 26 reports) 3.8%
- Hennepin County(Based on 59 reports) 5.1%
- Minnesota(Based on 477 reports) 2.1%
| # | Date | Location | Vehicles | Drunk persons | Fatalites | Persons | Pedestrians |
|---|
| 1 | Jan 3, 1993 01:30 AM | 26 | 1 | 1
| 1 | 1 | - |
| 2 | Jan 6, 1993 08:25 PM | M1141 | 2 | - | 1
| 3 | - |
| 3 | Jan 24, 1993 08:51 AM | 81 | 1 | - | 1
| 2 | 1 |
| 4 | Apr 22, 1993 06:45 AM | 335 | 1 | - | 1
| 2 | 1 |
| 5 | Apr 25, 1993 03:28 PM | 57 | 1 | - | 1
| 2 | 1 |
| 6 | Feb 26, 1993 04:55 PM | 3 | 2 | - | 1
| 7 | 1 |
| 7 | Mar 30, 1993 10:53 PM | 35 | 2 | - | 1
| 3 | - |
| 8 | May 4, 1993 09:02 PM | 2 | 2 | - | 1
| 4 | - |
| 9 | Jun 2, 1993 11:35 AM | 3 | 1 | - | 1
| 2 | 1 |
| 10 | Jun 27, 1993 03:43 PM | M598 | 1 | - | 1
| 2 | 1 |
| 11 | Jul 3, 1993 00:45 AM | I94 | 1 | 1
| 1 | 2 | 1 |
| 12 | Jul 10, 1993 01:25 AM | M700 | 2 | 2
| 1 | 3 | - |
| 13 | Jul 14, 1993 02:15 AM | I94 | 1 | 1
| 1 | 2 | - |
| 14 | Jun 27, 1993 10:25 AM | I35w | 1 | - | 1
| 5 | - |
| 15 | Jul 28, 1993 00:55 AM | 260 | 1 | 1
| 1 | 1 | - |
| 16 | Aug 19, 1993 04:20 PM | M1900 | 1 | - | 1
| 2 | 1 |
| 17 | Sep 6, 1993 07:00 PM | 277 | 2 | - | 1
| 2 | - |
| 18 | Oct 1, 1993 12:20 AM | 178 | 1 | - | 1
| 2 | 1 |
| 19 | Nov 9, 1993 06:32 PM | I94 | 3 | - | 1
| 5 | - |
| 20 | Nov 10, 1993 06:29 AM | 33 | 2 | 1
| 1 | 4 | - |
| 21 | Nov 29, 1993 05:10 PM | 55 | 1 | - | 1
| 2 | 1 |
| 22 | Dec 4, 1993 06:03 PM | 55 | 1 | - | 1
| 2 | 1 |
| 23 | Dec 10, 1993 06:26 AM | I35w | 1 | - | 1
| 2 | 1 |
| 24 | Dec 31, 1993 10:45 AM | 35 | 2 | - | 1
| 6 | - |
| 25 | Dec 11, 1993 09:14 PM | I94 | 1 | - | 1
| 1 | - |
| 26 | Oct 12, 1993 02:12 PM | 35 | 3 | 1
| 1 | 4 | - |
Minneapolis fatal car crash and road traffic accident list for 1992
- Fatal accident count23
- Vehicles involved in fatal accidents34
- Fatal accidents involving drunk persons9
- Fatalities26
- Persons involved in fatal accidents60
- Pedestrians involved in fatal accidents8
Average EMS response time
- Minneapolis(Based on 14 reports) 5.3 mins
- Hennepin County(Based on 34 reports) 6.7 mins
- Minnesota(Based on 383 reports) 10.0 mins
Average hospital transport time
- Minneapolis(Based on 11 reports) 35.4 mins
- Hennepin County(Based on 26 reports) 33.6 mins
- Minnesota(Based on 293 reports) 32.4 mins
Daylight
- Minneapolis(Based on 23 reports) 56.5%
- Hennepin County(Based on 50 reports) 54.0%
- Minnesota(Based on 493 reports) 49.7%
Dark - Lighted
- Minneapolis(Based on 23 reports) 43.5%
- Hennepin County(Based on 50 reports) 28.0%
- Minnesota(Based on 493 reports) 10.5%
Clear
- Minneapolis(Based on 23 reports) 87.0%
- Hennepin County(Based on 50 reports) 90.0%
- Minnesota(Based on 494 reports) 82.0%
Rain
- Minneapolis(Based on 23 reports) 8.7%
- Hennepin County(Based on 50 reports) 6.0%
- Minnesota(Based on 494 reports) 5.7%
Sleet or Hail
- Minneapolis(Based on 23 reports) 4.3%
- Hennepin County(Based on 50 reports) 4.0%
- Minnesota(Based on 494 reports) 2.8%
| # | Date | Location | Vehicles | Drunk persons | Fatalites | Persons | Pedestrians |
|---|
| 1 | Jan 24, 1992 01:02 PM | 54 | 2 | 1
| 1 | 4 | - |
| 2 | Jan 31, 1992 09:35 PM | I94 | 2 | 1
| 1 | 2 | - |
| 3 | Feb 23, 1992 10:29 PM | I94 | 1 | - | 1
| 3 | 1 |
| 4 | Mar 11, 1992 04:32 PM | 55 | 1 | - | 1
| 2 | 1 |
| 5 | Mar 14, 1992 07:09 AM | I35w | 1 | - | 1
| 2 | - |
| 6 | Mar 12, 1992 09:25 AM | I394 | 2 | - | 1
| 2 | - |
| 7 | Apr 20, 1992 03:23 PM | 2 | 1 | - | 1
| 1 | - |
| 8 | Jul 8, 1992 06:25 PM | M1347 | 1 | - | 1
| 2 | 1 |
| 9 | Jul 30, 1992 08:15 PM | 197 | 2 | 1
| 1 | 2 | - |
| 10 | Jul 9, 1992 09:45 AM | 305 | 2 | - | 1
| 3 | - |
| 11 | Aug 28, 1992 01:48 PM | 47 | 2 | - | 1
| 4 | - |
| 12 | Sep 9, 1992 02:00 AM | I94 | 1 | 1
| 1 | 1 | - |
| 13 | Sep 6, 1992 10:30 PM | M701 | 1 | - | 2
| 2 | - |
| 14 | Sep 16, 1992 03:56 PM | 5 | 1 | - | 1
| 2 | 1 |
| 15 | Jul 17, 1992 00:02 AM | 348 | 1 | - | 1
| 2 | 1 |
| 16 | Oct 3, 1992 06:38 PM | M885 | 2 | 1
| 1 | 3 | - |
| 17 | Oct 10, 1992 10:06 PM | M843 | 1 | 1
| 1 | 2 | - |
| 18 | Oct 22, 1992 09:02 AM | 5 | 2 | - | 1
| 2 | - |
| 19 | Nov 13, 1992 05:18 PM | 48 | 1 | - | 1
| 2 | 1 |
| 20 | Nov 26, 1992 07:33 PM | 249 | 2 | 1
| 2 | 3 | - |
| 21 | Dec 23, 1992 11:56 PM | I94 | 2 | - | 2
| 5 | - |
| 22 | Nov 11, 1992 11:45 AM | 65 | 2 | 1
| 1 | 6 | - |
| 23 | Aug 19, 1992 00:52 AM | 160 | 1 | 1
| 1 | 3 | 2 |
Minneapolis fatal car crash and road traffic accident list for 1991
- Fatal accident count17
- Vehicles involved in fatal accidents25
- Fatal accidents involving drunk persons5
- Fatalities17
- Persons involved in fatal accidents41
- Pedestrians involved in fatal accidents9
Average EMS response time
- Minneapolis(Based on 17 reports) 5.1 mins
- Hennepin County(Based on 40 reports) 8.5 mins
- Minnesota(Based on 394 reports) 9.8 mins
Average hospital transport time
- Minneapolis(Based on 15 reports) 35.7 mins
- Hennepin County(Based on 32 reports) 29.6 mins
- Minnesota(Based on 308 reports) 31.4 mins
Daylight
- Minneapolis(Based on 17 reports) 47.1%
- Hennepin County(Based on 48 reports) 56.3%
- Minnesota(Based on 465 reports) 51.0%
Dark - Lighted
- Minneapolis(Based on 17 reports) 29.4%
- Hennepin County(Based on 48 reports) 22.9%
- Minnesota(Based on 465 reports) 9.7%
Dark - Not Lighted
- Minneapolis(Based on 17 reports) 11.8%
- Hennepin County(Based on 48 reports) 16.7%
- Minnesota(Based on 465 reports) 32.5%
Dawn
- Minneapolis(Based on 17 reports) 5.9%
- Hennepin County(Based on 48 reports) 2.1%
- Minnesota(Based on 465 reports) 2.2%
Dusk
- Minneapolis(Based on 17 reports) 5.9%
- Hennepin County(Based on 48 reports) 2.1%
- Minnesota(Based on 465 reports) 4.7%
Clear
- Minneapolis(Based on 17 reports) 88.2%
- Hennepin County(Based on 49 reports) 73.5%
- Minnesota(Based on 469 reports) 81.9%
Fog, Smog, Smoke
- Minneapolis(Based on 17 reports) 5.9%
- Hennepin County(Based on 49 reports) 2.0%
- Minnesota(Based on 469 reports) 3.0%
Rain
- Minneapolis(Based on 17 reports) 5.9%
- Hennepin County(Based on 49 reports) 10.2%
- Minnesota(Based on 469 reports) 4.5%
| # | Date | Location | Vehicles | Drunk persons | Fatalites | Persons | Pedestrians |
|---|
| 1 | Jan 14, 1991 06:33 PM | M1950 | 1 | - | 1
| 2 | 1 |
| 2 | Feb 20, 1991 06:40 PM | 47 | 1 | - | 1
| 3 | 2 |
| 3 | Feb 21, 1991 06:50 AM | 35 | 2 | - | 1
| 3 | - |
| 4 | Mar 23, 1991 01:32 AM | 22 | 1 | 1
| 1 | 2 | 1 |
| 5 | Apr 16, 1991 03:10 PM | 249 | 1 | - | 1
| 2 | 1 |
| 6 | Apr 10, 1991 09:22 AM | 33 | 2 | - | 1
| 3 | - |
| 7 | Apr 21, 1991 11:17 AM | M827 | 1 | - | 1
| 2 | 1 |
| 8 | May 14, 1991 10:43 PM | 249 | 2 | - | 1
| 2 | - |
| 9 | Jun 3, 1991 04:32 PM | M2042 | 1 | - | 1
| 2 | 1 |
| 10 | Jul 22, 1991 11:20 PM | 3 | 1 | - | 1
| 2 | 1 |
| 11 | Jul 13, 1991 06:58 PM | I35w | 1 | 1
| 1 | 1 | - |
| 12 | Aug 5, 1991 08:29 PM | 253 | 2 | 1
| 1 | 2 | - |
| 13 | Aug 21, 1991 09:37 AM | 52 | 2 | - | 1
| 2 | - |
| 14 | Aug 22, 1991 02:57 PM | 33 | 1 | - | 1
| 3 | 1 |
| 15 | Aug 24, 1991 10:39 PM | 176 | 2 | 1
| 1 | 2 | - |
| 16 | Sep 8, 1991 09:18 PM | I35w | 1 | 1
| 1 | 4 | - |
| 17 | Dec 17, 1991 12:02 AM | 35 | 3 | - | 1
| 4 | - |
Minneapolis fatal car crash and road traffic accident list for 1990
- Fatal accident count25
- Vehicles involved in fatal accidents36
- Fatal accidents involving drunk persons12
- Fatalities25
- Persons involved in fatal accidents78
Average EMS response time
- Minneapolis(Based on 16 reports) 5.3 mins
- Hennepin County(Based on 29 reports) 5.7 mins
- Minnesota(Based on 280 reports) 9.9 mins
Dark - Lighted
- Minneapolis(Based on 25 reports) 52.0%
- Hennepin County(Based on 64 reports) 32.8%
- Minnesota(Based on 499 reports) 12.8%
Daylight
- Minneapolis(Based on 25 reports) 40.0%
- Hennepin County(Based on 64 reports) 53.1%
- Minnesota(Based on 499 reports) 46.7%
Dark - Not Lighted
- Minneapolis(Based on 25 reports) 4.0%
- Hennepin County(Based on 64 reports) 9.4%
- Minnesota(Based on 499 reports) 34.7%
Dusk
- Minneapolis(Based on 25 reports) 4.0%
- Hennepin County(Based on 64 reports) 3.1%
- Minnesota(Based on 499 reports) 3.8%
Clear
- Minneapolis(Based on 25 reports) 88.0%
- Hennepin County(Based on 64 reports) 85.9%
- Minnesota(Based on 501 reports) 84.4%
Rain
- Minneapolis(Based on 25 reports) 12.0%
- Hennepin County(Based on 64 reports) 9.4%
- Minnesota(Based on 501 reports) 6.2%
| # | Date | Location | Vehicles | Drunk persons | Fatalites | Persons | Pedestrians |
|---|
| 1 | Jan 1, 1990 12:15 AM | 2 | 2 | - | 1
| 5 | - |
| 2 | Feb 17, 1990 01:10 AM | 66 | 2 | 2
| 1 | 6 | - |
| 3 | Apr 6, 1990 10:00 PM | 313 | 1 | - | 1
| 2 | - |
| 4 | Apr 6, 1990 10:11 AM | 162 | 1 | - | 1
| 2 | - |
| 5 | Apr 27, 1990 08:30 AM | 281 | 1 | - | 1
| 2 | - |
| 6 | Apr 12, 1990 06:39 PM | 23 | 2 | - | 1
| 3 | - |
| 7 | Jun 16, 1990 02:45 AM | 47 | 1 | 1
| 1 | 1 | - |
| 8 | Jun 19, 1990 01:05 AM | M1050 | 1 | 1
| 1 | 1 | - |
| 9 | Jul 6, 1990 09:25 PM | 35 | 1 | - | 1
| 2 | - |
| 10 | Jul 19, 1990 01:48 AM | I94 | 2 | 1
| 1 | 3 | - |
| 11 | Jul 19, 1990 09:30 PM | 55 | 1 | - | 1
| 2 | - |
| 12 | Jul 12, 1990 01:46 PM | 371 | 2 | - | 1
| 3 | - |
| 13 | Aug 5, 1990 06:07 PM | 58 | 2 | 1
| 1 | 7 | - |
| 14 | Aug 25, 1990 02:07 AM | I35w | 1 | - | 1
| 6 | - |
| 15 | Aug 25, 1990 10:25 PM | I94 | 1 | 1
| 1 | 2 | - |
| 16 | Sep 12, 1990 01:16 PM | 165 | 1 | - | 1
| 2 | - |
| 17 | Sep 13, 1990 00:15 AM | 55 | 2 | 1
| 1 | 2 | - |
| 18 | Sep 21, 1990 04:11 PM | M83 | 1 | - | 1
| 3 | - |
| 19 | Sep 29, 1990 07:55 AM | 52 | 2 | - | 1
| 5 | - |
| 20 | Oct 14, 1990 06:28 PM | 226 | 2 | 1
| 1 | 4 | - |
| 21 | Oct 25, 1990 02:15 PM | M2050 | 2 | - | 1
| 4 | - |
| 22 | Dec 6, 1990 06:06 PM | 305 | 1 | - | 1
| 3 | - |
| 23 | Nov 10, 1990 05:44 PM | 283 | 1 | - | 1
| 2 | - |
| 24 | Nov 26, 1990 06:06 PM | 302 | 1 | 1
| 1 | 3 | - |
| 25 | Dec 30, 1990 02:15 AM | 190 | 2 | 2
| 1 | 3 | - |
Minneapolis fatal car crash and road traffic accident list for 1989
- Fatal accident count23
- Vehicles involved in fatal accidents33
- Fatal accidents involving drunk persons6
- Fatalities23
- Persons involved in fatal accidents69
Average EMS response time
- Minneapolis(Based on 11 reports) 7.7 mins
- Hennepin County(Based on 36 reports) 7.3 mins
- Minnesota(Based on 333 reports) 9.5 mins
Daylight
- Minneapolis(Based on 23 reports) 56.5%
- Hennepin County(Based on 69 reports) 55.1%
- Minnesota(Based on 531 reports) 50.1%
Dark - Lighted
- Minneapolis(Based on 23 reports) 34.8%
- Hennepin County(Based on 69 reports) 29.0%
- Minnesota(Based on 531 reports) 13.0%
Dawn
- Minneapolis(Based on 23 reports) 4.3%
- Hennepin County(Based on 69 reports) 1.4%
- Minnesota(Based on 531 reports) 1.7%
Dark - Not Lighted
- Minneapolis(Based on 23 reports) 4.3%
- Hennepin County(Based on 69 reports) 10.1%
- Minnesota(Based on 531 reports) 32.6%
Clear
- Minneapolis(Based on 23 reports) 87.0%
- Hennepin County(Based on 69 reports) 88.4%
- Minnesota(Based on 538 reports) 85.3%
Snow
- Minneapolis(Based on 23 reports) 4.3%
- Hennepin County(Based on 69 reports) 5.8%
- Minnesota(Based on 538 reports) 7.8%
Rain
- Minneapolis(Based on 23 reports) 4.3%
- Hennepin County(Based on 69 reports) 2.9%
- Minnesota(Based on 538 reports) 2.8%
Sleet or Hail
- Minneapolis(Based on 23 reports) 4.3%
- Hennepin County(Based on 69 reports) 1.4%
- Minnesota(Based on 538 reports) 0.6%
| # | Date | Location | Vehicles | Drunk persons | Fatalites | Persons | Pedestrians |
|---|
| 1 | Jan 24, 1989 12:46 AM | I94 | 2 | - | 1
| 4 | - |
| 2 | Mar 25, 1989 04:20 PM | 33 | 1 | - | 1
| 3 | - |
| 3 | Apr 8, 1989 03:39 AM | 194 | 2 | 1
| 1 | 2 | - |
| 4 | Apr 17, 1989 04:13 PM | M1616 | 2 | - | 1
| 4 | - |
| 5 | Apr 8, 1989 01:30 AM | 342 | 1 | - | 1
| 2 | - |
| 6 | May 8, 1989 08:00 AM | 38 | 2 | - | 1
| 4 | - |
| 7 | May 12, 1989 04:33 PM | 2 ____ | 1 | - | 1
| 2 | - |
| 8 | May 26, 1989 11:22 PM | I94 | 1 | - | 1
| 2 | - |
| 9 | Jun 12, 1989 12:49 AM | 81 | 1 | - | 1
| 3 | - |
| 10 | Jun 15, 1989 06:00 AM | 237 | 2 | 1
| 1 | 4 | - |
| 11 | Jul 21, 1989 10:45 PM | M1161 | 1 | - | 1
| 1 | - |
| 12 | Aug 13, 1989 04:33 PM | I35w | 1 | - | 1
| 2 | - |
| 13 | Aug 20, 1989 10:00 PM | 260 | 2 | 1
| 1 | 4 | - |
| 14 | Aug 29, 1989 08:05 AM | 263 | 1 | - | 1
| 2 | - |
| 15 | Sep 4, 1989 05:01 PM | 165 | 2 | - | 1
| 7 | - |
| 16 | Aug 23, 1989 00:02 AM | 47 | 2 | 1
| 1 | 2 | - |
| 17 | Oct 14, 1989 01:22 AM | 262 | 2 | 2
| 1 | 2 | - |
| 18 | Nov 9, 1989 03:16 PM | 193 | 2 | - | 1
| 8 | - |
| 19 | Nov 15, 1989 05:16 PM | 65 | 1 | - | 1
| 2 | - |
| 20 | Nov 29, 1989 02:33 PM | 239 | 1 | - | 1
| 2 | - |
| 21 | Dec 15, 1989 10:12 AM | 55 | 1 | - | 1
| 3 | - |
| 22 | Dec 15, 1989 03:00 PM | M1900 | 1 | - | 1
| 2 | - |
| 23 | Dec 9, 1989 05:30 PM | I35w | 1 | - | 1
| 2 | - |
Minneapolis fatal car crash and road traffic accident list for 1988
- Fatal accident count33
- Vehicles involved in fatal accidents52
- Fatal accidents involving drunk persons16
- Fatalities38
- Persons involved in fatal accidents106
Average EMS response time
- Minneapolis(Based on 14 reports) 6.8 mins
- Hennepin County(Based on 44 reports) 7.4 mins
- Minnesota(Based on 352 reports) 9.8 mins
Dark - Lighted
- Minneapolis(Based on 33 reports) 51.5%
- Hennepin County(Based on 81 reports) 33.3%
- Minnesota(Based on 539 reports) 13.9%
Daylight
- Minneapolis(Based on 33 reports) 45.5%
- Hennepin County(Based on 81 reports) 54.3%
- Minnesota(Based on 539 reports) 48.4%
Dusk
- Minneapolis(Based on 33 reports) 3.0%
- Hennepin County(Based on 81 reports) 2.5%
- Minnesota(Based on 539 reports) 5.8%
Clear
- Minneapolis(Based on 33 reports) 100.0%
- Hennepin County(Based on 81 reports) 95.1%
- Minnesota(Based on 543 reports) 89.3%
| # | Date | Location | Vehicles | Drunk persons | Fatalites | Persons | Pedestrians |
|---|
| 1 | Feb 2, 1988 03:05 PM | 407 | 2 | - | 1
| 2 | - |
| 2 | Feb 6, 1988 09:18 PM | 16 | 1 | - | 1
| 1 | - |
| 3 | Jan 8, 1988 11:30 AM | 81 | 1 | - | 1
| 2 | - |
| 4 | Feb 26, 1988 02:00 PM | 313 | 1 | - | 1
| 2 | - |
| 5 | Mar 24, 1988 09:43 AM | 952a | 1 | - | 1
| 2 | - |
| 6 | Mar 25, 1988 12:45 AM | 153 | 2 | - | 1
| 2 | - |
| 7 | Apr 27, 1988 04:25 PM | 55 | 1 | 1
| 1 | 1 | - |
| 8 | May 14, 1988 07:10 PM | M432 | 1 | 1
| 2 | 4 | - |
| 9 | May 3, 1988 07:28 PM | 94 | 1 | - | 1
| 2 | - |
| 10 | May 21, 1988 00:07 AM | 35w | 1 | 1
| 1 | 2 | - |
| 11 | May 20, 1988 01:18 AM | M210 | 1 | 1
| 3 | 3 | - |
| 12 | May 23, 1988 10:22 AM | 337 | 1 | - | 1
| 4 | - |
| 13 | May 15, 1988 04:29 AM | 35w | 1 | - | 1
| 3 | - |
| 14 | Jun 28, 1988 01:20 PM | 969b | 2 | - | 1
| 2 | - |
| 15 | Jun 29, 1988 03:14 PM | 313 | 1 | - | 1
| 2 | - |
| 16 | Jul 30, 1988 03:40 PM | 57 | 2 | - | 1
| 3 | - |
| 17 | Aug 3, 1988 02:00 AM | 94 | 1 | - | 1
| 2 | - |
| 18 | Aug 28, 1988 05:45 PM | 52 | 2 | 1
| 1 | 6 | - |
| 19 | Sep 3, 1988 02:23 AM | 35w | 1 | 1
| 1 | 2 | - |
| 20 | Aug 15, 1988 08:35 PM | 94 | 4 | 2
| 1 | 6 | - |
| 21 | Sep 24, 1988 01:30 PM | 222 | 2 | - | 1
| 4 | - |
| 22 | Oct 1, 1988 11:54 PM | 36 | 1 | - | 1
| 4 | - |
| 23 | Oct 3, 1988 09:44 PM | 66 | 2 | 2
| 1 | 2 | - |
| 24 | Oct 14, 1988 08:00 PM | M701 | 1 | - | 1
| 1 | - |
| 25 | Oct 15, 1988 10:10 PM | M701 | 1 | 1
| 2 | 3 | - |
| 26 | Oct 8, 1988 00:35 AM | 313 | 2 | 1
| 1 | 6 | - |
| 27 | Oct 23, 1988 04:37 PM | 407 | 1 | 1
| 1 | 2 | - |
| 28 | Oct 23, 1988 06:27 PM | 55 | 4 | 1
| 2 | 8 | - |
| 29 | Nov 5, 1988 08:35 PM | 5 | 1 | - | 1
| 3 | - |
| 30 | Nov 12, 1988 08:45 PM | 47 | 4 | - | 1
| 9 | - |
| 31 | Nov 18, 1988 10:06 PM | 936a | 1 | - | 1
| 3 | - |
| 32 | Dec 11, 1988 02:30 AM | 936a | 2 | 2
| 1 | 4 | - |
| 33 | Oct 21, 1988 10:05 PM | 35w | 2 | - | 1
| 4 | - |
Minneapolis fatal car crash and road traffic accident list for 1987
- Fatal accident count25
- Vehicles involved in fatal accidents31
- Fatal accidents involving drunk persons10
- Fatalities25
- Persons involved in fatal accidents64
Average EMS response time
- Minneapolis(Based on 16 reports) 4.8 mins
- Hennepin County(Based on 33 reports) 6.8 mins
- Minnesota(Based on 278 reports) 9.3 mins
Daylight
- Minneapolis(Based on 25 reports) 56.0%
- Hennepin County(Based on 55 reports) 67.3%
- Minnesota(Based on 463 reports) 47.5%
Dark - Lighted
- Minneapolis(Based on 25 reports) 44.0%
- Hennepin County(Based on 55 reports) 30.9%
- Minnesota(Based on 463 reports) 12.7%
Clear
- Minneapolis(Based on 25 reports) 96.0%
- Hennepin County(Based on 55 reports) 92.7%
- Minnesota(Based on 466 reports) 88.2%
Rain
- Minneapolis(Based on 25 reports) 4.0%
- Hennepin County(Based on 55 reports) 5.5%
- Minnesota(Based on 466 reports) 4.9%
| # | Date | Location | Vehicles | Drunk persons | Fatalites | Persons | Pedestrians |
|---|
| 1 | Jan 18, 1987 10:35 AM | 5 | 1 | - | 1
| 2 | - |
| 2 | Feb 13, 1987 00:53 AM | 55 | 2 | 1
| 1 | 4 | - |
| 3 | Feb 18, 1987 01:19 PM | M430 | 1 | 1
| 1 | 2 | - |
| 4 | Apr 10, 1987 07:38 PM | 52 | 2 | - | 1
| 6 | - |
| 5 | Apr 24, 1987 05:23 PM | 55 | 1 | - | 1
| 2 | - |
| 6 | May 8, 1987 03:20 PM | 342 | 1 | 1
| 1 | 2 | - |
| 7 | May 11, 1987 01:35 PM | 191 | 2 | - | 1
| 2 | - |
| 8 | May 15, 1987 09:50 PM | 33 | 2 | 1
| 1 | 4 | - |
| 9 | Jun 17, 1987 09:05 AM | 165 | 1 | - | 1
| 2 | - |
| 10 | Jun 9, 1987 11:46 PM | 94 | 1 | - | 1
| 3 | - |
| 11 | Jul 3, 1987 10:40 AM | 5 | 1 | - | 1
| 2 | - |
| 12 | Jul 1, 1987 03:15 PM | 35w | 1 | - | 1
| 1 | - |
| 13 | Jul 9, 1987 01:00 AM | 94 | 2 | 1
| 1 | 2 | - |
| 14 | Sep 5, 1987 01:15 AM | 236 | 1 | - | 1
| 3 | - |
| 15 | Sep 15, 1987 01:53 PM | 969b | 1 | - | 1
| 2 | - |
| 16 | Sep 1, 1987 09:30 PM | 55 | 1 | 1
| 1 | 1 | - |
| 17 | Oct 7, 1987 01:50 AM | 936a | 1 | 1
| 1 | 1 | - |
| 18 | Oct 25, 1987 05:36 AM | 94 | 1 | - | 1
| 3 | - |
| 19 | Nov 13, 1987 06:14 PM | 52 | 1 | - | 1
| 2 | - |
| 20 | Nov 20, 1987 02:19 PM | 65 | 1 | - | 1
| 2 | - |
| 21 | Nov 1, 1987 10:38 AM | 152 | 1 | - | 1
| 2 | - |
| 22 | Nov 30, 1987 04:07 PM | 35 | 1 | - | 1
| 2 | - |
| 23 | Nov 25, 1987 04:32 PM | 55 | 2 | 1
| 1 | 6 | - |
| 24 | Dec 20, 1987 01:13 AM | M889 | 1 | 1
| 1 | 4 | - |
| 25 | Dec 5, 1987 01:15 AM | 94 | 1 | 1
| 1 | 2 | - |
Minneapolis fatal car crash and road traffic accident list for 1986
- Fatal accident count27
- Vehicles involved in fatal accidents34
- Fatal accidents involving drunk persons12
- Fatalities27
- Persons involved in fatal accidents67
Average EMS response time
- Minneapolis(Based on 12 reports) 6.2 mins
- Hennepin County(Based on 36 reports) 7.0 mins
- Minnesota(Based on 308 reports) 10.1 mins
Dark - Lighted
- Minneapolis(Based on 27 reports) 55.6%
- Hennepin County(Based on 67 reports) 37.3%
- Minnesota(Based on 504 reports) 15.1%
Daylight
- Minneapolis(Based on 27 reports) 40.7%
- Hennepin County(Based on 67 reports) 44.8%
- Minnesota(Based on 504 reports) 46.6%
Dusk
- Minneapolis(Based on 27 reports) 3.7%
- Hennepin County(Based on 67 reports) 3.0%
- Minnesota(Based on 504 reports) 2.4%
Clear
- Minneapolis(Based on 27 reports) 96.3%
- Hennepin County(Based on 67 reports) 92.5%
- Minnesota(Based on 505 reports) 87.1%
Rain
- Minneapolis(Based on 27 reports) 3.7%
- Hennepin County(Based on 67 reports) 3.0%
- Minnesota(Based on 505 reports) 5.5%
| # | Date | Location | Vehicles | Drunk persons | Fatalites | Persons | Pedestrians |
|---|
| 1 | Jan 4, 1986 07:39 PM | 239 | 1 | - | 1
| 2 | - |
| 2 | Jan 15, 1986 05:25 PM | 165 | 1 | - | 1
| 3 | - |
| 3 | Jan 1, 1986 02:43 AM | 193 | 1 | 1
| 1 | 1 | - |
| 4 | Jan 23, 1986 05:55 PM | 55 | 1 | - | 1
| 2 | - |
| 5 | Jan 16, 1986 12:29 AM | 969b | 1 | - | 1
| 2 | - |
| 6 | Mar 4, 1986 10:15 PM | 48 | 1 | - | 1
| 3 | - |
| 7 | Mar 22, 1986 06:23 PM | 2 | 1 | - | 1
| 2 | - |
| 8 | Apr 2, 1986 08:55 AM | 222 | 1 | - | 1
| 2 | - |
| 9 | Apr 14, 1986 10:35 PM | 936a | 1 | 1
| 1 | 2 | - |
| 10 | Apr 29, 1986 08:20 AM | 94 | 1 | - | 1
| 2 | - |
| 11 | May 9, 1986 07:51 PM | M1437 | 1 | - | 1
| 2 | - |
| 12 | May 16, 1986 09:09 PM | 55 | 1 | - | 1
| 4 | - |
| 13 | May 26, 1986 06:32 PM | 335 | 2 | - | 1
| 4 | - |
| 14 | Apr 20, 1986 07:18 PM | 2 | 1 | - | 1
| 3 | - |
| 15 | Jun 23, 1986 00:05 AM | M1146 | 1 | 1
| 1 | 1 | - |
| 16 | Jun 28, 1986 10:35 PM | 38 | 1 | - | 1
| 3 | - |
| 17 | Jun 5, 1986 05:00 PM | 197 | 1 | - | 1
| 2 | - |
| 18 | Jul 8, 1986 10:00 PM | 94 | 1 | - | 1
| 2 | - |
| 19 | Jun 8, 1986 00:55 AM | 81 | 1 | 1
| 1 | 3 | - |
| 20 | Jul 1, 1986 10:45 AM | 268 | 2 | - | 1
| 2 | - |
| 21 | Aug 12, 1986 03:04 PM | 52 | 2 | 1
| 1 | 2 | - |
| 22 | Aug 9, 1986 01:35 AM | 243 | 1 | 1
| 1 | 5 | - |
| 23 | Sep 27, 1986 01:40 AM | 94 | 2 | 1
| 1 | 3 | - |
| 24 | Sep 25, 1986 11:40 AM | 55 | 1 | 1
| 1 | 2 | - |
| 25 | Oct 18, 1986 03:15 PM | 12 | 3 | 1
| 1 | 3 | - |
| 26 | Nov 26, 1986 10:23 PM | 94 | 1 | 1
| 1 | 2 | - |
| 27 | Nov 1, 1986 01:55 AM | 211 | 2 | 2
| 1 | 3 | - |
Minneapolis fatal car crash and road traffic accident list for 1985
- Fatal accident count25
- Vehicles involved in fatal accidents42
- Fatal accidents involving drunk persons10
- Fatalities27
- Persons involved in fatal accidents74
Average EMS response time
- Minneapolis(Based on 9 reports) 8.0 mins
- Hennepin County(Based on 37 reports) 7.3 mins
- Minnesota(Based on 345 reports) 10.1 mins
Dark - Lighted
- Minneapolis(Based on 25 reports) 52.0%
- Hennepin County(Based on 64 reports) 37.5%
- Minnesota(Based on 533 reports) 14.6%
Daylight
- Minneapolis(Based on 25 reports) 44.0%
- Hennepin County(Based on 64 reports) 46.9%
- Minnesota(Based on 533 reports) 49.3%
Dusk
- Minneapolis(Based on 25 reports) 4.0%
- Hennepin County(Based on 64 reports) 3.1%
- Minnesota(Based on 533 reports) 2.8%
Clear
- Minneapolis(Based on 25 reports) 100.0%
- Hennepin County(Based on 64 reports) 85.9%
- Minnesota(Based on 536 reports) 86.8%
| # | Date | Location | Vehicles | Drunk persons | Fatalites | Persons | Pedestrians |
|---|
| 1 | Jan 4, 1985 02:08 PM | 5 | 1 | - | 1
| 3 | - |
| 2 | Jan 4, 1985 08:50 PM | 907a | 2 | 2
| 1 | 3 | - |
| 3 | Jan 7, 1985 04:24 PM | 907a | 2 | - | 2
| 3 | - |
| 4 | Jan 30, 1985 06:45 PM | 5 | 2 | - | 1
| 7 | - |
| 5 | Feb 2, 1985 10:25 AM | 335 | 4 | - | 1
| 7 | - |
| 6 | Feb 3, 1985 04:00 PM | 912c | 1 | - | 1
| 2 | - |
| 7 | Feb 28, 1985 07:25 PM | 35w | 4 | - | 1
| 6 | - |
| 8 | Mar 11, 1985 11:25 PM | 94 | 1 | - | 1
| 2 | - |
| 9 | Mar 23, 1985 04:40 AM | M1930 | 2 | 2
| 1 | 2 | - |
| 10 | Mar 28, 1985 06:30 PM | 23 | 2 | 1
| 1 | 3 | - |
| 11 | Apr 11, 1985 05:05 PM | 94 | 2 | - | 1
| 2 | - |
| 12 | May 5, 1985 02:18 AM | 2 | 1 | 1
| 1 | 1 | - |
| 13 | May 11, 1985 03:15 PM | 190 | 2 | - | 1
| 8 | - |
| 14 | May 28, 1985 03:10 PM | 241 | 2 | - | 1
| 2 | - |
| 15 | May 4, 1985 02:47 AM | 94 | 1 | 1
| 1 | 5 | - |
| 16 | Jun 13, 1985 11:06 PM | 936a | 1 | - | 1
| 1 | - |
| 17 | Jun 17, 1985 02:46 PM | 190 | 3 | - | 1
| 3 | - |
| 18 | Jul 141985 03:20 PM | | 1 | - | 1
| 1 | - |
| 19 | Jun 23, 1985 10:42 PM | 2 | 1 | - | 1
| 2 | - |
| 20 | Jul 29, 1985 06:35 PM | 52 | 2 | - | 1
| 2 | - |
| 21 | Sep 11, 1985 01:15 AM | 340 | 1 | 1
| 1 | 1 | - |
| 22 | Oct 2, 1985 08:30 PM | M1508 | 1 | 1
| 2 | 2 | - |
| 23 | Oct 31, 1985 04:30 PM | 272 | 1 | - | 1
| 1 | - |
| 24 | Nov 13, 1985 05:20 AM | 94 | 1 | 1
| 1 | 1 | - |
| 25 | Oct 6, 1985 10:09 PM | M1124 | 1 | - | 1
| 4 | - |
Minneapolis fatal car crash and road traffic accident list for 1984
- Fatal accident count22
- Vehicles involved in fatal accidents30
- Fatal accidents involving drunk persons11
- Fatalities23
- Persons involved in fatal accidents48
Average EMS response time
- Minneapolis(Based on 12 reports) 6.8 mins
- Hennepin County(Based on 39 reports) 7.8 mins
- Minnesota(Based on 310 reports) 10.1 mins
Dark - Lighted
- Minneapolis(Based on 22 reports) 59.1%
- Hennepin County(Based on 60 reports) 41.7%
- Minnesota(Based on 510 reports) 12.4%
Daylight
- Minneapolis(Based on 22 reports) 36.4%
- Hennepin County(Based on 60 reports) 38.3%
- Minnesota(Based on 510 reports) 43.3%
Dusk
- Minneapolis(Based on 22 reports) 4.5%
- Hennepin County(Based on 60 reports) 3.3%
- Minnesota(Based on 510 reports) 4.5%
Clear
- Minneapolis(Based on 22 reports) 86.4%
- Hennepin County(Based on 62 reports) 90.3%
- Minnesota(Based on 517 reports) 84.9%
Rain
- Minneapolis(Based on 22 reports) 9.1%
- Hennepin County(Based on 62 reports) 3.2%
- Minnesota(Based on 517 reports) 5.0%
Snow
- Minneapolis(Based on 22 reports) 4.5%
- Hennepin County(Based on 62 reports) 4.8%
- Minnesota(Based on 517 reports) 4.8%
| # | Date | Location | Vehicles | Drunk persons | Fatalites | Persons | Pedestrians |
|---|
| 1 | Feb 1, 1984 06:00 PM | 165 | 1 | - | 1
| 1 | - |
| 2 | Feb 18, 1984 01:20 AM | 55 | 2 | 1
| 1 | 2 | - |
| 3 | Feb 18, 1984 11:55 PM | 55 | 2 | 1
| 1 | 3 | - |
| 4 | Feb 24, 1984 12:20 AM | 12 | 1 | - | 2
| 2 | - |
| 5 | Feb 16, 1984 06:00 PM | 5 | 1 | - | 1
| 2 | - |
| 6 | Mar 2, 1984 01:15 AM | 57 | 2 | 2
| 1 | 5 | - |
| 7 | Mar 8, 1984 12:55 AM | 55 | 2 | - | 1
| 3 | - |
| 8 | Mar 18, 1984 01:30 AM | 33 | 1 | - | 1
| 2 | - |
| 9 | Apr 28, 1984 07:35 PM | M756 | 1 | 1
| 1 | 1 | - |
| 10 | May 16, 1984 01:30 AM | 38 | 1 | 1
| 1 | 1 | - |
| 11 | Jun 10, 1984 06:30 PM | 55 | 1 | - | 1
| 3 | - |
| 12 | Jun 19, 1984 08:45 AM | 337 | 1 | - | 1
| 1 | - |
| 13 | Jun 6, 1984 11:50 PM | 334 | 2 | - | 1
| 2 | - |
| 14 | Jun 23, 1984 01:20 AM | 94 | 2 | 1
| 1 | 3 | - |
| 15 | Jun 30, 1984 01:30 PM | M1766 | 1 | 1
| 1 | 2 | - |
| 16 | Sep 1, 1984 06:45 AM | 249 | 2 | 1
| 1 | 3 | - |
| 17 | Sep 29, 1984 01:10 AM | M771 | 1 | - | 1
| 2 | - |
| 18 | Oct 15, 1984 00:34 AM | 52 | 1 | 1
| 1 | 2 | - |
| 19 | Oct 20, 1984 07:25 AM | 32 | 2 | - | 1
| 2 | - |
| 20 | Oct 15, 1984 11:45 AM | 5 | 1 | - | 1
| 2 | - |
| 21 | Dec 7, 1984 05:50 PM | 48 | 1 | - | 1
| 2 | - |
| 22 | Dec 16, 1984 05:35 PM | 35w | 1 | 1
| 1 | 2 | - |
Minneapolis fatal car crash and road traffic accident list for 1983
- Fatal accident count22
- Vehicles involved in fatal accidents27
- Fatal accidents involving drunk persons18
- Fatalities22
- Persons involved in fatal accidents45
Average EMS response time
- Minneapolis(Based on 8 reports) 4.3 mins
- Hennepin County(Based on 24 reports) 6.3 mins
- Minnesota(Based on 288 reports) 10.3 mins
Dark - Lighted
- Minneapolis(Based on 22 reports) 77.3%
- Hennepin County(Based on 56 reports) 57.1%
- Minnesota(Based on 497 reports) 16.1%
Daylight
- Minneapolis(Based on 22 reports) 18.2%
- Hennepin County(Based on 56 reports) 30.4%
- Minnesota(Based on 497 reports) 46.7%
Dark - Not Lighted
- Minneapolis(Based on 22 reports) 4.5%
- Hennepin County(Based on 56 reports) 8.9%
- Minnesota(Based on 497 reports) 31.8%
Clear
- Minneapolis(Based on 22 reports) 81.8%
- Hennepin County(Based on 56 reports) 83.9%
- Minnesota(Based on 498 reports) 85.5%
Rain
- Minneapolis(Based on 22 reports) 13.6%
- Hennepin County(Based on 56 reports) 7.1%
- Minnesota(Based on 498 reports) 6.0%
Snow
- Minneapolis(Based on 22 reports) 4.5%
- Hennepin County(Based on 56 reports) 3.6%
- Minnesota(Based on 498 reports) 3.8%
| # | Date | Location | Vehicles | Drunk persons | Fatalites | Persons | Pedestrians |
|---|
| 1 | Jan 28, 1983 07:25 PM | 197 | 3 | 1
| 1 | 4 | - |
| 2 | Feb 12, 1983 11:34 PM | 197 | 1 | 1
| 1 | 2 | - |
| 3 | Feb 23, 1983 00:04 AM | 55 | 1 | 1
| 1 | 1 | - |
| 4 | Apr 3, 1983 07:55 PM | 366 | 1 | - | 1
| 3 | - |
| 5 | Apr 24, 1983 06:55 AM | M701 | 1 | 1
| 1 | 1 | - |
| 6 | Apr 22, 1983 02:40 AM | 66 | 2 | 1
| 1 | 3 | - |
| 7 | May 11, 1983 00:20 AM | M1779 | 1 | 1
| 1 | 1 | - |
| 8 | May 4, 1983 10:55 PM | 55 | 2 | 2
| 1 | 4 | - |
| 9 | Jun 27, 1983 11:00 AM | 35w | 1 | - | 1
| 1 | - |
| 10 | Jun 25, 1983 09:45 PM | 912c | 1 | - | 1
| 2 | - |
| 11 | Jun 25, 1983 12:00 PM | 94 | 1 | 1
| 1 | 2 | - |
| 12 | Jul 8, 1983 09:21 AM | 33 | 1 | 1
| 1 | 2 | - |
| 13 | Jul 21, 1983 01:12 AM | 94 | 1 | 1
| 1 | 1 | - |
| 14 | Aug 6, 1983 03:14 AM | 94 | 1 | 1
| 1 | 1 | - |
| 15 | Sep 29, 1983 10:30 PM | 203 | 1 | - | 1
| 2 | - |
| 16 | Sep 18, 1983 03:40 AM | 66 | 1 | 1
| 1 | 2 | - |
| 17 | Sep 24, 1983 07:45 PM | 952a | 2 | - | 1
| 2 | - |
| 18 | Sep 21, 1983 01:29 AM | 5 | 1 | 1
| 1 | 2 | - |
| 19 | Oct 30, 1983 01:45 AM | M1820 | 1 | 1
| 1 | 4 | - |
| 20 | Dec 5, 1983 03:55 PM | M1959 | 1 | 1
| 1 | 2 | - |
| 21 | Dec 22, 1983 08:00 PM | 35w | 1 | 1
| 1 | 1 | - |
| 22 | Dec 18, 1983 01:44 AM | 328 | 1 | 1
| 1 | 2 | - |
Minneapolis fatal car crash and road traffic accident list for 1982
- Fatal accident count18
- Vehicles involved in fatal accidents28
- Fatal accidents involving drunk persons10
- Fatalities19
- Persons involved in fatal accidents45
Average EMS response time
- Minneapolis(Based on 13 reports) 7.4 mins
- Hennepin County(Based on 31 reports) 7.1 mins
- Minnesota(Based on 285 reports) 11.2 mins
Dark - Lighted
- Minneapolis(Based on 18 reports) 44.4%
- Hennepin County(Based on 56 reports) 35.7%
- Minnesota(Based on 507 reports) 15.0%
Daylight
- Minneapolis(Based on 18 reports) 38.9%
- Hennepin County(Based on 56 reports) 46.4%
- Minnesota(Based on 507 reports) 45.8%
Dusk
- Minneapolis(Based on 18 reports) 11.1%
- Hennepin County(Based on 56 reports) 3.6%
- Minnesota(Based on 507 reports) 2.8%
Dawn
- Minneapolis(Based on 18 reports) 5.6%
- Hennepin County(Based on 56 reports) 3.6%
- Minnesota(Based on 507 reports) 1.4%
Clear
- Minneapolis(Based on 18 reports) 88.9%
- Hennepin County(Based on 56 reports) 85.7%
- Minnesota(Based on 508 reports) 83.1%
Rain
- Minneapolis(Based on 18 reports) 11.1%
- Hennepin County(Based on 56 reports) 8.9%
- Minnesota(Based on 508 reports) 6.1%
| # | Date | Location | Vehicles | Drunk persons | Fatalites | Persons | Pedestrians |
|---|
| 1 | Feb 10, 1982 05:28 PM | 333 | 2 | - | 1
| 3 | - |
| 2 | Mar 4, 1982 00:02 AM | 969b | 2 | 1
| 1 | 2 | - |
| 3 | Apr 1, 1982 00:35 AM | 65 | 1 | 1
| 1 | 1 | - |
| 4 | Mar 31, 1982 06:05 PM | 366 | 1 | - | 1
| 2 | - |
| 5 | May 11, 1982 06:40 AM | 52 | 1 | 1
| 1 | 1 | - |
| 6 | Aug 9, 1982 11:30 AM | 251 | 2 | - | 1
| 3 | - |
| 7 | Aug 14, 1982 08:17 PM | 94 | 1 | 1
| 1 | 1 | - |
| 8 | Jul 16, 1982 04:29 PM | 160 | 2 | - | 1
| 4 | - |
| 9 | Oct 4, 1982 04:25 PM | 212 | 1 | - | 1
| 2 | - |
| 10 | Oct 10, 1982 04:28 PM | 35w | 1 | - | 1
| 1 | - |
| 11 | Oct 10, 1982 03:30 AM | 969b | 2 | 1
| 2 | 8 | - |
| 12 | Oct 2, 1982 04:20 AM | 94 | 1 | 1
| 1 | 1 | - |
| 13 | Oct 13, 1982 03:05 AM | 35w | 2 | 1
| 1 | 2 | - |
| 14 | Nov 15, 1982 05:47 PM | 35w | 2 | - | 1
| 2 | - |
| 15 | Nov 20, 1982 01:35 AM | 52 | 2 | 2
| 1 | 2 | - |
| 16 | Nov 30, 1982 01:45 PM | 249 | 2 | - | 1
| 4 | - |
| 17 | Nov 6, 1982 02:14 PM | M1131 | 2 | - | 1
| 4 | - |
| 18 | Nov 6, 1982 01:10 AM | 47 | 1 | 1
| 1 | 2 | - |
Minneapolis fatal car crash and road traffic accident list for 1981
- Fatal accident count48
- Vehicles involved in fatal accidents66
- Fatal accidents involving drunk persons24
- Fatalities50
- Persons involved in fatal accidents122
Average EMS response time
- Minneapolis(Based on 28 reports) 6.8 mins
- Hennepin County(Based on 65 reports) 7.0 mins
- Minnesota(Based on 394 reports) 10.6 mins
Dark - Lighted
- Minneapolis(Based on 48 reports) 60.4%
- Hennepin County(Based on 100 reports) 47.0%
- Minnesota(Based on 660 reports) 18.8%
Daylight
- Minneapolis(Based on 48 reports) 35.4%
- Hennepin County(Based on 100 reports) 35.0%
- Minnesota(Based on 660 reports) 37.7%
Dusk
- Minneapolis(Based on 48 reports) 2.1%
- Hennepin County(Based on 100 reports) 5.0%
- Minnesota(Based on 660 reports) 3.2%
Dawn
- Minneapolis(Based on 48 reports) 2.1%
- Hennepin County(Based on 100 reports) 2.0%
- Minnesota(Based on 660 reports) 1.1%
Clear
- Minneapolis(Based on 48 reports) 87.5%
- Hennepin County(Based on 102 reports) 79.4%
- Minnesota(Based on 663 reports) 84.0%
Rain
- Minneapolis(Based on 48 reports) 10.4%
- Hennepin County(Based on 102 reports) 13.7%
- Minnesota(Based on 663 reports) 8.7%
Snow
- Minneapolis(Based on 48 reports) 2.1%
- Hennepin County(Based on 102 reports) 2.0%
- Minnesota(Based on 663 reports) 3.5%
Minneapolis fatal car crash and road traffic accident list for 1980
- Fatal accident count35
- Vehicles involved in fatal accidents50
- Fatal accidents involving drunk persons11
- Fatalities39
- Persons involved in fatal accidents87
Average EMS response time
- Minneapolis(Based on 14 reports) 4.9 mins
- Hennepin County(Based on 39 reports) 6.9 mins
- Minnesota(Based on 405 reports) 10.1 mins
Dark - Lighted
- Minneapolis(Based on 35 reports) 45.7%
- Hennepin County(Based on 84 reports) 46.4%
- Minnesota(Based on 739 reports) 20.3%
Daylight
- Minneapolis(Based on 35 reports) 42.9%
- Hennepin County(Based on 84 reports) 34.5%
- Minnesota(Based on 739 reports) 37.3%
Dusk
- Minneapolis(Based on 35 reports) 5.7%
- Hennepin County(Based on 84 reports) 3.6%
- Minnesota(Based on 739 reports) 3.2%
Dark - Not Lighted
- Minneapolis(Based on 35 reports) 5.7%
- Hennepin County(Based on 84 reports) 14.3%
- Minnesota(Based on 739 reports) 37.8%
Clear
- Minneapolis(Based on 35 reports) 97.1%
- Hennepin County(Based on 84 reports) 91.7%
- Minnesota(Based on 742 reports) 89.9%
Rain
- Minneapolis(Based on 35 reports) 2.9%
- Hennepin County(Based on 84 reports) 6.0%
- Minnesota(Based on 742 reports) 3.8%
Minneapolis fatal car crash and road traffic accident list for 1979
- Fatal accident count45
- Vehicles involved in fatal accidents61
- Fatal accidents involving drunk persons24
- Fatalities46
- Persons involved in fatal accidents113
Average EMS response time
- Minneapolis(Based on 11 reports) 5.6 mins
- Hennepin County(Based on 45 reports) 7.4 mins
- Minnesota(Based on 397 reports) 10.4 mins
Dark - Lighted
- Minneapolis(Based on 45 reports) 57.8%
- Hennepin County(Based on 108 reports) 37.0%
- Minnesota(Based on 771 reports) 15.4%
Daylight
- Minneapolis(Based on 45 reports) 26.7%
- Hennepin County(Based on 108 reports) 36.1%
- Minnesota(Based on 771 reports) 39.8%
Dark - Unknown Lighting
- Minneapolis(Based on 45 reports) 8.9%
- Hennepin County(Based on 108 reports) 6.5%
- Minnesota(Based on 771 reports) 7.0%
Dark - Not Lighted
- Minneapolis(Based on 45 reports) 6.7%
- Hennepin County(Based on 108 reports) 20.4%
- Minnesota(Based on 771 reports) 37.7%
Clear
- Minneapolis(Based on 45 reports) 93.3%
- Hennepin County(Based on 108 reports) 92.6%
- Minnesota(Based on 776 reports) 88.7%
Rain
- Minneapolis(Based on 45 reports) 6.7%
- Hennepin County(Based on 108 reports) 4.6%
- Minnesota(Based on 776 reports) 4.8%
Minneapolis fatal car crash and road traffic accident list for 1978
- Fatal accident count54
- Vehicles involved in fatal accidents72
- Fatal accidents involving drunk persons20
- Fatalities55
- Persons involved in fatal accidents139
Average EMS response time
- Minneapolis(Based on 21 reports) 5.8 mins
- Hennepin County(Based on 55 reports) 7.3 mins
- Minnesota(Based on 399 reports) 10.3 mins
Dark - Lighted
- Minneapolis(Based on 54 reports) 53.7%
- Hennepin County(Based on 112 reports) 45.5%
- Minnesota(Based on 823 reports) 15.4%
Daylight
- Minneapolis(Based on 54 reports) 42.6%
- Hennepin County(Based on 112 reports) 35.7%
- Minnesota(Based on 823 reports) 41.2%
Dark - Unknown Lighting
- Minneapolis(Based on 54 reports) 1.9%
- Hennepin County(Based on 112 reports) 2.7%
- Minnesota(Based on 823 reports) 5.0%
Dark - Not Lighted
- Minneapolis(Based on 54 reports) 1.9%
- Hennepin County(Based on 112 reports) 16.1%
- Minnesota(Based on 823 reports) 38.4%
Clear
- Minneapolis(Based on 54 reports) 92.6%
- Hennepin County(Based on 113 reports) 92.0%
- Minnesota(Based on 834 reports) 86.9%
Rain
- Minneapolis(Based on 54 reports) 3.7%
- Hennepin County(Based on 113 reports) 5.3%
- Minnesota(Based on 834 reports) 6.1%
Sleet or Hail
- Minneapolis(Based on 54 reports) 1.9%
- Hennepin County(Based on 113 reports) 0.9%
- Minnesota(Based on 834 reports) 0.7%
Snow
- Minneapolis(Based on 54 reports) 1.9%
- Hennepin County(Based on 113 reports) 0.9%
- Minnesota(Based on 834 reports) 2.9%
Minneapolis fatal car crash and road traffic accident list for 1977
- Fatal accident count46
- Vehicles involved in fatal accidents52
- Fatal accidents involving drunk persons14
- Fatalities48
- Persons involved in fatal accidents106
Average EMS response time
- Minneapolis(Based on 18 reports) 5.6 mins
- Hennepin County(Based on 45 reports) 7.8 mins
- Minnesota(Based on 345 reports) 10.1 mins
Daylight
- Minneapolis(Based on 46 reports) 50.0%
- Hennepin County(Based on 93 reports) 50.5%
- Minnesota(Based on 721 reports) 41.3%
Dark - Lighted
- Minneapolis(Based on 46 reports) 41.3%
- Hennepin County(Based on 93 reports) 30.1%
- Minnesota(Based on 721 reports) 16.6%
Dark - Unknown Lighting
- Minneapolis(Based on 46 reports) 6.5%
- Hennepin County(Based on 93 reports) 8.6%
- Minnesota(Based on 721 reports) 5.5%
Dark - Not Lighted
- Minneapolis(Based on 46 reports) 2.2%
- Hennepin County(Based on 93 reports) 10.8%
- Minnesota(Based on 721 reports) 36.5%
Clear
- Minneapolis(Based on 46 reports) 91.3%
- Hennepin County(Based on 93 reports) 82.8%
- Minnesota(Based on 730 reports) 83.4%
Rain
- Minneapolis(Based on 46 reports) 8.7%
- Hennepin County(Based on 93 reports) 12.9%
- Minnesota(Based on 730 reports) 6.7%
Minneapolis fatal car crash and road traffic accident list for 1976
- Fatal accident count37
- Vehicles involved in fatal accidents49
- Fatal accidents involving drunk persons10
- Fatalities38
- Persons involved in fatal accidents92
Average EMS response time
- Minneapolis(Based on 11 reports) 8.5 mins
- Hennepin County(Based on 30 reports) 8.7 mins
- Minnesota(Based on 255 reports) 9.9 mins
Daylight
- Minneapolis(Based on 37 reports) 54.1%
- Hennepin County(Based on 85 reports) 45.9%
- Minnesota(Based on 652 reports) 45.1%
Dark - Not Lighted
- Minneapolis(Based on 37 reports) 29.7%
- Hennepin County(Based on 85 reports) 36.5%
- Minnesota(Based on 652 reports) 42.6%
Dark - Lighted
- Minneapolis(Based on 37 reports) 16.2%
- Hennepin County(Based on 85 reports) 15.3%
- Minnesota(Based on 652 reports) 8.9%
Clear
- Minneapolis(Based on 37 reports) 86.5%
- Hennepin County(Based on 87 reports) 90.8%
- Minnesota(Based on 665 reports) 88.0%
Rain
- Minneapolis(Based on 37 reports) 8.1%
- Hennepin County(Based on 87 reports) 5.7%
- Minnesota(Based on 665 reports) 5.9%
Snow
- Minneapolis(Based on 37 reports) 2.7%
- Hennepin County(Based on 87 reports) 2.3%
- Minnesota(Based on 665 reports) 3.9%
Cloudy
- Minneapolis(Based on 37 reports) 2.7%
- Hennepin County(Based on 87 reports) 1.1%
- Minnesota(Based on 665 reports) 0.8%
Minneapolis fatal car crash and road traffic accident list for 1975
- Fatal accident count37
- Vehicles involved in fatal accidents49
- Fatal accidents involving drunk persons10
- Fatalities38
- Persons involved in fatal accidents92
Average EMS response time
- Minneapolis(Based on 11 reports) 8.5 mins
- Hennepin County(Based on 30 reports) 8.7 mins
- Minnesota(Based on 255 reports) 9.9 mins
Daylight
- Minneapolis(Based on 37 reports) 54.1%
- Hennepin County(Based on 85 reports) 45.9%
- Minnesota(Based on 652 reports) 45.1%
Dark - Not Lighted
- Minneapolis(Based on 37 reports) 29.7%
- Hennepin County(Based on 85 reports) 36.5%
- Minnesota(Based on 652 reports) 42.6%
Dark - Lighted
- Minneapolis(Based on 37 reports) 16.2%
- Hennepin County(Based on 85 reports) 15.3%
- Minnesota(Based on 652 reports) 8.9%
Clear
- Minneapolis(Based on 37 reports) 86.5%
- Hennepin County(Based on 87 reports) 90.8%
- Minnesota(Based on 665 reports) 88.0%
Rain
- Minneapolis(Based on 37 reports) 8.1%
- Hennepin County(Based on 87 reports) 5.7%
- Minnesota(Based on 665 reports) 5.9%
Snow
- Minneapolis(Based on 37 reports) 2.7%
- Hennepin County(Based on 87 reports) 2.3%
- Minnesota(Based on 665 reports) 3.9%
Cloudy
- Minneapolis(Based on 37 reports) 2.7%
- Hennepin County(Based on 87 reports) 1.1%
- Minnesota(Based on 665 reports) 0.8%