Estimated zip code population in 2022: 15,476 Zip code population in 2010: 13,567 Zip code population in 2000: 12,837
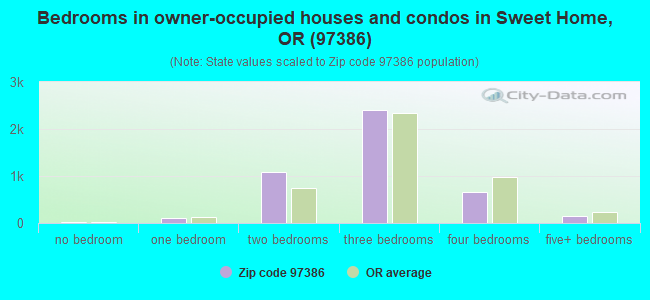
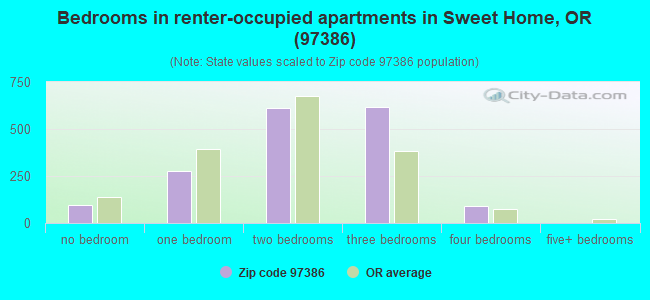
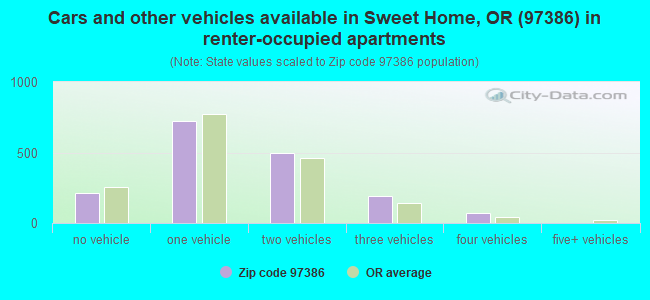
Houses and condos: 6,299 Renter-occupied apartments: 1,700
% of renters here:
28%
State:
37%
March 2022 cost of living index in zip code 97386: 89.7 (less than average, U.S. average is 100)
Land area: 126.8 sq. mi. Water area: 2.0 sq. mi.
Population density: 122 people per square mile
(very low).
OSM Map
General Map
Google Map
MSN Map
OSM Map
General Map
Google Map
MSN Map
OSM Map
General Map
Google Map
MSN Map
OSM Map
General Map
Google Map
MSN Map
Please wait while loading the map...
Real estate property taxes paid for housing units in 2022:
This zip code:
0.8% ($2,471)
Oregon:
0.8% ($3,646)
Median real estate property taxes paid for housing units with mortgages in 2022: $2,538 (0.8%) Median real estate property taxes paid for housing units with no mortgage in 2022: $2,306 (0.6%)
Averages for the 2020 tax year for zip code 97386, filed in 2021:
Average Adjusted Gross Income (AGI) in 2020: $51,861 (Individual Income Tax Returns)
Here:
$51,861
State:
$76,001
Salary/wage: $45,249 (reported on 79.4% of returns)
Here:
$45,249
State:
$61,959
(% of AGI for various income ranges: 1205.7% for AGIs below $25k, 3537.4% for AGIs $25k-50k, 6713.7% for AGIs $50k-75k, 10008.0% for AGIs $75k-100k, 18296.0% for AGIs $100k-200k, 67980.0% for AGIs over 200k)
Taxable interest for individuals: $1,269 (reported on 24.2% of returns)
This zip code:
$1,269
Oregon:
$1,628
(% of AGI for various income ranges: 16.9% for AGIs below $25k, 14.1% for AGIs $25k-50k, 22.7% for AGIs $50k-75k, 48.8% for AGIs $75k-100k, 164.3% for AGIs $100k-200k, 2955.0% for AGIs over 200k)
Ordinary dividends: $3,864 (reported on 10.5% of returns)
Here:
$3,864
State:
$7,165
(% of AGI for various income ranges: 23.5% for AGIs below $25k, 18.5% for AGIs $25k-50k, 33.7% for AGIs $50k-75k, 68.5% for AGIs $75k-100k, 222.7% for AGIs $100k-200k, 3580.0% for AGIs over 200k)
Net capital gain/loss in AGI: +$15,618 (reported on 11.0% of returns)
Here:
+$15,618
State:
+$23,403
(% of AGI for various income ranges: 5.7% for AGIs below $25k, 22.8% for AGIs $25k-50k, 63.6% for AGIs $50k-75k, 198.0% for AGIs $75k-100k, 874.3% for AGIs $100k-200k, 31100.0% for AGIs over 200k)
Profit/loss from business: +$14,429 (reported on 10.4% of returns)
Here:
+$14,429
State:
+$16,511
(% of AGI for various income ranges: 78.2% for AGIs below $25k, 85.2% for AGIs $25k-50k, 154.0% for AGIs $50k-75k, 178.3% for AGIs $75k-100k, 966.3% for AGIs $100k-200k, 10885.0% for AGIs over 200k)
Taxable individual retirement arrangement distribution: $14,843 (reported on 8.7% of returns)
97386:
$14,843
Oregon:
$20,730
(% of AGI for various income ranges: 70.1% for AGIs below $25k, 96.5% for AGIs $25k-50k, 193.6% for AGIs $50k-75k, 382.0% for AGIs $75k-100k, 906.7% for AGIs $100k-200k)
Total itemized deductions: $26,027 (reported on 7.9% of returns)
Here:
$26,027
State:
$31,050
(% of AGI for various income ranges: 50.6% for AGIs below $25k, 145.8% for AGIs $25k-50k, 350.9% for AGIs $50k-75k, 512.2% for AGIs $75k-100k, 1238.3% for AGIs $100k-200k, 8370.0% for AGIs over 200k)
Charity contributions: $7,852 (reported on 4.4% of returns)
Here:
$7,852
State:
$8,791
(% of AGI for various income ranges: 12.4% for AGIs $25k-50k, 21.9% for AGIs $50k-75k, 80.2% for AGIs $75k-100k, 273.7% for AGIs $100k-200k, 3295.0% for AGIs over 200k)
Taxes paid: $7,570 (reported on 7.7% of returns)
97386:
$7,570
State:
$8,487
(% of AGI for various income ranges: 4.8% for AGIs below $25k, 35.5% for AGIs $25k-50k, 116.4% for AGIs $50k-75k, 178.0% for AGIs $75k-100k, 374.0% for AGIs $100k-200k, 1945.0% for AGIs over 200k)
Earned income credit: $2,268 (reported on 18.3% of returns)
Here:
$2,268
State:
$1,977
(% of AGI for various income ranges: 99.9% for AGIs below $25k, 80.8% for AGIs $25k-50k, 2.1% for AGIs $50k-75k)
Percentage of individuals using paid preparers for their 2020 taxes: 94.1%
Here:
94%
State:
93%
(% for various income ranges: 92.3% for AGIs below $25k, 94.1% for AGIs $25k-50k, 95.8% for AGIs $50k-75k, 95.2% for AGIs $75k-100k, 95.1% for AGIs $100k-200k, 100.0% for AGIs over 200k)
Averages for the 2012 tax year for zip code 97386, filed in 2013:
Average Adjusted Gross Income (AGI) in 2012: $42,418 (Individual Income Tax Returns)
Here:
$42,418
State:
$57,845
Salary/wage: $37,528 (reported on 78.0% of returns)
Here:
$37,528
State:
$47,723
(% of AGI for various income ranges: 64.8% for AGIs below $25k, 75.0% for AGIs $25k-50k, 76.1% for AGIs $50k-75k, 77.2% for AGIs $75k-100k, 65.3% for AGIs $100k-200k, 29.2% for AGIs over 200k)
Taxable interest for individuals: $1,444 (reported on 26.4% of returns)
This zip code:
$1,444
Oregon:
$1,848
(% of AGI for various income ranges: 1.7% for AGIs below $25k, 0.8% for AGIs $25k-50k, 0.8% for AGIs $50k-75k, 0.5% for AGIs $75k-100k, 1.0% for AGIs $100k-200k, 0.6% for AGIs over 200k)
Ordinary dividends: $3,045 (reported on 13.1% of returns)
Here:
$3,045
State:
$5,987
(% of AGI for various income ranges: 1.6% for AGIs below $25k, 0.7% for AGIs $25k-50k, 0.5% for AGIs $50k-75k, 0.8% for AGIs $75k-100k, 1.8% for AGIs $100k-200k)
Net capital gain/loss in AGI: +$3,707 (reported on 12.3% of returns)
Here:
+$3,707
State:
+$13,095
(% of AGI for various income ranges: 0.3% for AGIs $25k-50k, 0.5% for AGIs $50k-75k, 0.6% for AGIs $75k-100k, 4.7% for AGIs $100k-200k)
Profit/loss from business: +$9,804 (reported on 12.1% of returns)
Here:
+$9,804
State:
+$13,871
(% of AGI for various income ranges: 4.7% for AGIs below $25k, 2.2% for AGIs $25k-50k, 2.6% for AGIs $50k-75k, 2.5% for AGIs $75k-100k, 3.8% for AGIs $100k-200k)
Taxable individual retirement arrangement distribution: $12,600 (reported on 11.8% of returns)
97386:
$12,600
Oregon:
$16,036
(% of AGI for various income ranges: 4.5% for AGIs below $25k, 2.7% for AGIs $25k-50k, 2.8% for AGIs $50k-75k, 3.1% for AGIs $75k-100k, 6.8% for AGIs $100k-200k)
Total itemized deductions: $19,380 (26% of AGI, reported on 31.9% of returns)
Here:
$19,380
State:
$24,430
Here:
26.4% of AGI
State:
23.2% of AGI
(% of AGI for various income ranges: 14.2% for AGIs below $25k, 11.0% for AGIs $25k-50k, 14.3% for AGIs $50k-75k, 16.4% for AGIs $75k-100k, 17.9% for AGIs $100k-200k, 14.7% for AGIs over 200k)
Charity contributions: $3,456 (reported on 23.0% of returns)
Here:
$3,456
State:
$3,648
(% of AGI for various income ranges: 1.2% for AGIs below $25k, 1.4% for AGIs $25k-50k, 1.7% for AGIs $50k-75k, 1.9% for AGIs $75k-100k, 2.7% for AGIs $100k-200k, 2.8% for AGIs over 200k)
Taxes paid: $6,873 (reported on 31.7% of returns)
97386:
$6,873
State:
$10,269
(% of AGI for various income ranges: 2.2% for AGIs below $25k, 2.8% for AGIs $25k-50k, 4.6% for AGIs $50k-75k, 6.3% for AGIs $75k-100k, 7.9% for AGIs $100k-200k, 9.3% for AGIs over 200k)
Earned income credit: $2,320 (reported on 22.6% of returns)
Here:
$2,320
State:
$2,021
(% of AGI for various income ranges: 7.2% for AGIs below $25k, 1.4% for AGIs $25k-50k)
Percentage of individuals using paid preparers for their 2012 taxes: 51.8%
Here:
52%
State:
47%
(% for various income ranges: 46.9% for AGIs below $25k, 49.6% for AGIs $25k-50k, 55.6% for AGIs $50k-75k, 61.9% for AGIs $75k-100k, 67.9% for AGIs $100k-200k, 100.0% for AGIs over 200k)
Averages for the 2004 tax year for zip code 97386, filed in 2005:
Average Adjusted Gross Income (AGI) in 2004: $35,524 (Individual Income Tax Returns)
Here:
$35,524
State:
$46,788
Salary/wage: $31,743 (reported on 80.4% of returns)
Here:
$31,743
State:
$39,788
(% of AGI for various income ranges: 105.3% for AGIs below $10k, 67.9% for AGIs $10k-25k, 79.6% for AGIs $25k-50k, 79.8% for AGIs $50k-75k, 76.7% for AGIs $75k-100k, 43.0% for AGIs over 100k)
Taxable interest for individuals: $1,837 (reported on 36.1% of returns)
This zip code:
$1,837
Oregon:
$2,126
(% of AGI for various income ranges: 8.5% for AGIs below $10k, 2.8% for AGIs $10k-25k, 1.3% for AGIs $25k-50k, 1.3% for AGIs $50k-75k, 2.0% for AGIs $75k-100k, 1.9% for AGIs over 100k)
Taxable dividends: $1,815 (reported on 17.0% of returns)
Here:
$1,815
State:
$3,427
(% of AGI for various income ranges: 3.9% for AGIs below $10k, 1.3% for AGIs $10k-25k, 0.5% for AGIs $25k-50k, 0.4% for AGIs $50k-75k, 1.0% for AGIs $75k-100k, 1.3% for AGIs over 100k)
Net capital gain/loss: +$8,209 (reported on 16.7% of returns)
Here:
+$8,209
State:
+$12,447
(% of AGI for various income ranges: -2.8% for AGIs below $10k, 0.6% for AGIs $10k-25k, 1.1% for AGIs $25k-50k, 1.3% for AGIs $50k-75k, 2.6% for AGIs $75k-100k, 16.0% for AGIs over 100k)
Profit/loss from business: +$9,210 (reported on 13.7% of returns)
Here:
+$9,210
State:
+$11,682
(% of AGI for various income ranges: 0.7% for AGIs below $10k, 4.8% for AGIs $10k-25k, 2.6% for AGIs $25k-50k, 3.8% for AGIs $50k-75k, 2.4% for AGIs $75k-100k, 4.9% for AGIs over 100k)
IRA payment deduction: $3,250 (reported on 2.8% of returns)
97386:
$3,250
Oregon:
$3,035
(% of AGI for various income ranges: 0.1% for AGIs $10k-25k, 0.3% for AGIs $25k-50k, 0.3% for AGIs $50k-75k, 0.4% for AGIs $75k-100k)
Self-employed pension: $10,000 (reported on 0.3% of returns)
Here:
$10,000
Oregon:
$14,224
Total itemized deductions: $16,149 (26% of AGI, reported on 33.7% of returns)
Here:
$16,149
State:
$20,209
Here:
26.0% of AGI
State:
24.7% of AGI
(% of AGI for various income ranges: 19.9% for AGIs below $10k, 12.0% for AGIs $10k-25k, 13.4% for AGIs $25k-50k, 17.1% for AGIs $50k-75k, 19.3% for AGIs $75k-100k, 14.5% for AGIs over 100k)
Charity contributions deductions: $3,014 (4% of AGI, reported on 25.6% of returns)
Here:
$3,014
State:
$3,145
Here:
4.5% of AGI
State:
3.6% of AGI
(% of AGI for various income ranges: 1.4% for AGIs below $10k, 1.6% for AGIs $10k-25k, 1.5% for AGIs $25k-50k, 1.9% for AGIs $50k-75k, 2.5% for AGIs $75k-100k, 3.8% for AGIs over 100k)
Total tax: $4,506 (reported on 69.0% of returns)
97386:
$4,506
State:
$7,148
(% of AGI for various income ranges: 2.4% for AGIs below $10k, 3.4% for AGIs $10k-25k, 5.9% for AGIs $25k-50k, 7.9% for AGIs $50k-75k, 9.5% for AGIs $75k-100k, 18.6% for AGIs over 100k)
Earned income credit: $1,752 (reported on 18.7% of returns)
Here:
$1,752
State:
$1,605
Percentage of individuals using paid preparers for their 2004 taxes: 58.0%
Here:
58%
State:
53%
(% for various income ranges: 49.2% for AGIs below $10k, 59.2% for AGIs $10k-25k, 57.4% for AGIs $25k-50k, 60.9% for AGIs $50k-75k, 72.5% for AGIs $75k-100k, 74.8% for AGIs over 100k)
Likely homosexual households (counted as self-reported same-sex unmarried-partner households)
Lesbian couples: 0.0% of all households
Gay men: 0.9% of all households
Household received Food Stamps/SNAP in the past 12 months: 1,556 Household did not receive Food Stamps/SNAP in the past 12 months: 4,653
Women who had a birth in the past 12 months: 102 (53 now married, 49 unmarried) Women who did not have a birth in the past 12 months: 2,754 (1,206 now married, 1,543 unmarried)
Housing units in zip code 97386 with a mortgage: 2,734 (113 second mortgage, 119 both second mortgage and home equity loan) Houses without a mortgage: 34
Median monthly owner costs for units with a mortgage: $1,362 Median monthly owner costs for units without a mortgage: $555
Residents with income below the poverty level in 2022:
This zip code:
15.5%
Whole state:
12.1%
Residents with income below 50% of the poverty level in 2022:
This zip code:
6.6%
Whole state:
6.2%
Median number of rooms in houses and condos:
Here:
6.1
State:
6.2
Median number of rooms in apartments:
Here:
4.6
State:
4.0
Notable locations in this zip code not listed on our city pages
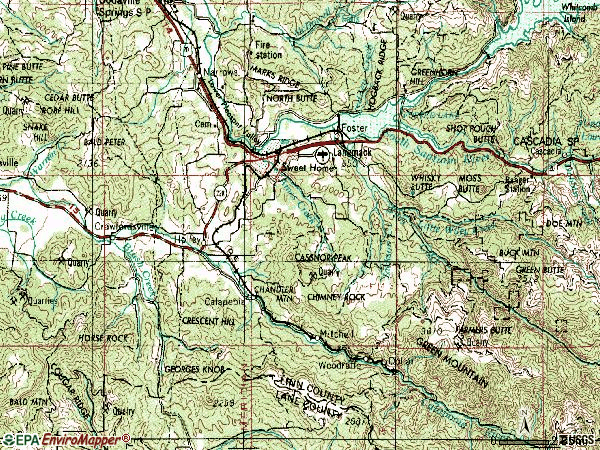
Notable locations in zip code 97386: Oregon Jamboree Outdoor Amphitheatre (A), Mitchell (B), Lewis Creek County Park Boat Access (C), Sweet Home Outdoor Events Center (D), Gedney Creek County Park Boat Ramp (E), Andrew Wiley Park Boat Ramp (F), Ames Creek Boat Ramp (G), Sweet Home Municipal Water Treatment Plant Facility (H), Sweet Home Wastewater Treatment Plant (I), Narrows (J), Woodraffe (K), Boise Cascade Plywood (L), Antique Apple Orchard (M), Sweet Home Fire and Ambulance District Station 21 (N), Linn County Justice Court Sweet Home (O), Sweet Home Fire and Ambulance District Station 22 (P), Sweet Home Fire and Ambulance District Station 23 (Q), Sweet Home Public Works Department Office (R), Sweet Home Municipal Court (S), Sweet Home Library (T). Display/hide their locations on the map
Churches in zip code 97386 include: Church of Jesus Christ of Latter Day Saints (A), Sweet Home Evangelical Church (B). Display/hide their locations on the map
Cemeteries: Wiley Cemetery (1), Ames Cemetery (2), Independent Order of Odd Fellows Cemetery (3), Lewis Cemetery (4), Crawfordsville Union Cemetery (5), Liberty Cemetery (6), Sweet Home Valley Cemetery (7). Display/hide their locations on the map
Lakes and reservoirs: Lutton Pond (A), Johnson Reservoir (B), Peck Reservoir (C), Foster Lake (D), Tollgate Reservoir (E), Renound Reservoir (F), Walker Reservoir (G), Browns Reservoir (H). Display/hide their locations on the map
Streams, rivers, and creeks: Johnson Creek (A), Cotton Creek (B), Ames Creek (C), Carrie Fork (D), Middle Santiam River (E), Gedney Creek (F), Jackson Creek (G), Lewis Creek (H), McDowell Creek (I). Display/hide their locations on the map
Parks in zip code 97386 include: Ashbrook Park (1), Strawberry Hill Park (2), Andrew Wiley Park (3), Lewis Creek County Park (4), Osage Park (5), Sweet Home City park (6), Gedney Creek County Park (7), Northside Park (8), McClun Wayside County Park (9). Display/hide their locations on the map
1,407 married couples with children.
916 single-parent households (348 men, 568 women).
95.5% of residents of 97386 zip code speak English at home.
2.4% of residents speak Spanish at home (97% very well, 3% well).
1.5% of residents speak other Indo-European language at home (91% very well, 9% well).
0.5% of residents speak Asian or Pacific Island language at home (80% very well, 20% well).
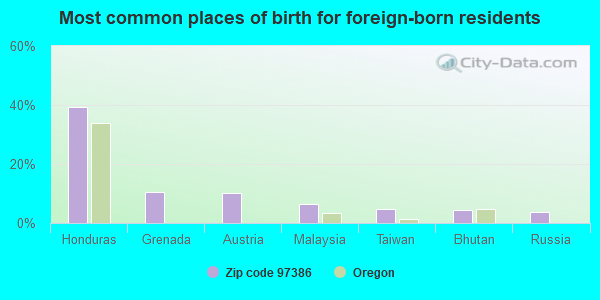
Foreign born population: 432 (2.8%) (54.8% of them are naturalized citizens)
This zip code:
2.8%
Whole state:
9.9%
39%Honduras
11%Grenada
10%Austria
6%Malaysia
5%Taiwan
4%Bhutan
4%Russia
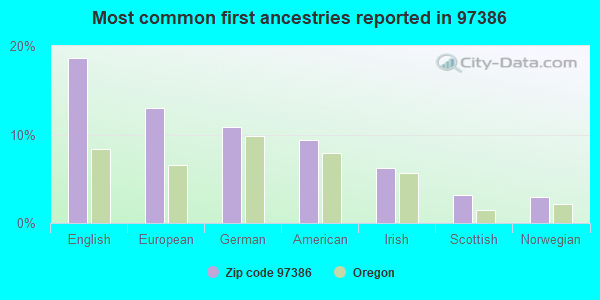
19%English
13%European
11%German
9%American
6%Irish
3%Scottish
3%Norwegian
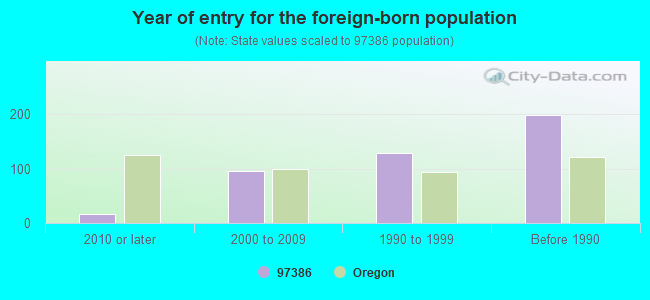
Year of entry for the foreign-born population
172010 or later
962000 to 2009
1291990 to 1999
199Before 1990
Facilities with environmental interests located in this zip code:
FULLMER LUMBER COMPANY (2210 TAMARACK STREET in SWEET HOME, OR)
(Integrated Compliance Information System) - ICIS-10-1998-0113, FORMAL ENFORCEMENT ACTION STATE MASTER (Oregon inspections and permits database) - OR-ACSIS-227128, AIR PROGRAM, OR-ECSI-347, SUPERFUND, ACSIS-227128-, AIR PROGRAM (Resource Conservation and Recovery Act (tracking hazardous waste)) TRI REPORTER (Tracking of toxic chemicals releasing facilities) Business SIC classification: SAWMILLS AND PLANING MILLS, GENERAL; SOFTWOOD VENEER AND PLYWOOD; PULP MILLS; STEAM AND AIR-CONDITIONING SUPPLY Business NAICS classification: SAWMILLS.; SAWMILLS.; HARDWOOD VENEER AND PLYWOOD MANUFACTURING.; SOFTWOOD VENEER AND PLYWOOD MANUFACTURING.; CUT STOCK, RESAWING LUMBER, AND PLANING.; OTHER MILLWORK (INCLUDING FLOORING ).; ALL OTHER MISCELLANEOUS WOOD PRODUCT MANUFACTURING. Organizations: BAKER ROCK CRUSHING CO. (CONTACT/GENERAL)
, TOSCO MARKETING, CIRCLE K, DC-36 (CONTACT/GENERAL)
, WEYERHAEUSER COPMANY (CONTACT/OPERATOR)
, WEYERHAEUSER COMPANY (CONTACT/OWNER)
Alternative names: FULLER LUMBER CO, SWEET HOME - WILLAMETTE INDUSTRIES, WILLAMETTE IND INC SWEET HOME, WILLAMETTE INDS. INC. SWEET HOME PLYWOOD, WILLAMETTE IND INC SWEET HOME
HAWTHORNE ELEM. SCHOOL (3205 E LONG ST in SWEET HOME, OR)
(National Center for Education Statistics) - STATE ID-663 Organizations: SWEET HOME SCH DIST 055 (SCHOOL DISTRICT)
CLEAR LUMBER MFG CORP (1460 N 47TH AVE in SWEET HOME, OR)
(Resource Conservation and Recovery Act (tracking hazardous waste)) Business NAICS classification: SAWMILLS. Alternative names: CLEAR LUMBER COMPANY
CASCADE LAUNDRY (1030 LONG ST in SWEET HOME, OR)
CRITERIA AND HAZARDOUS AIR POLLUTANT INVENTORY (Inventory of air pollution sources) (Resource Conservation and Recovery Act (tracking hazardous waste)) Alternative names: CASCADE CLEANERS & LAUNDRY
FLY GUARD SYSTEMS INC (PO BOX 805 in SWEET HOME, OR)
COMPLIANCE ACTIVITY (Tracking inspections of insecticide, fungicide, and rodenticide, and toxic substances)
Housing units lacking complete plumbing facilities: 0.6% Housing units lacking complete kitchen facilities: 1.7%
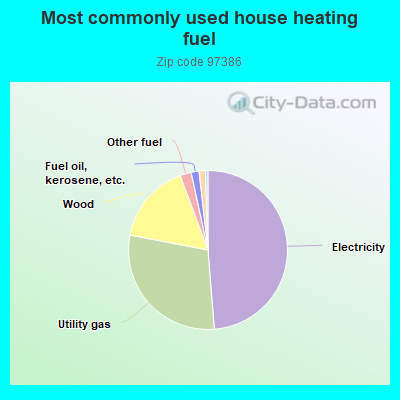
48.8%Electricity
29.3%Utility gas
16.3%Wood
2.3%Other fuel
1.6%Fuel oil, kerosene, etc.
1.3%Bottled, tank, or LP gas
0.5%No fuel used
Population in 1990: 11,237. Population change in the 1990s: +1,600 (+14.2%).
Place of birth for U.S.-born residents:
This state: 8,387
Northeast: 262
Midwest: 1,053
South: 421
West: 4,869
51% of the 97386 zip code residents lived in the same house 5 years ago. Out of people who lived in different houses, 62% lived in this county. Out of people who lived in different counties, 50% lived in Oregon.
87% of the 97386 zip code residents lived in the same house 1 year ago. Out of people who lived in different houses, 65% moved from this county. Out of people who lived in different houses, 25% moved from different county within same state. Out of people who lived in different houses, 9% moved from different state.
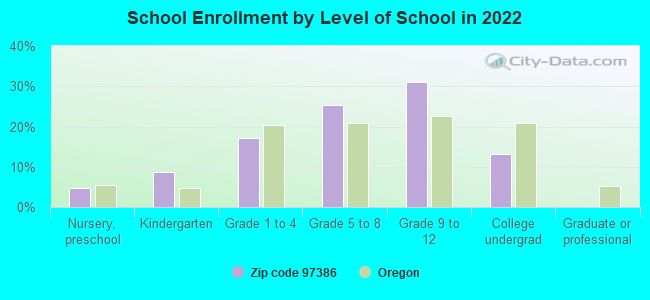
Private vs. public school enrollment:
Students in private schools in grades 1 to 8 (elementary and middle school): 102
Here:
8.4%
Oregon:
13.7%
Students in private schools in grades 9 to 12 (high school): 30
Here:
3.4%
Oregon:
8.8%
Students in private undergraduate colleges: 13
Here:
3.7%
Oregon:
17.7%
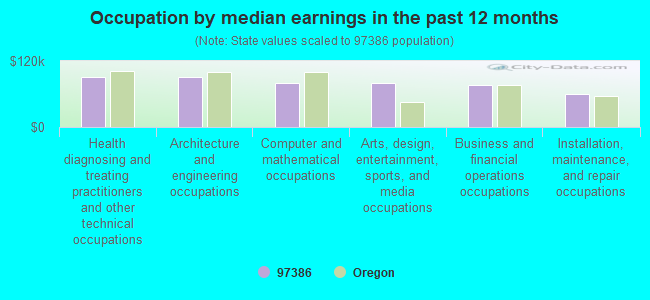
Occupation by median earnings in the past 12 months ($)
91,410Health diagnosing and treating practitioners and other technical occupations
90,679Architecture and engineering occupations
80,797Computer and mathematical occupations
79,963Arts, design, entertainment, sports, and media occupations
77,032Business and financial operations occupations
59,743Installation, maintenance, and repair occupations
Companies with federal contracts located in this zip code:
WASTE CONNECTION INC (1001 LONG ST in SWEET HOME, OR; small business) : $48,174 in 16 contractsfrom 2000 to 2005
Contracts for Trash/Garbage Collection Services - Including Portable Sanitation Services by Army, U.S. Army Corps of Engineers - civil program financing only Signed by year:2000: $3,935; 2001: $3,935; 2002: $4,351; 2003: $20; 2004: $14,590; 2005: $21,343; 2006: $0.
Biggest contracts:
$6,599 with Army for Trash/Garbage Collection Services - Including Portable Sanitation Services. Signed on 2005-12-29. Completion date: 2006-12-31.
$6,255 with U.S. Army Corps of Engineers - civil program financing only for Trash/Garbage Collection Services - Including Portable Sanitation Services. Signed on 2005-03-15. Completion date: 2005-12-31.
$6,255 with Army for Trash/Garbage Collection Services - Including Portable Sanitation Services. Signed on 2005-03-15. Completion date: 2005-12-31.
$4,468, same as above.Signed on 2004-03-26. Completion date: 2005-12-31.
LESTER SALES INC (1602 18TH AVE in SWEET HOME, OR; small business)
$3,955 with Army for Lumber and Related Basic Wood Materials. Signed on 2006-06-21. Completion date: 2006-06-30.
NEXT GENERATION ENGINEERING (4610 HWY 20 SUITE 5 in SWEET HOME, OR; small business) : $0 in 2 contractsin 2005
$35,000 with Army for Miscellaneous Special Industry Machinery. Signed on 2005-04-27. Completion date: 2005-06-01.
-$35,000, same as above.Signed on 2005-05-17. Completion date: 2005-06-01.
Top industries in this zip code by the number of employees in 2005:
Other Services (except Public Administration): Religious Organizations (20-49: 1, 1-4: 12)
People in group quarters in 2010:
31 people in nursing facilities/skilled-nursing facilities
16 people in workers' group living quarters and job corps centers
15 people in residential treatment centers for adults
11 people in other noninstitutional facilities
10 people in group homes intended for adults
7 people in emergency and transitional shelters (with sleeping facilities) for people experiencing homelessness
People in group quarters in 2000:
61 people in nursing homes
9 people in other noninstitutional group quarters
Fatal accident statistics in 2013:
Fatal accident count: 3
Vehicles involved in fatal accidents: 4
Fatal accidents caused by drunken drivers: 1
Fatalities: 3
Persons involved in fatal accidents: 7
Pedestrians involved in fatal accidents: 1
Fatal accident statistics in 2012:
Fatal accident count: 1
Vehicles involved in fatal accidents: 1
Fatal accidents caused by drunken drivers: 0
Fatalities: 1
Persons involved in fatal accidents: 1
Pedestrians involved in fatal accidents: 1
2002 - 2018 National Fire Incident Reporting System (NFIRS) incidents
Based on the data from the years 2002 - 2018 the average number of fires per year is 48. The highest number of reported fire incidents - 66 took place in 2003, and the least - 8 in 2017. The data has a decreasing trend.
When looking into fire subcategories, the most incidents belonged to: Structure Fires (45.8%), and Outside Fires (29.2%).
Fire incident types reported to NFIRS in Zip Code 97386


 Nearest zip codes: 97345, 97454, 97355, 97327, 97489, 97478.


 Based on the data from the years 2002 - 2018 the average number of fires per year is 48. The highest number of reported fire incidents - 66 took place in 2003, and the least - 8 in 2017. The data has a decreasing trend.
 When looking into fire subcategories, the most incidents belonged to: Structure Fires (45.8%), and Outside Fires (29.2%).