Estimated zip code population in 2022: 4,440 Zip code population in 2010: 4,985 Zip code population in 2000: 2,955
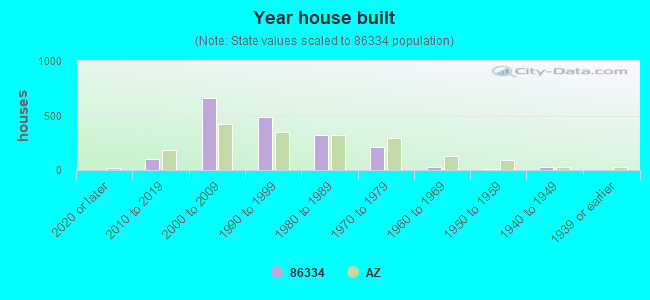
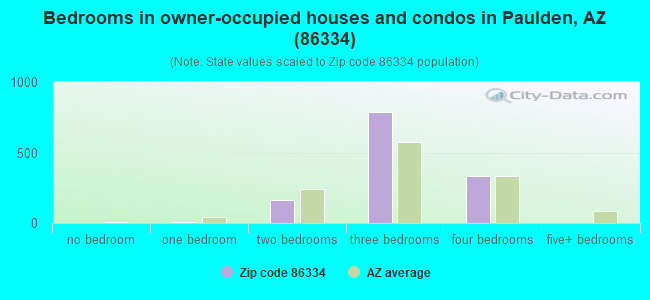
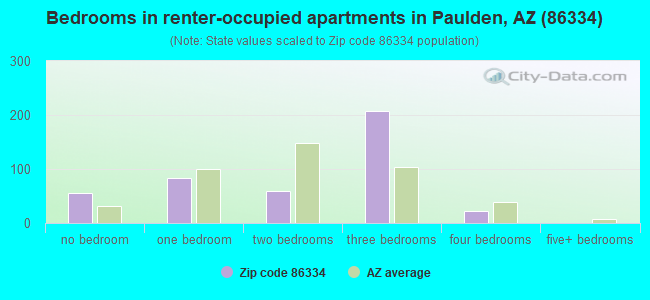
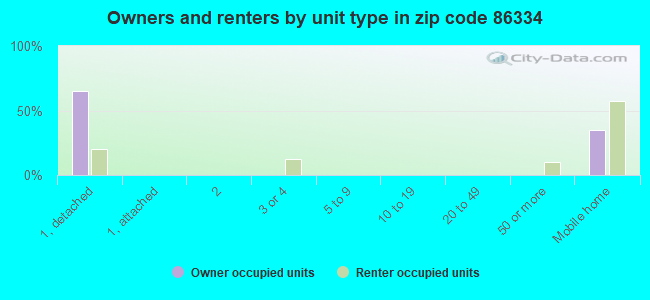
Houses and condos: 1,940 Renter-occupied apartments: 426
% of renters here:
25%
State:
33%
March 2022 cost of living index in zip code 86334: 86.8 (less than average, U.S. average is 100)
Land area: 227.2 sq. mi. Water area: 0.0 sq. mi.
Population density: 20 people per square mile
(very low).
OSM Map
General Map
Google Map
MSN Map
OSM Map
General Map
Google Map
MSN Map
OSM Map
General Map
Google Map
MSN Map
OSM Map
General Map
Google Map
MSN Map
Please wait while loading the map...
Real estate property taxes paid for housing units in 2022:
This zip code:
0.3% ($1,231)
Arizona:
0.4% ($1,786)
Median real estate property taxes paid for housing units with mortgages in 2022: $896 (0.3%) Median real estate property taxes paid for housing units with no mortgage in 2022: $1,916 (0.4%)
Averages for the 2020 tax year for zip code 86334, filed in 2021:
Average Adjusted Gross Income (AGI) in 2020: $52,246 (Individual Income Tax Returns)
Here:
$52,246
State:
$73,499
Salary/wage: $41,822 (reported on 75.1% of returns)
Here:
$41,822
State:
$59,499
(% of AGI for various income ranges: 1138.0% for AGIs below $25k, 3704.1% for AGIs $25k-50k, 6359.5% for AGIs $50k-75k, 10163.3% for AGIs $75k-100k, 12614.0% for AGIs $100k-200k)
Taxable interest for individuals: $1,224 (reported on 21.1% of returns)
This zip code:
$1,224
Arizona:
$2,325
(% of AGI for various income ranges: 14.5% for AGIs below $25k, 16.7% for AGIs $25k-50k, 25.9% for AGIs $50k-75k, 35.6% for AGIs $75k-100k, 148.0% for AGIs $100k-200k)
Ordinary dividends: $5,375 (reported on 11.3% of returns)
Here:
$5,375
State:
$8,711
(% of AGI for various income ranges: 13.1% for AGIs below $25k, 28.2% for AGIs $25k-50k, 53.6% for AGIs $50k-75k, 117.8% for AGIs $75k-100k, 856.0% for AGIs $100k-200k)
Net capital gain/loss in AGI: +$24,700 (reported on 12.2% of returns)
Here:
+$24,700
State:
+$31,332
(% of AGI for various income ranges: 18.4% for AGIs below $25k, 30.8% for AGIs $25k-50k, 120.0% for AGIs $50k-75k, 273.3% for AGIs $75k-100k, 715.0% for AGIs $100k-200k)
Profit/loss from business: +$7,936 (reported on 15.5% of returns)
Here:
+$7,936
State:
+$13,214
(% of AGI for various income ranges: 157.5% for AGIs below $25k, 162.2% for AGIs $25k-50k, 238.6% for AGIs $50k-75k, 270.0% for AGIs $75k-100k, 190.0% for AGIs $100k-200k)
Taxable individual retirement arrangement distribution: $16,760 (reported on 9.4% of returns)
86334:
$16,760
Arizona:
$23,364
(% of AGI for various income ranges: 78.0% for AGIs below $25k, 83.5% for AGIs $25k-50k, 212.7% for AGIs $50k-75k, 465.6% for AGIs $75k-100k, 1627.0% for AGIs $100k-200k)
Total itemized deductions: $29,990 (reported on 4.7% of returns)
Here:
$29,990
State:
$36,308
(% of AGI for various income ranges: 120.9% for AGIs below $25k, 353.6% for AGIs $50k-75k, 1556.0% for AGIs $100k-200k)
Charity contributions: $4,471 (reported on 3.3% of returns)
Here:
$4,471
State:
$11,955
(% of AGI for various income ranges: 18.2% for AGIs $25k-50k, 224.0% for AGIs $100k-200k)
Taxes paid: $5,380 (reported on 4.7% of returns)
86334:
$5,380
State:
$6,820
(% of AGI for various income ranges: 15.3% for AGIs below $25k, 63.6% for AGIs $50k-75k, 314.0% for AGIs $100k-200k)
Earned income credit: $2,415 (reported on 21.6% of returns)
Here:
$2,415
State:
$2,383
(% of AGI for various income ranges: 121.1% for AGIs below $25k, 90.8% for AGIs $25k-50k)
Percentage of individuals using paid preparers for their 2020 taxes: 95.3%
Here:
95%
State:
93%
(% for various income ranges: 94.9% for AGIs below $25k, 95.3% for AGIs $25k-50k, 97.0% for AGIs $50k-75k, 93.8% for AGIs $75k-100k, 94.4% for AGIs $100k-200k, 100.0% for AGIs over 200k)
Averages for the 2012 tax year for zip code 86334, filed in 2013:
Average Adjusted Gross Income (AGI) in 2012: $35,392 (Individual Income Tax Returns)
Here:
$35,392
State:
$57,644
Salary/wage: $30,650 (reported on 75.8% of returns)
Here:
$30,650
State:
$47,932
(% of AGI for various income ranges: 72.7% for AGIs below $25k, 72.6% for AGIs $25k-50k, 71.3% for AGIs $50k-75k, 60.7% for AGIs $75k-100k, 46.3% for AGIs $100k-200k)
Taxable interest for individuals: $663 (reported on 24.2% of returns)
This zip code:
$663
Arizona:
$2,064
(% of AGI for various income ranges: 0.8% for AGIs below $25k, 0.6% for AGIs $25k-50k, 0.3% for AGIs $50k-75k, 0.4% for AGIs $100k-200k)
Ordinary dividends: $3,400 (reported on 10.2% of returns)
Here:
$3,400
State:
$7,268
(% of AGI for various income ranges: 1.1% for AGIs below $25k, 0.9% for AGIs $25k-50k, 0.5% for AGIs $50k-75k, 2.2% for AGIs $100k-200k)
Net capital gain/loss in AGI: +$175 (reported on 10.2% of returns)
Here:
+$175
State:
+$15,530
(% of AGI for various income ranges: 0.1% for AGIs $50k-75k, 1.0% for AGIs $100k-200k)
Profit/loss from business: +$4,743 (reported on 14.6% of returns)
Here:
+$4,743
State:
+$12,323
(% of AGI for various income ranges: 6.5% for AGIs below $25k, 3.1% for AGIs $25k-50k, 0.1% for AGIs $50k-75k)
Taxable individual retirement arrangement distribution: $12,712 (reported on 10.2% of returns)
86334:
$12,712
Arizona:
$18,280
(% of AGI for various income ranges: 2.4% for AGIs below $25k, 1.7% for AGIs $25k-50k, 8.4% for AGIs $50k-75k, 4.7% for AGIs $100k-200k)
Total itemized deductions: $18,884 (31% of AGI, reported on 23.6% of returns)
Here:
$18,884
State:
$23,651
Here:
30.6% of AGI
State:
20.6% of AGI
(% of AGI for various income ranges: 9.7% for AGIs below $25k, 10.7% for AGIs $25k-50k, 14.0% for AGIs $50k-75k, 13.0% for AGIs $75k-100k, 16.1% for AGIs $100k-200k)
Charity contributions: $2,268 (reported on 17.8% of returns)
Here:
$2,268
State:
$4,114
(% of AGI for various income ranges: 0.7% for AGIs below $25k, 0.9% for AGIs $25k-50k, 0.9% for AGIs $50k-75k, 1.7% for AGIs $75k-100k, 1.8% for AGIs $100k-200k)
Taxes paid: $4,072 (reported on 22.9% of returns)
86334:
$4,072
State:
$6,509
(% of AGI for various income ranges: 1.3% for AGIs below $25k, 1.5% for AGIs $25k-50k, 3.0% for AGIs $50k-75k, 3.6% for AGIs $75k-100k, 4.4% for AGIs $100k-200k)
Earned income credit: $2,385 (reported on 25.5% of returns)
Here:
$2,385
State:
$2,432
(% of AGI for various income ranges: 7.1% for AGIs below $25k, 1.5% for AGIs $25k-50k)
Percentage of individuals using paid preparers for their 2012 taxes: 56.1%
Here:
56%
State:
52%
(% for various income ranges: 55.7% for AGIs below $25k, 56.1% for AGIs $25k-50k, 55.0% for AGIs $50k-75k, 55.6% for AGIs $75k-100k, 62.5% for AGIs $100k-200k)
Averages for the 2004 tax year for zip code 86334, filed in 2005:
Average Adjusted Gross Income (AGI) in 2004: $33,008 (Individual Income Tax Returns)
Here:
$33,008
State:
$50,097
Salary/wage: $29,701 (reported on 80.0% of returns)
Here:
$29,701
State:
$42,146
(% of AGI for various income ranges: 119.3% for AGIs below $10k, 75.2% for AGIs $10k-25k, 82.7% for AGIs $25k-50k, 72.7% for AGIs $50k-75k, 68.6% for AGIs $75k-100k, 42.1% for AGIs over 100k)
Taxable interest for individuals: $1,785 (reported on 34.0% of returns)
This zip code:
$1,785
Arizona:
$2,374
(% of AGI for various income ranges: 10.4% for AGIs below $10k, 1.6% for AGIs $10k-25k, 0.6% for AGIs $25k-50k, 0.7% for AGIs $50k-75k, 0.5% for AGIs $75k-100k, 6.3% for AGIs over 100k)
Taxable dividends: $2,133 (reported on 14.7% of returns)
Here:
$2,133
State:
$3,888
(% of AGI for various income ranges: 6.2% for AGIs below $10k, 0.9% for AGIs $10k-25k, 0.3% for AGIs $25k-50k, 1.4% for AGIs $50k-75k, 0.4% for AGIs $75k-100k, 1.3% for AGIs over 100k)
Net capital gain/loss: +$6,971 (reported on 14.0% of returns)
Here:
+$6,971
State:
+$17,569
(% of AGI for various income ranges: -2.3% for AGIs below $10k, 0.7% for AGIs $10k-25k, 1.0% for AGIs $25k-50k, 2.1% for AGIs $50k-75k, 13.0% for AGIs over 100k)
Profit/loss from business: +$2,956 (reported on 18.4% of returns)
Here:
+$2,956
State:
+$11,088
(% of AGI for various income ranges: 5.8% for AGIs below $10k, 4.6% for AGIs $10k-25k, 1.4% for AGIs $25k-50k, 1.3% for AGIs $50k-75k, -0.1% for AGIs $75k-100k, 0.5% for AGIs over 100k)
IRA payment deduction: $2,929 (reported on 2.3% of returns)
86334:
$2,929
Arizona:
$3,023
Total itemized deductions: $16,865 (30% of AGI, reported on 31.4% of returns)
Here:
$16,865
State:
$19,781
Here:
30.4% of AGI
State:
21.8% of AGI
(% of AGI for various income ranges: 28.5% for AGIs below $10k, 12.7% for AGIs $10k-25k, 13.7% for AGIs $25k-50k, 17.6% for AGIs $50k-75k, 20.9% for AGIs $75k-100k, 16.9% for AGIs over 100k)
Charity contributions deductions: $2,232 (4% of AGI, reported on 25.7% of returns)
Here:
$2,232
State:
$3,389
Here:
3.8% of AGI
State:
3.5% of AGI
(% of AGI for various income ranges: 2.0% for AGIs below $10k, 1.3% for AGIs $10k-25k, 1.2% for AGIs $25k-50k, 2.1% for AGIs $50k-75k, 2.0% for AGIs $75k-100k, 2.6% for AGIs over 100k)
Total tax: $3,921 (reported on 64.8% of returns)
86334:
$3,921
State:
$8,323
(% of AGI for various income ranges: 3.7% for AGIs below $10k, 3.1% for AGIs $10k-25k, 4.9% for AGIs $25k-50k, 7.9% for AGIs $50k-75k, 9.5% for AGIs $75k-100k, 17.1% for AGIs over 100k)
Earned income credit: $1,613 (reported on 21.3% of returns)
Here:
$1,613
State:
$1,786
Percentage of individuals using paid preparers for their 2004 taxes: 67.1%
Here:
67%
State:
60%
(% for various income ranges: 59.7% for AGIs below $10k, 66.8% for AGIs $10k-25k, 69.5% for AGIs $25k-50k, 67.9% for AGIs $50k-75k, 75.6% for AGIs $75k-100k, 86.1% for AGIs over 100k)
Household received Food Stamps/SNAP in the past 12 months: 160 Household did not receive Food Stamps/SNAP in the past 12 months: 1,550
Women who did not have a birth in the past 12 months: 818 (288 now married, 531 unmarried)
Housing units in zip code 86334 with a mortgage: 798 (59 second mortgage) Median monthly owner costs for units with a mortgage: $1,374 Median monthly owner costs for units without a mortgage: $464
Residents with income below the poverty level in 2022:
This zip code:
10.6%
Whole state:
12.5%
Residents with income below 50% of the poverty level in 2022:
This zip code:
7.7%
Whole state:
6.0%
Median number of rooms in houses and condos:
Here:
6.0
State:
6.0
Median number of rooms in apartments:
Here:
3.8
State:
4.1
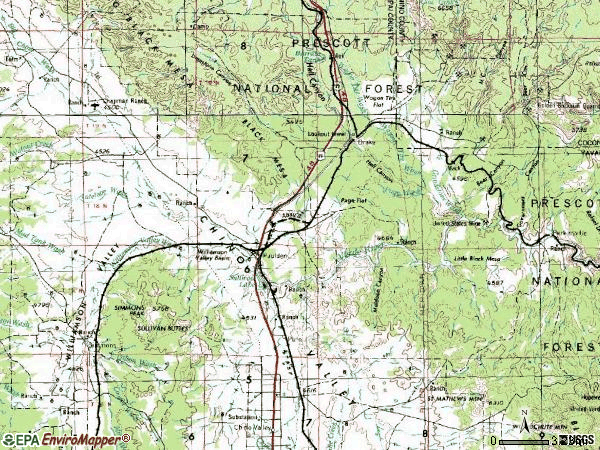
Notable locations in this zip code not listed on our city pages
Notable locations in zip code 86334: Wineglass Ranch (A), Pollocks Substation (B), Morgan Ranch and Headquarters (C), Glidden Windmill (D), K 4 Farms (E), Abra Railroad Station (F), Drake Railroad Station (G), Kayfour Railroad Station (H), Puro Railroad Station (I), Chino Valley Fire District Station 63 (J). Display/hide their locations on the map
Reservoirs: Cement Tank (A), King Tanks (B), Fritsche Tank (C), Sullivan Lake (D), AGF Trick Tank (E), Wineglass Tank (F), Pump Tank (G), Eddy Tank (H). Display/hide their locations on the map
Streams, rivers, and creeks: Granite Creek (A), Antelope Wash (B), Williamson Valley Wash (C), Pine Creek (D), Walnut Creek (E), Big Chino Wash (F). Display/hide their locations on the map
Size of family households: 615 2-persons, 258 3-persons, 129 4-persons, 65 5-persons, 65 6-persons, 100 7-or-more-persons
Size of nonfamily households: 397 1-person, 74 2-persons
657 married couples with children.
175 single-parent households (63 men, 112 women).
79.4% of residents of 86334 zip code speak English at home.
16.8% of residents speak Spanish at home (69% very well, 10% well, 21% not well).
2.3% of residents speak other Indo-European language at home (100% very well).
1.2% of residents speak Asian or Pacific Island language at home (56% very well, 44% well).
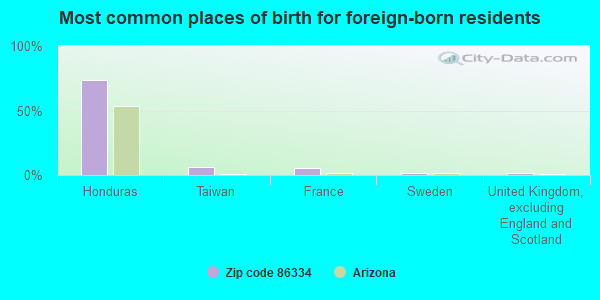
Foreign born population: 489 (11.0%) (71.6% of them are naturalized citizens)
This zip code:
11.0%
Whole state:
13.1%
74%Honduras
6%Taiwan
6%France
2%Sweden
2%United Kingdom, excluding England and Scotland
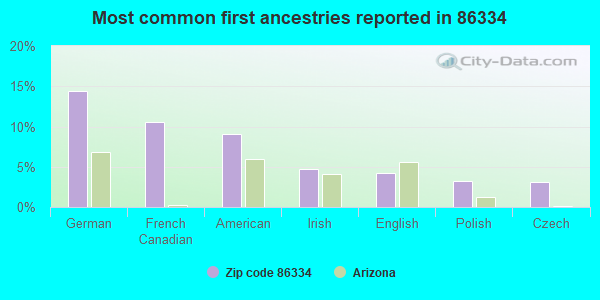
14%German
11%French Canadian
9%American
5%Irish
4%English
3%Polish
3%Czech
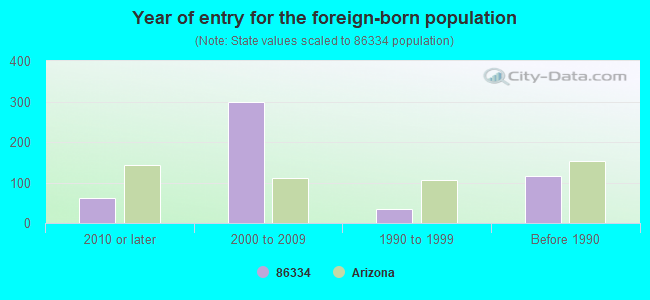
Year of entry for the foreign-born population
622010 or later
2982000 to 2009
351990 to 1999
115Before 1990
Facilities with environmental interests located in this zip code:
DELLS VIEW WATER CO (PO BOX 316 in PAULDEN, AZ)
(Integrated Compliance Information System) - ICIS-09-2000-0078, FORMAL ENFORCEMENT ACTION Business SIC classification: WATER SUPPLY
Housing units lacking complete plumbing facilities: 1.0% Housing units lacking complete kitchen facilities: 1.5%
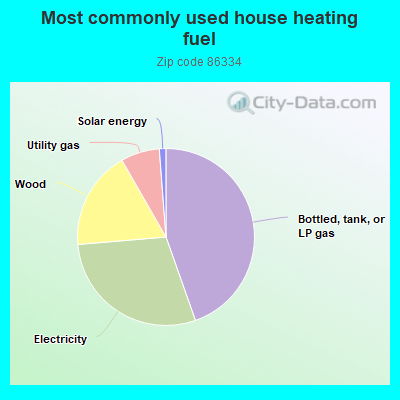
44.7%Bottled, tank, or LP gas
29.1%Electricity
18.1%Wood
7.1%Utility gas
1.2%Solar energy
Population in 1990: 24. Population change in the 1990s: +2,931 (+12212.5%).
Place of birth for U.S.-born residents:
This state: 2,314
Northeast: 338
Midwest: 410
South: 211
West: 632
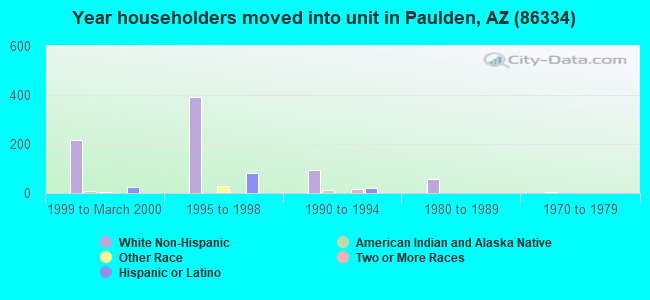
34% of the 86334 zip code residents lived in the same house 5 years ago. Out of people who lived in different houses, 43% lived in this county. Out of people who lived in different counties, 50% lived in Arizona.
92% of the 86334 zip code residents lived in the same house 1 year ago. Out of people who lived in different houses, 55% moved from this county. Out of people who lived in different houses, 16% moved from different county within same state. Out of people who lived in different houses, 34% moved from different state.
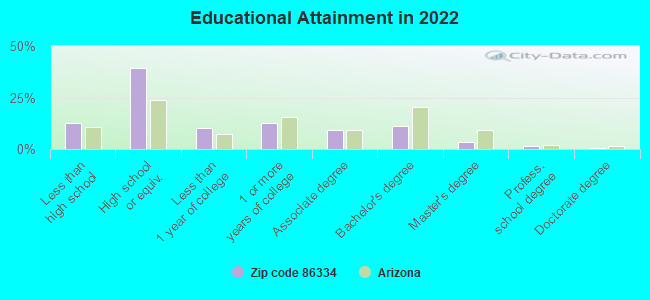
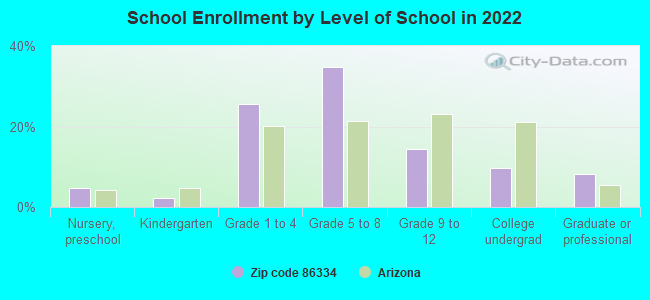
Private vs. public school enrollment:
Students in private schools in grades 1 to 8 (elementary and middle school):
Here:
0.0%
Arizona:
10.4%
Students in private schools in grades 9 to 12 (high school): 85
Here:
52.1%
Arizona:
8.8%
Students in private undergraduate colleges: 14
Here:
13.3%
Arizona:
13.1%
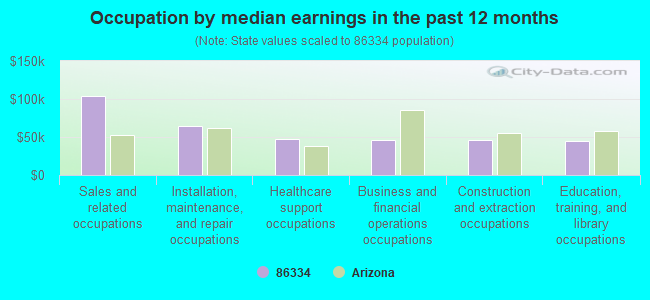
Occupation by median earnings in the past 12 months ($)
103,571Sales and related occupations
64,464Installation, maintenance, and repair occupations
47,713Healthcare support occupations
46,250Business and financial operations occupations
46,148Construction and extraction occupations
44,786Education, training, and library occupations
Companies with federal contracts located in this zip code:
GUNSITE ACADEMY INC (2900 W GUNSITE ROAD in PAULDEN, AZ; small business) : $193,938 in 9 contractsfrom 2003 to 2006
Contracts for Training/Curriculum Development, Training Aids, Lease or Rental of Facilities -- Other Non-Building Facilities, Construction of Structures and Facilities -- Schools, and moreby Army Signed by year:2000: $0; 2001: $0; 2002: $0; 2003: $7,380; 2004: $124,778; 2005: $20,000; 2006: $41,780.
Biggest contracts:
$102,000 with Army for Training/Curriculum Development. Signed on 2004-09-17. Completion date: 2004-09-17.
$41,780 with Army for Training Aids. Signed on 2006-01-10. Completion date: 2005-11-14.
$20,000 with Army for Lease or Rental of Facilities -- Other Non-Building Facilities. Signed on 2005-01-20. Completion date: 2005-09-30.
$9,996 with Army for Construction of Structures and Facilities -- Schools. Signed on 2004-11-30. Completion date: 2004-12-10.
GUNSITE ACADEMY INC (2900 W GUNSITE RD in PAULDEN, AZ; small business) : $97,288 in 3 contractsin 2005
$61,600 with Navy for Education Services. Signed on 2005-08-15. Completion date: 2005-08-29.
$24,938 with Department of Defense for Operation Training Devices. Signed on 2005-06-02. Completion date: 2005-06-14.
$10,750 with Department of Defense for Armament Training Devices. Signed on 2005-08-01. Completion date: 2005-09-23.
Top industries in this zip code by the number of employees in 2005:
Educational Services: Sports and Recreation Instruction (20-49 employees: 1 establishment)
Construction: Drywall and Insulation Contractors (10-19: 2, 1-4: 1)
Construction: New Single-Family Housing Construction (except Operative Builders) (10-19: 1, 1-4: 7)
Construction: Site Preparation Contractors (10-19: 1, 1-4: 3)
Administrative and Support and Waste Management and Remediation Services: Landscaping Services (10-19: 1, 1-4: 1)
Construction: Power and Communication Line and Related Structures Construction (10-19: 1)
Construction: Plumbing, Heating, and Air-Conditioning Contractors (5-9: 1, 1-4: 3)
Mining: Construction Sand and Gravel Mining (5-9: 1)
Fatal accident statistics in 2014:
Fatal accident count: 1
Vehicles involved in fatal accidents: 2
Fatal accidents caused by drunken drivers: 0
Fatalities: 2
Persons involved in fatal accidents: 4
Pedestrians involved in fatal accidents: 0
Fatal accident statistics in 2011:
Fatal accident count: 1
Vehicles involved in fatal accidents: 2
Fatal accidents caused by drunken drivers: 0
Fatalities: 2
Persons involved in fatal accidents: 2
Pedestrians involved in fatal accidents: 0
Home Mortgage Disclosure Act Aggregated Statistics For Year 2009 (Based on 6 partial tracts)
A) FHA, FSA/RHS & VA Home Purchase Loans
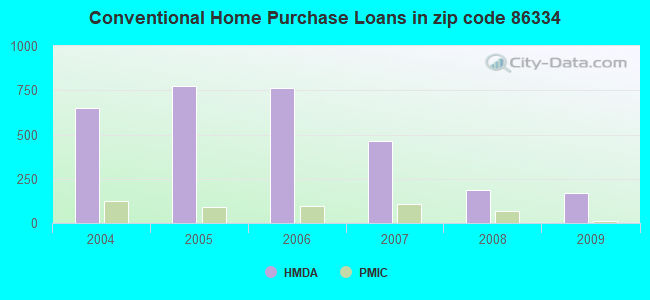
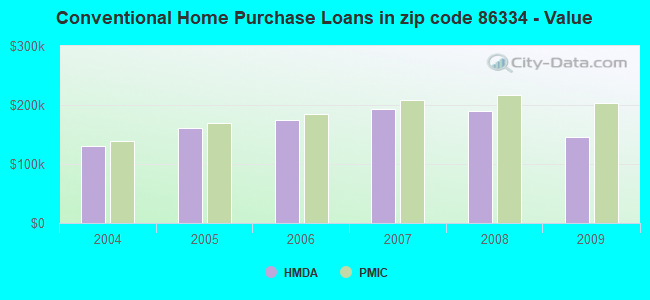
B) Conventional Home Purchase Loans
C) Refinancings
D) Home Improvement Loans
F) Non-occupant Loans on < 5 Family Dwellings (A B C & D)
G) Loans On Manufactured Home Dwelling (A B C & D)
Number
Average Value
Number
Average Value
Number
Average Value
Number
Average Value
Number
Average Value
Number
Average Value
LOANS ORIGINATED
117
$151,432
170
$145,640
605
$177,436
20
$88,055
79
$157,008
154
$123,557
APPLICATIONS APPROVED, NOT ACCEPTED
5
$205,052
9
$221,276
75
$188,943
3
$90,200
8
$164,768
17
$110,435
APPLICATIONS DENIED
32
$146,032
35
$143,070
320
$195,683
23
$103,584
37
$187,654
83
$114,391
APPLICATIONS WITHDRAWN
24
$135,305
28
$134,658
155
$193,462
11
$156,408
13
$186,865
34
$127,194
FILES CLOSED FOR INCOMPLETENESS
2
$110,445
9
$149,662
35
$179,045
8
$172,905
3
$98,000
15
$100,129
Aggregated Statistics For Year 2008 (Based on 6 partial tracts)
A) FHA, FSA/RHS & VA Home Purchase Loans
B) Conventional Home Purchase Loans
C) Refinancings
D) Home Improvement Loans
E) Loans on Dwellings For 5+ Families
F) Non-occupant Loans on < 5 Family Dwellings (A B C & D)
G) Loans On Manufactured Home Dwelling (A B C & D)
Number
Average Value
Number
Average Value
Number
Average Value
Number
Average Value
Number
Average Value
Number
Average Value
Number
Average Value
LOANS ORIGINATED
113
$165,541
186
$189,217
489
$185,072
41
$113,308
0
$0
76
$184,309
241
$130,770
APPLICATIONS APPROVED, NOT ACCEPTED
5
$166,838
32
$153,467
83
$189,351
4
$79,870
0
$0
13
$215,798
27
$106,109
APPLICATIONS DENIED
36
$146,453
69
$220,338
382
$202,322
61
$133,387
0
$0
39
$190,445
169
$113,485
APPLICATIONS WITHDRAWN
13
$179,763
20
$218,754
190
$189,245
22
$137,060
1
$150,720
23
$210,572
61
$126,729
FILES CLOSED FOR INCOMPLETENESS
3
$159,453
1
$192,750
55
$197,968
9
$66,709
0
$0
3
$219,570
25
$121,283
Aggregated Statistics For Year 2007 (Based on 6 partial tracts)
A) FHA, FSA/RHS & VA Home Purchase Loans
B) Conventional Home Purchase Loans
C) Refinancings
D) Home Improvement Loans
F) Non-occupant Loans on < 5 Family Dwellings (A B C & D)
G) Loans On Manufactured Home Dwelling (A B C & D)
Number
Average Value
Number
Average Value
Number
Average Value
Number
Average Value
Number
Average Value
Number
Average Value
LOANS ORIGINATED
66
$178,245
464
$193,849
672
$189,168
62
$122,115
133
$201,499
326
$126,910
APPLICATIONS APPROVED, NOT ACCEPTED
7
$197,104
72
$176,954
146
$193,929
22
$74,335
25
$205,644
57
$123,700
APPLICATIONS DENIED
19
$158,217
106
$173,920
505
$188,205
106
$71,152
62
$164,379
227
$110,685
APPLICATIONS WITHDRAWN
5
$217,856
56
$162,960
204
$199,869
21
$133,997
21
$171,313
54
$127,263
FILES CLOSED FOR INCOMPLETENESS
0
$0
9
$193,594
76
$215,146
11
$123,307
3
$254,957
14
$100,340
Aggregated Statistics For Year 2006 (Based on 6 partial tracts)
A) FHA, FSA/RHS & VA Home Purchase Loans
B) Conventional Home Purchase Loans
C) Refinancings
D) Home Improvement Loans
F) Non-occupant Loans on < 5 Family Dwellings (A B C & D)
G) Loans On Manufactured Home Dwelling (A B C & D)
Number
Average Value
Number
Average Value
Number
Average Value
Number
Average Value
Number
Average Value
Number
Average Value
LOANS ORIGINATED
121
$159,412
761
$174,726
776
$182,018
113
$109,771
202
$182,908
401
$119,880
APPLICATIONS APPROVED, NOT ACCEPTED
7
$124,141
113
$173,086
121
$179,899
28
$90,354
25
$168,755
46
$112,136
APPLICATIONS DENIED
24
$179,945
162
$165,102
495
$173,710
130
$63,044
32
$181,691
246
$104,873
APPLICATIONS WITHDRAWN
22
$153,484
93
$167,258
251
$192,876
31
$110,875
21
$137,187
71
$121,795
FILES CLOSED FOR INCOMPLETENESS
0
$0
15
$171,092
86
$216,468
5
$102,330
5
$243,076
12
$130,594
Aggregated Statistics For Year 2005 (Based on 6 partial tracts)
A) FHA, FSA/RHS & VA Home Purchase Loans
B) Conventional Home Purchase Loans
C) Refinancings
D) Home Improvement Loans
E) Loans on Dwellings For 5+ Families
F) Non-occupant Loans on < 5 Family Dwellings (A B C & D)
G) Loans On Manufactured Home Dwelling (A B C & D)
Number
Average Value
Number
Average Value
Number
Average Value
Number
Average Value
Number
Average Value
Number
Average Value
Number
Average Value
LOANS ORIGINATED
74
$124,797
775
$160,343
719
$160,455
113
$96,726
2
$135,760
221
$157,748
354
$101,652
APPLICATIONS APPROVED, NOT ACCEPTED
11
$123,534
96
$144,191
102
$127,154
17
$86,831
0
$0
26
$174,779
47
$102,017
APPLICATIONS DENIED
14
$135,312
182
$145,348
540
$135,917
97
$71,063
0
$0
53
$169,358
254
$95,788
APPLICATIONS WITHDRAWN
3
$180,483
117
$137,956
222
$149,619
49
$130,198
0
$0
34
$119,381
72
$88,848
FILES CLOSED FOR INCOMPLETENESS
2
$148,100
30
$150,331
176
$162,028
5
$114,028
0
$0
4
$133,658
45
$106,669
Aggregated Statistics For Year 2004 (Based on 6 partial tracts)
A) FHA, FSA/RHS & VA Home Purchase Loans
B) Conventional Home Purchase Loans
C) Refinancings
D) Home Improvement Loans
F) Non-occupant Loans on < 5 Family Dwellings (A B C & D)
G) Loans On Manufactured Home Dwelling (A B C & D)

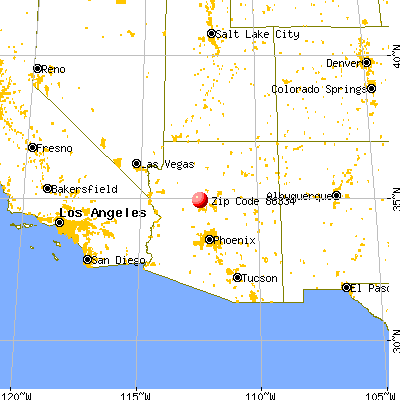


 Nearest zip codes: 86323, 86315, 86305, 86301, 86314, 86313.