Estimated zip code population in 2022: 37,251 Zip code population in 2010: 29,821 Zip code population in 2000: 34,886
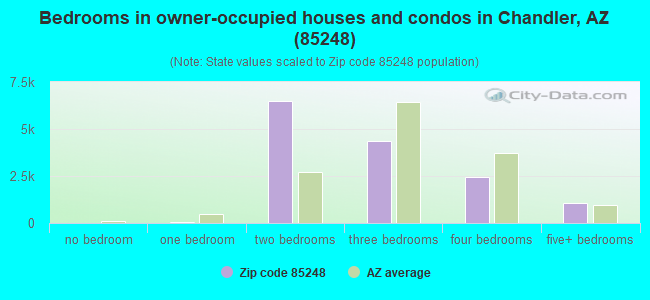
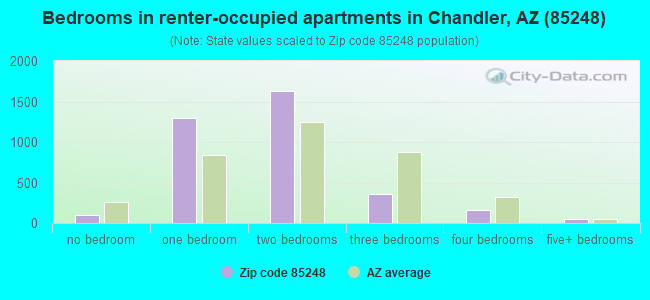
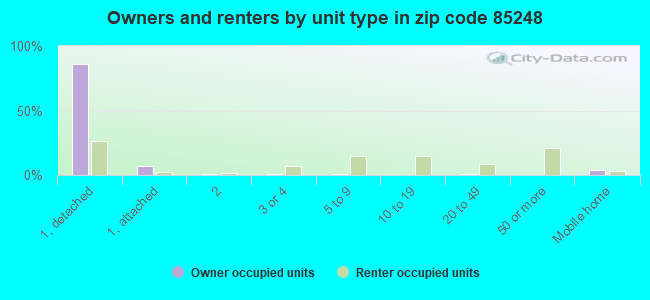
Houses and condos: 20,267 Renter-occupied apartments: 3,628
% of renters here:
20%
State:
33%
March 2022 cost of living index in zip code 85248: 102.4 (near average, U.S. average is 100)
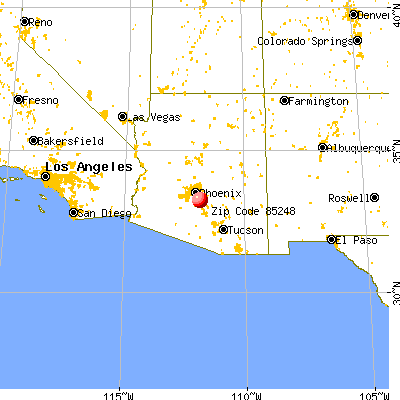
Land area: 30.2 sq. mi. Water area: 0.1 sq. mi.
Population density: 1,232 people per square mile
(low).
OSM Map
General Map
Google Map
MSN Map
OSM Map
General Map
Google Map
MSN Map
OSM Map
General Map
Google Map
MSN Map
OSM Map
General Map
Google Map
MSN Map
Please wait while loading the map...
Real estate property taxes paid for housing units in 2022:
This zip code:
0.5% ($2,748)
Arizona:
0.4% ($1,786)
Median real estate property taxes paid for housing units with mortgages in 2022: $2,804 (0.5%) Median real estate property taxes paid for housing units with no mortgage in 2022: $2,658 (0.5%)
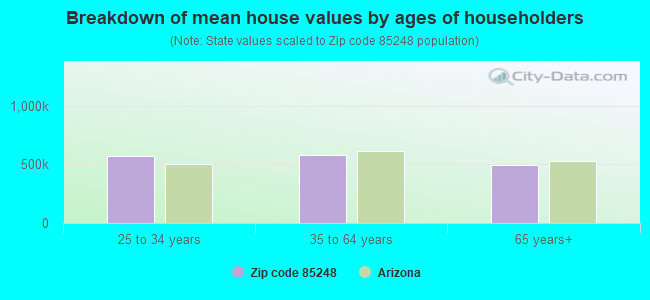
Estimated median house/condo value in 2022: $549,432
85248:
$549,432
Arizona:
$402,800
According to our research of Arizona and other state lists, there were 17 registered sex offenders living in 85248 zip code as of June 10, 2024. The ratio of all residents to sex offenders in zip code 85248 is 1,909 to 1. The ratio of registered sex offenders to all residents in this zip code is much lower than the state average.
Median resident age:
This zip code:
59.4 years
Arizona median age:
38.8 years
Average household size:
This zip code:
2.1 people
Arizona:
2.5 people
Averages for the 2020 tax year for zip code 85248, filed in 2021:
Average Adjusted Gross Income (AGI) in 2020: $128,837 (Individual Income Tax Returns)
Here:
$128,837
State:
$73,499
Salary/wage: $100,307 (reported on 63.4% of returns)
Here:
$100,307
State:
$59,499
(% of AGI for various income ranges: 1012.0% for AGIs below $25k, 2929.1% for AGIs $25k-50k, 5163.2% for AGIs $50k-75k, 7859.8% for AGIs $75k-100k, 16313.1% for AGIs $100k-200k, 85568.0% for AGIs over 200k)
Taxable interest for individuals: $3,289 (reported on 48.2% of returns)
This zip code:
$3,289
Arizona:
$2,325
(% of AGI for various income ranges: 52.5% for AGIs below $25k, 67.4% for AGIs $25k-50k, 118.7% for AGIs $50k-75k, 174.0% for AGIs $75k-100k, 265.5% for AGIs $100k-200k, 2512.4% for AGIs over 200k)
Ordinary dividends: $8,278 (reported on 41.9% of returns)
Here:
$8,278
State:
$8,711
(% of AGI for various income ranges: 115.3% for AGIs below $25k, 165.7% for AGIs $25k-50k, 342.4% for AGIs $50k-75k, 470.4% for AGIs $75k-100k, 899.9% for AGIs $100k-200k, 4201.7% for AGIs over 200k)
Net capital gain/loss in AGI: +$48,930 (reported on 40.3% of returns)
Here:
+$48,930
State:
+$31,332
(% of AGI for various income ranges: 39.4% for AGIs below $25k, 88.0% for AGIs $25k-50k, 237.5% for AGIs $50k-75k, 490.1% for AGIs $75k-100k, 1306.6% for AGIs $100k-200k, 46685.6% for AGIs over 200k)
Profit/loss from business: +$17,438 (reported on 14.4% of returns)
Here:
+$17,438
State:
+$13,214
(% of AGI for various income ranges: 96.7% for AGIs below $25k, 177.1% for AGIs $25k-50k, 213.1% for AGIs $50k-75k, 370.6% for AGIs $75k-100k, 570.5% for AGIs $100k-200k, 3103.7% for AGIs over 200k)
Taxable individual retirement arrangement distribution: $25,579 (reported on 24.1% of returns)
85248:
$25,579
Arizona:
$23,364
(% of AGI for various income ranges: 219.6% for AGIs below $25k, 464.5% for AGIs $25k-50k, 858.9% for AGIs $50k-75k, 1440.8% for AGIs $75k-100k, 2219.6% for AGIs $100k-200k, 3670.7% for AGIs over 200k)
Self-employed (Keogh) retirement plans: $25,213 (reported on 0.8% of returns)
85248:
$25,213
Arizona:
$26,938
(% of AGI for various income ranges: 17.0% for AGIs $25k-50k, 37.8% for AGIs $100k-200k, 373.9% for AGIs over 200k)
Total itemized deductions: $36,707 (reported on 16.8% of returns)
Here:
$36,707
State:
$36,308
(% of AGI for various income ranges: 178.8% for AGIs below $25k, 336.7% for AGIs $25k-50k, 567.8% for AGIs $50k-75k, 879.4% for AGIs $75k-100k, 1552.5% for AGIs $100k-200k, 7586.2% for AGIs over 200k)
Charity contributions: $10,932 (reported on 14.7% of returns)
Here:
$10,932
State:
$11,955
(% of AGI for various income ranges: 11.3% for AGIs below $25k, 44.3% for AGIs $25k-50k, 80.8% for AGIs $50k-75k, 138.6% for AGIs $75k-100k, 357.4% for AGIs $100k-200k, 2663.8% for AGIs over 200k)
Taxes paid: $7,314 (reported on 16.7% of returns)
85248:
$7,314
State:
$6,820
(% of AGI for various income ranges: 25.1% for AGIs below $25k, 55.7% for AGIs $25k-50k, 99.0% for AGIs $50k-75k, 190.6% for AGIs $75k-100k, 371.1% for AGIs $100k-200k, 1394.4% for AGIs over 200k)
Earned income credit: $1,820 (reported on 4.4% of returns)
Here:
$1,820
State:
$2,383
(% of AGI for various income ranges: 38.5% for AGIs below $25k, 24.2% for AGIs $25k-50k)
Percentage of individuals using paid preparers for their 2020 taxes: 92.1%
Here:
92%
State:
93%
(% for various income ranges: 89.3% for AGIs below $25k, 92.8% for AGIs $25k-50k, 92.1% for AGIs $50k-75k, 91.8% for AGIs $75k-100k, 93.4% for AGIs $100k-200k, 93.8% for AGIs over 200k)
Averages for the 2012 tax year for zip code 85248, filed in 2013:
Average Adjusted Gross Income (AGI) in 2012: $91,927 (Individual Income Tax Returns)
Here:
$91,927
State:
$57,644
Salary/wage: $80,409 (reported on 62.9% of returns)
Here:
$80,409
State:
$47,932
(% of AGI for various income ranges: 46.7% for AGIs below $25k, 48.5% for AGIs $25k-50k, 47.9% for AGIs $50k-75k, 47.0% for AGIs $75k-100k, 62.2% for AGIs $100k-200k, 55.2% for AGIs over 200k)
Taxable interest for individuals: $3,213 (reported on 55.8% of returns)
This zip code:
$3,213
Arizona:
$2,064
(% of AGI for various income ranges: 3.9% for AGIs below $25k, 2.4% for AGIs $25k-50k, 1.8% for AGIs $50k-75k, 1.3% for AGIs $75k-100k, 1.0% for AGIs $100k-200k, 2.8% for AGIs over 200k)
Ordinary dividends: $7,568 (reported on 44.0% of returns)
Here:
$7,568
State:
$7,268
(% of AGI for various income ranges: 7.3% for AGIs below $25k, 4.3% for AGIs $25k-50k, 3.5% for AGIs $50k-75k, 3.7% for AGIs $75k-100k, 2.5% for AGIs $100k-200k, 4.1% for AGIs over 200k)
Net capital gain/loss in AGI: +$9,872 (reported on 40.9% of returns)
Here:
+$9,872
State:
+$15,530
(% of AGI for various income ranges: 0.4% for AGIs $25k-50k, 0.7% for AGIs $50k-75k, 1.1% for AGIs $75k-100k, 1.9% for AGIs $100k-200k, 10.1% for AGIs over 200k)
Profit/loss from business: +$14,427 (reported on 14.5% of returns)
Here:
+$14,427
State:
+$12,323
(% of AGI for various income ranges: 5.5% for AGIs below $25k, 2.6% for AGIs $25k-50k, 2.3% for AGIs $50k-75k, 1.9% for AGIs $75k-100k, 2.0% for AGIs $100k-200k, 2.3% for AGIs over 200k)
Taxable individual retirement arrangement distribution: $20,314 (reported on 29.9% of returns)
85248:
$20,314
Arizona:
$18,280
(% of AGI for various income ranges: 13.5% for AGIs below $25k, 10.1% for AGIs $25k-50k, 8.9% for AGIs $50k-75k, 9.2% for AGIs $75k-100k, 7.1% for AGIs $100k-200k, 3.3% for AGIs over 200k)
Self-employment retirement plans: $21,709 (reported on 0.7% of returns)
85248:
$21,709
Arizona:
$22,154
(% of AGI for various income ranges: 0.2% for AGIs $50k-75k, 0.2% for AGIs $100k-200k, 0.3% for AGIs over 200k)
Total itemized deductions: $25,780 (19% of AGI, reported on 52.1% of returns)
Here:
$25,780
State:
$23,651
Here:
19.1% of AGI
State:
20.6% of AGI
(% of AGI for various income ranges: 29.0% for AGIs below $25k, 18.3% for AGIs $25k-50k, 15.8% for AGIs $50k-75k, 15.2% for AGIs $75k-100k, 14.6% for AGIs $100k-200k, 12.0% for AGIs over 200k)
Charity contributions: $4,182 (reported on 47.0% of returns)
Here:
$4,182
State:
$4,114
(% of AGI for various income ranges: 2.3% for AGIs below $25k, 2.0% for AGIs $25k-50k, 2.0% for AGIs $50k-75k, 2.3% for AGIs $75k-100k, 2.1% for AGIs $100k-200k, 2.2% for AGIs over 200k)
Taxes paid: $7,523 (reported on 51.9% of returns)
85248:
$7,523
State:
$6,509
(% of AGI for various income ranges: 5.1% for AGIs below $25k, 3.7% for AGIs $25k-50k, 3.4% for AGIs $50k-75k, 3.8% for AGIs $75k-100k, 4.3% for AGIs $100k-200k, 4.6% for AGIs over 200k)
Earned income credit: $1,647 (reported on 5.0% of returns)
Here:
$1,647
State:
$2,432
(% of AGI for various income ranges: 2.0% for AGIs below $25k, 0.3% for AGIs $25k-50k)
Percentage of individuals using paid preparers for their 2012 taxes: 56.5%
Here:
56%
State:
52%
(% for various income ranges: 49.0% for AGIs below $25k, 53.2% for AGIs $25k-50k, 60.1% for AGIs $50k-75k, 58.2% for AGIs $75k-100k, 59.0% for AGIs $100k-200k, 71.0% for AGIs over 200k)
Averages for the 2004 tax year for zip code 85248, filed in 2005:
Average Adjusted Gross Income (AGI) in 2004: $78,002 (Individual Income Tax Returns)
Here:
$78,002
State:
$50,097
Salary/wage: $65,660 (reported on 73.4% of returns)
Here:
$65,660
State:
$42,146
(% of AGI for various income ranges: 175.0% for AGIs below $10k, 54.3% for AGIs $10k-25k, 61.9% for AGIs $25k-50k, 62.9% for AGIs $50k-75k, 69.6% for AGIs $75k-100k, 59.3% for AGIs over 100k)
Taxable interest for individuals: $2,843 (reported on 63.6% of returns)
This zip code:
$2,843
Arizona:
$2,374
(% of AGI for various income ranges: 25.4% for AGIs below $10k, 5.2% for AGIs $10k-25k, 3.0% for AGIs $25k-50k, 2.4% for AGIs $50k-75k, 1.6% for AGIs $75k-100k, 2.1% for AGIs over 100k)
Taxable dividends: $3,413 (reported on 44.5% of returns)
Here:
$3,413
State:
$3,888
(% of AGI for various income ranges: 21.7% for AGIs below $10k, 5.1% for AGIs $10k-25k, 3.3% for AGIs $25k-50k, 2.3% for AGIs $50k-75k, 1.9% for AGIs $75k-100k, 1.4% for AGIs over 100k)
Net capital gain/loss: +$13,973 (reported on 40.4% of returns)
Here:
+$13,973
State:
+$17,569
(% of AGI for various income ranges: -4.3% for AGIs below $10k, 0.2% for AGIs $10k-25k, 0.8% for AGIs $25k-50k, 1.4% for AGIs $50k-75k, 2.2% for AGIs $75k-100k, 11.4% for AGIs over 100k)
Profit/loss from business: +$13,033 (reported on 15.3% of returns)
Here:
+$13,033
State:
+$11,088
(% of AGI for various income ranges: -0.3% for AGIs below $10k, 4.4% for AGIs $10k-25k, 2.6% for AGIs $25k-50k, 2.4% for AGIs $50k-75k, 1.7% for AGIs $75k-100k, 2.7% for AGIs over 100k)
IRA payment deduction: $3,448 (reported on 3.2% of returns)
85248:
$3,448
Arizona:
$3,023
(% of AGI for various income ranges: 0.6% for AGIs below $10k, 0.2% for AGIs $10k-25k, 0.3% for AGIs $25k-50k, 0.2% for AGIs $50k-75k, 0.2% for AGIs $75k-100k, 0.1% for AGIs over 100k)
Self-employed pension: $13,491 (reported on 1.1% of returns)
Here:
$13,491
Arizona:
$15,785
(% of AGI for various income ranges: 0.5% for AGIs below $10k, 0.1% for AGIs $25k-50k, 0.2% for AGIs $50k-75k, 0.1% for AGIs $75k-100k, 0.2% for AGIs over 100k)
Total itemized deductions: $22,163 (20% of AGI, reported on 58.9% of returns)
Here:
$22,163
State:
$19,781
Here:
20.1% of AGI
State:
21.8% of AGI
(% of AGI for various income ranges: 82.5% for AGIs below $10k, 26.6% for AGIs $10k-25k, 19.5% for AGIs $25k-50k, 19.4% for AGIs $50k-75k, 19.0% for AGIs $75k-100k, 14.1% for AGIs over 100k)
Charity contributions deductions: $3,380 (3% of AGI, reported on 54.6% of returns)
Here:
$3,380
State:
$3,389
Here:
3.0% of AGI
State:
3.5% of AGI
(% of AGI for various income ranges: 4.6% for AGIs below $10k, 2.3% for AGIs $10k-25k, 2.3% for AGIs $25k-50k, 2.6% for AGIs $50k-75k, 2.3% for AGIs $75k-100k, 2.3% for AGIs over 100k)
Total tax: $13,408 (reported on 84.6% of returns)
85248:
$13,408
State:
$8,323
(% of AGI for various income ranges: 5.7% for AGIs below $10k, 3.9% for AGIs $10k-25k, 7.0% for AGIs $25k-50k, 9.3% for AGIs $50k-75k, 10.3% for AGIs $75k-100k, 18.7% for AGIs over 100k)
Earned income credit: $1,402 (reported on 4.8% of returns)
Here:
$1,402
State:
$1,786
Percentage of individuals using paid preparers for their 2004 taxes: 58.1%
Here:
58%
State:
60%
(% for various income ranges: 51.6% for AGIs below $10k, 58.4% for AGIs $10k-25k, 56.8% for AGIs $25k-50k, 60.2% for AGIs $50k-75k, 55.7% for AGIs $75k-100k, 62.3% for AGIs over 100k)
Likely homosexual households (counted as self-reported same-sex unmarried-partner households)
Lesbian couples: 0.1% of all households
Gay men: 0.4% of all households
Household received Food Stamps/SNAP in the past 12 months: 282 Household did not receive Food Stamps/SNAP in the past 12 months: 17,747
Women who had a birth in the past 12 months: 226 (232 now married, 0 unmarried) Women who did not have a birth in the past 12 months: 5,398 (2,426 now married, 2,962 unmarried)
Housing units in zip code 85248 with a mortgage: 8,503 (629 second mortgage, 585 both second mortgage and home equity loan) Houses without a mortgage: 183
Median monthly owner costs for units with a mortgage: $1,882 Median monthly owner costs for units without a mortgage: $527
Residents with income below the poverty level in 2022:
This zip code:
6.3%
Whole state:
12.5%
Residents with income below 50% of the poverty level in 2022:
This zip code:
1.8%
Whole state:
6.0%
Median number of rooms in houses and condos:
Here:
6.0
State:
6.0
Median number of rooms in apartments:
Here:
3.8
State:
4.1
Notable locations in this zip code not listed on our city pages
Notable locations in zip code 85248: Cottonwood Country Club Golf Course (A), Sun Lakes Golf Course (B), Maricopa County Library District Ed Robson Branch (C), Chandler Public Library Hamilton Branch (D), Chandler Fire Training Center (E), Sun Lakes Fire District (F), Chandler Fire Department Station 285 (G). Display/hide their locations on the map
Churches in zip code 85248 include: First Baptist Church of Sun Lakes (A), Desert Palms Presbyterian Church (B), Sun Lakes United Methodist Church (C), Risen Savior Lutheran Church (D), Saint Stevens Catholic Church (E), United Church of Sun Lakes (F). Display/hide their locations on the map
3,787 married couples with children.
970 single-parent households (576 men, 394 women).
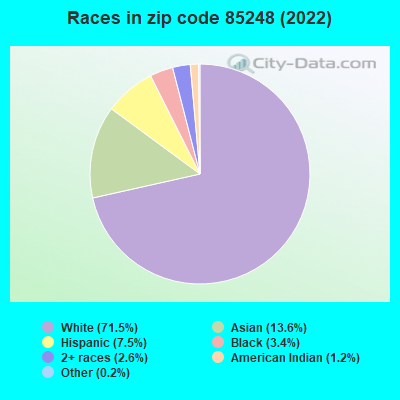
85.1% of residents of 85248 zip code speak English at home.
4.5% of residents speak Spanish at home (84% very well, 7% well, 10% not well).
3.9% of residents speak other Indo-European language at home (83% very well, 9% well, 6% not well, 2% not at all).
7.6% of residents speak Asian or Pacific Island language at home (66% very well, 22% well, 8% not well, 4% not at all).
0.5% of residents speak other language at home (73% very well, 27% well).
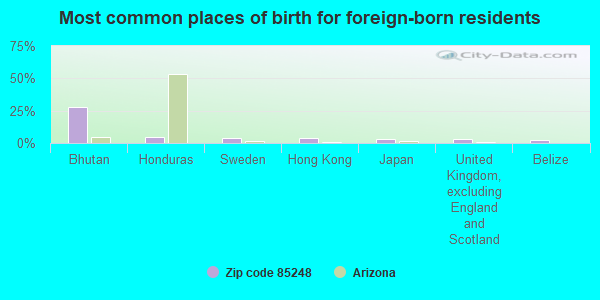
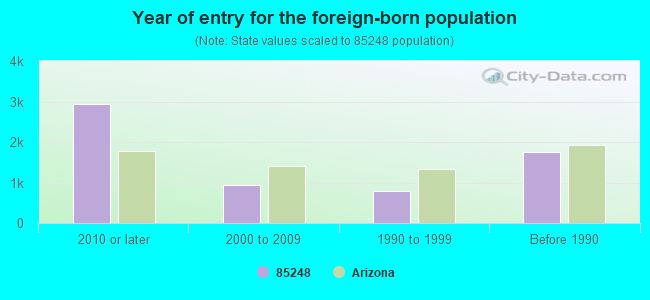
Foreign born population: 5,545 (14.9%) (55.9% of them are naturalized citizens)
This zip code:
14.9%
Whole state:
13.1%
28%Bhutan
5%Honduras
4%Sweden
3%Hong Kong
3%Japan
3%United Kingdom, excluding England and Scotland
3%Belize
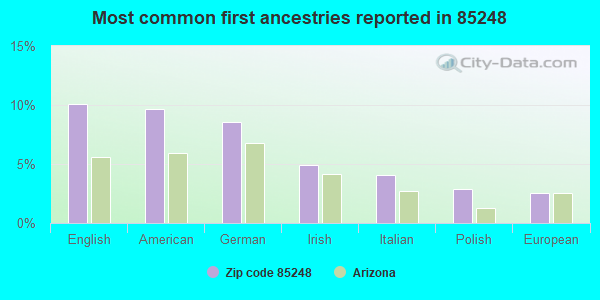
10%English
10%American
9%German
5%Irish
4%Italian
3%Polish
3%European
Year of entry for the foreign-born population
2,9442010 or later
9422000 to 2009
7961990 to 1999
1,760Before 1990
Major facilities with environmental interests located in this zip code:
ALMA RANCHETTES (797 W GERMANN RD in CHANDLER, AZ)
(Integrated Compliance Information System) - ICIS-09-2000-0202, FORMAL ENFORCEMENT ACTION, ICIS-09-2005-0250, ENFORCEMENT/COMPLIANCE ACTIVITY COMMUNITY WATER SYSTEM (SDWIS) Business SIC classification: WATER SUPPLY
ANNA MARIE JACOBSON ELEMENTARY SCHOOL (1515 NW JACARANDA PKWY in CHANDLER, AZ)
(National Center for Education Statistics) - STATE ID-112 Organizations: CHANDLER UNIFIED DISTRICT (SCHOOL DISTRICT)
BASHA ELEMENTARY (3535 S. BASHA RD. in CHANDLER, AZ)
(National Center for Education Statistics) - STATE ID-129 Organizations: CHANDLER UNIFIED DISTRICT (SCHOOL DISTRICT)
BOGLE JUNIOR HIGH SCHOOL (1600 W QUEEN CREEK RD in CHANDLER, AZ)
(National Center for Education Statistics) - STATE ID-120 Organizations: CHANDLER UNIFIED DISTRICT (SCHOOL DISTRICT)
HAMILTON HIGH SCHOOL (3700 S ARIZONA AVE in CHANDLER, AZ)
(National Center for Education Statistics) - STATE ID-223 Organizations: CHANDLER UNIFIED DISTRICT (SCHOOL DISTRICT)
DELTA AND PINE LAND COMPANY (INTERSECTION RIGGS ROAD AND MARICOPA ROAD in CHANDLER, AZ) . Tribal Land
(Integrated Compliance Information System) - ICIS-09-2003-0223, FORMAL ENFORCEMENT ACTION
AIRCRAFT GEAR CORP ARIZONA DIV (1800 S PRICE in CHANDLER, AZ)
(Resource Conservation and Recovery Act (tracking hazardous waste)) Business NAICS classification: OTHER AIRCRAFT PARTS AND AUXILIARY EQUIPMENT MANUFACTURING.
FORM OIL SPECIALTIES (1199 W RAVEN DR in CHANDLER, AZ)
(Resource Conservation and Recovery Act (tracking hazardous waste)) Organizations: DANNY ALLEN (CONTACT/OWNER)
FRYS FOOD & DRUG #69 (2010 S ALMA SCHOOL RD in CHANDLER, AZ)
Conditionally Exempt Small Quantity Generators, less than 100 kg/month of hazardous waste (Resource Conservation and Recovery Act (tracking hazardous waste)) Organizations: FRYS FOOD AND DRUG (CONTACT/OPERATOR)
, KROGER CO (CONTACT/OWNER)
GE HEALTHCARE BIOSCIENCES (3200 WEST GERMANN ROAD in CHANDLER, AZ)
Small Quantity Generators, between 100 kg and 1000 kg of hazardous waste/month (Resource Conservation and Recovery Act (tracking hazardous waste)) - notification Business NAICS classification: IN-VITRO DIAGNOSTIC SUBSTANCE MANUFACTURING. Organizations: AMKOR TECHNOLOTY (CONTACT/OWNER)
Alternative names: AMERSHAM BIOSCIENCES
HOME DEPOT 0417 (4141 S ARIZONA AVE in CHANDLER, AZ)
Conditionally Exempt Small Quantity Generators, less than 100 kg/month of hazardous waste (Resource Conservation and Recovery Act (tracking hazardous waste)) Organizations: HOME DEPOT USA INC (CONTACT/OPERATOR)
ORBITAL SCIENCES CORP (3380 S PRICE RD in CHANDLER, AZ)
Small Quantity Generators, between 100 kg and 1000 kg of hazardous waste/month (Resource Conservation and Recovery Act (tracking hazardous waste)) - notification Business NAICS classification: GUIDED MISSILE AND SPACE VEHICLE MANUFACTURING.
CVS #3491 (9546 E RIGGS RD in SUN LAKES, AZ)
Small Quantity Generators, between 100 kg and 1000 kg of hazardous waste/month (Resource Conservation and Recovery Act (tracking hazardous waste)) - notification Organizations: CVS CORP (CONTACT/OWNER)
Housing units lacking complete plumbing facilities: 0.0% Housing units lacking complete kitchen facilities: 0.6%
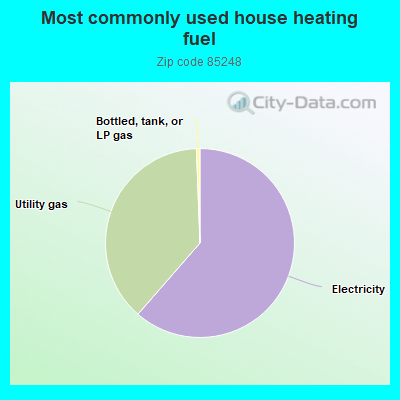
61.1%Electricity
37.8%Utility gas
0.6%Bottled, tank, or LP gas
Population in 1990: 9,399. Population change in the 1990s: +25,487 (+271.2%).
Place of birth for U.S.-born residents:
This state: 6,621
Northeast: 4,013
Midwest: 10,804
South: 2,610
West: 6,885
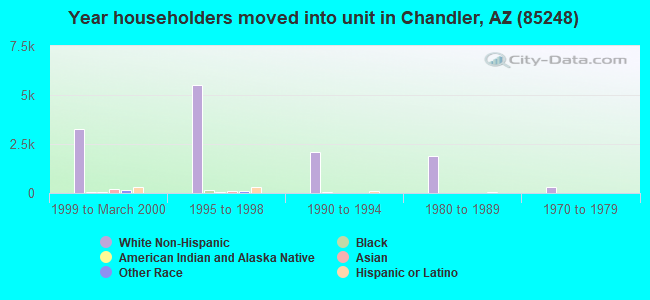
32% of the 85248 zip code residents lived in the same house 5 years ago. Out of people who lived in different houses, 46% lived in this county. Out of people who lived in different counties, 50% lived in Arizona.
88% of the 85248 zip code residents lived in the same house 1 year ago. Out of people who lived in different houses, 53% moved from this county. Out of people who lived in different houses, 3% moved from different county within same state. Out of people who lived in different houses, 37% moved from different state. Out of people who lived in different houses, 8% moved from abroad.
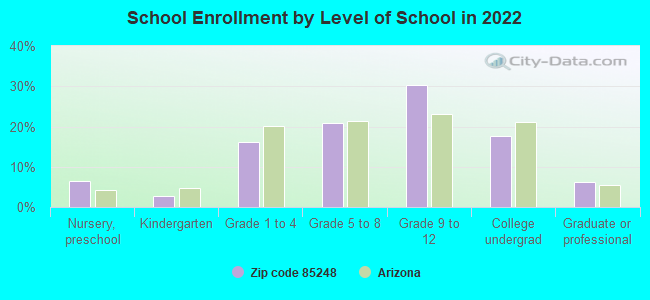
Private vs. public school enrollment:
Students in private schools in grades 1 to 8 (elementary and middle school): 161
Here:
7.2%
Arizona:
10.4%
Students in private schools in grades 9 to 12 (high school): 134
Here:
7.3%
Arizona:
8.8%
Students in private undergraduate colleges: 275
Here:
26.0%
Arizona:
13.1%
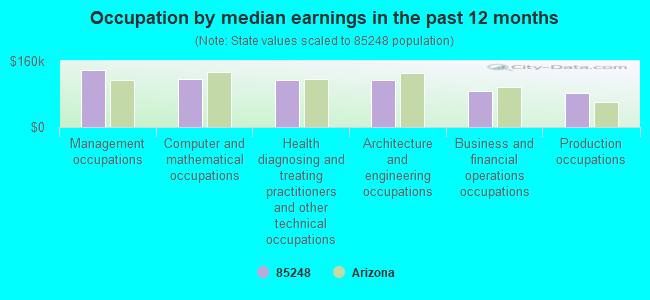
Occupation by median earnings in the past 12 months ($)
137,927Management occupations
115,292Computer and mathematical occupations
114,621Health diagnosing and treating practitioners and other technical occupations
114,491Architecture and engineering occupations
87,298Business and financial operations occupations
81,853Production occupations
Companies with federal contracts located in this zip code (CHANDLER, AZ):
ORBITAL SCIENCES CORPORATION (3380 SOUTH PRICE ROAD) : $396,809,212 in 448 contractsfrom 1999 to 2006
Contracts for Defense Missile and Space Systems -- Engineering Development (R&D), Defense Missile and Space Systems -- Applied Research and Exploratory Development (R&D), Invalid code: AC27, Defense Missile and Space Systems -- Advanced Development (R&D), and moreby Army, Air Force, Navy, NASA, and others Signed by year:2000: $66,791,682; 2001: $64,616,619; 2002: $72,829,885; 2003: $89,152,636; 2004: $63,638,237; 2005: $16,344,443; 2006: $10,343,963.
Biggest contracts:
$9,000,000 with Army for Defense Missile and Space Systems -- Engineering Development (R&D). Signed on 2003-01-14. Completion date: 2003-03-31.
$8,600,000 with Air Force for Defense Missile and Space Systems -- Applied Research and Exploratory Development (R&D). Signed on 2001-04-03. Completion date: 2001-06-29.
$8,247,105 with Navy for Invalid code: AC27. Signed on 2002-03-12. Completion date: 2004-06-25.
$8,000,000, same as above.Signed on 2000-06-29. Completion date: 2006-04-30.
SPACE DATA CORPORATION (3380 S PRICE RD) : $13,579,618 in 23 contractsfrom 2004 to 2006
Contracts for Defense Missile and Space Systems -- Advanced Development (R&D), Guided Missile Systems, Complete by Air Force Signed by year:2000: $0; 2001: $0; 2002: $0; 2003: $0; 2004: $1,705,000; 2005: $8,544,049; 2006: $3,330,569.
Biggest contracts:
$2,355,612 with Air Force for Defense Missile and Space Systems -- Advanced Development (R&D). Signed on 2005-02-23. Completion date: 2005-06-14.
$1,705,000, same as above.Signed on 2004-12-13. Completion date: 2005-11-18.
$1,589,891, same as above.Signed on 2005-11-23. Completion date: 2006-05-15.
$1,289,000, same as above.Signed on 2005-04-26. Completion date: 2005-12-18.
INTERNATIONAL AIR RESPONSE, IN (22000 S OLD PRICE RD; small business) : $6,367,053 in 50 contractsfrom 1999 to 2006
Contracts for Air Charter for Things, Forest/Range Fire Suppression/Presuppression Services, Aircraft Wheel and Brake Systems, Lease or Rental of Equipment -- Aircraft Components and Accessories, and moreby Army, Forest Service, Forest Service (disused code: now 12C2), U.S. Special Operations Command, and others Signed by year:2000: $470,690; 2001: $602,500; 2002: $573,495; 2003: $1,427,524; 2004: $1,306,446; 2005: $1,152,513; 2006: $734,710.
Biggest contracts:
$637,470 with Army for Air Charter for Things. Signed on 2004-09-22. Completion date: 2006-09-30.
$630,531 with Forest Service for Forest/Range Fire Suppression/Presuppression Services. Signed on 2003-09-15. Completion date: 2003-12-15.
$498,000 with Army for Air Charter for Things. Signed on 2002-11-13. Completion date: 2003-01-21.
$485,000, same as above.Signed on 2005-04-14. Completion date: 2006-09-30.
WAXMONSKY, RAYMOND W (9221 E ROCKY LAKE DR) : $15,000 in 2 contractsin 2005
$7,500 with U.S. Army Corps of Engineers - civil program financing only for Hazardous Substance Analysis. Taking place in NY. Signed on 2005-08-30. Completion date: 2006-08-30.
$7,500 with Army for Hazardous Substance Analysis. Taking place in NY. Signed on 2005-08-30. Completion date: 2006-08-30.
LOVELACE COMPANY, LLC (2046 WEST PENINSULA CIRCLE; small business) : $14,260 in 4 contractsfrom 2002 to 2006
$4,060 with Army for Miscellaneous Electrical and Electronic Components. Taking place in AK. Signed on 2002-08-08. Completion date: 2002-08-22.
$3,874 with Air Force for Electrical and Electronic Properties Measuring and Testing Instruments. Signed on 2006-07-10. Completion date: 2006-08-21.
$3,390 with U.S. Army Corps of Engineers - civil program financing only for Construction of Structures and Facilities -- EPG Facilities - Other, Including Transmission. Signed on 2003-09-09. Completion date: 2003-09-22.
$2,936 with Army for Miscellaneous Electrical and Electronic Components. Taking place in AR. Signed on 2006-06-26. Completion date: 2006-07-21.
MOTOROLA SATELLITE COMMUNICATI (2501 S PRICE RD) : $3,023 in 3 contractsfrom 2004 to 2005
$23,500 with Army for Miscellaneous Communication Equipment. Signed on 2005-08-26. Completion date: 2005-10-25.
$0 with Army for Telephone and Telegraph Equipment. Taking place in MD. Signed on 2004-02-19. Completion date: 2000-08-01.
-$20,477, same as above.Signed on 2004-02-19. Completion date: 2000-08-01.
Top industries in this zip code by the number of employees in 2005:
Management of Companies and Enterprises: Corporate, Subsidiary, and Regional Managing Offices (over 1000 employees: 1 establishment, 500-999 employees: 1 establishment)
Wholesale Trade: Other Electronic Parts and Equipment Merchant Wholesalers (250-499: 1, 10-19: 1, 5-9: 1, 1-4: 3)
Other Services (except Public Administration): Other Similar Organizations (except Business, Professional, Labor, and Political Organizations) (100-249: 1, 50-99: 1, 1-4: 1)
People in group quarters in 2010:
13 people in group homes intended for adults
Fatal accident statistics in 2014:
Fatal accident count: 3
Vehicles involved in fatal accidents: 6
Fatal accidents caused by drunken drivers: 1
Fatalities: 4
Persons involved in fatal accidents: 11
Pedestrians involved in fatal accidents: 0
Fatal accident statistics in 2013:
Fatal accident count: 1
Vehicles involved in fatal accidents: 1
Fatal accidents caused by drunken drivers: 0
Fatalities: 1
Persons involved in fatal accidents: 1
Pedestrians involved in fatal accidents: 0
Home Mortgage Disclosure Act Aggregated Statistics For Year 2009 (Based on 10 full and 2 partial tracts)
A) FHA, FSA/RHS & VA Home Purchase Loans
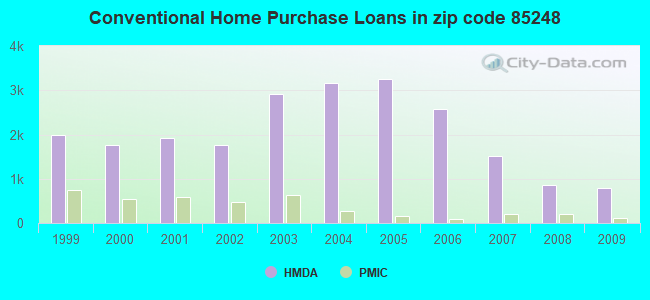
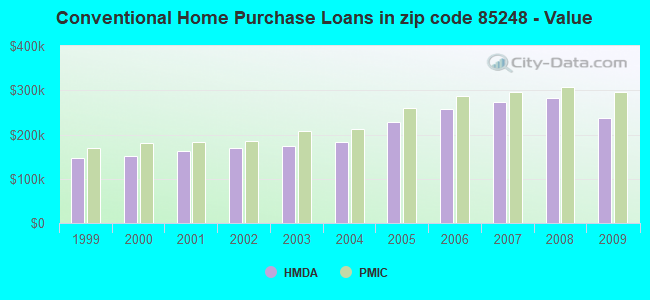
B) Conventional Home Purchase Loans
C) Refinancings
D) Home Improvement Loans
F) Non-occupant Loans on < 5 Family Dwellings (A B C & D)
G) Loans On Manufactured Home Dwelling (A B C & D)
Number
Average Value
Number
Average Value
Number
Average Value
Number
Average Value
Number
Average Value
Number
Average Value
LOANS ORIGINATED
384
$236,812
794
$236,234
2,333
$224,818
42
$144,906
319
$192,116
31
$123,585
APPLICATIONS APPROVED, NOT ACCEPTED
21
$231,652
76
$314,919
204
$240,352
10
$72,341
21
$206,449
6
$65,990
APPLICATIONS DENIED
33
$198,162
87
$297,386
651
$264,711
23
$58,410
65
$189,017
9
$80,768
APPLICATIONS WITHDRAWN
32
$234,396
93
$258,099
396
$237,759
9
$237,287
54
$197,296
7
$105,286
FILES CLOSED FOR INCOMPLETENESS
4
$243,250
10
$254,259
105
$257,545
4
$190,925
17
$212,549
1
$65,000
Aggregated Statistics For Year 2008 (Based on 10 full and 2 partial tracts)
A) FHA, FSA/RHS & VA Home Purchase Loans
B) Conventional Home Purchase Loans
C) Refinancings
D) Home Improvement Loans
F) Non-occupant Loans on < 5 Family Dwellings (A B C & D)
G) Loans On Manufactured Home Dwelling (A B C & D)
Number
Average Value
Number
Average Value
Number
Average Value
Number
Average Value
Number
Average Value
Number
Average Value
LOANS ORIGINATED
204
$263,283
870
$281,666
1,060
$250,562
70
$107,585
269
$197,326
33
$109,358
APPLICATIONS APPROVED, NOT ACCEPTED
14
$257,681
150
$330,164
206
$259,048
15
$50,245
35
$243,728
9
$238,206
APPLICATIONS DENIED
38
$247,127
129
$364,196
564
$289,141
66
$70,700
52
$213,762
18
$101,162
APPLICATIONS WITHDRAWN
32
$282,556
86
$289,319
250
$256,376
31
$161,476
39
$201,277
10
$73,600
FILES CLOSED FOR INCOMPLETENESS
0
$0
21
$318,981
65
$289,280
12
$141,345
6
$283,922
0
$0
Aggregated Statistics For Year 2007 (Based on 10 full and 2 partial tracts)
A) FHA, FSA/RHS & VA Home Purchase Loans
B) Conventional Home Purchase Loans
C) Refinancings
D) Home Improvement Loans
E) Loans on Dwellings For 5+ Families
F) Non-occupant Loans on < 5 Family Dwellings (A B C & D)
G) Loans On Manufactured Home Dwelling (A B C & D)
Number
Average Value
Number
Average Value
Number
Average Value
Number
Average Value
Number
Average Value
Number
Average Value
Number
Average Value
LOANS ORIGINATED
22
$244,104
1,520
$274,562
1,592
$267,694
205
$103,434
2
$44,955,000
402
$236,525
49
$94,346
APPLICATIONS APPROVED, NOT ACCEPTED
2
$220,000
228
$248,216
272
$287,017
74
$95,757
0
$0
52
$255,088
8
$96,875
APPLICATIONS DENIED
3
$147,000
253
$305,511
750
$294,147
135
$112,500
0
$0
129
$258,122
30
$87,688
APPLICATIONS WITHDRAWN
1
$148,000
138
$292,751
384
$277,913
52
$181,145
1
$417,000
47
$280,641
11
$102,084
FILES CLOSED FOR INCOMPLETENESS
0
$0
46
$358,220
121
$289,463
2
$79,000
0
$0
16
$244,966
1
$150,000
Aggregated Statistics For Year 2006 (Based on 10 full and 2 partial tracts)
A) FHA, FSA/RHS & VA Home Purchase Loans
B) Conventional Home Purchase Loans
C) Refinancings
D) Home Improvement Loans
F) Non-occupant Loans on < 5 Family Dwellings (A B C & D)
G) Loans On Manufactured Home Dwelling (A B C & D)
Number
Average Value
Number
Average Value
Number
Average Value
Number
Average Value
Number
Average Value
Number
Average Value
LOANS ORIGINATED
7
$315,984
2,574
$257,560
2,308
$263,939
293
$121,769
697
$243,633
94
$94,332
APPLICATIONS APPROVED, NOT ACCEPTED
4
$272,910
354
$265,287
314
$252,418
86
$68,023
92
$207,672
15
$102,331
APPLICATIONS DENIED
3
$176,000
428
$234,048
726
$312,818
157
$91,608
141
$246,026
80
$77,554
APPLICATIONS WITHDRAWN
2
$254,845
243
$251,918
569
$258,381
46
$123,694
89
$239,897
10
$139,860
FILES CLOSED FOR INCOMPLETENESS
0
$0
57
$288,159
156
$280,876
12
$106,228
18
$212,220
1
$60,000
Aggregated Statistics For Year 2005 (Based on 10 full and 2 partial tracts)
A) FHA, FSA/RHS & VA Home Purchase Loans
B) Conventional Home Purchase Loans
C) Refinancings
D) Home Improvement Loans
F) Non-occupant Loans on < 5 Family Dwellings (A B C & D)
G) Loans On Manufactured Home Dwelling (A B C & D)
Number
Average Value
Number
Average Value
Number
Average Value
Number
Average Value
Number
Average Value
Number
Average Value
LOANS ORIGINATED
9
$220,740
3,260
$229,074
3,716
$238,687
337
$122,014
1,057
$202,663
150
$72,884
APPLICATIONS APPROVED, NOT ACCEPTED
1
$98,000
271
$238,838
366
$238,273
106
$65,207
50
$191,708
17
$73,511
APPLICATIONS DENIED
4
$132,212
503
$181,184
751
$229,395
172
$85,658
137
$203,838
118
$49,215
APPLICATIONS WITHDRAWN
3
$238,460
344
$233,394
599
$232,543
83
$202,282
99
$211,423
19
$87,365
FILES CLOSED FOR INCOMPLETENESS
0
$0
90
$169,252
308
$239,048
15
$93,895
18
$176,050
27
$44,353
Aggregated Statistics For Year 2004 (Based on 10 full and 2 partial tracts)
A) FHA, FSA/RHS & VA Home Purchase Loans
B) Conventional Home Purchase Loans
C) Refinancings
D) Home Improvement Loans
F) Non-occupant Loans on < 5 Family Dwellings (A B C & D)
G) Loans On Manufactured Home Dwelling (A B C & D)
Number
Average Value
Number
Average Value
Number
Average Value
Number
Average Value
Number
Average Value
Number
Average Value
LOANS ORIGINATED
24
$163,640
3,160
$183,789
2,495
$184,202
178
$75,451
743
$160,691
112
$60,261
APPLICATIONS APPROVED, NOT ACCEPTED
3
$129,303
243
$187,988
342
$166,588
67
$61,389
43
$172,336
21
$53,934
APPLICATIONS DENIED
3
$152,600
326
$158,289
720
$177,524
120
$53,032
85
$153,253
59
$36,882
APPLICATIONS WITHDRAWN
10
$190,484
346
$190,874
643
$192,371
35
$68,668
110
$165,630
14
$64,919
FILES CLOSED FOR INCOMPLETENESS
0
$0
93
$139,908
153
$194,431
14
$64,693
12
$179,014
23
$28,632
Aggregated Statistics For Year 2003 (Based on 10 full and 2 partial tracts)
A) FHA, FSA/RHS & VA Home Purchase Loans
B) Conventional Home Purchase Loans
C) Refinancings
D) Home Improvement Loans
E) Loans on Dwellings For 5+ Families
F) Non-occupant Loans on < 5 Family Dwellings (A B C & D)
Number
Average Value
Number
Average Value
Number
Average Value
Number
Average Value
Number
Average Value
Number
Average Value
LOANS ORIGINATED
107
$160,319
2,924
$173,860
6,652
$164,062
168
$36,184
4
$15,189,380
721
$142,876
APPLICATIONS APPROVED, NOT ACCEPTED
1
$128,000
204
$193,013
713
$160,921
54
$35,042
0
$0
51
$158,577
APPLICATIONS DENIED
8
$153,305
228
$169,946
1,080
$160,588
131
$41,606
0
$0
85
$147,041
APPLICATIONS WITHDRAWN
11
$171,457
320
$178,601
938
$179,021
24
$62,556
2
$24,980,000
53
$122,834
FILES CLOSED FOR INCOMPLETENESS
0
$0
78
$225,555
151
$165,970
26
$45,285
0
$0
10
$157,175
Aggregated Statistics For Year 2002 (Based on 3 full tracts)
A) FHA, FSA/RHS & VA Home Purchase Loans
B) Conventional Home Purchase Loans
C) Refinancings
D) Home Improvement Loans
F) Non-occupant Loans on < 5 Family Dwellings (A B C & D)
Number
Average Value
Number
Average Value
Number
Average Value
Number
Average Value
Number
Average Value
LOANS ORIGINATED
75
$152,773
1,774
$168,648
3,408
$161,359
126
$31,103
375
$140,856
APPLICATIONS APPROVED, NOT ACCEPTED
2
$142,000
142
$172,176
441
$148,254
57
$29,368
25
$146,480
APPLICATIONS DENIED
8
$157,500
125
$146,368
600
$142,898
76
$27,513
29
$131,828
APPLICATIONS WITHDRAWN
9
$126,111
172
$201,180
458
$165,057
22
$35,273
19
$136,842
FILES CLOSED FOR INCOMPLETENESS
2
$114,000
41
$180,659
108
$151,833
3
$31,333
13
$171,538
Aggregated Statistics For Year 2001 (Based on 3 full tracts)
A) FHA, FSA/RHS & VA Home Purchase Loans
B) Conventional Home Purchase Loans
C) Refinancings
D) Home Improvement Loans
F) Non-occupant Loans on < 5 Family Dwellings (A B C & D)
Number
Average Value
Number
Average Value
Number
Average Value
Number
Average Value
Number
Average Value
LOANS ORIGINATED
93
$147,548
1,925
$162,181
2,399
$152,942
169
$32,882
325
$147,591
APPLICATIONS APPROVED, NOT ACCEPTED
3
$133,667
159
$161,943
281
$124,310
69
$29,217
13
$137,308
APPLICATIONS DENIED
5
$150,800
147
$129,102
505
$121,242
106
$27,594
29
$164,138
APPLICATIONS WITHDRAWN
8
$133,625
178
$169,494
348
$154,152
31
$33,613
26
$156,423
FILES CLOSED FOR INCOMPLETENESS
0
$0
19
$149,316
94
$156,426
4
$29,500
4
$146,000
Aggregated Statistics For Year 2000 (Based on 3 full tracts)
A) FHA, FSA/RHS & VA Home Purchase Loans
B) Conventional Home Purchase Loans
C) Refinancings
D) Home Improvement Loans
E) Loans on Dwellings For 5+ Families
F) Non-occupant Loans on < 5 Family Dwellings (A B C & D)
Number
Average Value
Number
Average Value
Number
Average Value
Number
Average Value
Number
Average Value
Number
Average Value
LOANS ORIGINATED
123
$139,317
1,764
$151,320
427
$106,482
232
$26,892
1
$13,971,000
232
$133,108
APPLICATIONS APPROVED, NOT ACCEPTED
9
$134,444
213
$144,709
94
$99,447
114
$26,728
0
$0
19
$180,474
APPLICATIONS DENIED
14
$133,429
185
$126,984
216
$90,616
134
$27,336
0
$0
20
$141,800
APPLICATIONS WITHDRAWN
6
$120,500
188
$167,697
103
$102,000
25
$56,840
0
$0
10
$133,700
FILES CLOSED FOR INCOMPLETENESS
3
$130,333
29
$168,379
42
$135,667
3
$27,667
1
$105,000
1
$178,000
Aggregated Statistics For Year 1999 (Based on 3 full and 1 partial tracts)
A) FHA, FSA/RHS & VA Home Purchase Loans
B) Conventional Home Purchase Loans
C) Refinancings
D) Home Improvement Loans
E) Loans on Dwellings For 5+ Families
F) Non-occupant Loans on < 5 Family Dwellings (A B C & D)
2005 - 2018 National Fire Incident Reporting System (NFIRS) incidents
Based on the data from the years 2005 - 2018 the average number of fire incidents per year is 34. The highest number of reported fire incidents - 68 took place in 2017, and the least - 4 in 2011. The data has an increasing trend.
When looking into fire subcategories, the most incidents belonged to: Structure Fires (45.9%), and Outside Fires (20.6%).
Fire incident types reported to NFIRS in Zip Code 85248


 Nearest zip codes: 85286, 85249, 85121, 85224, 85225, 85284.
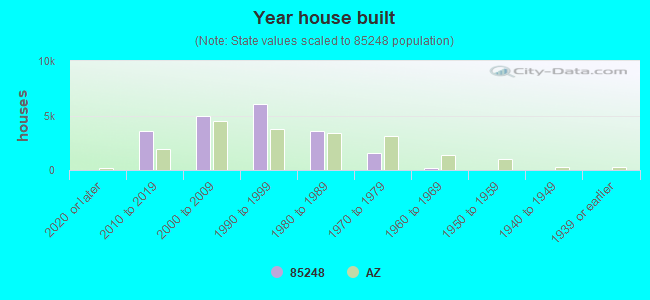


 Based on the data from the years 2005 - 2018 the average number of fire incidents per year is 34. The highest number of reported fire incidents - 68 took place in 2017, and the least - 4 in 2011. The data has an increasing trend.
 When looking into fire subcategories, the most incidents belonged to: Structure Fires (45.9%), and Outside Fires (20.6%).