Estimated zip code population in 2022: 19,170 Zip code population in 2010: 16,808 Zip code population in 2000: 16,490
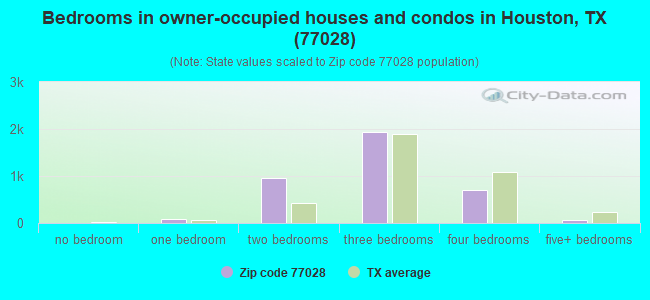
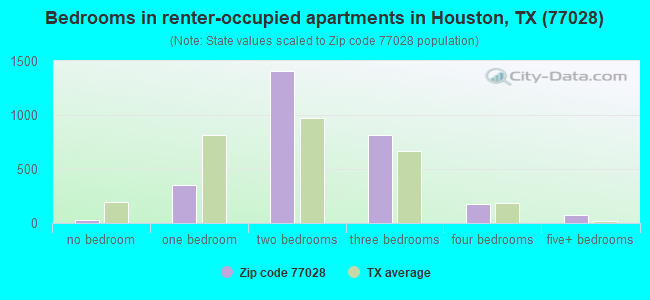
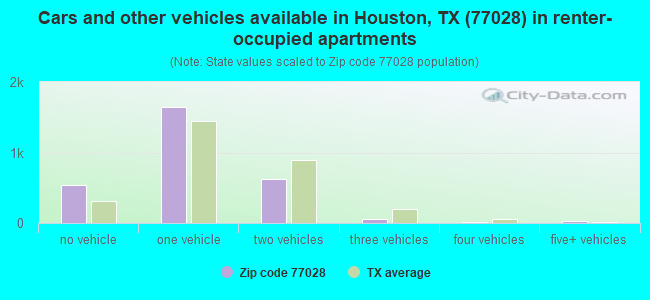
Houses and condos: 7,374 Renter-occupied apartments: 2,898
% of renters here:
43%
State:
38%
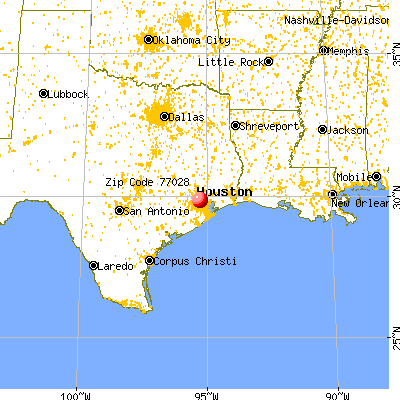
March 2022 cost of living index in zip code 77028: 95.3 (near average, U.S. average is 100)
Land area: 9.2 sq. mi. Water area: 0.0 sq. mi.
Population density: 2,090 people per square mile
(low).
OSM Map
General Map
Google Map
MSN Map
OSM Map
General Map
Google Map
MSN Map
OSM Map
General Map
Google Map
MSN Map
OSM Map
General Map
Google Map
MSN Map
Please wait while loading the map...
Real estate property taxes paid for housing units in 2022:
This zip code:
1.3% ($1,394)
Texas:
1.5% ($4,050)
Median real estate property taxes paid for housing units with mortgages in 2022: $1,737 (1.4%) Median real estate property taxes paid for housing units with no mortgage in 2022: $1,227 (1.2%)
Averages for the 2020 tax year for zip code 77028, filed in 2021:
Average Adjusted Gross Income (AGI) in 2020: $29,051 (Individual Income Tax Returns)
Here:
$29,051
State:
$77,054
Salary/wage: $28,972 (reported on 78.4% of returns)
Here:
$28,972
State:
$62,766
(% of AGI for various income ranges: 1155.5% for AGIs below $25k, 3520.7% for AGIs $25k-50k, 6855.6% for AGIs $50k-75k, 10235.0% for AGIs $75k-100k, 17948.8% for AGIs $100k-200k)
Taxable interest for individuals: $379 (reported on 5.7% of returns)
This zip code:
$379
Texas:
$2,665
(% of AGI for various income ranges: 1.3% for AGIs below $25k, 1.7% for AGIs $25k-50k, 5.4% for AGIs $50k-75k, 5.7% for AGIs $75k-100k, 66.2% for AGIs $100k-200k)
Ordinary dividends: $1,488 (reported on 1.9% of returns)
Here:
$1,488
State:
$10,044
(% of AGI for various income ranges: 0.3% for AGIs below $25k, 7.9% for AGIs $25k-50k, 7.2% for AGIs $50k-75k, 10.0% for AGIs $75k-100k)
Net capital gain/loss in AGI: +$3,812 (reported on 2.1% of returns)
Here:
+$3,812
State:
+$39,590
(% of AGI for various income ranges: 0.2% for AGIs below $25k, 13.7% for AGIs $25k-50k, 39.2% for AGIs $50k-75k, 133.8% for AGIs $100k-200k)
Profit/loss from business: +$3,871 (reported on 31.3% of returns)
Here:
+$3,871
State:
+$10,888
(% of AGI for various income ranges: 202.9% for AGIs below $25k, 30.0% for AGIs $25k-50k, 108.7% for AGIs $50k-75k, 482.1% for AGIs $75k-100k, 951.2% for AGIs $100k-200k)
Taxable individual retirement arrangement distribution: $9,873 (reported on 1.8% of returns)
77028:
$9,873
Texas:
$24,740
(% of AGI for various income ranges: 12.8% for AGIs below $25k, 18.7% for AGIs $25k-50k, 102.0% for AGIs $50k-75k)
Total itemized deductions: $27,158 (reported on 4.0% of returns)
Here:
$27,158
State:
$40,428
(% of AGI for various income ranges: 24.5% for AGIs below $25k, 175.3% for AGIs $25k-50k, 398.0% for AGIs $50k-75k, 583.6% for AGIs $75k-100k, 1345.0% for AGIs $100k-200k)
Charity contributions: $11,142 (reported on 2.9% of returns)
Here:
$11,142
State:
$18,201
(% of AGI for various income ranges: 5.1% for AGIs below $25k, 50.4% for AGIs $25k-50k, 116.2% for AGIs $50k-75k, 185.7% for AGIs $75k-100k, 551.2% for AGIs $100k-200k)
Taxes paid: $6,456 (reported on 3.3% of returns)
77028:
$6,456
State:
$7,821
(% of AGI for various income ranges: 3.3% for AGIs below $25k, 36.2% for AGIs $25k-50k, 82.3% for AGIs $50k-75k, 108.6% for AGIs $75k-100k, 241.2% for AGIs $100k-200k)
Earned income credit: $2,939 (reported on 39.5% of returns)
Here:
$2,939
State:
$2,584
(% of AGI for various income ranges: 201.3% for AGIs below $25k, 111.3% for AGIs $25k-50k)
Percentage of individuals using paid preparers for their 2020 taxes: 89.3%
Here:
89%
State:
92%
(% for various income ranges: 89.3% for AGIs below $25k, 89.6% for AGIs $25k-50k, 88.9% for AGIs $50k-75k, 90.5% for AGIs $75k-100k, 85.7% for AGIs $100k-200k)
Averages for the 2012 tax year for zip code 77028, filed in 2013:
Average Adjusted Gross Income (AGI) in 2012: $25,421 (Individual Income Tax Returns)
Here:
$25,421
State:
$65,384
Salary/wage: $25,084 (reported on 84.0% of returns)
Here:
$25,084
State:
$52,524
(% of AGI for various income ranges: 77.4% for AGIs below $25k, 89.5% for AGIs $25k-50k, 81.9% for AGIs $50k-75k, 83.4% for AGIs $75k-100k, 75.4% for AGIs $100k-200k)
Taxable interest for individuals: $420 (reported on 6.0% of returns)
This zip code:
$420
Texas:
$2,372
(% of AGI for various income ranges: 0.1% for AGIs $25k-50k, 0.1% for AGIs $50k-75k, 0.2% for AGIs $100k-200k)
Ordinary dividends: $4,233 (reported on 2.0% of returns)
Here:
$4,233
State:
$9,721
(% of AGI for various income ranges: 0.5% for AGIs below $25k, 0.3% for AGIs $25k-50k, 0.3% for AGIs $50k-75k, 0.2% for AGIs $100k-200k)
Net capital gain/loss in AGI: +$778 (reported on 1.2% of returns)
Here:
+$778
State:
+$35,319
(% of AGI for various income ranges: 0.1% for AGIs $75k-100k)
Profit/loss from business: +$6,321 (reported on 23.4% of returns)
Here:
+$6,321
State:
+$13,732
(% of AGI for various income ranges: 13.9% for AGIs below $25k, 1.3% for AGIs $25k-50k, 2.5% for AGIs $50k-75k, 2.9% for AGIs $75k-100k, 2.7% for AGIs $100k-200k)
Taxable individual retirement arrangement distribution: $9,856 (reported on 2.4% of returns)
77028:
$9,856
Texas:
$19,511
(% of AGI for various income ranges: 0.6% for AGIs below $25k, 0.7% for AGIs $25k-50k, 1.5% for AGIs $50k-75k, 3.5% for AGIs $75k-100k)
Total itemized deductions: $17,501 (34% of AGI, reported on 9.6% of returns)
Here:
$17,501
State:
$24,724
Here:
34.1% of AGI
State:
15.9% of AGI
(% of AGI for various income ranges: 2.9% for AGIs below $25k, 6.8% for AGIs $25k-50k, 10.0% for AGIs $50k-75k, 11.8% for AGIs $75k-100k, 10.6% for AGIs $100k-200k)
Charity contributions: $5,464 (reported on 8.1% of returns)
Here:
$5,464
State:
$6,808
(% of AGI for various income ranges: 0.5% for AGIs below $25k, 1.5% for AGIs $25k-50k, 3.1% for AGIs $50k-75k, 3.7% for AGIs $75k-100k, 3.5% for AGIs $100k-200k)
Taxes paid: $3,064 (reported on 8.9% of returns)
77028:
$3,064
State:
$6,921
(% of AGI for various income ranges: 0.4% for AGIs below $25k, 1.0% for AGIs $25k-50k, 1.5% for AGIs $50k-75k, 2.6% for AGIs $75k-100k, 2.4% for AGIs $100k-200k)
Earned income credit: $2,809 (reported on 46.6% of returns)
Here:
$2,809
State:
$2,570
(% of AGI for various income ranges: 13.6% for AGIs below $25k, 1.9% for AGIs $25k-50k)
Percentage of individuals using paid preparers for their 2012 taxes: 57.8%
Here:
58%
State:
51%
(% for various income ranges: 57.4% for AGIs below $25k, 57.6% for AGIs $25k-50k, 59.6% for AGIs $50k-75k, 57.1% for AGIs $75k-100k, 72.7% for AGIs $100k-200k)
Averages for the 2004 tax year for zip code 77028, filed in 2005:
Average Adjusted Gross Income (AGI) in 2004: $21,684 (Individual Income Tax Returns)
Here:
$21,684
State:
$47,881
Salary/wage: $21,408 (reported on 87.8% of returns)
Here:
$21,408
State:
$41,947
(% of AGI for various income ranges: 86.9% for AGIs below $10k, 85.0% for AGIs $10k-25k, 91.7% for AGIs $25k-50k, 84.5% for AGIs $50k-75k, 78.9% for AGIs $75k-100k, 69.7% for AGIs over 100k)
Taxable interest for individuals: $484 (reported on 10.6% of returns)
This zip code:
$484
Texas:
$2,255
(% of AGI for various income ranges: 0.3% for AGIs below $10k, 0.3% for AGIs $10k-25k, 0.2% for AGIs $25k-50k, 0.2% for AGIs $50k-75k, 0.3% for AGIs $75k-100k, 0.2% for AGIs over 100k)
Taxable dividends: $488 (reported on 2.5% of returns)
Here:
$488
State:
$4,261
(% of AGI for various income ranges: 0.0% for AGIs below $10k, 0.0% for AGIs $10k-25k, 0.1% for AGIs $25k-50k, 0.1% for AGIs $50k-75k, 0.0% for AGIs $75k-100k, 0.1% for AGIs over 100k)
Net capital gain/loss: +$295 (reported on 1.7% of returns)
Here:
+$295
State:
+$16,110
(% of AGI for various income ranges: 0.1% for AGIs below $10k, 0.1% for AGIs $10k-25k, -0.0% for AGIs $25k-50k, -0.1% for AGIs $50k-75k, 0.2% for AGIs $75k-100k)
Profit/loss from business: +$4,140 (reported on 14.7% of returns)
Here:
+$4,140
State:
+$11,013
(% of AGI for various income ranges: 13.2% for AGIs below $10k, 5.8% for AGIs $10k-25k, 0.4% for AGIs $25k-50k, 0.4% for AGIs $50k-75k, -0.2% for AGIs $75k-100k, -1.4% for AGIs over 100k)
IRA payment deduction: $1,733 (reported on 0.2% of returns)
77028:
$1,733
Texas:
$3,120
Total itemized deductions: $15,256 (34% of AGI, reported on 9.0% of returns)
Here:
$15,256
State:
$19,631
Here:
33.9% of AGI
State:
18.9% of AGI
(% of AGI for various income ranges: 1.8% for AGIs below $10k, 2.9% for AGIs $10k-25k, 6.4% for AGIs $25k-50k, 11.7% for AGIs $50k-75k, 11.9% for AGIs $75k-100k, 12.3% for AGIs over 100k)
Charity contributions deductions: $5,377 (12% of AGI, reported on 8.1% of returns)
Here:
$5,377
State:
$4,753
Here:
11.6% of AGI
State:
4.2% of AGI
(% of AGI for various income ranges: 0.3% for AGIs below $10k, 0.8% for AGIs $10k-25k, 2.0% for AGIs $25k-50k, 3.3% for AGIs $50k-75k, 4.6% for AGIs $75k-100k, 6.3% for AGIs over 100k)
Total tax: $2,361 (reported on 51.9% of returns)
77028:
$2,361
State:
$9,058
(% of AGI for various income ranges: 2.9% for AGIs below $10k, 2.7% for AGIs $10k-25k, 5.1% for AGIs $25k-50k, 9.7% for AGIs $50k-75k, 11.3% for AGIs $75k-100k, 15.6% for AGIs over 100k)
Earned income credit: $2,138 (reported on 49.1% of returns)
Here:
$2,138
State:
$2,024
Percentage of individuals using paid preparers for their 2004 taxes: 64.2%
Here:
64%
State:
57%
(% for various income ranges: 61.9% for AGIs below $10k, 67.5% for AGIs $10k-25k, 61.7% for AGIs $25k-50k, 62.6% for AGIs $50k-75k, 61.8% for AGIs $75k-100k, 71.7% for AGIs over 100k)
Likely homosexual households (counted as self-reported same-sex unmarried-partner households)
Lesbian couples: 0.1% of all households
Gay men: 0.0% of all households
Household received Food Stamps/SNAP in the past 12 months: 2,601 Household did not receive Food Stamps/SNAP in the past 12 months: 4,150
Women who had a birth in the past 12 months: 369 (104 now married, 256 unmarried) Women who did not have a birth in the past 12 months: 4,184 (1,227 now married, 2,976 unmarried)
Housing units in zip code 77028 with a mortgage: 1,120 Houses without a mortgage: 25
Median monthly owner costs for units with a mortgage: $1,118 Median monthly owner costs for units without a mortgage: $389
Residents with income below the poverty level in 2022:
This zip code:
33.8%
Whole state:
14.0%
Residents with income below 50% of the poverty level in 2022:
This zip code:
18.0%
Whole state:
7.4%
Median number of rooms in houses and condos:
Here:
5.8
State:
6.3
Median number of rooms in apartments:
Here:
4.5
State:
4.0
Notable locations in this zip code not listed on our city pages
Notable locations in zip code 77028: Settegast Yards (A), Houston Fire Department / Emergency Medical Services Station 32 (B), Houston Fire Department / Emergency Medical Services Station 43 (C), Houston Police Department - Northeast Patrol (D), Houston Fire Station Number 43 (E). Display/hide their locations on the map
Churches in zip code 77028 include: Cornerstone Missionary Baptist Church (A), Community Baptist Church (B), First Trinity Baptist Church (C), Greater Hope Baptist Church (D), Greater Evangel Temple Baptist Church (E), Greater Bethlehem Baptist Church (F), Good Shepherd Missionary Baptist Church (G), Good Shepherd Baptist Church (H), Greater New Sanctuary Baptist Church (I). Display/hide their locations on the map
Parks in zip code 77028 include: Hutcheson Park (1), Houston Gardens Park (2), Hutcheson Park (3), Lakewood Park (4), Liberty Park (5), Pelham Park (6), Rosewood Park (7), Stanfield Park (8), Trinity Gardens Park (9). Display/hide their locations on the map
1,966 married couples with children.
2,755 single-parent households (105 men, 2,650 women).
61.7% of residents of 77028 zip code speak English at home.
36.1% of residents speak Spanish at home (59% very well, 17% well, 16% not well, 8% not at all).
0.1% of residents speak other Indo-European language at home (87% very well, 13% well).
1.5% of residents speak other language at home (44% very well, 54% well, 2% not well).
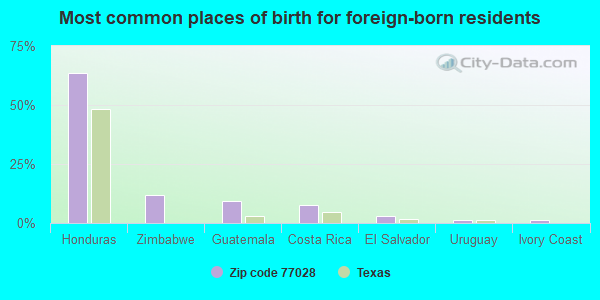
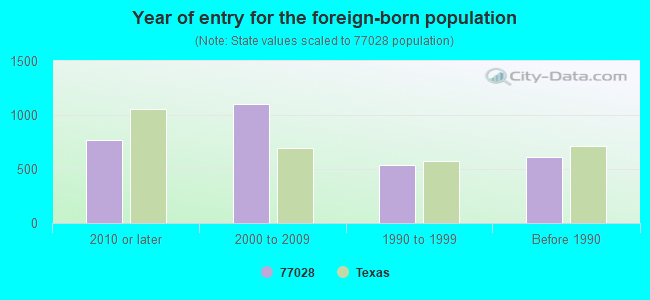
Foreign born population: 2,990 (15.6%) (38.0% of them are naturalized citizens)
Housing units lacking complete plumbing facilities: 3.3% Housing units lacking complete kitchen facilities: 5.5%
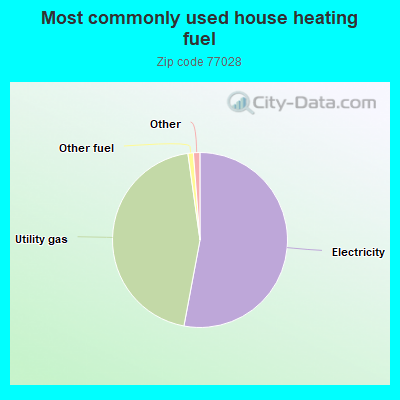
52.9%Electricity
44.8%Utility gas
1.0%Other fuel
0.7%No fuel used
0.6%Bottled, tank, or LP gas
Population in 1990: 17,943.
Place of birth for U.S.-born residents:
This state: 13,922
Northeast: 69
Midwest: 98
South: 1,530
West: 339
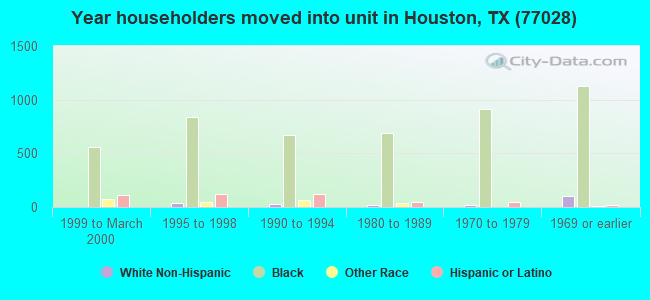
69% of the 77028 zip code residents lived in the same house 5 years ago. Out of people who lived in different houses, 91% lived in this county. Out of people who lived in different counties, 50% lived in Texas.
92% of the 77028 zip code residents lived in the same house 1 year ago. Out of people who lived in different houses, 77% moved from this county. Out of people who lived in different houses, 5% moved from different county within same state. Out of people who lived in different houses, 5% moved from different state. Out of people who lived in different houses, 11% moved from abroad.
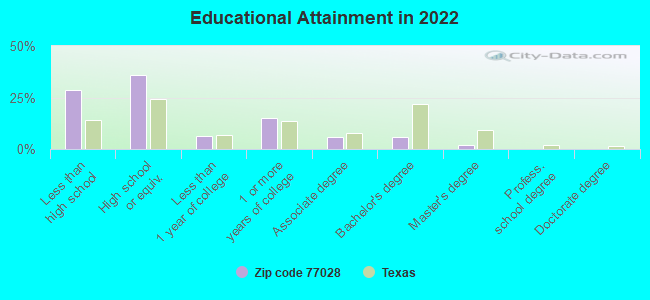
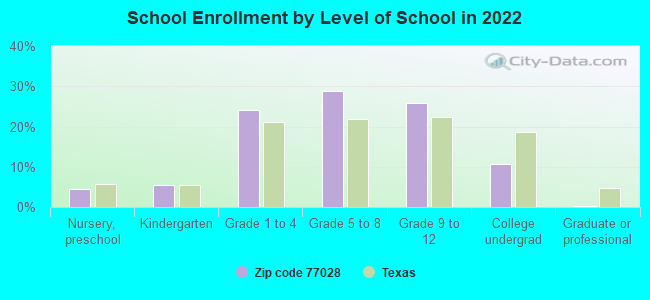
Private vs. public school enrollment:
Students in private schools in grades 1 to 8 (elementary and middle school):
Here:
0.0%
Texas:
8.8%
Students in private schools in grades 9 to 12 (high school):
Here:
0.0%
Texas:
8.0%
Students in private undergraduate colleges: 50
Here:
8.9%
Texas:
16.2%
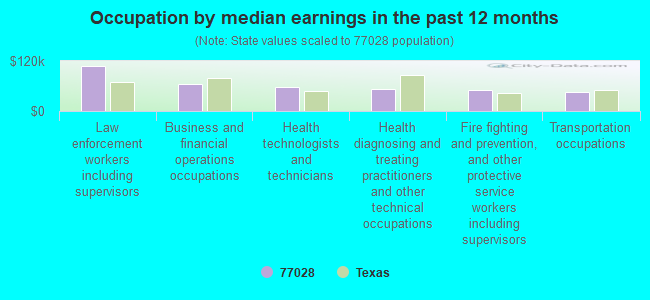
Occupation by median earnings in the past 12 months ($)
107,061Law enforcement workers including supervisors
64,196Business and financial operations occupations
57,434Health technologists and technicians
52,215Health diagnosing and treating practitioners and other technical occupations
51,453Fire fighting and prevention, and other protective service workers including supervisors
45,944Transportation occupations
Companies with federal contracts located in this zip code (HOUSTON, TX):
HDT VEHICLE COMPONENT SALES, I (7959 N LOOP EAST; small business) : $32,922,339 in 363 contractsfrom 2001 to 2006
Contracts for Vehicular Power Transmission Components, Packing and Gasket Materials, Vehicular Brake, Steering, Axle, Wheel, and Track Components, Bearings, Antifriction, Unmounted, and moreby Army, Defense Logistics Agency, Air Force, Navy, and others Signed by year:2000: $0; 2001: $1,312,919; 2002: $1,919,742; 2003: $13,131,235; 2004: $3,113,838; 2005: $9,506,413; 2006: $3,938,192.
Biggest contracts:
$4,858,405 with Army for Vehicular Power Transmission Components. Signed on 2003-10-23. Completion date: 2008-08-28.
$2,233,530, same as above.Signed on 2003-07-09. Completion date: 2008-08-28.
$2,226,621, same as above.Signed on 2003-04-25. Completion date: 2007-10-15.
$1,707,395, same as above.Signed on 2006-02-17. Completion date: 2010-11-30.
HDT VEHICLE COMPONENT SALES, I (7959 N LOOP EAST; small business) : $2,418,444 in 108 contractsfrom 2005 to 2006
Contracts for Packing and Gasket Materials, Bearings, Antifriction, Unmounted, Vehicular Power Transmission Components, Diesel Engines and Components, and moreby Defense Logistics Agency Signed by year:2000: $0; 2001: $0; 2002: $0; 2003: $0; 2004: $0; 2005: $339,853; 2006: $2,078,591.
Biggest contracts:
$168,179 with Defense Logistics Agency for Packing and Gasket Materials. Signed on 2006-05-19. Completion date: 2006-09-18.
$135,660 with Defense Logistics Agency for Bearings, Antifriction, Unmounted. Signed on 2006-06-22. Completion date: 2007-06-22.
$111,786 with Defense Logistics Agency for Packing and Gasket Materials. Signed on 2006-06-20. Completion date: 2006-10-18.
$99,960 with Defense Logistics Agency for Bearings, Antifriction, Unmounted. Signed on 2006-03-07. Completion date: 2007-06-21.
SUN COAST RESOURCES INC (6922 CAVALCADE ST; small business) : $337,642 in 37 contractsfrom 2001 to 2006
Contracts for Fuel Oils, Liquid Propellants and Fuels, Petroleum Base, Petroleum Production and Distribution Equipment, Gases: Compressed and Liquefied, and moreby Defense Logistics Agency, Bureau of Prisoners/Federal Prison System, Federal Emergency Management Agency, Federal Supply Service, and others Signed by year:2000: $0; 2001: $174,772; 2002: $42,056; 2003: $37,169; 2004: $86,697; 2005: -$71,045; 2006: $67,993.
Biggest contracts:
$114,620 with Defense Logistics Agency for Fuel Oils. Signed on 2001-06-01. Completion date: 2004-05-31.
$60,152 with Defense Logistics Agency for Liquid Propellants and Fuels, Petroleum Base. Signed on 2001-06-01. Completion date: 2004-05-31.
$37,000 with Bureau of Prisoners/Federal Prison System for Petroleum Production and Distribution Equipment. Signed on 2005-10-01. Completion date: 2006-09-30.
$37,000, same as above.Signed on 2004-09-30. Effective on 2004-10-01. Completion date: 2005-09-30.
TEJAS BOILER SERVICES INC (7206 ELBERT ST; small business)
$21,871 with Army for Maintenance, Repair and Rebuilding of Equipment -- Plumbing, Heating, and Waste Disposal Equipment. Signed on 2005-01-19. Completion date: 2005-01-20.
Top industries in this zip code by the number of employees in 2005:
Other Services (except Public Administration): Religious Organizations (250-499 employees: 1 establishment, 10-19 employees: 2 establishments, 5-9 employees: 3 establishments, 1-4 employees: 6 establishments)
Wholesale Trade: Petroleum Bulk Stations and Terminals (250-499: 1)
Wholesale Trade: Metal Service Centers and Other Metal Merchant Wholesalers (50-99: 1, 20-49: 5, 10-19: 1, 5-9: 2)
Wholesale Trade: Recyclable Material Merchant Wholesalers (100-249: 1, 10-19: 1)
Construction: Drywall and Insulation Contractors (100-249: 1, 5-9: 1)
Construction: Other Building Equipment Contractors (100-249: 1, 1-4: 1)
Professional, Scientific, and Technical Services: Tax Preparation Services (100-249: 1)
People in group quarters in 2010:
12 people in residential treatment centers for adults
6 people in other noninstitutional facilities
5 people in group homes intended for adults
People in group quarters in 2000:
50 people in homes or halfway houses for drug/alcohol abuse
48 people in homes for the mentally ill
38 people in other group homes
6 people in homes for the mentally retarded
5 people in other nonhousehold living situations
4 people in other noninstitutional group quarters
2 people in religious group quarters
Fatal accident statistics in 2014:
Fatal accident count: 1
Vehicles involved in fatal accidents: 1
Fatal accidents caused by drunken drivers: 1
Fatalities: 1
Persons involved in fatal accidents: 2
Pedestrians involved in fatal accidents: 0
Fatal accident statistics in 2013:
Fatal accident count: 3
Vehicles involved in fatal accidents: 4
Fatal accidents caused by drunken drivers: 2
Fatalities: 3
Persons involved in fatal accidents: 5
Pedestrians involved in fatal accidents: 1
Home Mortgage Disclosure Act Aggregated Statistics For Year 2009 (Based on 6 full and 8 partial tracts)
A) FHA, FSA/RHS & VA Home Purchase Loans
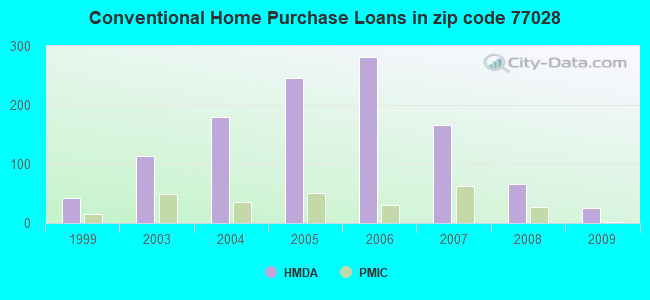
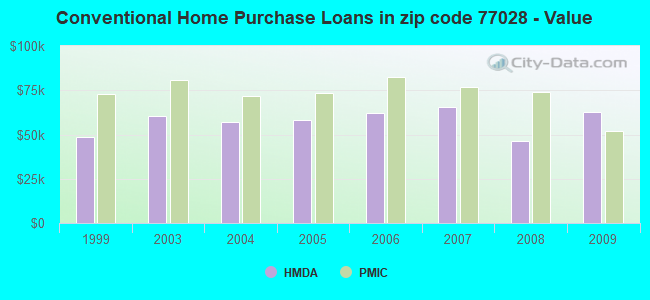
B) Conventional Home Purchase Loans
C) Refinancings
D) Home Improvement Loans
E) Loans on Dwellings For 5+ Families
F) Non-occupant Loans on < 5 Family Dwellings (A B C & D)
G) Loans On Manufactured Home Dwelling (A B C & D)
Number
Average Value
Number
Average Value
Number
Average Value
Number
Average Value
Number
Average Value
Number
Average Value
Number
Average Value
LOANS ORIGINATED
40
$72,502
25
$62,506
45
$56,363
12
$17,352
1
$134,230
18
$71,489
0
$0
APPLICATIONS APPROVED, NOT ACCEPTED
2
$127,245
1
$93,850
6
$43,657
4
$51,672
0
$0
1
$93,850
0
$0
APPLICATIONS DENIED
11
$99,308
29
$51,276
104
$59,156
105
$27,628
0
$0
24
$38,972
1
$28,160
APPLICATIONS WITHDRAWN
9
$58,356
4
$68,440
17
$73,412
15
$26,323
0
$0
5
$61,596
0
$0
FILES CLOSED FOR INCOMPLETENESS
3
$96,500
6
$58,380
4
$48,995
8
$15,881
0
$0
2
$24,995
0
$0
Aggregated Statistics For Year 2008 (Based on 6 full and 8 partial tracts)
A) FHA, FSA/RHS & VA Home Purchase Loans
B) Conventional Home Purchase Loans
C) Refinancings
D) Home Improvement Loans
E) Loans on Dwellings For 5+ Families
F) Non-occupant Loans on < 5 Family Dwellings (A B C & D)
G) Loans On Manufactured Home Dwelling (A B C & D)
Number
Average Value
Number
Average Value
Number
Average Value
Number
Average Value
Number
Average Value
Number
Average Value
Number
Average Value
LOANS ORIGINATED
26
$72,748
66
$46,212
46
$75,220
34
$26,857
1
$794,330
63
$44,514
0
$0
APPLICATIONS APPROVED, NOT ACCEPTED
3
$53,947
12
$57,847
24
$52,166
8
$21,936
1
$123,100
4
$67,448
0
$0
APPLICATIONS DENIED
10
$63,668
60
$73,483
175
$66,901
184
$22,388
0
$0
53
$49,375
9
$43,070
APPLICATIONS WITHDRAWN
12
$71,922
18
$74,273
42
$56,086
6
$25,237
0
$0
10
$64,110
0
$0
FILES CLOSED FOR INCOMPLETENESS
0
$0
14
$56,234
17
$78,844
8
$26,299
0
$0
2
$71,575
0
$0
Aggregated Statistics For Year 2007 (Based on 6 full and 8 partial tracts)
A) FHA, FSA/RHS & VA Home Purchase Loans
B) Conventional Home Purchase Loans
C) Refinancings
D) Home Improvement Loans
E) Loans on Dwellings For 5+ Families
F) Non-occupant Loans on < 5 Family Dwellings (A B C & D)
G) Loans On Manufactured Home Dwelling (A B C & D)
Number
Average Value
Number
Average Value
Number
Average Value
Number
Average Value
Number
Average Value
Number
Average Value
Number
Average Value
LOANS ORIGINATED
15
$89,628
166
$65,315
123
$60,067
77
$33,484
1
$174,180
97
$55,238
0
$0
APPLICATIONS APPROVED, NOT ACCEPTED
2
$40,445
44
$71,437
53
$65,781
31
$28,533
0
$0
19
$73,700
1
$31,220
APPLICATIONS DENIED
9
$105,291
189
$83,124
420
$73,320
303
$27,441
0
$0
95
$58,870
4
$75,652
APPLICATIONS WITHDRAWN
0
$0
39
$73,814
165
$78,171
24
$22,438
0
$0
19
$57,736
0
$0
FILES CLOSED FOR INCOMPLETENESS
2
$95,270
22
$77,540
50
$77,308
2
$49,110
0
$0
15
$66,343
0
$0
Aggregated Statistics For Year 2006 (Based on 6 full and 8 partial tracts)
A) FHA, FSA/RHS & VA Home Purchase Loans
B) Conventional Home Purchase Loans
C) Refinancings
D) Home Improvement Loans
E) Loans on Dwellings For 5+ Families
F) Non-occupant Loans on < 5 Family Dwellings (A B C & D)
G) Loans On Manufactured Home Dwelling (A B C & D)
Number
Average Value
Number
Average Value
Number
Average Value
Number
Average Value
Number
Average Value
Number
Average Value
Number
Average Value
LOANS ORIGINATED
22
$83,540
281
$62,405
238
$57,484
50
$27,895
1
$147,330
109
$53,551
0
$0
APPLICATIONS APPROVED, NOT ACCEPTED
2
$42,095
120
$69,307
81
$75,319
27
$28,995
0
$0
27
$53,478
2
$107,140
APPLICATIONS DENIED
5
$73,814
325
$65,485
523
$63,611
336
$28,348
0
$0
152
$50,088
6
$47,033
APPLICATIONS WITHDRAWN
5
$84,814
141
$69,861
216
$74,022
18
$25,576
0
$0
34
$52,676
0
$0
FILES CLOSED FOR INCOMPLETENESS
4
$78,870
27
$91,281
46
$65,449
6
$30,937
0
$0
1
$65,450
0
$0
Aggregated Statistics For Year 2005 (Based on 6 full and 8 partial tracts)
A) FHA, FSA/RHS & VA Home Purchase Loans
B) Conventional Home Purchase Loans
C) Refinancings
D) Home Improvement Loans
F) Non-occupant Loans on < 5 Family Dwellings (A B C & D)
G) Loans On Manufactured Home Dwelling (A B C & D)
Number
Average Value
Number
Average Value
Number
Average Value
Number
Average Value
Number
Average Value
Number
Average Value
LOANS ORIGINATED
36
$82,367
246
$57,935
246
$59,457
69
$44,733
105
$58,235
1
$21,610
APPLICATIONS APPROVED, NOT ACCEPTED
6
$59,453
102
$53,285
93
$53,862
14
$50,648
24
$50,391
3
$39,970
APPLICATIONS DENIED
5
$61,324
235
$62,174
602
$57,297
219
$26,493
108
$51,809
14
$36,846
APPLICATIONS WITHDRAWN
2
$78,600
119
$80,386
202
$95,560
71
$149,512
35
$69,724
2
$23,760
FILES CLOSED FOR INCOMPLETENESS
1
$64,980
15
$77,025
59
$79,541
0
$0
5
$74,080
0
$0
Aggregated Statistics For Year 2004 (Based on 6 full and 8 partial tracts)
A) FHA, FSA/RHS & VA Home Purchase Loans
B) Conventional Home Purchase Loans
C) Refinancings
D) Home Improvement Loans
E) Loans on Dwellings For 5+ Families
F) Non-occupant Loans on < 5 Family Dwellings (A B C & D)
G) Loans On Manufactured Home Dwelling (A B C & D)
Number
Average Value
Number
Average Value
Number
Average Value
Number
Average Value
Number
Average Value
Number
Average Value
Number
Average Value
LOANS ORIGINATED
44
$69,560
180
$57,073
270
$53,652
48
$26,986
2
$469,895
103
$45,430
4
$47,820
APPLICATIONS APPROVED, NOT ACCEPTED
3
$57,563
139
$68,191
117
$56,964
21
$21,462
0
$0
27
$60,047
2
$21,430
APPLICATIONS DENIED
5
$90,416
167
$68,940
551
$54,041
209
$22,790
2
$89,970
98
$43,749
16
$55,505
APPLICATIONS WITHDRAWN
8
$78,982
59
$67,712
212
$54,752
13
$33,202
0
$0
19
$48,084
1
$50,420
FILES CLOSED FOR INCOMPLETENESS
0
$0
21
$81,756
76
$74,513
4
$34,478
0
$0
7
$67,097
0
$0
Aggregated Statistics For Year 2003 (Based on 6 full and 8 partial tracts)
A) FHA, FSA/RHS & VA Home Purchase Loans
B) Conventional Home Purchase Loans
C) Refinancings
D) Home Improvement Loans
E) Loans on Dwellings For 5+ Families
F) Non-occupant Loans on < 5 Family Dwellings (A B C & D)
Number
Average Value
Number
Average Value
Number
Average Value
Number
Average Value
Number
Average Value
Number
Average Value
LOANS ORIGINATED
34
$61,279
113
$60,439
258
$61,110
29
$24,041
2
$337,930
36
$81,880
APPLICATIONS APPROVED, NOT ACCEPTED
3
$80,293
47
$72,931
103
$46,858
19
$29,750
0
$0
20
$48,590
APPLICATIONS DENIED
11
$62,055
90
$67,855
580
$46,550
173
$18,780
1
$305,140
85
$50,513
APPLICATIONS WITHDRAWN
3
$64,840
40
$53,734
219
$47,812
6
$21,475
0
$0
16
$49,850
FILES CLOSED FOR INCOMPLETENESS
0
$0
22
$65,815
11
$50,056
0
$0
0
$0
4
$37,752
Aggregated Statistics For Year 1999 (Based on 4 full and 4 partial tracts)
A) FHA, FSA/RHS & VA Home Purchase Loans
B) Conventional Home Purchase Loans
C) Refinancings
D) Home Improvement Loans
F) Non-occupant Loans on < 5 Family Dwellings (A B C & D)
2002 - 2018 National Fire Incident Reporting System (NFIRS) incidents
According to the data from the years 2002 - 2018 the average number of fire incidents per year is 86. The highest number of reported fires - 220 took place in 2011, and the least - 1 in 2008. The data has a rising trend.
When looking into fire subcategories, the most incidents belonged to: Outside Fires (51.4%), and Structure Fires (24.6%).
Fire incident types reported to NFIRS in Zip Code 77028


 Nearest zip codes: 77016, 77078, 77026, 77020, 77013, 77093.


 : $32,922,339 in 363 contracts from 2001 to 2006

 According to the data from the years 2002 - 2018 the average number of fire incidents per year is 86. The highest number of reported fires - 220 took place in 2011, and the least - 1 in 2008. The data has a rising trend.
 When looking into fire subcategories, the most incidents belonged to: Outside Fires (51.4%), and Structure Fires (24.6%).