Estimated zip code population in 2022: 3,032 Zip code population in 2010: 3,005 Zip code population in 2000: 3,113
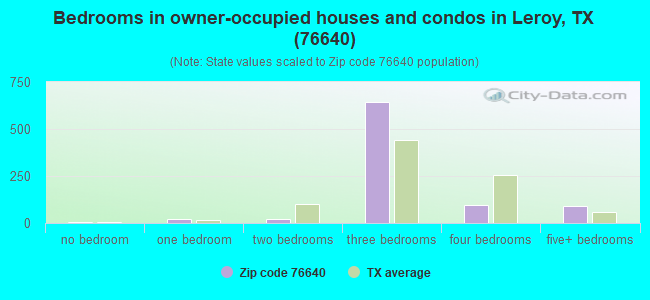
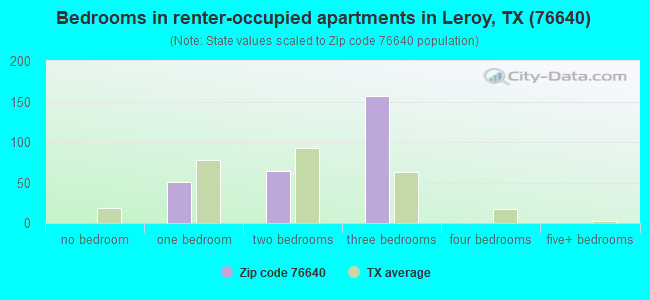
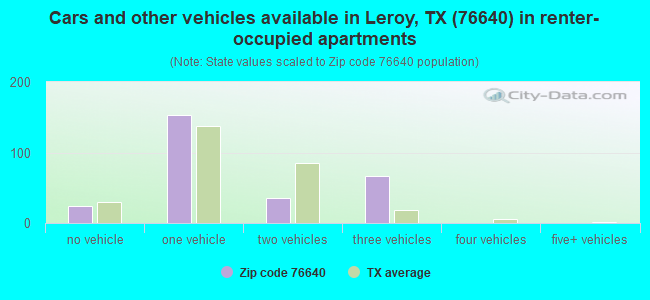
Houses and condos: 1,258 Renter-occupied apartments: 278
% of renters here:
24%
State:
38%
March 2022 cost of living index in zip code 76640: 79.9 (low, U.S. average is 100)
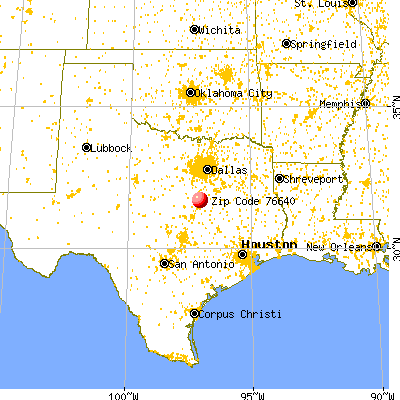
Land area: 28.4 sq. mi. Water area: 0.3 sq. mi.
Population density: 107 people per square mile
(very low).
OSM Map
General Map
Google Map
MSN Map
OSM Map
General Map
Google Map
MSN Map
OSM Map
General Map
Google Map
MSN Map
OSM Map
General Map
Google Map
MSN Map
Please wait while loading the map...
Real estate property taxes paid for housing units in 2022:
This zip code:
1.0% ($1,802)
Texas:
1.5% ($4,050)
Median real estate property taxes paid for housing units with mortgages in 2022: $1,905 (1.0%) Median real estate property taxes paid for housing units with no mortgage in 2022: $1,666 (0.9%)
Business Search- 14 Million verified businesses
Males: 1,795
(59.2%)
Females: 1,237
(40.8%)
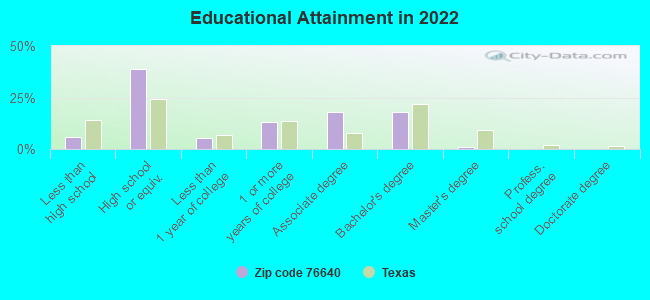
For population 25 years and over in 76640:
High school or higher: 93.3%
Bachelor's degree or higher: 18.5%
Graduate or professional degree: 0.8%
Unemployed: 2.3%
Mean travel time to work (commute): 29.7 minutes
For population 15 years and over in 76640:
Never married: 23.9%
Now married: 48.0%
Separated: 1.6%
Widowed: 12.2%
Divorced: 14.3%
Zip code 76640 compared to state average:
Unemployed percentage below state average.
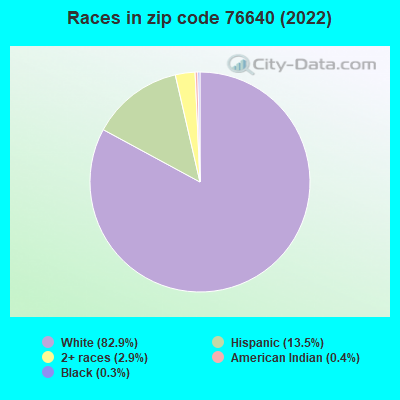
Black race population percentage significantly below state average.
Hispanic race population percentage significantly below state average.
Foreign-born population percentage significantly below state average.
Renting percentage below state average.
Length of stay since moving in significantly above state average.
Percentage of population with a bachelor's degree or higher below state average.
Averages for the 2020 tax year for zip code 76640, filed in 2021:
Average Adjusted Gross Income (AGI) in 2020: $46,738 (Individual Income Tax Returns)
Here:
$46,738
State:
$77,054
Salary/wage: $42,261 (reported on 80.6% of returns)
Here:
$42,261
State:
$62,766
(% of AGI for various income ranges: 1133.6% for AGIs below $25k, 3784.8% for AGIs $25k-50k, 5991.3% for AGIs $50k-75k, 9431.4% for AGIs $75k-100k, 20228.8% for AGIs $100k-200k)
Taxable interest for individuals: $723 (reported on 27.1% of returns)
This zip code:
$723
Texas:
$2,665
(% of AGI for various income ranges: 14.3% for AGIs below $25k, 6.7% for AGIs $25k-50k, 13.3% for AGIs $50k-75k, 27.1% for AGIs $75k-100k, 201.3% for AGIs $100k-200k)
Ordinary dividends: $1,683 (reported on 8.3% of returns)
Here:
$1,683
State:
$10,044
(% of AGI for various income ranges: 9.3% for AGIs below $25k, 5.8% for AGIs $25k-50k, 38.0% for AGIs $50k-75k, 108.7% for AGIs $100k-200k)
Net capital gain/loss in AGI: +$9,357 (reported on 9.7% of returns)
Here:
+$9,357
State:
+$39,590
(% of AGI for various income ranges: 6.7% for AGIs below $25k, 19.4% for AGIs $25k-50k, 208.6% for AGIs $75k-100k, 1340.0% for AGIs $100k-200k)
Profit/loss from business: +$10,733 (reported on 18.8% of returns)
Here:
+$10,733
State:
+$10,888
(% of AGI for various income ranges: 155.7% for AGIs below $25k, 167.6% for AGIs $25k-50k, 305.3% for AGIs $50k-75k, 674.3% for AGIs $75k-100k, 951.2% for AGIs $100k-200k)
Taxable individual retirement arrangement distribution: $11,522 (reported on 6.2% of returns)
76640:
$11,522
Texas:
$24,740
(% of AGI for various income ranges: 47.6% for AGIs below $25k, 107.3% for AGIs $25k-50k, 690.0% for AGIs $75k-100k)
Total itemized deductions: $27,650 (reported on 2.8% of returns)
Here:
$27,650
State:
$40,428
(% of AGI for various income ranges: 737.3% for AGIs $50k-75k)
Charity contributions: $11,467 (reported on 2.1% of returns)
Here:
$11,467
State:
$18,201
(% of AGI for various income ranges: 104.2% for AGIs $25k-50k)
Taxes paid: $4,275 (reported on 2.8% of returns)
76640:
$4,275
State:
$7,821
(% of AGI for various income ranges: 114.0% for AGIs $50k-75k)
Earned income credit: $2,359 (reported on 22.2% of returns)
Here:
$2,359
State:
$2,584
(% of AGI for various income ranges: 111.2% for AGIs below $25k, 87.3% for AGIs $25k-50k)
Percentage of individuals using paid preparers for their 2020 taxes: 92.4%
Here:
92%
State:
92%
(% for various income ranges: 91.1% for AGIs below $25k, 92.9% for AGIs $25k-50k, 94.7% for AGIs $50k-75k, 90.9% for AGIs $75k-100k, 93.8% for AGIs $100k-200k)
Averages for the 2012 tax year for zip code 76640, filed in 2013:
Average Adjusted Gross Income (AGI) in 2012: $39,372 (Individual Income Tax Returns)
Here:
$39,372
State:
$65,384
Salary/wage: $36,090 (reported on 83.5% of returns)
Here:
$36,090
State:
$52,524
(% of AGI for various income ranges: 73.8% for AGIs below $25k, 86.0% for AGIs $25k-50k, 78.8% for AGIs $50k-75k, 78.2% for AGIs $75k-100k, 65.8% for AGIs $100k-200k)
Taxable interest for individuals: $663 (reported on 28.6% of returns)
This zip code:
$663
Texas:
$2,372
(% of AGI for various income ranges: 1.1% for AGIs below $25k, 0.5% for AGIs $50k-75k, 0.8% for AGIs $75k-100k, 0.3% for AGIs $100k-200k)
Ordinary dividends: $882 (reported on 8.3% of returns)
Here:
$882
State:
$9,721
(% of AGI for various income ranges: 0.3% for AGIs below $25k, 0.1% for AGIs $25k-50k, 0.2% for AGIs $75k-100k, 0.2% for AGIs $100k-200k)
Net capital gain/loss in AGI: +$2,033 (reported on 6.8% of returns)
Here:
+$2,033
State:
+$35,319
(% of AGI for various income ranges: 0.1% for AGIs below $25k, 0.3% for AGIs $50k-75k, 1.1% for AGIs $100k-200k)
Profit/loss from business: +$9,533 (reported on 18.0% of returns)
Here:
+$9,533
State:
+$13,732
(% of AGI for various income ranges: 8.8% for AGIs below $25k, 4.2% for AGIs $25k-50k, 2.3% for AGIs $50k-75k, 4.9% for AGIs $75k-100k, 3.2% for AGIs $100k-200k)
Taxable individual retirement arrangement distribution: $10,982 (reported on 8.3% of returns)
76640:
$10,982
Texas:
$19,511
(% of AGI for various income ranges: 3.0% for AGIs below $25k, 3.5% for AGIs $25k-50k, 5.9% for AGIs $75k-100k)
Total itemized deductions: $18,364 (21% of AGI, reported on 10.5% of returns)
Here:
$18,364
State:
$24,724
Here:
21.0% of AGI
State:
15.9% of AGI
(% of AGI for various income ranges: 6.1% for AGIs $25k-50k, 3.7% for AGIs $50k-75k, 5.8% for AGIs $75k-100k, 7.1% for AGIs $100k-200k)
Charity contributions: $6,000 (reported on 6.0% of returns)
Here:
$6,000
State:
$6,808
Taxes paid: $4,100 (reported on 9.0% of returns)
76640:
$4,100
State:
$6,921
(% of AGI for various income ranges: 0.7% for AGIs $25k-50k, 0.6% for AGIs $50k-75k, 0.9% for AGIs $75k-100k, 2.0% for AGIs $100k-200k)
Earned income credit: $2,139 (reported on 24.8% of returns)
Here:
$2,139
State:
$2,570
(% of AGI for various income ranges: 7.0% for AGIs below $25k, 1.4% for AGIs $25k-50k)
Percentage of individuals using paid preparers for their 2012 taxes: 47.4%
Here:
47%
State:
51%
(% for various income ranges: 45.2% for AGIs below $25k, 44.1% for AGIs $25k-50k, 52.9% for AGIs $50k-75k, 45.5% for AGIs $75k-100k, 66.7% for AGIs $100k-200k)
Averages for the 2004 tax year for zip code 76640, filed in 2005:
Average Adjusted Gross Income (AGI) in 2004: $31,972 (Individual Income Tax Returns)
Here:
$31,972
State:
$47,881
Salary/wage: $30,770 (reported on 88.9% of returns)
Here:
$30,770
State:
$41,947
(% of AGI for various income ranges: 106.1% for AGIs below $10k, 82.7% for AGIs $10k-25k, 86.8% for AGIs $25k-50k, 86.0% for AGIs $50k-75k, 88.2% for AGIs $75k-100k, 75.8% for AGIs over 100k)
Taxable interest for individuals: $836 (reported on 34.1% of returns)
This zip code:
$836
Texas:
$2,255
(% of AGI for various income ranges: 2.1% for AGIs below $10k, 1.6% for AGIs $10k-25k, 1.2% for AGIs $25k-50k, 0.7% for AGIs $50k-75k, 0.2% for AGIs $75k-100k, 0.5% for AGIs over 100k)
Taxable dividends: $650 (reported on 9.9% of returns)
Here:
$650
State:
$4,261
(% of AGI for various income ranges: 0.4% for AGIs below $10k, 0.2% for AGIs $10k-25k, 0.3% for AGIs $25k-50k, 0.2% for AGIs $50k-75k, 0.1% for AGIs $75k-100k, 0.1% for AGIs over 100k)
Net capital gain/loss: +$1,542 (reported on 6.8% of returns)
Here:
+$1,542
State:
+$16,110
(% of AGI for various income ranges: -0.8% for AGIs below $10k, 0.1% for AGIs $10k-25k, 0.2% for AGIs $25k-50k, 0.1% for AGIs $50k-75k, -0.0% for AGIs $75k-100k, 2.1% for AGIs over 100k)
Profit/loss from business: +$7,740 (reported on 16.4% of returns)
Here:
+$7,740
State:
+$11,013
(% of AGI for various income ranges: 9.0% for AGIs below $10k, 5.1% for AGIs $10k-25k, 3.4% for AGIs $25k-50k, 4.9% for AGIs $50k-75k, 0.1% for AGIs $75k-100k, 5.8% for AGIs over 100k)
IRA payment deduction: $2,579 (reported on 1.3% of returns)
76640:
$2,579
Texas:
$3,120
Total itemized deductions: $14,506 (22% of AGI, reported on 12.0% of returns)
Here:
$14,506
State:
$19,631
Here:
22.1% of AGI
State:
18.9% of AGI
(% of AGI for various income ranges: 2.2% for AGIs $10k-25k, 4.9% for AGIs $25k-50k, 6.2% for AGIs $50k-75k, 9.0% for AGIs $75k-100k, 6.0% for AGIs over 100k)
Charity contributions deductions: $4,263 (6% of AGI, reported on 8.4% of returns)
Here:
$4,263
State:
$4,753
Here:
5.9% of AGI
State:
4.2% of AGI
(% of AGI for various income ranges: 1.0% for AGIs $25k-50k, 0.9% for AGIs $50k-75k, 2.2% for AGIs $75k-100k, 1.9% for AGIs over 100k)
Total tax: $4,083 (reported on 68.5% of returns)
76640:
$4,083
State:
$9,058
(% of AGI for various income ranges: 2.7% for AGIs below $10k, 3.5% for AGIs $10k-25k, 6.5% for AGIs $25k-50k, 9.5% for AGIs $50k-75k, 10.9% for AGIs $75k-100k, 17.3% for AGIs over 100k)
Earned income credit: $1,745 (reported on 24.7% of returns)
Here:
$1,745
State:
$2,024
Percentage of individuals using paid preparers for their 2004 taxes: 53.4%
Here:
53%
State:
57%
(% for various income ranges: 46.9% for AGIs below $10k, 56.2% for AGIs $10k-25k, 57.1% for AGIs $25k-50k, 55.4% for AGIs $50k-75k, 43.7% for AGIs $75k-100k, 58.1% for AGIs over 100k)
Household received Food Stamps/SNAP in the past 12 months: 162 Household did not receive Food Stamps/SNAP in the past 12 months: 991
Women who had a birth in the past 12 months: 51 (52 now married, 0 unmarried) Women who did not have a birth in the past 12 months: 478 (263 now married, 213 unmarried)
Housing units in zip code 76640 with a mortgage: 447 Houses without a mortgage: 5
Median monthly owner costs for units with a mortgage: $1,177 Median monthly owner costs for units without a mortgage: $460
Residents with income below the poverty level in 2022:
This zip code:
21.9%
Whole state:
14.0%
Residents with income below 50% of the poverty level in 2022:
This zip code:
7.4%
Whole state:
7.4%
Median number of rooms in houses and condos:
Here:
5.9
State:
6.3
Median number of rooms in apartments:
Here:
4.2
State:
4.0
Notable locations in this zip code not listed on our city pages
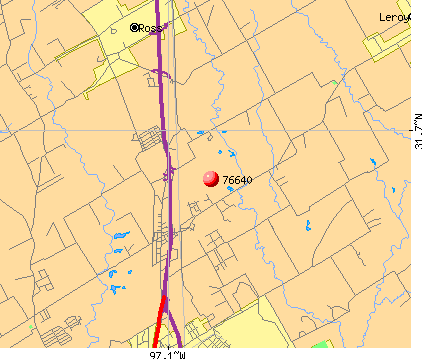
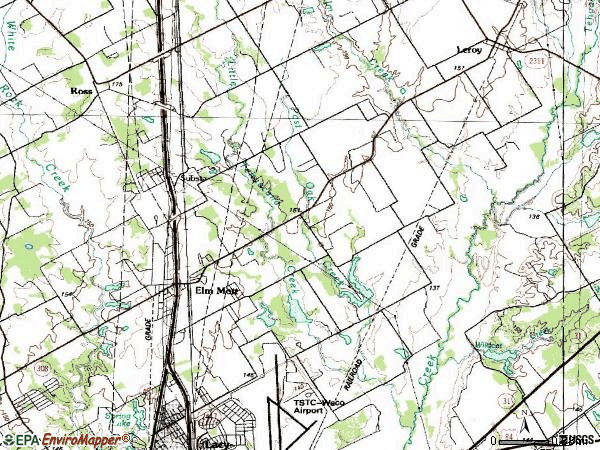
Notable locations in zip code 76640: Linden Hall (A), Elm Mott Volunteer Fire Department (B), Ross Volunteer Fire Department (C). Display/hide their locations on the map
Reservoirs: Soil Conservation Service Site 15 Reservoir (A), Soil Conservation Service Site 16 Reservoir (B), Soil Conservation Service Site 17 Reservoir (C), Soil Conservation Service Site 18 Reservoir (D). Display/hide their locations on the map
Tourist attractions (not listed on the city page) : Antiquibles Antique Mall (Museums; I H 35 Exit 34 North) (1), Antiquibles Dog Museum (I H 35 Exit 34 North) (2). Display/hide their approximate locations on the map
In group quarters: 25 (-1 institutionalized population)
Size of family households: 266 2-persons, 163 3-persons, 175 4-persons, 119 5-persons, 29 6-persons, 14 7-or-more-persons
Size of nonfamily households: 361 1-person, 19 2-persons, 1 3-persons
390 married couples with children.
282 single-parent households (53 men, 229 women).
88.2% of residents of 76640 zip code speak English at home.
11.6% of residents speak Spanish at home (93% very well, 5% well, 2% not well).
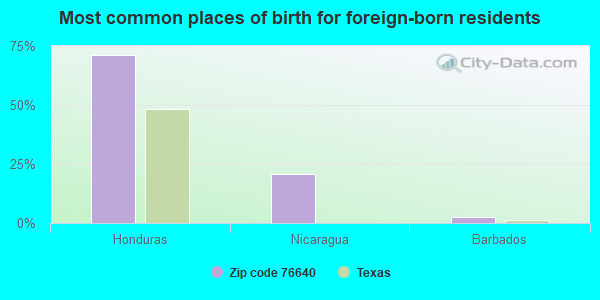
Foreign born population: 172 (5.7%) (51.7% of them are naturalized citizens)
This zip code:
5.7%
Whole state:
17.2%
71%Honduras
21%Nicaragua
2%Barbados
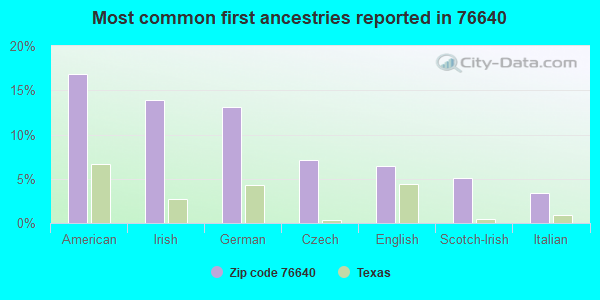
17%American
14%Irish
13%German
7%Czech
6%English
5%Scotch-Irish
3%Italian
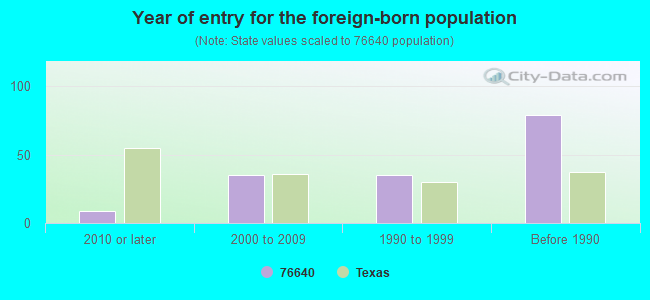
Year of entry for the foreign-born population
92010 or later
352000 to 2009
351990 to 1999
79Before 1990
Housing units lacking complete plumbing facilities: 9.1% Housing units lacking complete kitchen facilities: 6.1%
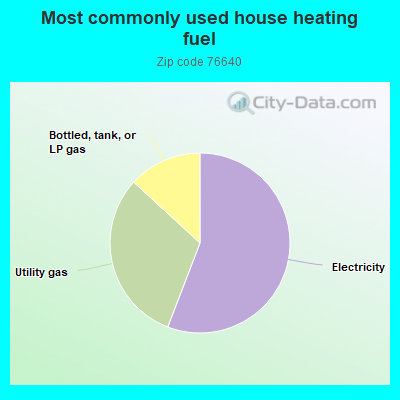
55.9%Electricity
31.0%Utility gas
13.2%Bottled, tank, or LP gas
Population in 1990: 4,183.
Place of birth for U.S.-born residents:
This state: 2,316
Midwest: 187
South: 273
West: 60
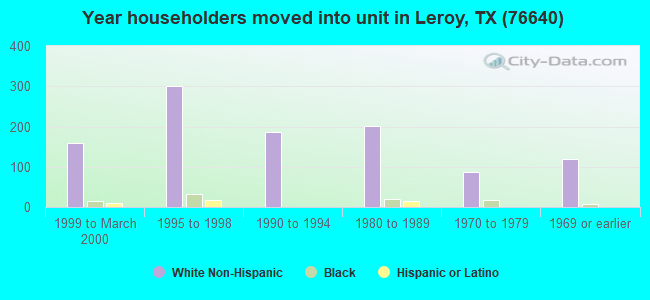
55% of the 76640 zip code residents lived in the same house 5 years ago. Out of people who lived in different houses, 73% lived in this county. Out of people who lived in different counties, 50% lived in Texas.
96% of the 76640 zip code residents lived in the same house 1 year ago. Out of people who lived in different houses, 51% moved from this county. Out of people who lived in different houses, 53% moved from different county within same state.
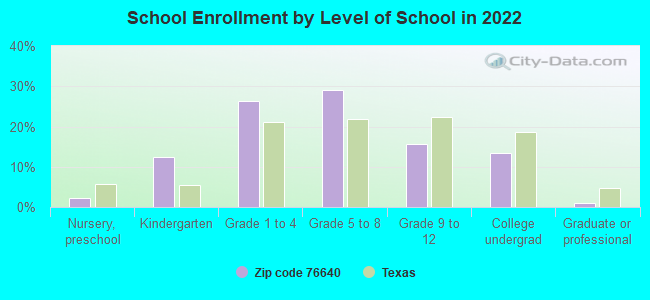
Private vs. public school enrollment:
Students in private schools in grades 1 to 8 (elementary and middle school): 31
Here:
7.6%
Texas:
8.8%
Students in private schools in grades 9 to 12 (high school):
Here:
0.0%
Texas:
8.0%
Students in private undergraduate colleges:
Here:
0.0%
Texas:
16.2%
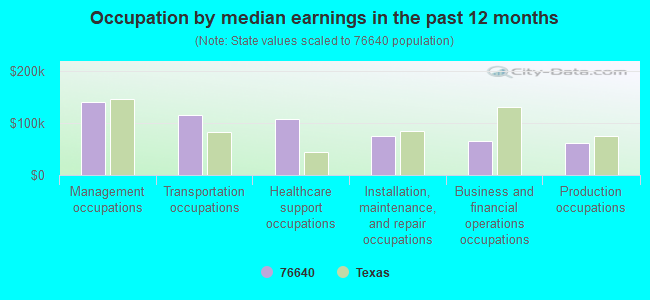
Occupation by median earnings in the past 12 months ($)
139,979Management occupations
114,683Transportation occupations
106,625Healthcare support occupations
74,319Installation, maintenance, and repair occupations
65,199Business and financial operations occupations
62,219Production occupations
Companies with federal contracts located in this zip code (ELM MOTT, TX):
TREYS DIESEL FUEL INJECTION SE (508 SOUTH MCLENNAN DRIVE; small business) : $327,534 in 8 contractsfrom 2001 to 2005
Contracts for Engine Fuel System Components, Nonaircraft by Army, Defense Logistics Agency Signed by year:2000: $0; 2001: $76,800; 2002: $250,734; 2003: $368,550; 2004: $0; 2005: -$368,550; 2006: $0.
Biggest contracts:
$368,550 with Army for Engine Fuel System Components, Nonaircraft. Signed on 2003-06-27. Completion date: 2008-09-30.
$86,775 with Defense Logistics Agency for Engine Fuel System Components, Nonaircraft. Signed on 2002-02-28. Completion date: 2002-04-29.
$79,688, same as above.Signed on 2002-05-20. Completion date: 2002-07-19.
$76,800, same as above.Signed on 2001-05-02. Completion date: 2001-12-02.
TARLTON W SMITH (116 OAK FORREST DR; small business) : $36,393 in 5 contractsin 2002
Contracts for Musical Instruments by Army Signed by year:2000: $0; 2001: $0; 2002: $36,393; 2003: $0; 2004: $0; 2005: $0; 2006: $0.
Biggest contracts:
$16,800 with Army for Musical Instruments. Signed on 2002-09-24. Completion date: 2002-11-01.
$8,517 with Army for Musical Instruments. Taking place in VA. Signed on 2002-09-29. Completion date: 2002-12-16.
$5,718, same as above.Signed on 2002-04-16. Completion date: 2002-06-01.
$3,264 with Army for Musical Instruments. Signed on 2002-07-30. Completion date: 2002-08-20.
CENTRAL TEXAS FRAME & ALIGNMEN (1188 N MCLENNAN DR; small business) : $29,182 in 3 contractsfrom 2002 to 2004
$22,437 with Army for Maintenance, Repair and Rebuilding of Equipment -- Ground Effect Vehicles, Motor Vehicles, Trailers, and Cycles. Signed on 2002-09-10. Completion date: 2002-07-31.
$7,098 with Army for Vehicular Cab, Body, and Frame Structural Components. Signed on 2004-09-24. Completion date: 2004-09-24.
-$353 with Army for Maintenance, Repair and Rebuilding of Equipment -- Ground Effect Vehicles, Motor Vehicles, Trailers, and Cycles. Signed on 2003-04-22. Completion date: 2002-07-31.
SCHAR, SUSANA (733 S MCLENNAN DR; small business) : $13,745 in 3 contractsfrom 2004 to 2005
$4,615 with Army for Passenger Motor Charter Service. Signed on 2005-05-11. Completion date: 2005-06-04.
$4,615, same as above.Signed on 2005-05-23. Completion date: 2005-06-04.
$4,515, same as above.Signed on 2004-05-24. Completion date: 2004-06-05.
Top industries in this zip code by the number of employees in 2005:
Other Services (except Public Administration): General Automotive Repair (20-49: 1)
Other Services (except Public Administration): Religious Organizations (10-19: 2, 1-4: 1)
Other Services (except Public Administration): Commercial and Industrial Machinery and Equipment (except Automotive and Electronic) Repair and Maintenance (10-19: 1, 5-9: 1)
Wholesale Trade: Metal Service Centers and Other Metal Merchant Wholesalers (10-19: 1)
People in group quarters in 2010:
26 people in workers' group living quarters and job corps centers
People in group quarters in 2000:
6 people in homes for the mentally ill
Fatal accident statistics in 2014:
Fatal accident count: 1
Vehicles involved in fatal accidents: 2
Fatal accidents caused by drunken drivers: 0
Fatalities: 1
Persons involved in fatal accidents: 2
Pedestrians involved in fatal accidents: 0
Fatal accident statistics in 2013:
Fatal accident count: 1
Vehicles involved in fatal accidents: 1
Fatal accidents caused by drunken drivers: 1
Fatalities: 1
Persons involved in fatal accidents: 1
Pedestrians involved in fatal accidents: 0
Home Mortgage Disclosure Act Aggregated Statistics For Year 2009 (Based on 6 partial tracts)
A) FHA, FSA/RHS & VA Home Purchase Loans
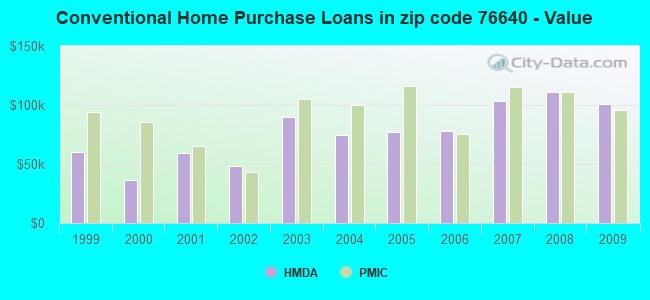
B) Conventional Home Purchase Loans
C) Refinancings
D) Home Improvement Loans
F) Non-occupant Loans on < 5 Family Dwellings (A B C & D)
G) Loans On Manufactured Home Dwelling (A B C & D)
Number
Average Value
Number
Average Value
Number
Average Value
Number
Average Value
Number
Average Value
Number
Average Value
LOANS ORIGINATED
32
$114,742
32
$101,113
64
$123,108
4
$49,990
10
$94,073
6
$35,443
APPLICATIONS APPROVED, NOT ACCEPTED
1
$104,800
6
$106,200
9
$107,701
1
$6,130
1
$61,340
2
$55,210
APPLICATIONS DENIED
3
$100,367
9
$72,877
34
$109,676
7
$57,891
1
$54,980
4
$25,612
APPLICATIONS WITHDRAWN
3
$97,340
3
$86,267
21
$117,090
4
$33,865
1
$52,400
0
$0
FILES CLOSED FOR INCOMPLETENESS
0
$0
1
$51,120
4
$157,705
0
$0
0
$0
1
$51,120
Aggregated Statistics For Year 2008 (Based on 6 partial tracts)
A) FHA, FSA/RHS & VA Home Purchase Loans
B) Conventional Home Purchase Loans
C) Refinancings
D) Home Improvement Loans
F) Non-occupant Loans on < 5 Family Dwellings (A B C & D)
G) Loans On Manufactured Home Dwelling (A B C & D)
Number
Average Value
Number
Average Value
Number
Average Value
Number
Average Value
Number
Average Value
Number
Average Value
LOANS ORIGINATED
29
$116,110
37
$111,189
59
$116,545
12
$58,141
11
$85,808
6
$65,945
APPLICATIONS APPROVED, NOT ACCEPTED
3
$169,663
7
$86,231
4
$131,212
0
$0
3
$118,167
2
$35,095
APPLICATIONS DENIED
5
$106,008
11
$81,007
56
$105,002
16
$56,252
7
$122,451
5
$40,468
APPLICATIONS WITHDRAWN
0
$0
1
$138,190
26
$117,403
0
$0
0
$0
1
$30,670
FILES CLOSED FOR INCOMPLETENESS
1
$133,550
0
$0
1
$158,000
0
$0
0
$0
0
$0
Aggregated Statistics For Year 2007 (Based on 6 partial tracts)
A) FHA, FSA/RHS & VA Home Purchase Loans
B) Conventional Home Purchase Loans
C) Refinancings
D) Home Improvement Loans
F) Non-occupant Loans on < 5 Family Dwellings (A B C & D)
G) Loans On Manufactured Home Dwelling (A B C & D)
Number
Average Value
Number
Average Value
Number
Average Value
Number
Average Value
Number
Average Value
Number
Average Value
LOANS ORIGINATED
25
$103,524
72
$103,151
65
$100,143
33
$27,202
19
$67,384
14
$50,135
APPLICATIONS APPROVED, NOT ACCEPTED
2
$82,255
6
$62,657
18
$81,126
2
$56,030
2
$37,360
0
$0
APPLICATIONS DENIED
3
$90,983
11
$91,429
85
$92,135
37
$53,632
5
$71,522
4
$37,560
APPLICATIONS WITHDRAWN
0
$0
13
$141,721
50
$107,307
3
$78,193
0
$0
0
$0
FILES CLOSED FOR INCOMPLETENESS
1
$174,210
1
$218,350
10
$105,161
1
$104,280
0
$0
0
$0
Aggregated Statistics For Year 2006 (Based on 6 partial tracts)
A) FHA, FSA/RHS & VA Home Purchase Loans
B) Conventional Home Purchase Loans
C) Refinancings
D) Home Improvement Loans
F) Non-occupant Loans on < 5 Family Dwellings (A B C & D)
G) Loans On Manufactured Home Dwelling (A B C & D)
Number
Average Value
Number
Average Value
Number
Average Value
Number
Average Value
Number
Average Value
Number
Average Value
LOANS ORIGINATED
19
$92,883
90
$77,570
72
$107,228
17
$43,525
17
$65,015
9
$55,000
APPLICATIONS APPROVED, NOT ACCEPTED
1
$113,490
14
$90,541
8
$95,592
3
$19,083
1
$46,490
3
$49,757
APPLICATIONS DENIED
4
$54,922
28
$50,385
68
$104,420
29
$35,249
8
$41,855
22
$36,010
APPLICATIONS WITHDRAWN
3
$115,487
9
$79,112
53
$94,670
5
$26,922
3
$24,987
1
$30,670
FILES CLOSED FOR INCOMPLETENESS
0
$0
1
$126,650
24
$105,614
0
$0
0
$0
0
$0
Aggregated Statistics For Year 2005 (Based on 6 partial tracts)
A) FHA, FSA/RHS & VA Home Purchase Loans
B) Conventional Home Purchase Loans
C) Refinancings
D) Home Improvement Loans
F) Non-occupant Loans on < 5 Family Dwellings (A B C & D)
G) Loans On Manufactured Home Dwelling (A B C & D)
Number
Average Value
Number
Average Value
Number
Average Value
Number
Average Value
Number
Average Value
Number
Average Value
LOANS ORIGINATED
21
$101,959
96
$76,808
96
$110,607
20
$76,910
16
$139,301
12
$49,376
APPLICATIONS APPROVED, NOT ACCEPTED
0
$0
18
$76,382
16
$81,134
7
$52,143
1
$46,130
5
$53,856
APPLICATIONS DENIED
4
$106,092
42
$62,264
84
$87,039
23
$46,073
5
$58,428
22
$50,906
APPLICATIONS WITHDRAWN
5
$100,848
21
$94,178
76
$116,818
11
$143,115
3
$100,877
1
$51,120
FILES CLOSED FOR INCOMPLETENESS
0
$0
4
$69,275
25
$107,628
1
$86,900
2
$80,855
0
$0
Aggregated Statistics For Year 2004 (Based on 6 partial tracts)
A) FHA, FSA/RHS & VA Home Purchase Loans
B) Conventional Home Purchase Loans
C) Refinancings
D) Home Improvement Loans
F) Non-occupant Loans on < 5 Family Dwellings (A B C & D)
G) Loans On Manufactured Home Dwelling (A B C & D)
Number
Average Value
Number
Average Value
Number
Average Value
Number
Average Value
Number
Average Value
Number
Average Value
LOANS ORIGINATED
28
$92,118
85
$74,981
120
$89,290
22
$32,577
17
$69,632
16
$43,146
APPLICATIONS APPROVED, NOT ACCEPTED
3
$89,993
14
$55,092
24
$107,794
5
$42,284
1
$43,960
7
$38,413
APPLICATIONS DENIED
3
$72,977
35
$62,417
85
$83,086
22
$32,241
2
$76,045
20
$43,858
APPLICATIONS WITHDRAWN
4
$65,875
8
$77,125
59
$89,796
5
$22,250
0
$0
1
$12,270
FILES CLOSED FOR INCOMPLETENESS
1
$138,320
0
$0
33
$93,668
0
$0
1
$66,460
0
$0
Aggregated Statistics For Year 2003 (Based on 6 partial tracts)
A) FHA, FSA/RHS & VA Home Purchase Loans
B) Conventional Home Purchase Loans
C) Refinancings
D) Home Improvement Loans
E) Loans on Dwellings For 5+ Families
F) Non-occupant Loans on < 5 Family Dwellings (A B C & D)
Number
Average Value
Number
Average Value
Number
Average Value
Number
Average Value
Number
Average Value
Number
Average Value
LOANS ORIGINATED
27
$84,364
78
$89,953
205
$83,774
17
$37,128
0
$0
13
$50,225
APPLICATIONS APPROVED, NOT ACCEPTED
3
$66,287
9
$93,628
28
$70,207
2
$26,135
0
$0
3
$103,943
APPLICATIONS DENIED
2
$149,095
18
$66,508
97
$82,301
13
$28,645
1
$270,940
3
$113,180
APPLICATIONS WITHDRAWN
2
$121,980
9
$90,466
62
$84,578
4
$23,832
0
$0
3
$64,277
FILES CLOSED FOR INCOMPLETENESS
1
$80,770
11
$55,455
8
$97,374
0
$0
0
$0
0
$0
Aggregated Statistics For Year 2002 (Based on 4 partial tracts)
A) FHA, FSA/RHS & VA Home Purchase Loans
B) Conventional Home Purchase Loans
C) Refinancings
D) Home Improvement Loans
F) Non-occupant Loans on < 5 Family Dwellings (A B C & D)
Number
Average Value
Number
Average Value
Number
Average Value
Number
Average Value
Number
Average Value
LOANS ORIGINATED
5
$70,982
6
$48,068
15
$54,932
1
$16,610
5
$39,410
APPLICATIONS APPROVED, NOT ACCEPTED
0
$0
1
$36,290
1
$73,890
0
$0
0
$0
APPLICATIONS DENIED
0
$0
3
$44,093
6
$50,733
2
$9,400
2
$26,385
APPLICATIONS WITHDRAWN
0
$0
0
$0
9
$53,369
0
$0
0
$0
FILES CLOSED FOR INCOMPLETENESS
0
$0
0
$0
0
$0
0
$0
0
$0
Aggregated Statistics For Year 2001 (Based on 4 partial tracts)
A) FHA, FSA/RHS & VA Home Purchase Loans
B) Conventional Home Purchase Loans
C) Refinancings
D) Home Improvement Loans
F) Non-occupant Loans on < 5 Family Dwellings (A B C & D)
Number
Average Value
Number
Average Value
Number
Average Value
Number
Average Value
Number
Average Value
LOANS ORIGINATED
5
$64,280
11
$59,510
9
$48,907
3
$14,883
1
$45,760
APPLICATIONS APPROVED, NOT ACCEPTED
0
$0
2
$66,215
0
$0
0
$0
0
$0
APPLICATIONS DENIED
0
$0
9
$41,001
6
$34,282
2
$12,120
0
$0
APPLICATIONS WITHDRAWN
1
$95,940
1
$93,730
7
$44,123
0
$0
0
$0
FILES CLOSED FOR INCOMPLETENESS
0
$0
0
$0
1
$44,280
0
$0
0
$0
Aggregated Statistics For Year 2000 (Based on 4 partial tracts)
A) FHA, FSA/RHS & VA Home Purchase Loans
B) Conventional Home Purchase Loans
C) Refinancings
D) Home Improvement Loans
F) Non-occupant Loans on < 5 Family Dwellings (A B C & D)
Number
Average Value
Number
Average Value
Number
Average Value
Number
Average Value
Number
Average Value
LOANS ORIGINATED
7
$60,990
7
$36,426
5
$39,114
1
$16,970
2
$28,045
APPLICATIONS APPROVED, NOT ACCEPTED
0
$0
0
$0
1
$47,600
1
$17,710
0
$0
APPLICATIONS DENIED
0
$0
11
$37,779
6
$32,533
0
$0
1
$18,400
APPLICATIONS WITHDRAWN
1
$82,290
1
$78,970
2
$47,785
0
$0
0
$0
FILES CLOSED FOR INCOMPLETENESS
0
$0
3
$45,263
4
$54,428
0
$0
0
$0
Aggregated Statistics For Year 1999 (Based on 3 partial tracts)
A) FHA, FSA/RHS & VA Home Purchase Loans
B) Conventional Home Purchase Loans
C) Refinancings
D) Home Improvement Loans
F) Non-occupant Loans on < 5 Family Dwellings (A B C & D)
2002 - 2018 National Fire Incident Reporting System (NFIRS) incidents
Based on the data from the years 2002 - 2018 the average number of fire incidents per year is 19. The highest number of fires - 51 took place in 2018, and the least - 0 in 2007. The data has a rising trend.
When looking into fire subcategories, the most reports belonged to: Outside Fires (42.8%), and Structure Fires (39.4%).
Fire incident types reported to NFIRS in Zip Code 76640


 Nearest zip codes: 76654, 76691, 76705, 76624, 76704, 76798.


 : $327,534 in 8 contracts from 2001 to 2005


 Based on the data from the years 2002 - 2018 the average number of fire incidents per year is 19. The highest number of fires - 51 took place in 2018, and the least - 0 in 2007. The data has a rising trend.
 When looking into fire subcategories, the most reports belonged to: Outside Fires (42.8%), and Structure Fires (39.4%).