Estimated zip code population in 2022: 28,575
Zip code population in 2010: 26,938
Zip code population in 2000: 23,918
Houses and condos: 8,973
Renter-occupied apartments: 2,000
% of renters here:
23%State:
38%
March 2022 cost of living index in zip code 76018: 95.9
(near average, U.S. average is 100)
Land area: 7.7
sq. mi.
Water area: 0.0
sq. mi.
Population density: 3,733 people per square mile (average).
OSM Map
General Map
Google Map
MSN Map
OSM Map
General Map
Google Map
MSN Map
OSM Map
General Map
Google Map
MSN Map
OSM Map
General Map
Google Map
MSN Map
Please wait while loading the map...
Real estate property taxes paid for housing units in 2022:
This zip code:
1.7% ($4,262)Texas:
1.5% ($4,050)
Median real estate property taxes paid for housing units with mortgages in 2022: $4,416 (1.7%)
Median real estate property taxes paid for housing units with no mortgage in 2022: $4,117 (1.8%)
Profiles of local businesses
Business Search - 14 Million verified businesses
Males: 13,738 Females: 14,836
For population 25 years and over in 76018:
High school or higher: 83.4%Bachelor's degree or higher: 27.6%Graduate or professional degree: 9.5%Unemployed: 4.2%Mean travel time to work (commute): 28.1 minutes
For population 15 years and over in 76018:
Never married: 39.8%Now married: 47.4%Separated: 1.3%Widowed: 4.1%Divorced: 7.5%
Zip code 76018 compared to state average:
Black race population percentage above state average. Median age below state average. Renting percentage below state average. Length of stay since moving in significantly above state average. 9,041 31.6% Hispanic or Latino 6,574 23.0% Black 6,514 22.8% White 5,050 17.7% Asian 1,213 4.2% Two or more races 180 0.6% Some other race
Data:
Median household income ($)
Median household income (% change since 2000)
Household income diversity
Ratio of average income to average house value (%)
Ratio of average income to average rent
Median household income ($) - White
Median household income ($) - Black or African American
Median household income ($) - Asian
Median household income ($) - Hispanic or Latino
Median household income ($) - American Indian and Alaska Native
Median household income ($) - Multirace
Median household income ($) - Other Race
Median household income for houses/condos with a mortgage ($)
Median household income for apartments without a mortgage ($)
Races - White alone (%)
Races - White alone (% change since 2000)
Races - Black alone (%)
Races - Black alone (% change since 2000)
Races - American Indian alone (%)
Races - American Indian alone (% change since 2000)
Races - Asian alone (%)
Races - Asian alone (% change since 2000)
Races - Hispanic (%)
Races - Hispanic (% change since 2000)
Races - Native Hawaiian and Other Pacific Islander alone (%)
Races - Native Hawaiian and Other Pacific Islander alone (% change since 2000)
Races - Two or more races (%)
Races - Two or more races (% change since 2000)
Races - Other race alone (%)
Races - Other race alone (% change since 2000)
Racial diversity
Unemployment (%)
Unemployment (% change since 2000)
Unemployment (%) - White
Unemployment (%) - Black or African American
Unemployment (%) - Asian
Unemployment (%) - Hispanic or Latino
Unemployment (%) - American Indian and Alaska Native
Unemployment (%) - Multirace
Unemployment (%) - Other Race
Population density (people per square mile)
Population - Males (%)
Population - Females (%)
Population - Males (%) - White
Population - Males (%) - Black or African American
Population - Males (%) - Asian
Population - Males (%) - Hispanic or Latino
Population - Males (%) - American Indian and Alaska Native
Population - Males (%) - Multirace
Population - Males (%) - Other Race
Population - Females (%) - White
Population - Females (%) - Black or African American
Population - Females (%) - Asian
Population - Females (%) - Hispanic or Latino
Population - Females (%) - American Indian and Alaska Native
Population - Females (%) - Multirace
Population - Females (%) - Other Race
Coronavirus confirmed cases (Jun 10, 2024)
Deaths caused by coronavirus (Jun 10, 2024)
Coronavirus confirmed cases (per 100k population) (Jun 10, 2024)
Deaths caused by coronavirus (per 100k population) (Jun 10, 2024)
Daily increase in number of cases (Jun 10, 2024)
Weekly increase in number of cases (Jun 10, 2024)
Cases doubled (in days) (Jun 10, 2024)
Hospitalized patients (Apr 18, 2022)
Negative test results (Apr 18, 2022)
Total test results (Apr 18, 2022)
COVID Vaccine doses distributed (per 100k population) (Sep 19, 2023)
COVID Vaccine doses administered (per 100k population) (Sep 19, 2023)
COVID Vaccine doses distributed (Sep 19, 2023)
COVID Vaccine doses administered (Sep 19, 2023)
Likely homosexual households (%)
Likely homosexual households (% change since 2000)
Likely homosexual households - Lesbian couples (%)
Likely homosexual households - Lesbian couples (% change since 2000)
Likely homosexual households - Gay men (%)
Likely homosexual households - Gay men (% change since 2000)
Cost of living index
Median gross rent ($)
Median contract rent ($)
Median monthly housing costs ($)
Median house or condo value ($)
Median house or condo value ($ change since 2000)
Mean house or condo value by units in structure - 1, detached ($)
Mean house or condo value by units in structure - 1, attached ($)
Mean house or condo value by units in structure - 2 ($)
Mean house or condo value by units in structure by units in structure - 3 or 4 ($)
Mean house or condo value by units in structure - 5 or more ($)
Mean house or condo value by units in structure - Boat, RV, van, etc. ($)
Mean house or condo value by units in structure - Mobile home ($)
Median house or condo value ($) - White
Median house or condo value ($) - Black or African American
Median house or condo value ($) - Asian
Median house or condo value ($) - Hispanic or Latino
Median house or condo value ($) - American Indian and Alaska Native
Median house or condo value ($) - Multirace
Median house or condo value ($) - Other Race
Median resident age
Resident age diversity
Median resident age - Males
Median resident age - Females
Median resident age - White
Median resident age - Black or African American
Median resident age - Asian
Median resident age - Hispanic or Latino
Median resident age - American Indian and Alaska Native
Median resident age - Multirace
Median resident age - Other Race
Median resident age - Males - White
Median resident age - Males - Black or African American
Median resident age - Males - Asian
Median resident age - Males - Hispanic or Latino
Median resident age - Males - American Indian and Alaska Native
Median resident age - Males - Multirace
Median resident age - Males - Other Race
Median resident age - Females - White
Median resident age - Females - Black or African American
Median resident age - Females - Asian
Median resident age - Females - Hispanic or Latino
Median resident age - Females - American Indian and Alaska Native
Median resident age - Females - Multirace
Median resident age - Females - Other Race
Commute - mean travel time to work (minutes)
Travel time to work - Less than 5 minutes (%)
Travel time to work - Less than 5 minutes (% change since 2000)
Travel time to work - 5 to 9 minutes (%)
Travel time to work - 5 to 9 minutes (% change since 2000)
Travel time to work - 10 to 19 minutes (%)
Travel time to work - 10 to 19 minutes (% change since 2000)
Travel time to work - 20 to 29 minutes (%)
Travel time to work - 20 to 29 minutes (% change since 2000)
Travel time to work - 30 to 39 minutes (%)
Travel time to work - 30 to 39 minutes (% change since 2000)
Travel time to work - 40 to 59 minutes (%)
Travel time to work - 40 to 59 minutes (% change since 2000)
Travel time to work - 60 to 89 minutes (%)
Travel time to work - 60 to 89 minutes (% change since 2000)
Travel time to work - 90 or more minutes (%)
Travel time to work - 90 or more minutes (% change since 2000)
Marital status - Never married (%)
Marital status - Now married (%)
Marital status - Separated (%)
Marital status - Widowed (%)
Marital status - Divorced (%)
Median family income ($)
Median family income (% change since 2000)
Median non-family income ($)
Median non-family income (% change since 2000)
Median per capita income ($)
Median per capita income (% change since 2000)
Median family income ($) - White
Median family income ($) - Black or African American
Median family income ($) - Asian
Median family income ($) - Hispanic or Latino
Median family income ($) - American Indian and Alaska Native
Median family income ($) - Multirace
Median family income ($) - Other Race
Median year house/condo built
Median year apartment built
Year house built - Built 2005 or later (%)
Year house built - Built 2000 to 2004 (%)
Year house built - Built 1990 to 1999 (%)
Year house built - Built 1980 to 1989 (%)
Year house built - Built 1970 to 1979 (%)
Year house built - Built 1960 to 1969 (%)
Year house built - Built 1950 to 1959 (%)
Year house built - Built 1940 to 1949 (%)
Year house built - Built 1939 or earlier (%)
Average household size
Household density (households per square mile)
Average household size - White
Average household size - Black or African American
Average household size - Asian
Average household size - Hispanic or Latino
Average household size - American Indian and Alaska Native
Average household size - Multirace
Average household size - Other Race
Occupied housing units (%)
Vacant housing units (%)
Owner occupied housing units (%)
Renter occupied housing units (%)
Vacancy status - For rent (%)
Vacancy status - For sale only (%)
Vacancy status - Rented or sold, not occupied (%)
Vacancy status - For seasonal, recreational, or occasional use (%)
Vacancy status - For migrant workers (%)
Vacancy status - Other vacant (%)
Residents with income below the poverty level (%)
Residents with income below 50% of the poverty level (%)
Children below poverty level (%)
Poor families by family type - Married-couple family (%)
Poor families by family type - Male, no wife present (%)
Poor families by family type - Female, no husband present (%)
Poverty status for native-born residents (%)
Poverty status for foreign-born residents (%)
Poverty among high school graduates not in families (%)
Poverty among people who did not graduate high school not in families (%)
Residents with income below the poverty level (%) - White
Residents with income below the poverty level (%) - Black or African American
Residents with income below the poverty level (%) - Asian
Residents with income below the poverty level (%) - Hispanic or Latino
Residents with income below the poverty level (%) - American Indian and Alaska Native
Residents with income below the poverty level (%) - Multirace
Residents with income below the poverty level (%) - Other Race
Air pollution - Air Quality Index (AQI)
Air pollution - CO
Air pollution - NO2
Air pollution - SO2
Air pollution - Ozone
Air pollution - PM10
Air pollution - PM25
Air pollution - Pb
Crime - Murders per 100,000 population
Crime - Rapes per 100,000 population
Crime - Robberies per 100,000 population
Crime - Assaults per 100,000 population
Crime - Burglaries per 100,000 population
Crime - Thefts per 100,000 population
Crime - Auto thefts per 100,000 population
Crime - Arson per 100,000 population
Crime - City-data.com crime index
Crime - Violent crime index
Crime - Property crime index
Crime - Murders per 100,000 population (5 year average)
Crime - Rapes per 100,000 population (5 year average)
Crime - Robberies per 100,000 population (5 year average)
Crime - Assaults per 100,000 population (5 year average)
Crime - Burglaries per 100,000 population (5 year average)
Crime - Thefts per 100,000 population (5 year average)
Crime - Auto thefts per 100,000 population (5 year average)
Crime - Arson per 100,000 population (5 year average)
Crime - City-data.com crime index (5 year average)
Crime - Violent crime index (5 year average)
Crime - Property crime index (5 year average)
1996 Presidential Elections Results (%) - Democratic Party (Clinton)
1996 Presidential Elections Results (%) - Republican Party (Dole)
1996 Presidential Elections Results (%) - Other
2000 Presidential Elections Results (%) - Democratic Party (Gore)
2000 Presidential Elections Results (%) - Republican Party (Bush)
2000 Presidential Elections Results (%) - Other
2004 Presidential Elections Results (%) - Democratic Party (Kerry)
2004 Presidential Elections Results (%) - Republican Party (Bush)
2004 Presidential Elections Results (%) - Other
2008 Presidential Elections Results (%) - Democratic Party (Obama)
2008 Presidential Elections Results (%) - Republican Party (McCain)
2008 Presidential Elections Results (%) - Other
2012 Presidential Elections Results (%) - Democratic Party (Obama)
2012 Presidential Elections Results (%) - Republican Party (Romney)
2012 Presidential Elections Results (%) - Other
2016 Presidential Elections Results (%) - Democratic Party (Clinton)
2016 Presidential Elections Results (%) - Republican Party (Trump)
2016 Presidential Elections Results (%) - Other
2020 Presidential Elections Results (%) - Democratic Party (Biden)
2020 Presidential Elections Results (%) - Republican Party (Trump)
2020 Presidential Elections Results (%) - Other
Ancestries Reported - Arab (%)
Ancestries Reported - Czech (%)
Ancestries Reported - Danish (%)
Ancestries Reported - Dutch (%)
Ancestries Reported - English (%)
Ancestries Reported - French (%)
Ancestries Reported - French Canadian (%)
Ancestries Reported - German (%)
Ancestries Reported - Greek (%)
Ancestries Reported - Hungarian (%)
Ancestries Reported - Irish (%)
Ancestries Reported - Italian (%)
Ancestries Reported - Lithuanian (%)
Ancestries Reported - Norwegian (%)
Ancestries Reported - Polish (%)
Ancestries Reported - Portuguese (%)
Ancestries Reported - Russian (%)
Ancestries Reported - Scotch-Irish (%)
Ancestries Reported - Scottish (%)
Ancestries Reported - Slovak (%)
Ancestries Reported - Subsaharan African (%)
Ancestries Reported - Swedish (%)
Ancestries Reported - Swiss (%)
Ancestries Reported - Ukrainian (%)
Ancestries Reported - United States (%)
Ancestries Reported - Welsh (%)
Ancestries Reported - West Indian (%)
Ancestries Reported - Other (%)
Educational Attainment - No schooling completed (%)
Educational Attainment - Less than high school (%)
Educational Attainment - High school or equivalent (%)
Educational Attainment - Less than 1 year of college (%)
Educational Attainment - 1 or more years of college (%)
Educational Attainment - Associate degree (%)
Educational Attainment - Bachelor's degree (%)
Educational Attainment - Master's degree (%)
Educational Attainment - Professional school degree (%)
Educational Attainment - Doctorate degree (%)
School Enrollment - Nursery, preschool (%)
School Enrollment - Kindergarten (%)
School Enrollment - Grade 1 to 4 (%)
School Enrollment - Grade 5 to 8 (%)
School Enrollment - Grade 9 to 12 (%)
School Enrollment - College undergrad (%)
School Enrollment - Graduate or professional (%)
School Enrollment - Not enrolled in school (%)
School enrollment - Public schools (%)
School enrollment - Private schools (%)
School enrollment - Not enrolled (%)
Median number of rooms in houses and condos
Median number of rooms in apartments
Housing units lacking complete plumbing facilities (%)
Housing units lacking complete kitchen facilities (%)
Density of houses
Urban houses (%)
Rural houses (%)
Households with people 60 years and over (%)
Households with people 65 years and over (%)
Households with people 75 years and over (%)
Households with one or more nonrelatives (%)
Households with no nonrelatives (%)
Population in households (%)
Family households (%)
Nonfamily households (%)
Population in families (%)
Family households with own children (%)
Median number of bedrooms in owner occupied houses
Mean number of bedrooms in owner occupied houses
Median number of bedrooms in renter occupied houses
Mean number of bedrooms in renter occupied houses
Median number of vehichles in owner occupied houses
Mean number of vehichles in owner occupied houses
Median number of vehichles in renter occupied houses
Mean number of vehichles in renter occupied houses
Mortgage status - with mortgage (%)
Mortgage status - with second mortgage (%)
Mortgage status - with home equity loan (%)
Mortgage status - with both second mortgage and home equity loan (%)
Mortgage status - without a mortgage (%)
Average family size
Average family size - White
Average family size - Black or African American
Average family size - Asian
Average family size - Hispanic or Latino
Average family size - American Indian and Alaska Native
Average family size - Multirace
Average family size - Other Race
Geographical mobility - Same house 1 year ago (%)
Geographical mobility - Moved within same county (%)
Geographical mobility - Moved from different county within same state (%)
Geographical mobility - Moved from different state (%)
Geographical mobility - Moved from abroad (%)
Place of birth - Born in state of residence (%)
Place of birth - Born in other state (%)
Place of birth - Native, outside of US (%)
Place of birth - Foreign born (%)
Housing units in structures - 1, detached (%)
Housing units in structures - 1, attached (%)
Housing units in structures - 2 (%)
Housing units in structures - 3 or 4 (%)
Housing units in structures - 5 to 9 (%)
Housing units in structures - 10 to 19 (%)
Housing units in structures - 20 to 49 (%)
Housing units in structures - 50 or more (%)
Housing units in structures - Mobile home (%)
Housing units in structures - Boat, RV, van, etc. (%)
House/condo owner moved in on average (years ago)
Renter moved in on average (years ago)
Year householder moved into unit - Moved in 1999 to March 2000 (%)
Year householder moved into unit - Moved in 1995 to 1998 (%)
Year householder moved into unit - Moved in 1990 to 1994 (%)
Year householder moved into unit - Moved in 1980 to 1989 (%)
Year householder moved into unit - Moved in 1970 to 1979 (%)
Year householder moved into unit - Moved in 1969 or earlier (%)
Means of transportation to work - Drove car alone (%)
Means of transportation to work - Carpooled (%)
Means of transportation to work - Public transportation (%)
Means of transportation to work - Bus or trolley bus (%)
Means of transportation to work - Streetcar or trolley car (%)
Means of transportation to work - Subway or elevated (%)
Means of transportation to work - Railroad (%)
Means of transportation to work - Ferryboat (%)
Means of transportation to work - Taxicab (%)
Means of transportation to work - Motorcycle (%)
Means of transportation to work - Bicycle (%)
Means of transportation to work - Walked (%)
Means of transportation to work - Other means (%)
Working at home (%)
Industry diversity
Most Common Industries - Agriculture, forestry, fishing and hunting, and mining (%)
Most Common Industries - Agriculture, forestry, fishing and hunting (%)
Most Common Industries - Mining, quarrying, and oil and gas extraction (%)
Most Common Industries - Construction (%)
Most Common Industries - Manufacturing (%)
Most Common Industries - Wholesale trade (%)
Most Common Industries - Retail trade (%)
Most Common Industries - Transportation and warehousing, and utilities (%)
Most Common Industries - Transportation and warehousing (%)
Most Common Industries - Utilities (%)
Most Common Industries - Information (%)
Most Common Industries - Finance and insurance, and real estate and rental and leasing (%)
Most Common Industries - Finance and insurance (%)
Most Common Industries - Real estate and rental and leasing (%)
Most Common Industries - Professional, scientific, and management, and administrative and waste management services (%)
Most Common Industries - Professional, scientific, and technical services (%)
Most Common Industries - Management of companies and enterprises (%)
Most Common Industries - Administrative and support and waste management services (%)
Most Common Industries - Educational services, and health care and social assistance (%)
Most Common Industries - Educational services (%)
Most Common Industries - Health care and social assistance (%)
Most Common Industries - Arts, entertainment, and recreation, and accommodation and food services (%)
Most Common Industries - Arts, entertainment, and recreation (%)
Most Common Industries - Accommodation and food services (%)
Most Common Industries - Other services, except public administration (%)
Most Common Industries - Public administration (%)
Occupation diversity
Most Common Occupations - Management, business, science, and arts occupations (%)
Most Common Occupations - Management, business, and financial occupations (%)
Most Common Occupations - Management occupations (%)
Most Common Occupations - Business and financial operations occupations (%)
Most Common Occupations - Computer, engineering, and science occupations (%)
Most Common Occupations - Computer and mathematical occupations (%)
Most Common Occupations - Architecture and engineering occupations (%)
Most Common Occupations - Life, physical, and social science occupations (%)
Most Common Occupations - Education, legal, community service, arts, and media occupations (%)
Most Common Occupations - Community and social service occupations (%)
Most Common Occupations - Legal occupations (%)
Most Common Occupations - Education, training, and library occupations (%)
Most Common Occupations - Arts, design, entertainment, sports, and media occupations (%)
Most Common Occupations - Healthcare practitioners and technical occupations (%)
Most Common Occupations - Health diagnosing and treating practitioners and other technical occupations (%)
Most Common Occupations - Health technologists and technicians (%)
Most Common Occupations - Service occupations (%)
Most Common Occupations - Healthcare support occupations (%)
Most Common Occupations - Protective service occupations (%)
Most Common Occupations - Fire fighting and prevention, and other protective service workers including supervisors (%)
Most Common Occupations - Law enforcement workers including supervisors (%)
Most Common Occupations - Food preparation and serving related occupations (%)
Most Common Occupations - Building and grounds cleaning and maintenance occupations (%)
Most Common Occupations - Personal care and service occupations (%)
Most Common Occupations - Sales and office occupations (%)
Most Common Occupations - Sales and related occupations (%)
Most Common Occupations - Office and administrative support occupations (%)
Most Common Occupations - Natural resources, construction, and maintenance occupations (%)
Most Common Occupations - Farming, fishing, and forestry occupations (%)
Most Common Occupations - Construction and extraction occupations (%)
Most Common Occupations - Installation, maintenance, and repair occupations (%)
Most Common Occupations - Production, transportation, and material moving occupations (%)
Most Common Occupations - Production occupations (%)
Most Common Occupations - Transportation occupations (%)
Most Common Occupations - Material moving occupations (%)
People in Group quarters - Institutionalized population (%)
People in Group quarters - Correctional institutions (%)
People in Group quarters - Federal prisons and detention centers (%)
People in Group quarters - Halfway houses (%)
People in Group quarters - Local jails and other confinement facilities (including police lockups) (%)
People in Group quarters - Military disciplinary barracks (%)
People in Group quarters - State prisons (%)
People in Group quarters - Other types of correctional institutions (%)
People in Group quarters - Nursing homes (%)
People in Group quarters - Hospitals/wards, hospices, and schools for the handicapped (%)
People in Group quarters - Hospitals/wards and hospices for chronically ill (%)
People in Group quarters - Hospices or homes for chronically ill (%)
People in Group quarters - Military hospitals or wards for chronically ill (%)
People in Group quarters - Other hospitals or wards for chronically ill (%)
People in Group quarters - Hospitals or wards for drug/alcohol abuse (%)
People in Group quarters - Mental (Psychiatric) hospitals or wards (%)
People in Group quarters - Schools, hospitals, or wards for the mentally retarded (%)
People in Group quarters - Schools, hospitals, or wards for the physically handicapped (%)
People in Group quarters - Institutions for the deaf (%)
People in Group quarters - Institutions for the blind (%)
People in Group quarters - Orthopedic wards and institutions for the physically handicapped (%)
People in Group quarters - Wards in general hospitals for patients who have no usual home elsewhere (%)
People in Group quarters - Wards in military hospitals for patients who have no usual home elsewhere (%)
People in Group quarters - Juvenile institutions (%)
People in Group quarters - Long-term care (%)
People in Group quarters - Homes for abused, dependent, and neglected children (%)
People in Group quarters - Residential treatment centers for emotionally disturbed children (%)
People in Group quarters - Training schools for juvenile delinquents (%)
People in Group quarters - Short-term care, detention or diagnostic centers for delinquent children (%)
People in Group quarters - Type of juvenile institution unknown (%)
People in Group quarters - Noninstitutionalized population (%)
People in Group quarters - College dormitories (includes college quarters off campus) (%)
People in Group quarters - Military quarters (%)
People in Group quarters - On base (%)
People in Group quarters - Barracks, unaccompanied personnel housing (UPH), (Enlisted/Officer), ;and similar group living quarters for military personnel (%)
People in Group quarters - Transient quarters for temporary residents (%)
People in Group quarters - Military ships (%)
People in Group quarters - Group homes (%)
People in Group quarters - Homes or halfway houses for drug/alcohol abuse (%)
People in Group quarters - Homes for the mentally ill (%)
People in Group quarters - Homes for the mentally retarded (%)
People in Group quarters - Homes for the physically handicapped (%)
People in Group quarters - Other group homes (%)
People in Group quarters - Religious group quarters (%)
People in Group quarters - Dormitories (%)
People in Group quarters - Agriculture workers' dormitories on farms (%)
People in Group quarters - Job Corps and vocational training facilities (%)
People in Group quarters - Other workers' dormitories (%)
People in Group quarters - Crews of maritime vessels (%)
People in Group quarters - Other nonhousehold living situations (%)
People in Group quarters - Other noninstitutional group quarters (%)
Residents speaking English at home (%)
Residents speaking English at home - Born in the United States (%)
Residents speaking English at home - Native, born elsewhere (%)
Residents speaking English at home - Foreign born (%)
Residents speaking Spanish at home (%)
Residents speaking Spanish at home - Born in the United States (%)
Residents speaking Spanish at home - Native, born elsewhere (%)
Residents speaking Spanish at home - Foreign born (%)
Residents speaking other language at home (%)
Residents speaking other language at home - Born in the United States (%)
Residents speaking other language at home - Native, born elsewhere (%)
Residents speaking other language at home - Foreign born (%)
Class of Workers - Employee of private company (%)
Class of Workers - Self-employed in own incorporated business (%)
Class of Workers - Private not-for-profit wage and salary workers (%)
Class of Workers - Local government workers (%)
Class of Workers - State government workers (%)
Class of Workers - Federal government workers (%)
Class of Workers - Self-employed workers in own not incorporated business and Unpaid family workers (%)
House heating fuel used in houses and condos - Utility gas (%)
House heating fuel used in houses and condos - Bottled, tank, or LP gas (%)
House heating fuel used in houses and condos - Electricity (%)
House heating fuel used in houses and condos - Fuel oil, kerosene, etc. (%)
House heating fuel used in houses and condos - Coal or coke (%)
House heating fuel used in houses and condos - Wood (%)
House heating fuel used in houses and condos - Solar energy (%)
House heating fuel used in houses and condos - Other fuel (%)
House heating fuel used in houses and condos - No fuel used (%)
House heating fuel used in apartments - Utility gas (%)
House heating fuel used in apartments - Bottled, tank, or LP gas (%)
House heating fuel used in apartments - Electricity (%)
House heating fuel used in apartments - Fuel oil, kerosene, etc. (%)
House heating fuel used in apartments - Coal or coke (%)
House heating fuel used in apartments - Wood (%)
House heating fuel used in apartments - Solar energy (%)
House heating fuel used in apartments - Other fuel (%)
House heating fuel used in apartments - No fuel used (%)
Armed forces status - In Armed Forces (%)
Armed forces status - Civilian (%)
Armed forces status - Civilian - Veteran (%)
Armed forces status - Civilian - Nonveteran (%)
Fatal accidents locations in years 2005-2021
Fatal accidents locations in 2005
Fatal accidents locations in 2006
Fatal accidents locations in 2007
Fatal accidents locations in 2008
Fatal accidents locations in 2009
Fatal accidents locations in 2010
Fatal accidents locations in 2011
Fatal accidents locations in 2012
Fatal accidents locations in 2013
Fatal accidents locations in 2014
Fatal accidents locations in 2015
Fatal accidents locations in 2016
Fatal accidents locations in 2017
Fatal accidents locations in 2018
Fatal accidents locations in 2019
Fatal accidents locations in 2020
Fatal accidents locations in 2021
Alcohol use - People drinking some alcohol every month (%)
Alcohol use - People not drinking at all (%)
Alcohol use - Average days/month drinking alcohol
Alcohol use - Average drinks/week
Alcohol use - Average days/year people drink much
Audiometry - Average condition of hearing (%)
Audiometry - People that can hear a whisper from across a quiet room (%)
Audiometry - People that can hear normal voice from across a quiet room (%)
Audiometry - Ears ringing, roaring, buzzing (%)
Audiometry - Had a job exposure to loud noise (%)
Audiometry - Had off-work exposure to loud noise (%)
Blood Pressure & Cholesterol - Has high blood pressure (%)
Blood Pressure & Cholesterol - Checking blood pressure at home (%)
Blood Pressure & Cholesterol - Frequently checking blood cholesterol (%)
Blood Pressure & Cholesterol - Has high cholesterol level (%)
Consumer Behavior - Money monthly spent on food at supermarket/grocery store
Consumer Behavior - Money monthly spent on food at other stores
Consumer Behavior - Money monthly spent on eating out
Consumer Behavior - Money monthly spent on carryout/delivered foods
Consumer Behavior - Income spent on food at supermarket/grocery store (%)
Consumer Behavior - Income spent on food at other stores (%)
Consumer Behavior - Income spent on eating out (%)
Consumer Behavior - Income spent on carryout/delivered foods (%)
Current Health Status - General health condition (%)
Current Health Status - Blood donors (%)
Current Health Status - Has blood ever tested for HIV virus (%)
Current Health Status - Left-handed people (%)
Dermatology - People using sunscreen (%)
Diabetes - Diabetics (%)
Diabetes - Had a blood test for high blood sugar (%)
Diabetes - People taking insulin (%)
Diet Behavior & Nutrition - Diet health (%)
Diet Behavior & Nutrition - Milk product consumption (# of products/month)
Diet Behavior & Nutrition - Meals not home prepared (#/week)
Diet Behavior & Nutrition - Meals from fast food or pizza place (#/week)
Diet Behavior & Nutrition - Ready-to-eat foods (#/month)
Diet Behavior & Nutrition - Frozen meals/pizza (#/month)
Drug Use - People that ever used marijuana or hashish (%)
Drug Use - Ever used hard drugs (%)
Drug Use - Ever used any form of cocaine (%)
Drug Use - Ever used heroin (%)
Drug Use - Ever used methamphetamine (%)
Health Insurance - People covered by health insurance (%)
Kidney Conditions-Urology - Avg. # of times urinating at night
Medical Conditions - People with asthma (%)
Medical Conditions - People with anemia (%)
Medical Conditions - People with psoriasis (%)
Medical Conditions - People with overweight (%)
Medical Conditions - Elderly people having difficulties in thinking or remembering (%)
Medical Conditions - People who ever received blood transfusion (%)
Medical Conditions - People having trouble seeing even with glass/contacts (%)
Medical Conditions - People with arthritis (%)
Medical Conditions - People with gout (%)
Medical Conditions - People with congestive heart failure (%)
Medical Conditions - People with coronary heart disease (%)
Medical Conditions - People with angina pectoris (%)
Medical Conditions - People who ever had heart attack (%)
Medical Conditions - People who ever had stroke (%)
Medical Conditions - People with emphysema (%)
Medical Conditions - People with thyroid problem (%)
Medical Conditions - People with chronic bronchitis (%)
Medical Conditions - People with any liver condition (%)
Medical Conditions - People who ever had cancer or malignancy (%)
Mental Health - People who have little interest in doing things (%)
Mental Health - People feeling down, depressed, or hopeless (%)
Mental Health - People who have trouble sleeping or sleeping too much (%)
Mental Health - People feeling tired or having little energy (%)
Mental Health - People with poor appetite or overeating (%)
Mental Health - People feeling bad about themself (%)
Mental Health - People who have trouble concentrating on things (%)
Mental Health - People moving or speaking slowly or too fast (%)
Mental Health - People having thoughts they would be better off dead (%)
Oral Health - Average years since last visit a dentist
Oral Health - People embarrassed because of mouth (%)
Oral Health - People with gum disease (%)
Oral Health - General health of teeth and gums (%)
Oral Health - Average days a week using dental floss/device
Oral Health - Average days a week using mouthwash for dental problem
Oral Health - Average number of teeth
Pesticide Use - Households using pesticides to control insects (%)
Pesticide Use - Households using pesticides to kill weeds (%)
Physical Activity - People doing vigorous-intensity work activities (%)
Physical Activity - People doing moderate-intensity work activities (%)
Physical Activity - People walking or bicycling (%)
Physical Activity - People doing vigorous-intensity recreational activities (%)
Physical Activity - People doing moderate-intensity recreational activities (%)
Physical Activity - Average hours a day doing sedentary activities
Physical Activity - Average hours a day watching TV or videos
Physical Activity - Average hours a day using computer
Physical Functioning - People having limitations keeping them from working (%)
Physical Functioning - People limited in amount of work they can do (%)
Physical Functioning - People that need special equipment to walk (%)
Physical Functioning - People experiencing confusion/memory problems (%)
Physical Functioning - People requiring special healthcare equipment (%)
Prescription Medications - Average number of prescription medicines taking
Preventive Aspirin Use - Adults 40+ taking low-dose aspirin (%)
Reproductive Health - Vaginal deliveries (%)
Reproductive Health - Cesarean deliveries (%)
Reproductive Health - Deliveries resulted in a live birth (%)
Reproductive Health - Pregnancies resulted in a delivery (%)
Reproductive Health - Women breastfeeding newborns (%)
Reproductive Health - Women that had a hysterectomy (%)
Reproductive Health - Women that had both ovaries removed (%)
Reproductive Health - Women that have ever taken birth control pills (%)
Reproductive Health - Women taking birth control pills (%)
Reproductive Health - Women that have ever used Depo-Provera or injectables (%)
Reproductive Health - Women that have ever used female hormones (%)
Sexual Behavior - People 18+ that ever had sex (vaginal, anal, or oral) (%)
Sexual Behavior - Males 18+ that ever had vaginal sex with a woman (%)
Sexual Behavior - Males 18+ that ever performed oral sex on a woman (%)
Sexual Behavior - Males 18+ that ever had anal sex with a woman (%)
Sexual Behavior - Males 18+ that ever had any sex with a man (%)
Sexual Behavior - Females 18+ that ever had vaginal sex with a man (%)
Sexual Behavior - Females 18+ that ever performed oral sex on a man (%)
Sexual Behavior - Females 18+ that ever had anal sex with a man (%)
Sexual Behavior - Females 18+ that ever had any kind of sex with a woman (%)
Sexual Behavior - Average age people first had sex
Sexual Behavior - Average number of female sex partners in lifetime (males 18+)
Sexual Behavior - Average number of female vaginal sex partners in lifetime (males 18+)
Sexual Behavior - Average age people first performed oral sex on a woman (18+)
Sexual Behavior - Average number of woman performed oral sex on in lifetime (18+)
Sexual Behavior - Average number of male sex partners in lifetime (males 18+)
Sexual Behavior - Average number of male anal sex partners in lifetime (males 18+)
Sexual Behavior - Average age people first performed oral sex on a man (18+)
Sexual Behavior - Average number of male oral sex partners in lifetime (18+)
Sexual Behavior - People using protection when performing oral sex (%)
Sexual Behavior - Average number of times people have vaginal or anal sex a year
Sexual Behavior - People having sex without condom (%)
Sexual Behavior - Average number of male sex partners in lifetime (females 18+)
Sexual Behavior - Average number of male vaginal sex partners in lifetime (females 18+)
Sexual Behavior - Average number of female sex partners in lifetime (females 18+)
Sexual Behavior - Circumcised males 18+ (%)
Sleep Disorders - Average hours sleeping at night
Sleep Disorders - People that has trouble sleeping (%)
Smoking-Cigarette Use - People smoking cigarettes (%)
Taste & Smell - People 40+ having problems with smell (%)
Taste & Smell - People 40+ having problems with taste (%)
Taste & Smell - People 40+ that ever had wisdom teeth removed (%)
Taste & Smell - People 40+ that ever had tonsils teeth removed (%)
Taste & Smell - People 40+ that ever had a loss of consciousness because of a head injury (%)
Taste & Smell - People 40+ that ever had a broken nose or other serious injury to face or skull (%)
Taste & Smell - People 40+ that ever had two or more sinus infections (%)
Weight - Average height (inches)
Weight - Average weight (pounds)
Weight - Average BMI
Weight - People that are obese (%)
Weight - People that ever were obese (%)
Weight - People trying to lose weight (%)
100%
urban population.
Estimated median house/condo value in 2022: $251,794
76018:
$251,794Texas:
$275,400
According to our research of Texas and other state lists, there were 40 registered sex offenders living in 76018 zip code as of June 10, 2024 . The ratio of all residents to sex offenders in zip code 76018 is 754 to 1.The ratio of registered sex offenders to all residents in this zip code is lower than the state average.
Median resident age: This zip code:
31.4 yearsTexas median age:
35.6 years
Average household size: This zip code:
3.3 peopleTexas:
2.6 people
Averages for the 2020 tax year for zip code 76018, filed in 2021:
Average Adjusted Gross Income (AGI) in 2020: $47,080 (Individual Income Tax Returns) Here:
$47,080State:
$77,054
Salary/wage: $44,873 (reported on 86.4% of returns )Here:
$44,873State:
$62,766
(% of AGI for various income ranges: 1256.0% for AGIs below $25k , 3778.4% for AGIs $25k-50k , 6836.6% for AGIs $50k-75k , 10343.4% for AGIs $75k-100k , 16790.5% for AGIs $100k-200k , 62446.7% for AGIs over 200k ) Taxable interest for individuals: $486 (reported on 13.0% of returns )This zip code:
$486Texas:
$2,665
(% of AGI for various income ranges: 2.8% for AGIs below $25k , 5.8% for AGIs $25k-50k , 10.7% for AGIs $50k-75k , 10.2% for AGIs $75k-100k , 27.9% for AGIs $100k-200k , 250.0% for AGIs over 200k ) Ordinary dividends: $1,675 (reported on 6.6% of returns )(% of AGI for various income ranges: 3.2% for AGIs below $25k , 5.4% for AGIs $25k-50k , 13.0% for AGIs $50k-75k , 32.3% for AGIs $75k-100k , 61.9% for AGIs $100k-200k , 833.3% for AGIs over 200k ) Net capital gain/loss in AGI: +$4,844 (reported on 7.3% of returns )Here:
+$4,844State:
+$39,590
(% of AGI for various income ranges: 5.5% for AGIs below $25k , 9.1% for AGIs $25k-50k , 24.1% for AGIs $50k-75k , 46.5% for AGIs $75k-100k , 280.1% for AGIs $100k-200k , 4743.3% for AGIs over 200k ) Profit/loss from business: +$4,249 (reported on 26.0% of returns )Here:
+$4,249State:
+$10,888
(% of AGI for various income ranges: 109.8% for AGIs below $25k , 93.5% for AGIs $25k-50k , 184.1% for AGIs $50k-75k , 200.5% for AGIs $75k-100k , 302.3% for AGIs $100k-200k , 1690.0% for AGIs over 200k ) Taxable individual retirement arrangement distribution: $18,169 (reported on 3.5% of returns )76018:
$18,169Texas:
$24,740
(% of AGI for various income ranges: 16.6% for AGIs below $25k , 36.7% for AGIs $25k-50k , 67.0% for AGIs $50k-75k , 130.3% for AGIs $75k-100k , 596.1% for AGIs $100k-200k ) Total itemized deductions: $26,978 (reported on 5.3% of returns )Here:
$26,978State:
$40,428
(% of AGI for various income ranges: 27.3% for AGIs below $25k , 117.4% for AGIs $25k-50k , 290.4% for AGIs $50k-75k , 411.8% for AGIs $75k-100k , 641.1% for AGIs $100k-200k , 4043.3% for AGIs over 200k ) Charity contributions: $11,343 (reported on 4.4% of returns )Here:
$11,343State:
$18,201
(% of AGI for various income ranges: 4.1% for AGIs below $25k , 34.3% for AGIs $25k-50k , 99.9% for AGIs $50k-75k , 135.6% for AGIs $75k-100k , 344.8% for AGIs $100k-200k ) Taxes paid: $5,951 (reported on 5.2% of returns )(% of AGI for various income ranges: 5.4% for AGIs below $25k , 24.6% for AGIs $25k-50k , 69.1% for AGIs $50k-75k , 90.6% for AGIs $75k-100k , 138.4% for AGIs $100k-200k , 503.3% for AGIs over 200k ) Earned income credit: $2,463 (reported on 22.7% of returns )(% of AGI for various income ranges: 123.7% for AGIs below $25k , 86.3% for AGIs $25k-50k , 1.8% for AGIs $50k-75k ) Percentage of individuals using paid preparers for their 2020 taxes: 92.9%(% for various income ranges: 91.7% for AGIs below $25k , 94.1% for AGIs $25k-50k , 93.3% for AGIs $50k-75k , 91.9% for AGIs $75k-100k , 93.4% for AGIs $100k-200k , 90.9% for AGIs over 200k )
Averages for the 2012 tax year for zip code 76018, filed in 2013:
Average Adjusted Gross Income (AGI) in 2012: $43,165 (Individual Income Tax Returns) Here:
$43,165State:
$65,384
Salary/wage: $42,544 (reported on 89.4% of returns )Here:
$42,544State:
$52,524
(% of AGI for various income ranges: 82.2% for AGIs below $25k , 91.2% for AGIs $25k-50k , 90.2% for AGIs $50k-75k , 89.0% for AGIs $75k-100k , 88.0% for AGIs $100k-200k , 67.8% for AGIs over 200k ) Taxable interest for individuals: $453 (reported on 16.7% of returns )This zip code:
$453Texas:
$2,372
(% of AGI for various income ranges: 0.1% for AGIs below $25k , 0.2% for AGIs $25k-50k , 0.2% for AGIs $50k-75k , 0.1% for AGIs $75k-100k , 0.2% for AGIs $100k-200k , 0.3% for AGIs over 200k ) Ordinary dividends: $1,428 (reported on 6.4% of returns )(% of AGI for various income ranges: 0.3% for AGIs below $25k , 0.3% for AGIs $50k-75k , 0.1% for AGIs $75k-100k , 0.2% for AGIs $100k-200k , 0.6% for AGIs over 200k ) Net capital gain/loss in AGI: +$1,770 (reported on 5.0% of returns )Here:
+$1,770State:
+$35,319
(% of AGI for various income ranges: 0.1% for AGIs $75k-100k , 0.5% for AGIs $100k-200k , 1.6% for AGIs over 200k ) Profit/loss from business: +$6,038 (reported on 22.1% of returns )Here:
+$6,038State:
+$13,732
(% of AGI for various income ranges: 11.1% for AGIs below $25k , 2.3% for AGIs $25k-50k , 1.4% for AGIs $50k-75k , 1.3% for AGIs $75k-100k , 3.3% for AGIs $100k-200k ) Taxable individual retirement arrangement distribution: $11,619 (reported on 3.7% of returns )76018:
$11,619Texas:
$19,511
(% of AGI for various income ranges: 0.7% for AGIs below $25k , 0.8% for AGIs $25k-50k , 1.0% for AGIs $50k-75k , 1.0% for AGIs $75k-100k , 1.4% for AGIs $100k-200k ) Total itemized deductions: $17,120 (25% of AGI, reported on 24.7% of returns )Here:
$17,120State:
$24,724
Here:
25.1% of AGIState:
15.9% of AGI
(% of AGI for various income ranges: 6.3% for AGIs below $25k , 10.6% for AGIs $25k-50k , 11.9% for AGIs $50k-75k , 9.6% for AGIs $75k-100k , 8.9% for AGIs $100k-200k , 9.2% for AGIs over 200k ) Charity contributions: $4,644 (reported on 19.1% of returns )(% of AGI for various income ranges: 0.7% for AGIs below $25k , 1.7% for AGIs $25k-50k , 2.3% for AGIs $50k-75k , 2.4% for AGIs $75k-100k , 2.5% for AGIs $100k-200k , 2.6% for AGIs over 200k ) Taxes paid: $3,856 (reported on 24.1% of returns )(% of AGI for various income ranges: 1.1% for AGIs below $25k , 2.3% for AGIs $25k-50k , 2.6% for AGIs $50k-75k , 2.1% for AGIs $75k-100k , 2.1% for AGIs $100k-200k , 1.7% for AGIs over 200k ) Earned income credit: $2,455 (reported on 26.0% of returns )(% of AGI for various income ranges: 9.4% for AGIs below $25k , 1.6% for AGIs $25k-50k ) Percentage of individuals using paid preparers for their 2012 taxes: 50.0%(% for various income ranges: 52.1% for AGIs below $25k , 50.6% for AGIs $25k-50k , 48.3% for AGIs $50k-75k , 44.5% for AGIs $75k-100k , 46.2% for AGIs $100k-200k , 66.7% for AGIs over 200k )
Averages for the 2004 tax year for zip code 76018, filed in 2005:
Average Adjusted Gross Income (AGI) in 2004: $41,510 (Individual Income Tax Returns) Here:
$41,510State:
$47,881
Salary/wage: $41,690 (reported on 92.7% of returns )Here:
$41,690State:
$41,947
(% of AGI for various income ranges: 96.6% for AGIs below $10k , 88.9% for AGIs $10k-25k , 94.0% for AGIs $25k-50k , 93.6% for AGIs $50k-75k , 94.9% for AGIs $75k-100k , 90.9% for AGIs over 100k ) Taxable interest for individuals: $467 (reported on 27.4% of returns )This zip code:
$467Texas:
$2,255
(% of AGI for various income ranges: 0.8% for AGIs below $10k , 0.4% for AGIs $10k-25k , 0.3% for AGIs $25k-50k , 0.3% for AGIs $50k-75k , 0.2% for AGIs $75k-100k , 0.4% for AGIs over 100k ) Taxable dividends: $636 (reported on 10.5% of returns )(% of AGI for various income ranges: 0.9% for AGIs below $10k , 0.1% for AGIs $10k-25k , 0.1% for AGIs $25k-50k , 0.1% for AGIs $50k-75k , 0.1% for AGIs $75k-100k , 0.3% for AGIs over 100k ) Net capital gain/loss: +$1,039 (reported on 8.7% of returns )Here:
+$1,039State:
+$16,110
(% of AGI for various income ranges: -0.2% for AGIs below $10k , -0.1% for AGIs $10k-25k , 0.1% for AGIs $25k-50k , 0.2% for AGIs $50k-75k , 0.3% for AGIs $75k-100k , 0.5% for AGIs over 100k ) Profit/loss from business: +$4,267 (reported on 18.5% of returns )Here:
+$4,267State:
+$11,013
(% of AGI for various income ranges: 9.3% for AGIs below $10k , 6.0% for AGIs $10k-25k , 1.9% for AGIs $25k-50k , 1.2% for AGIs $50k-75k , 0.8% for AGIs $75k-100k , 1.3% for AGIs over 100k ) IRA payment deduction: $2,617 (reported on 1.7% of returns )(% of AGI for various income ranges: 0.1% for AGIs $10k-25k , 0.1% for AGIs $25k-50k , 0.1% for AGIs $50k-75k , 0.1% for AGIs $75k-100k , 0.1% for AGIs over 100k ) Total itemized deductions: $14,928 (24% of AGI, reported on 40.3% of returns )Here:
$14,928State:
$19,631
Here:
24.1% of AGIState:
18.9% of AGI
(% of AGI for various income ranges: 10.1% for AGIs below $10k , 11.3% for AGIs $10k-25k , 16.4% for AGIs $25k-50k , 15.8% for AGIs $50k-75k , 14.0% for AGIs $75k-100k , 12.5% for AGIs over 100k ) Charity contributions deductions: $3,120 (5% of AGI, reported on 33.1% of returns )Here:
4.8% of AGIState:
4.2% of AGI
(% of AGI for various income ranges: 0.5% for AGIs below $10k , 1.1% for AGIs $10k-25k , 2.4% for AGIs $25k-50k , 2.7% for AGIs $50k-75k , 2.6% for AGIs $75k-100k , 3.2% for AGIs over 100k ) Total tax: $4,866 (reported on 73.9% of returns )(% of AGI for various income ranges: 3.5% for AGIs below $10k , 3.8% for AGIs $10k-25k , 5.7% for AGIs $25k-50k , 8.2% for AGIs $50k-75k , 9.9% for AGIs $75k-100k , 15.2% for AGIs over 100k ) Earned income credit: $1,934 (reported on 18.9% of returns )Percentage of individuals using paid preparers for their 2004 taxes: 50.4%(% for various income ranges: 42.5% for AGIs below $10k , 57.0% for AGIs $10k-25k , 53.1% for AGIs $25k-50k , 50.4% for AGIs $50k-75k , 45.5% for AGIs $75k-100k , 42.0% for AGIs over 100k )
Estimated median household income in 2022: This zip code:
$82,953Texas:
$72,284
Nearest zip codes: 76014 ,
76002 ,
76015 ,
76001 ,
76010 ,
76017 .
Grand Prairie Zip Code Map
Percentage of family households: This zip code:
65.1%Texas:
50.5%
Percentage of households with unmarried partners: This zip code:
8.1%Texas:
48.7%
Likely homosexual households (counted as self-reported same-sex unmarried-partner households)
Lesbian couples: 0.0% of all households Gay men: 0.0% of all households
Household received Food Stamps/SNAP in the past 12 months: 931Household did not receive Food Stamps/SNAP in the past 12 months: 7,801
Women who had a birth in the past 12 months: 636 (201 now married , 421 unmarried) Women who did not have a birth in the past 12 months: 7,635 (3,462 now married , 4,169 unmarried)
Housing units in zip code 76018 with a mortgage: 4,328 (124
second mortgage , 19
home equity loan , 102
both second mortgage and home equity loan )
Houses without a mortgage: 53
Median monthly owner costs for units with a mortgage: $1,677
Median monthly owner costs for units without a mortgage: $729
Residents with income below the poverty level in 2022:
This zip code:
7.6%Whole state:
14.0%
Residents with income below 50% of the poverty level in 2022:
This zip code:
3.5%Whole state:
7.4%
Median number of rooms in houses and condos: Median number of rooms in apartments:
Year house built (houses)
0 2020 or later69 2010 to 20191,229 2000 to 20092,422 1990 to 19993,849 1980 to 1989615 1970 to 1979100 1960 to 196927 1950 to 19590 1940 to 194924 1939 or earlier
Zip code 76018 household income distribution in 2022 157 Less than $10,000202 $10,000 to $14,999119 $15,000 to $19,999107 $20,000 to $24,999290 $25,000 to $29,99990 $30,000 to $34,999194 $35,000 to $39,999567 $40,000 to $44,999227 $45,000 to $49,999731 $50,000 to $59,999854 $60,000 to $74,9991,866 $75,000 to $99,9991,113 $100,000 to $124,999761 $125,000 to $149,9991,012 $150,000 to $199,999413 $200,000 or moreEstimate of home value of owner-occupied houses/condos in 2022 in zip code 76018 226 Less than $10,00011 $10,000 to $14,999126 $15,000 to $19,9999 $20,000 to $24,9999 $25,000 to $29,99927 $35,000 to $39,99954 $50,000 to $59,99930 $80,000 to $89,9999 $90,000 to $99,999155 $100,000 to $124,999344 $125,000 to $149,999383 $150,000 to $174,999710 $175,000 to $199,9992,146 $200,000 to $249,999996 $250,000 to $299,999909 $300,000 to $399,99932 $400,000 to $499,999Rent paid by renters in 2022 in zip code 76018 86 $650 to $69937 $800 to $89970 $900 to $999285 $1,000 to $1,249408 $1,250 to $1,4991,045 $1,500 to $1,999114 $2,000 to $2,49967 No cash rent
Median gross rent in 2022: $1,798.
Median price asked for vacant for-sale houses and condos in 2022: $223,769.
Estimated median house (or condo) value in 2022 for: White Non-Hispanic householders: $249,604Black or African American householders: $250,973American Indian or Alaska Native householders: $228,804Asian householders: $260,004Some other race householders: $252,067Two or more races householders: $208,825Hispanic or Latino householders: $244,952Estimated median house or condo value in 2022: $251,794
76018:
$251,794Texas:
$275,400
Lower value quartile - upper value quartile: $206,470 - $290,134
Mean price in 2022: Detached houses: $336,628Here:
$336,628State:
$369,058
Townhouses or other attached units: $232,533Here:
$232,533State:
$327,631
In 2-unit structures: $298,131Here:
$298,131State:
$374,947
In 3-to-4-unit structures: $40,889Here:
$40,889State:
$209,652
In 5-or-more-unit structures: $212,212Here:
$212,212State:
$413,944
Mobile homes: $104,550Here:
$104,550State:
$124,413
Occupied boats, RVs, vans, etc.: $59,769Here:
$59,769State:
$73,921
Housing units in structures:
One, detached: 8,059One, attached: 70Two: 513 or 4: 1085 to 9: 5510 to 19: 23320 to 49: 4650 or more: 142Mobile homes: 151Boats, RVs, vans, etc.: 32Unemployment : 4.2%
Means of transportation to work in zip code 76018 74.2% 11,762 Drove a car alone9.3% 1,470 Carpooled0.0% 7 Bicycle2.8% 443 Other means13.6% 2,160 Worked at homeTravel time to work (commute) in zip code 76018 253 Less than 5 minutes1,076 5 to 9 minutes1,428 10 to 14 minutes1,339 15 to 19 minutes2,429 20 to 24 minutes975 25 to 29 minutes2,495 30 to 34 minutes594 35 to 39 minutes900 40 to 44 minutes1,169 45 to 59 minutes728 60 to 89 minutes269 90 or more minutes
Neighborhoods in zip code 76018: Percentage of zip code residents living and working in this county: 75.8%
Household type by relationship:
Households: 28,575
Male householders: 3,876 (488 living alone ), Female householders: 4,871 (983 living alone )4,718 spouses (4,509 opposite-sex spouses ), 664 unmarried partners , (664 opposite-sex unmarried partners ), 10,314 children (10,035 natural , 69 adopted , 206 stepchildren ), 1,067 grandchildren , 373 brothers or sisters , 830 parents , 112 foster children , 1,036 other relatives , 542 non-relatives In group quarters: 40 (-1 institutionalized population )
Size of family households: 2,037 2-persons , 1,680 3-persons , 1,399 4-persons , 1,084 5-persons , 409 6-persons , 251 7-or-more-persons
Size of nonfamily households: 1,470 1-person , 179 2-persons , 114 3-persons , 35 4-persons
4,319 married couples with children. single-parent households (289 men , 2,091 women ).
57.3% of residents of 76018 zip code speak English at home. of residents speak Spanish at home (69% very well, 18% well, 9% not well, 4% not at all ).of residents speak other Indo-European language at home (76% very well, 18% well, 3% not well, 4% not at all ).of residents speak Asian or Pacific Island language at home (42% very well, 27% well, 16% not well, 16% not at all ).of residents speak other language at home (76% very well, 18% well, 6% not well ).
Foreign born population: 6,684 (23.4%)
(65.5%
of them are naturalized citizens )
This zip code:
23.4%Whole state:
17.2%
38% Thailand 25% Honduras 7% Guatemala 6% Costa Rica 3% Zimbabwe 2% Malaysia 2% Georgia 6% English 4% American 2% Irish 1% German 1% Arab 1% African 1% Scottish
Year of entry for the foreign-born population
1,916 2010 or later 1,271 2000 to 2009 2,075 1990 to 1999 1,377 Before 1990
There are
78 Medical Specialists in Zip Code 76018 .
Facilities with environmental interests located in this zip code:
BARNETT J H (2101 HARWOOD RD in ARLINGTON, TX)
(National Center for Education Statistics) - STATE ID-220901052 Organizations: ARLINGTON ISD (SCHOOL DISTRICT)
ACE SYSTEMS (5250 S COLLINS STE 138 in ARLINGTON, TX)
Small Quantity Generators, between 100 kg and 1000 kg of hazardous waste/month (Resource Conservation and Recovery Act (tracking hazardous waste)) - notification TRANSPORTER (Resource Conservation and Recovery Act (tracking hazardous waste)) - notification Organizations: STAN M DONALDSON (CONTACT/OWNER)
Housing units lacking complete plumbing facilities: 0.2%
Housing units lacking complete kitchen facilities: 2.2%
84.0% Electricity 12.5% Utility gas 1.8% No fuel used 0.9% Solar energy 0.8% Bottled, tank, or LP gas
Population in 1990: 15,590. Population change in the 1990s: +8,328 (+53.4%).
Place of birth for U.S.-born residents:
This state: 14,633Northeast: 811Midwest: 2,064South: 2,346West: 2,069
49% of the 76018 zip code residents lived in the same house 5 years ago.
Out of people who lived in different houses, 61% lived in this county.
Out of people who lived in different counties, 50% lived in Texas.
92% of the 76018 zip code residents lived in the same house 1 year ago.
Out of people who lived in different houses, 35% moved from this county.
Out of people who lived in different houses, 36% moved from different county within same state.
Out of people who lived in different houses, 30% moved from different state.
Out of people who lived in different houses, 2% moved from abroad.
Private vs. public school enrollment:
Students in private schools in grades 1 to 8 (elementary and middle school): 121
Students in private schools in grades 9 to 12 (high school): 21
Students in private undergraduate colleges: 147
Occupation by median earnings in the past 12 months ($)
82,325 Computer and mathematical occupations 76,094 Fire fighting and prevention, and other protective service workers including supervisors 74,118 Legal occupations 70,452 Architecture and engineering occupations 67,438 Health diagnosing and treating practitioners and other technical occupations 64,961 Law enforcement workers including supervisors
Companies with federal contracts located in this zip code (ARLINGTON, TX):
ANIXTER PENTACON INC ARLINGT (301 EAST STEPHENS ST SUI) in 62 contracts from 2000 to 2006
Contracts for Bolts, Fastening Device, Screws, Nuts and Washers, and more by Air Force, Defense Logistics Agency, Army, Navy, and others Signed by year: 2000: $602,430; 2001: $215,024; 2002: $204,420; 2003: $34,605; 2004: $101,824; 2005: $102,867; 2006: $379,788.
Biggest contracts: with Air Force for Bolts. Signed on 2004-04-22. Completion date: 2004-10-29.
with Defense Logistics Agency for Fastening Device. Signed on 2006-05-22. Completion date: 2006-12-08.
with Defense Logistics Agency for Screws. Signed on 2000-06-15. Completion date: 2000-11-02.
, same as above. Signed on 2000-04-26. Completion date: 2000-10-13.
GLOBAL HELICOPTER TECHNOLOGY I (4846 S COLLINS ST; small business) in 16 contracts from 2001 to 2006
Contracts for Airframe Structural Components, Aircraft Ground Servicing Equipment, Sets, Kits, and Outfits of Hand Tools, Helicopter Rotor Blades, Drive Mechanisms and Components, and more by ArmySigned by year: 2000: $0; 2001: $260,015; 2002: $407,088; 2003: $260,212; 2004: $79,186; 2005: $48,856; 2006: $563.
Biggest contracts: with Army for Airframe Structural Components. Signed on 2001-11-01. Completion date: 2001-11-01.
, same as above. Signed on 2002-02-12. Completion date: 2002-02-28.
, same as above. Signed on 2003-04-02. Completion date: 2003-04-10.
with Army for Aircraft Ground Servicing Equipment. Signed on 2003-07-28. Completion date: 2004-08-06.
BE ACTIVE HEALTH & FITNESS, IN (2411 BENNINGTON DRIVE; small business) in 9 contracts from 2000 to 2002
Contracts for Other Professional Services by U.S. Army Corps of Engineers - civil program financing only, ArmySigned by year: 2000: $49,500; 2001: $66,000; 2002: $24,751; 2003: $0; 2004: $0; 2005: $0; 2006: $0.
Biggest contracts: with U.S. Army Corps of Engineers - civil program financing only for Other Professional Services. Taking place in AL. Signed on 2001-01-01. Completion date: 2001-12-31.
with Army for Other Professional Services. Taking place in AL. Signed on 2000-01-26. Completion date: 2000-01-01.
with U.S. Army Corps of Engineers - civil program financing only for Other Professional Services. Taking place in AL. Signed on 2001-12-31. Completion date: 2001-12-31.
, same as above. Signed on 2002-05-10. Completion date: 2001-12-31.
INNOSERV TECHNOLOGIES INC (320 WESTWAY PL STE 520) in 2 contracts from 1999 to 2000
$54,000 with Air Force for Maintenance, Repair and Rebuilding of Equipment -- Medical, Dental, and Veterinary Equipment and Supplies. Taking place in OH. Signed on 1999-10-19. Completion date: 1998-09-30.
, same as above. Signed on 2000-04-26. Completion date: 2000-04-03.
WIER & ASSOCIATES, INC (4300 BELTWAY PL STE 130; small business)
$3,500 with Navy for Land Surveys, Cadastral Services (non-construction). Signed on 2002-11-15. Completion date: 2002-12-30.
Top industries in this zip code by the number of employees in 2005:
Finance and Insurance: Commercial Banking (500-999 employees: 1 establishment, 10-19 employees: 1 establishment, 5-9 employees: 2 establishments)Finance and Insurance: Direct Health and Medical Insurance Carriers (500-999: 1)Accommodation and Food Services: Limited-Service Restaurants (20-49: 8, 5-9: 1, 1-4: 2)Administrative and Support and Waste Management and Remediation Services: Temporary Help Services (50-99: 2)Accommodation and Food Services: Full-Service Restaurants (50-99: 1, 20-49: 1, 5-9: 1, 1-4: 3)
People in group quarters in 2010:
16 people in emergency and transitional shelters (with sleeping facilities) for people experiencing homelessness
10 people in residential treatment centers for adults
6 people in group homes intended for adults
People in group quarters in 2000:
32 people in college dormitories (includes college quarters off campus)
18 people in homes for the mentally retarded
Fatal accident statistics in 2014:
Fatal accident count: 1Vehicles involved in fatal accidents: 3Fatal accidents caused by drunken drivers: 1Fatalities: 1Persons involved in fatal accidents: 5Pedestrians involved in fatal accidents: 0
Fatal accident statistics in 2013:
Fatal accident count: 2Vehicles involved in fatal accidents: 3Fatal accidents caused by drunken drivers: 1Fatalities: 2Persons involved in fatal accidents: 2Pedestrians involved in fatal accidents: 0
Home Mortgage Disclosure Act Aggregated Statistics For Year 2009(Based on 7 full and 2 partial tracts) A) FHA, FSA/RHS & VA B) Conventional C) Refinancings D) Home Improvement Loans F) Non-occupant Loans on Number Average Value Number Average Value Number Average Value Number Average Value Number Average Value
LOANS ORIGINATED 322 $122,723 125 $116,384 442 $116,817 17 $44,045 42 $87,281 APPLICATIONS APPROVED, NOT ACCEPTED 23 $116,326 7 $149,223 69 $112,819 11 $34,198 6 $78,023 APPLICATIONS DENIED 67 $127,707 27 $99,587 234 $115,708 69 $22,096 15 $85,012 APPLICATIONS WITHDRAWN 38 $130,482 27 $139,793 127 $112,354 10 $69,591 20 $80,396 FILES CLOSED FOR INCOMPLETENESS 6 $120,835 4 $121,435 52 $109,782 8 $53,749 6 $87,317
Aggregated Statistics For Year 2008(Based on 7 full and 2 partial tracts) A) FHA, FSA/RHS & VA B) Conventional C) Refinancings D) Home Improvement Loans F) Non-occupant Loans on G) Loans On Manufactured Number Average Value Number Average Value Number Average Value Number Average Value Number Average Value Number Average Value
LOANS ORIGINATED 349 $125,817 318 $118,001 302 $105,000 82 $21,840 98 $86,591 2 $26,975 APPLICATIONS APPROVED, NOT ACCEPTED 18 $126,613 30 $118,960 70 $91,287 9 $21,774 9 $81,821 0 $0 APPLICATIONS DENIED 82 $128,532 113 $123,834 386 $109,182 181 $27,817 35 $106,685 2 $25,130 APPLICATIONS WITHDRAWN 44 $121,692 65 $124,948 145 $117,207 10 $48,659 16 $101,204 0 $0 FILES CLOSED FOR INCOMPLETENESS 18 $120,978 15 $110,819 40 $110,179 11 $62,267 7 $88,583 0 $0
Aggregated Statistics For Year 2007(Based on 7 full and 2 partial tracts) A) FHA, FSA/RHS & VA B) Conventional C) Refinancings D) Home Improvement Loans F) Non-occupant Loans on G) Loans On Manufactured Number Average Value Number Average Value Number Average Value Number Average Value Number Average Value Number Average Value
LOANS ORIGINATED 224 $124,906 754 $111,649 349 $105,303 81 $31,195 133 $90,520 0 $0 APPLICATIONS APPROVED, NOT ACCEPTED 14 $130,168 112 $100,586 104 $104,577 30 $29,894 24 $83,029 1 $220,000 APPLICATIONS DENIED 32 $127,906 229 $115,430 594 $108,957 172 $26,015 55 $89,301 6 $37,093 APPLICATIONS WITHDRAWN 28 $141,020 132 $122,752 214 $108,876 15 $43,625 12 $103,895 0 $0 FILES CLOSED FOR INCOMPLETENESS 3 $158,190 34 $113,550 67 $113,929 5 $48,710 5 $72,426 0 $0
Aggregated Statistics For Year 2006(Based on 7 full and 2 partial tracts) A) FHA, FSA/RHS & VA B) Conventional C) Refinancings D) Home Improvement Loans F) Non-occupant Loans on G) Loans On Manufactured Number Average Value Number Average Value Number Average Value Number Average Value Number Average Value Number Average Value
LOANS ORIGINATED 205 $123,384 1,249 $89,006 398 $94,289 84 $27,150 195 $81,088 0 $0 APPLICATIONS APPROVED, NOT ACCEPTED 12 $128,495 189 $83,169 114 $98,742 33 $28,565 50 $78,777 2 $49,915 APPLICATIONS DENIED 28 $117,954 365 $86,543 498 $105,024 164 $25,289 65 $88,900 7 $33,887 APPLICATIONS WITHDRAWN 30 $131,993 176 $104,461 334 $111,030 15 $45,314 29 $109,798 0 $0 FILES CLOSED FOR INCOMPLETENESS 5 $88,528 45 $95,508 184 $115,128 8 $59,788 10 $100,910 0 $0
Aggregated Statistics For Year 2005(Based on 7 full and 2 partial tracts) A) FHA, FSA/RHS & VA B) Conventional C) Refinancings D) Home Improvement Loans F) Non-occupant Loans on G) Loans On Manufactured Number Average Value Number Average Value Number Average Value Number Average Value Number Average Value Number Average Value
LOANS ORIGINATED 208 $115,778 1,259 $81,072 625 $94,473 96 $46,251 222 $73,778 2 $53,720 APPLICATIONS APPROVED, NOT ACCEPTED 14 $117,597 223 $78,977 108 $91,660 28 $25,888 48 $73,837 5 $70,266 APPLICATIONS DENIED 40 $108,090 381 $80,032 786 $100,912 132 $34,196 100 $89,636 10 $34,201 APPLICATIONS WITHDRAWN 24 $109,810 196 $93,521 456 $116,309 67 $171,998 51 $80,292 0 $0 FILES CLOSED FOR INCOMPLETENESS 2 $116,370 63 $84,644 293 $106,407 5 $39,182 16 $112,724 0 $0
Aggregated Statistics For Year 2004(Based on 7 full and 2 partial tracts) A) FHA, FSA/RHS & VA B) Conventional C) Refinancings D) Home Improvement Loans F) Non-occupant Loans on G) Loans On Manufactured Number Average Value Number Average Value Number Average Value Number Average Value Number Average Value Number Average Value
LOANS ORIGINATED 312 $112,360 1,013 $84,666 1,051 $90,862 89 $39,162 221 $79,425 0 $0 APPLICATIONS APPROVED, NOT ACCEPTED 14 $104,011 139 $83,923 196 $90,948 22 $34,221 25 $85,057 0 $0 APPLICATIONS DENIED 67 $107,362 263 $82,064 945 $94,517 159 $31,472 77 $76,833 5 $74,988 APPLICATIONS WITHDRAWN 33 $115,014 159 $87,287 452 $101,887 23 $54,545 27 $84,011 3 $148,830 FILES CLOSED FOR INCOMPLETENESS 6 $144,797 66 $83,351 326 $100,849 10 $41,609 20 $87,454 0 $0
Aggregated Statistics For Year 2003(Based on 7 full and 2 partial tracts) A) FHA, FSA/RHS & VA B) Conventional C) Refinancings D) Home Improvement Loans F) Non-occupant Loans on Number Average Value Number Average Value Number Average Value Number Average Value Number Average Value
LOANS ORIGINATED 415 $113,663 677 $88,743 2,385 $89,051 72 $22,891 165 $75,509 APPLICATIONS APPROVED, NOT ACCEPTED 9 $111,873 97 $93,750 312 $85,374 43 $59,719 17 $91,210 APPLICATIONS DENIED 61 $126,962 165 $90,092 1,133 $85,315 123 $21,306 40 $74,095 APPLICATIONS WITHDRAWN 62 $118,347 102 $96,383 555 $92,344 5 $18,286 21 $83,347 FILES CLOSED FOR INCOMPLETENESS 4 $132,182 51 $106,743 135 $88,176 1 $11,390 9 $88,622
Aggregated Statistics For Year 2002(Based on 3 full and 2 partial tracts) A) FHA, FSA/RHS & VA B) Conventional C) Refinancings D) Home Improvement Loans E) Loans on Dwellings For 5+ Families F) Non-occupant Loans on Number Average Value Number Average Value Number Average Value Number Average Value Number Average Value Number Average Value
LOANS ORIGINATED 317 $116,814 342 $91,600 625 $90,240 33 $18,065 1 $65,000 48 $71,879 APPLICATIONS APPROVED, NOT ACCEPTED 8 $107,482 35 $90,709 94 $82,329 6 $19,240 0 $0 4 $63,232 APPLICATIONS DENIED 33 $125,609 75 $96,625 288 $86,265 79 $16,563 0 $0 12 $89,052 APPLICATIONS WITHDRAWN 43 $124,510 50 $108,200 181 $90,711 6 $12,502 0 $0 7 $106,007 FILES CLOSED FOR INCOMPLETENESS 7 $135,680 40 $96,923 75 $87,875 5 $22,470 0 $0 1 $93,190
Aggregated Statistics For Year 2001(Based on 3 full and 2 partial tracts) A) FHA, FSA/RHS & VA B) Conventional C) Refinancings D) Home Improvement Loans E) Loans on Dwellings For 5+ Families F) Non-occupant Loans on Number Average Value Number Average Value Number Average Value Number Average Value Number Average Value Number Average Value
LOANS ORIGINATED 335 $108,394 229 $85,130 359 $92,532 58 $18,605 2 $17,802,750 32 $65,310 APPLICATIONS APPROVED, NOT ACCEPTED 7 $109,971 32 $79,666 29 $78,834 23 $21,202 0 $0 2 $60,660 APPLICATIONS DENIED 31 $114,117 82 $79,876 189 $79,458 93 $16,315 0 $0 6 $47,512 APPLICATIONS WITHDRAWN 43 $123,224 25 $100,274 128 $84,243 9 $28,882 0 $0 9 $82,128 FILES CLOSED FOR INCOMPLETENESS 7 $98,650 28 $82,035 24 $96,775 5 $29,618 0 $0 2 $48,000
Aggregated Statistics For Year 2000(Based on 3 full and 2 partial tracts) A) FHA, FSA/RHS & VA B) Conventional C) Refinancings D) Home Improvement Loans F) Non-occupant Loans on Number Average Value Number Average Value Number Average Value Number Average Value Number Average Value
LOANS ORIGINATED 301 $99,381 228 $84,719 72 $76,576 46 $23,030 13 $64,860 APPLICATIONS APPROVED, NOT ACCEPTED 10 $82,839 47 $93,145 32 $72,436 35 $17,359 1 $50,000 APPLICATIONS DENIED 25 $85,874 64 $91,586 68 $64,347 55 $15,063 10 $72,531 APPLICATIONS WITHDRAWN 29 $119,066 25 $85,811 43 $74,326 10 $28,338 1 $67,000 FILES CLOSED FOR INCOMPLETENESS 6 $108,785 27 $87,130 28 $86,182 0 $0 2 $74,835
Aggregated Statistics For Year 1999(Based on 2 full and 2 partial tracts) A) FHA, FSA/RHS & VA B) Conventional C) Refinancings D) Home Improvement Loans E) Loans on Dwellings For 5+ Families F) Non-occupant Loans on Number Average Value Number Average Value Number Average Value Number Average Value Number Average Value Number Average Value
LOANS ORIGINATED 446 $96,491 414 $86,493 278 $74,435 79 $16,076 2 $1,416,730 38 $59,134 APPLICATIONS APPROVED, NOT ACCEPTED 14 $98,016 62 $76,205 67 $76,238 51 $49,728 0 $0 4 $74,435 APPLICATIONS DENIED 42 $95,596 110 $95,462 138 $66,527 138 $14,646 1 $23,520 15 $48,590 APPLICATIONS WITHDRAWN 41 $109,185 77 $104,592 103 $77,369 8 $21,760 0 $0 4 $53,880 FILES CLOSED FOR INCOMPLETENESS 7 $90,770 20 $98,150 74 $78,529 1 $16,400 0 $0 4 $67,960
Private Mortgage Insurance Companies Aggregated Statistics For Year 2009(Based on 7 full and 2 partial tracts) A) Conventional B) Refinancings Number Average Value Number Average Value
LOANS ORIGINATED 29 $157,970 28 $133,948 APPLICATIONS APPROVED, NOT ACCEPTED 14 $166,039 5 $192,512 APPLICATIONS DENIED 3 $122,263 10 $118,358 APPLICATIONS WITHDRAWN 1 $241,360 3 $145,270 FILES CLOSED FOR INCOMPLETENESS 0 $0 1 $92,000
Aggregated Statistics For Year 2008(Based on 7 full and 2 partial tracts) A) Conventional B) Refinancings C) Non-occupant Loans on Number Average Value Number Average Value Number Average Value
LOANS ORIGINATED 164 $137,941 39 $126,189 23 $108,467 APPLICATIONS APPROVED, NOT ACCEPTED 73 $143,417 25 $127,943 8 $128,054 APPLICATIONS DENIED 26 $128,558 7 $98,467 11 $111,015 APPLICATIONS WITHDRAWN 12 $130,578 0 $0 5 $81,674 FILES CLOSED FOR INCOMPLETENESS 4 $135,862 0 $0 1 $78,940
Aggregated Statistics For Year 2007(Based on 7 full and 2 partial tracts) A) Conventional B) Refinancings C) Non-occupant Loans on Number Average Value Number Average Value Number Average Value
LOANS ORIGINATED 294 $126,163 57 $123,140 35 $94,427 APPLICATIONS APPROVED, NOT ACCEPTED 51 $128,516 14 $134,897 7 $120,533 APPLICATIONS DENIED 3 $110,840 1 $74,000 2 $56,985 APPLICATIONS WITHDRAWN 14 $131,550 1 $134,340 1 $68,820 FILES CLOSED FOR INCOMPLETENESS 2 $114,945 0 $0 0 $0
Aggregated Statistics For Year 2006(Based on 7 full and 2 partial tracts) A) Conventional B) Refinancings C) Non-occupant Loans on Number Average Value Number Average Value Number Average Value
LOANS ORIGINATED 147 $111,981 27 $112,428 15 $94,453 APPLICATIONS APPROVED, NOT ACCEPTED 12 $130,193 8 $114,302 4 $107,905 APPLICATIONS DENIED 1 $122,450 0 $0 0 $0 APPLICATIONS WITHDRAWN 4 $121,518 4 $154,550 1 $99,680 FILES CLOSED FOR INCOMPLETENESS 1 $85,260 0 $0 0 $0
Aggregated Statistics For Year 2005(Based on 7 full and 2 partial tracts) A) Conventional B) Refinancings C) Non-occupant Loans on Number Average Value Number Average Value Number Average Value
LOANS ORIGINATED 107 $120,415 46 $111,009 25 $99,276 APPLICATIONS APPROVED, NOT ACCEPTED 10 $140,179 18 $105,069 4 $85,542 APPLICATIONS DENIED 6 $146,607 0 $0 6 $132,607 APPLICATIONS WITHDRAWN 8 $115,024 3 $131,527 1 $126,140 FILES CLOSED FOR INCOMPLETENESS 3 $143,697 0 $0 0 $0
Aggregated Statistics For Year 2004(Based on 7 full and 2 partial tracts) A) Conventional B) Refinancings C) Non-occupant Loans on Number Average Value Number Average Value Number Average Value
LOANS ORIGINATED 194 $108,385 63 $99,276 53 $92,106 APPLICATIONS APPROVED, NOT ACCEPTED 26 $109,218 18 $127,920 5 $81,498 APPLICATIONS DENIED 7 $128,874 4 $97,392 3 $77,333 APPLICATIONS WITHDRAWN 11 $122,787 9 $132,098 2 $105,950 FILES CLOSED FOR INCOMPLETENESS 9 $114,789 3 $96,937 0 $0
Aggregated Statistics For Year 2003(Based on 7 full and 2 partial tracts) A) Conventional B) Refinancings C) Non-occupant Loans on Number Average Value Number Average Value Number Average Value
LOANS ORIGINATED 199 $110,795 182 $115,712 36 $85,218 APPLICATIONS APPROVED, NOT ACCEPTED 26 $112,381 62 $112,003 4 $87,808 APPLICATIONS DENIED 4 $145,795 5 $103,522 2 $135,235 APPLICATIONS WITHDRAWN 3 $113,833 17 $134,703 0 $0 FILES CLOSED FOR INCOMPLETENESS 0 $0 2 $122,085 2 $105,765
Aggregated Statistics For Year 2002(Based on 3 full and 2 partial tracts) A) Conventional B) Refinancings C) Non-occupant Loans on Number Average Value Number Average Value Number Average Value
LOANS ORIGINATED 103 $114,851 54 $109,311 13 $107,780 APPLICATIONS APPROVED, NOT ACCEPTED 18 $127,023 13 $113,091 1 $57,680 APPLICATIONS DENIED 3 $135,763 3 $96,843 1 $64,260 APPLICATIONS WITHDRAWN 4 $119,268 4 $114,742 1 $82,730 FILES CLOSED FOR INCOMPLETENESS 0 $0 0 $0 0 $0
Aggregated Statistics For Year 2001(Based on 3 full and 2 partial tracts) A) Conventional B) Refinancings C) Non-occupant Loans on Number Average Value Number Average Value Number Average Value
LOANS ORIGINATED 80 $107,331 34 $106,477 4 $100,490 APPLICATIONS APPROVED, NOT ACCEPTED 9 $105,606 10 $106,257 4 $71,085 APPLICATIONS DENIED 1 $159,640 0 $0 0 $0 APPLICATIONS WITHDRAWN 2 $78,625 2 $120,795 0 $0 FILES CLOSED FOR INCOMPLETENESS 1 $169,280 0 $0 0 $0
Aggregated Statistics For Year 2000(Based on 3 full and 2 partial tracts) A) Conventional B) Refinancings C) Non-occupant Loans on Number Average Value Number Average Value Number Average Value
LOANS ORIGINATED 72 $102,470 9 $100,768 4 $73,045 APPLICATIONS APPROVED, NOT ACCEPTED 21 $124,551 1 $119,000 0 $0 APPLICATIONS DENIED 7 $141,000 0 $0 0 $0 APPLICATIONS WITHDRAWN 8 $126,654 0 $0 0 $0 FILES CLOSED FOR INCOMPLETENESS 3 $107,830 0 $0 1 $92,000
Aggregated Statistics For Year 1999(Based on 2 full and 2 partial tracts) A) Conventional B) Refinancings C) Non-occupant Loans on Number Average Value Number Average Value Number Average Value
LOANS ORIGINATED 152 $107,654 42 $89,205 7 $78,527 APPLICATIONS APPROVED, NOT ACCEPTED 19 $119,004 9 $99,933 1 $74,080 APPLICATIONS DENIED 7 $131,497 2 $80,885 0 $0 APPLICATIONS WITHDRAWN 3 $140,990 2 $71,940 0 $0 FILES CLOSED FOR INCOMPLETENESS 3 $125,637 2 $62,720 0 $0
2003 - 2018 National Fire Incident Reporting System (NFIRS) incidents See full 2006 National Fire Incident Reporting System statistics for zip code 76018, Texas
Most common first names in zip code 76018 among deceased individuals Name Count Lived (average)
Robert 15 62.8 years Mary 13 76.2 years John 13 76.0 years David 10 58.2 years William 10 60.3 years Charles 10 68.8 years Frank 9 76.8 years James 9 61.2 years Mildred 8 80.9 years Frances 7 77.7 years
Most common last names in zip code 76018 among deceased individuals Last name Count Lived (average)
Johnson 9 63.3 years Nguyen 8 67.0 years Smith 6 78.3 years Jones 5 79.6 years Taylor 5 75.6 years Brown 4 81.0 years Campbell 4 66.0 years Bui 4 81.7 years Lewis 4 85.3 years Mitchell 4 69.7 years
Businesses in zip code 76018
Name Count Name Count
7-Eleven 2 KFC 1 AT&T 1 Kroger 1 Ann Taylor 1 Lane Bryant 1 AutoZone 1 Lane Furniture 1 Bath & Body Works 1 McDonald's 1 Bed Bath & Beyond 1 Men's Wearhouse 1 Blockbuster 1 New Balance 1 CVS 2 Nissan 1 Church's Chicken 1 Panda Express 1 Cold Stone Creamery 2 PetSmart 1 Coldwater Creek 1 Quality 1 Curves 1 RadioShack 1 Ethan Allen 1 Red Robin 1 Famous Footwear 1 SONIC Drive-In 2 FedEx 3 Staples 1 GNC 1 T-Mobile 2 H&R Block 1 Taco Bell 1 Hilton 1 UPS 2 Houlihan's 1 Volkswagen 1 Jack In The Box 3 Walgreens 2 JoS. A. Bank 1 Wendy's 1 Justice 1
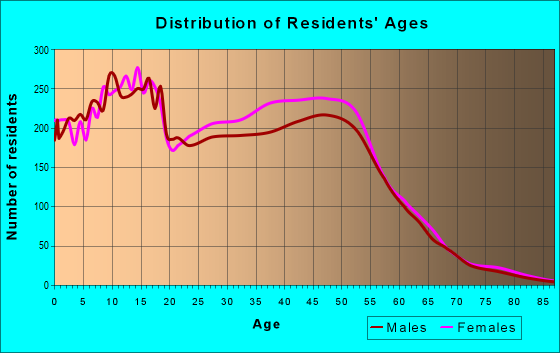
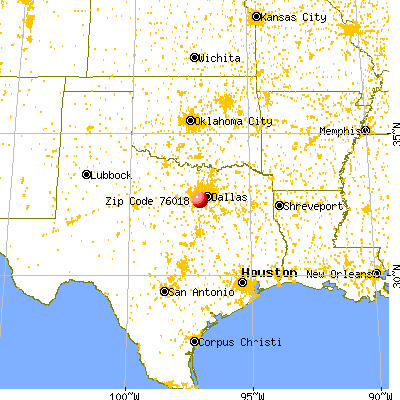


 Nearest zip codes: 76014, 76002, 76015, 76001, 76010, 76017.
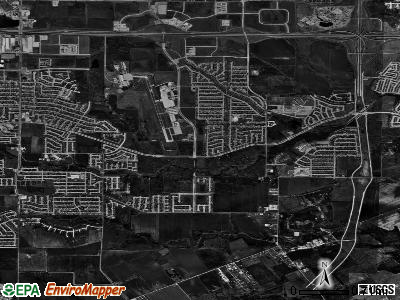


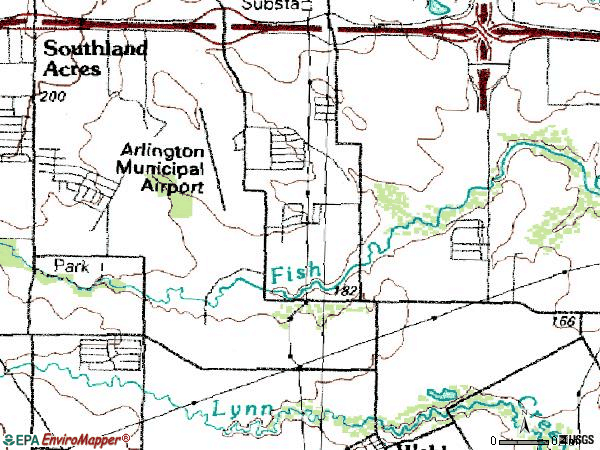

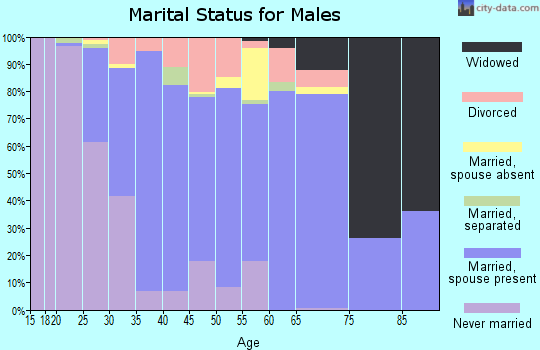
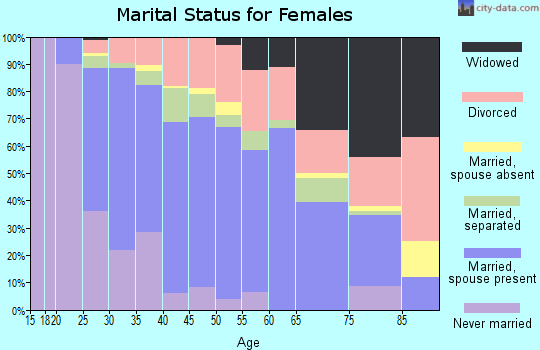


 According to the data from the years 2003 - 2018 the average number of fires per year is 49. The highest number of reported fires - 94 took place in 2006, and the least - 1 in 2004. The data has an increasing trend.
 When looking into fire subcategories, the most reports belonged to: Outside Fires (38.9%), and Structure Fires (33.3%).