Estimated zip code population in 2022: 6,130 Zip code population in 2010: 5,153 Zip code population in 2000: 4,175
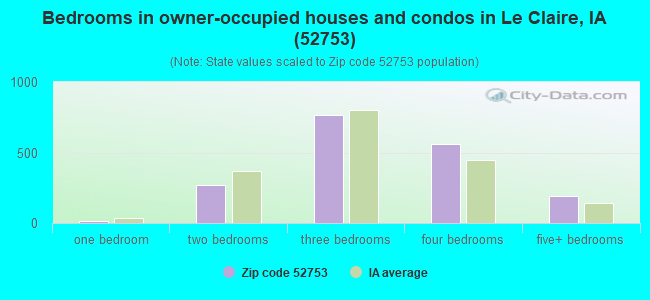
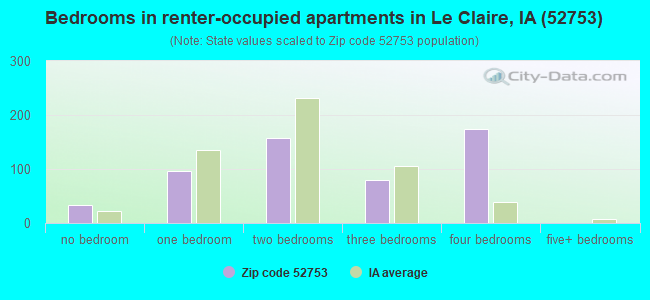
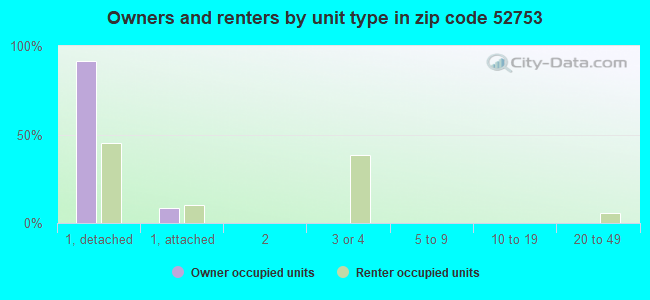
Houses and condos: 2,549 Renter-occupied apartments: 535
% of renters here:
23%
State:
28%
March 2022 cost of living index in zip code 52753: 86.2 (less than average, U.S. average is 100)
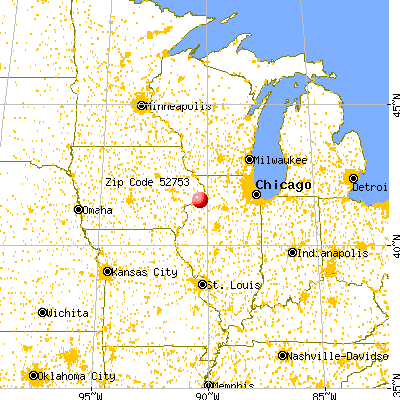
Land area: 24.9 sq. mi. Water area: 1.5 sq. mi.
Population density: 246 people per square mile
(very low).
OSM Map
General Map
Google Map
MSN Map
OSM Map
General Map
Google Map
MSN Map
OSM Map
General Map
Google Map
MSN Map
OSM Map
General Map
Google Map
MSN Map
Please wait while loading the map...
Real estate property taxes paid for housing units in 2022:
This zip code:
1.1% ($3,618)
Iowa:
1.4% ($2,724)
Median real estate property taxes paid for housing units with mortgages in 2022: $3,987 (1.1%) Median real estate property taxes paid for housing units with no mortgage in 2022: $2,970 (1.1%)
Business Search- 14 Million verified businesses
Males: 3,038
(49.6%)
Females: 3,092
(50.4%)
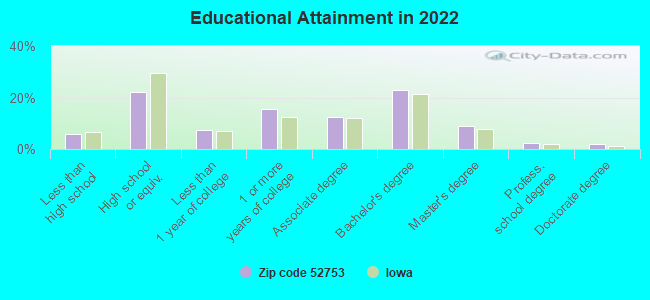
For population 25 years and over in 52753:
High school or higher: 95.2%
Bachelor's degree or higher: 36.7%
Graduate or professional degree: 13.4%
Unemployed: 0.9%
Mean travel time to work (commute): 22.7 minutes
For population 15 years and over in 52753:
Never married: 16.9%
Now married: 64.1%
Separated: 0.3%
Widowed: 3.1%
Divorced: 15.6%
Zip code 52753 compared to state average:
Median house value above state average.
Unemployed percentage significantly below state average.
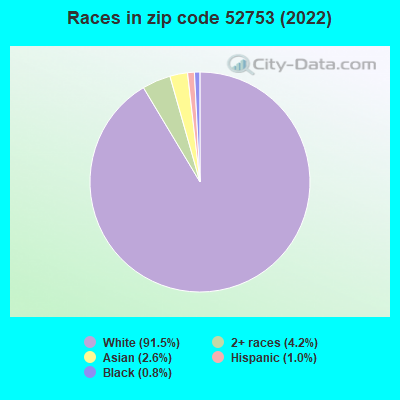
Black race population percentage significantly below state average.
Hispanic race population percentage significantly below state average.
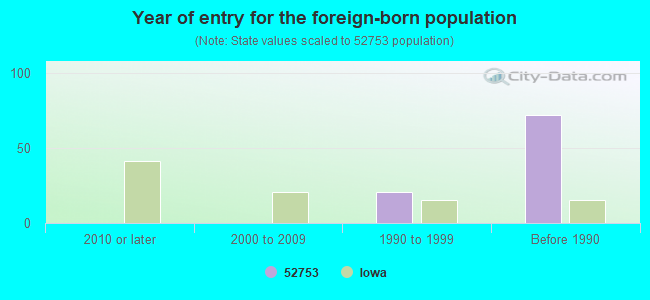
Foreign-born population percentage significantly below state average.
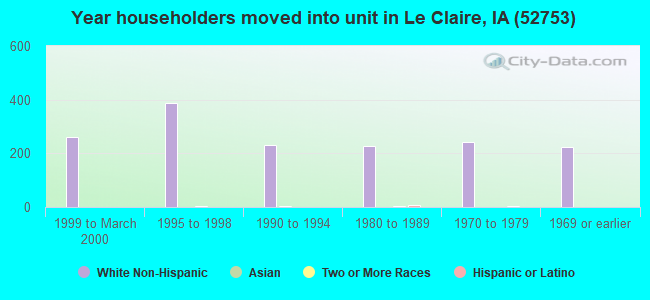
Length of stay since moving in significantly above state average.
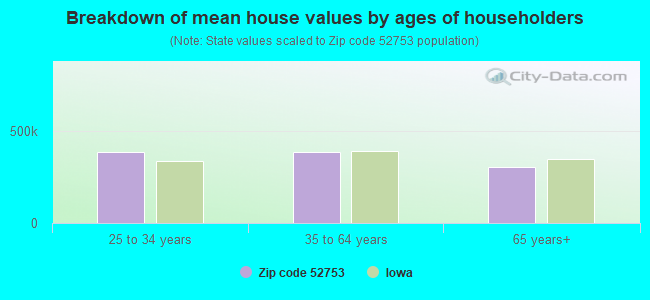
Estimated median house/condo value in 2022: $326,405
52753:
$326,405
Iowa:
$194,600
According to our research of Iowa and other state lists, there were 2 registered sex offenders living in 52753 zip code as of June 10, 2024. The ratio of all residents to sex offenders in zip code 52753 is 2,792 to 1. The ratio of registered sex offenders to all residents in this zip code is much lower than the state average.
Median resident age:
This zip code:
37.4 years
Iowa median age:
38.9 years
Average household size:
This zip code:
2.6 people
Iowa:
2.3 people
Averages for the 2020 tax year for zip code 52753, filed in 2021:
Average Adjusted Gross Income (AGI) in 2020: $104,329 (Individual Income Tax Returns)
Here:
$104,329
State:
$71,087
Salary/wage: $87,594 (reported on 81.9% of returns)
Here:
$87,594
State:
$57,361
(% of AGI for various income ranges: 1023.0% for AGIs below $25k, 3255.0% for AGIs $25k-50k, 5969.6% for AGIs $50k-75k, 8911.4% for AGIs $75k-100k, 17533.4% for AGIs $100k-200k, 66373.6% for AGIs over 200k)
Taxable interest for individuals: $1,928 (reported on 48.3% of returns)
This zip code:
$1,928
Iowa:
$1,633
(% of AGI for various income ranges: 28.3% for AGIs below $25k, 42.4% for AGIs $25k-50k, 58.2% for AGIs $50k-75k, 109.5% for AGIs $75k-100k, 139.6% for AGIs $100k-200k, 1230.9% for AGIs over 200k)
Ordinary dividends: $6,561 (reported on 30.2% of returns)
Here:
$6,561
State:
$5,432
(% of AGI for various income ranges: 28.9% for AGIs below $25k, 70.9% for AGIs $25k-50k, 138.6% for AGIs $50k-75k, 241.9% for AGIs $75k-100k, 320.4% for AGIs $100k-200k, 2662.7% for AGIs over 200k)
Net capital gain/loss in AGI: +$12,322 (reported on 27.1% of returns)
Here:
+$12,322
State:
+$15,243
(% of AGI for various income ranges: 13.0% for AGIs below $25k, 42.6% for AGIs $25k-50k, 143.9% for AGIs $50k-75k, 169.0% for AGIs $75k-100k, 508.1% for AGIs $100k-200k, 5690.0% for AGIs over 200k)
Profit/loss from business: +$13,770 (reported on 16.0% of returns)
Here:
+$13,770
State:
+$11,763
(% of AGI for various income ranges: 62.3% for AGIs below $25k, 191.5% for AGIs $25k-50k, 163.6% for AGIs $50k-75k, 141.9% for AGIs $75k-100k, 484.0% for AGIs $100k-200k, 2144.5% for AGIs over 200k)
Taxable individual retirement arrangement distribution: $21,530 (reported on 13.9% of returns)
52753:
$21,530
Iowa:
$17,324
(% of AGI for various income ranges: 77.4% for AGIs below $25k, 212.1% for AGIs $25k-50k, 251.4% for AGIs $50k-75k, 711.4% for AGIs $75k-100k, 703.4% for AGIs $100k-200k, 1839.1% for AGIs over 200k)
Total itemized deductions: $32,067 (reported on 11.5% of returns)
Here:
$32,067
State:
$33,775
(% of AGI for various income ranges: 312.4% for AGIs $25k-50k, 248.2% for AGIs $50k-75k, 419.5% for AGIs $75k-100k, 732.3% for AGIs $100k-200k, 4092.7% for AGIs over 200k)
Charity contributions: $10,011 (reported on 9.4% of returns)
Here:
$10,011
State:
$13,075
(% of AGI for various income ranges: 42.9% for AGIs $50k-75k, 51.9% for AGIs $75k-100k, 145.7% for AGIs $100k-200k, 1626.4% for AGIs over 200k)
Taxes paid: $8,724 (reported on 11.5% of returns)
52753:
$8,724
State:
$7,704
(% of AGI for various income ranges: 54.7% for AGIs $25k-50k, 70.0% for AGIs $50k-75k, 148.1% for AGIs $75k-100k, 245.3% for AGIs $100k-200k, 939.1% for AGIs over 200k)
Earned income credit: $2,274 (reported on 6.6% of returns)
Here:
$2,274
State:
$2,195
(% of AGI for various income ranges: 62.3% for AGIs below $25k, 40.9% for AGIs $25k-50k)
Percentage of individuals using paid preparers for their 2020 taxes: 94.4%
Here:
94%
State:
95%
(% for various income ranges: 92.3% for AGIs below $25k, 93.2% for AGIs $25k-50k, 94.9% for AGIs $50k-75k, 93.9% for AGIs $75k-100k, 96.2% for AGIs $100k-200k, 96.6% for AGIs over 200k)
Averages for the 2012 tax year for zip code 52753, filed in 2013:
Average Adjusted Gross Income (AGI) in 2012: $90,287 (Individual Income Tax Returns)
Here:
$90,287
State:
$58,860
Salary/wage: $71,112 (reported on 84.6% of returns)
Here:
$71,112
State:
$46,659
(% of AGI for various income ranges: 69.4% for AGIs below $25k, 69.4% for AGIs $25k-50k, 71.1% for AGIs $50k-75k, 77.5% for AGIs $75k-100k, 79.9% for AGIs $100k-200k, 50.6% for AGIs over 200k)
Taxable interest for individuals: $1,348 (reported on 50.4% of returns)
This zip code:
$1,348
Iowa:
$1,537
(% of AGI for various income ranges: 2.2% for AGIs below $25k, 1.2% for AGIs $25k-50k, 0.6% for AGIs $50k-75k, 0.5% for AGIs $75k-100k, 0.5% for AGIs $100k-200k, 0.8% for AGIs over 200k)
Ordinary dividends: $4,629 (reported on 28.8% of returns)
Here:
$4,629
State:
$4,542
(% of AGI for various income ranges: 2.4% for AGIs below $25k, 1.0% for AGIs $25k-50k, 1.3% for AGIs $50k-75k, 1.0% for AGIs $75k-100k, 1.0% for AGIs $100k-200k, 2.1% for AGIs over 200k)
Net capital gain/loss in AGI: +$14,040 (reported on 20.0% of returns)
Here:
+$14,040
State:
+$11,802
(% of AGI for various income ranges: 0.5% for AGIs $50k-75k, 0.9% for AGIs $75k-100k, 2.0% for AGIs $100k-200k, 6.3% for AGIs over 200k)
Profit/loss from business: +$16,341 (reported on 15.0% of returns)
Here:
+$16,341
State:
+$10,509
(% of AGI for various income ranges: 4.7% for AGIs below $25k, 5.3% for AGIs $25k-50k, 2.6% for AGIs $50k-75k, 1.9% for AGIs $75k-100k, 1.6% for AGIs $100k-200k, 3.2% for AGIs over 200k)
Taxable individual retirement arrangement distribution: $16,227 (reported on 12.7% of returns)
52753:
$16,227
Iowa:
$11,773
(% of AGI for various income ranges: 4.1% for AGIs below $25k, 3.3% for AGIs $25k-50k, 4.2% for AGIs $50k-75k, 2.4% for AGIs $75k-100k, 2.4% for AGIs $100k-200k, 1.3% for AGIs over 200k)
Self-employment retirement plans: $25,900 (reported on 1.2% of returns)
52753:
$25,900
Iowa:
$18,614
(% of AGI for various income ranges: 1.1% for AGIs $100k-200k)
Total itemized deductions: $25,239 (16% of AGI, reported on 45.8% of returns)
Here:
$25,239
State:
$21,278
Here:
16.4% of AGI
State:
18.9% of AGI
(% of AGI for various income ranges: 15.1% for AGIs below $25k, 9.9% for AGIs $25k-50k, 12.1% for AGIs $50k-75k, 12.5% for AGIs $75k-100k, 15.6% for AGIs $100k-200k, 11.1% for AGIs over 200k)
Charity contributions: $4,255 (reported on 38.8% of returns)
Here:
$4,255
State:
$4,044
(% of AGI for various income ranges: 1.0% for AGIs below $25k, 1.2% for AGIs $25k-50k, 1.3% for AGIs $50k-75k, 1.4% for AGIs $75k-100k, 2.1% for AGIs $100k-200k, 2.1% for AGIs over 200k)
Taxes paid: $11,893 (reported on 45.8% of returns)
52753:
$11,893
State:
$8,846
(% of AGI for various income ranges: 3.3% for AGIs below $25k, 3.2% for AGIs $25k-50k, 4.6% for AGIs $50k-75k, 5.1% for AGIs $75k-100k, 7.4% for AGIs $100k-200k, 6.4% for AGIs over 200k)
Earned income credit: $1,974 (reported on 10.4% of returns)
Here:
$1,974
State:
$2,098
(% of AGI for various income ranges: 4.6% for AGIs below $25k, 0.8% for AGIs $25k-50k)
Percentage of individuals using paid preparers for their 2012 taxes: 59.6%
Here:
60%
State:
65%
(% for various income ranges: 51.3% for AGIs below $25k, 54.5% for AGIs $25k-50k, 64.9% for AGIs $50k-75k, 66.7% for AGIs $75k-100k, 62.3% for AGIs $100k-200k, 76.5% for AGIs over 200k)
Averages for the 2004 tax year for zip code 52753, filed in 2005:
Average Adjusted Gross Income (AGI) in 2004: $54,005 (Individual Income Tax Returns)
Here:
$54,005
State:
$43,875
Salary/wage: $48,832 (reported on 84.8% of returns)
Here:
$48,832
State:
$38,265
(% of AGI for various income ranges: 95.4% for AGIs below $10k, 67.4% for AGIs $10k-25k, 76.4% for AGIs $25k-50k, 82.4% for AGIs $50k-75k, 80.6% for AGIs $75k-100k, 72.6% for AGIs over 100k)
Taxable interest for individuals: $1,602 (reported on 57.3% of returns)
This zip code:
$1,602
Iowa:
$1,768
(% of AGI for various income ranges: 5.2% for AGIs below $10k, 4.2% for AGIs $10k-25k, 1.8% for AGIs $25k-50k, 1.1% for AGIs $50k-75k, 0.9% for AGIs $75k-100k, 1.9% for AGIs over 100k)
Taxable dividends: $2,109 (reported on 31.2% of returns)
Here:
$2,109
State:
$2,510
(% of AGI for various income ranges: 5.7% for AGIs below $10k, 2.6% for AGIs $10k-25k, 1.0% for AGIs $25k-50k, 0.8% for AGIs $50k-75k, 1.0% for AGIs $75k-100k, 1.3% for AGIs over 100k)
Net capital gain/loss: +$3,559 (reported on 25.1% of returns)
Here:
+$3,559
State:
+$6,139
(% of AGI for various income ranges: -3.4% for AGIs below $10k, -0.2% for AGIs $10k-25k, 1.0% for AGIs $25k-50k, 0.3% for AGIs $50k-75k, 0.1% for AGIs $75k-100k, 3.9% for AGIs over 100k)
Profit/loss from business: +$11,352 (reported on 15.7% of returns)
Here:
+$11,352
State:
+$8,574
(% of AGI for various income ranges: -4.2% for AGIs below $10k, 3.4% for AGIs $10k-25k, 4.7% for AGIs $25k-50k, 3.2% for AGIs $50k-75k, 2.9% for AGIs $75k-100k, 3.2% for AGIs over 100k)
IRA payment deduction: $3,551 (reported on 2.4% of returns)
52753:
$3,551
Iowa:
$2,970
Self-employed pension: $16,000 (reported on 0.8% of returns)
Here:
$16,000
Iowa:
$11,928
Total itemized deductions: $17,405 (20% of AGI, reported on 44.4% of returns)
Here:
$17,405
State:
$16,976
Here:
20.2% of AGI
State:
20.8% of AGI
(% of AGI for various income ranges: 14.9% for AGIs below $10k, 15.2% for AGIs $10k-25k, 11.8% for AGIs $25k-50k, 14.0% for AGIs $50k-75k, 16.2% for AGIs $75k-100k, 14.4% for AGIs over 100k)
Charity contributions deductions: $2,401 (3% of AGI, reported on 39.3% of returns)
Here:
$2,401
State:
$3,089
Here:
2.7% of AGI
State:
3.6% of AGI
(% of AGI for various income ranges: 1.3% for AGIs below $10k, 1.6% for AGIs $10k-25k, 1.1% for AGIs $25k-50k, 1.3% for AGIs $50k-75k, 2.2% for AGIs $75k-100k, 2.0% for AGIs over 100k)
Total tax: $7,856 (reported on 81.1% of returns)
52753:
$7,856
State:
$6,177
(% of AGI for various income ranges: 2.8% for AGIs below $10k, 4.4% for AGIs $10k-25k, 6.8% for AGIs $25k-50k, 9.0% for AGIs $50k-75k, 10.1% for AGIs $75k-100k, 17.5% for AGIs over 100k)
Earned income credit: $1,432 (reported on 8.4% of returns)
Here:
$1,432
State:
$1,540
Percentage of individuals using paid preparers for their 2004 taxes: 60.8%
Here:
61%
State:
70%
(% for various income ranges: 45.8% for AGIs below $10k, 58.0% for AGIs $10k-25k, 65.8% for AGIs $25k-50k, 64.5% for AGIs $50k-75k, 64.4% for AGIs $75k-100k, 67.8% for AGIs over 100k)
Household received Food Stamps/SNAP in the past 12 months: 261 Household did not receive Food Stamps/SNAP in the past 12 months: 2,059
Women who had a birth in the past 12 months: 42 (44 now married, 0 unmarried) Women who did not have a birth in the past 12 months: 1,201 (558 now married, 642 unmarried)
Housing units in zip code 52753 with a mortgage: 1,096 (147 second mortgage, 34 home equity loan, 89 both second mortgage and home equity loan) Houses without a mortgage: 57
Median monthly owner costs for units with a mortgage: $1,864 Median monthly owner costs for units without a mortgage: $671
Residents with income below the poverty level in 2022:
This zip code:
6.7%
Whole state:
11.0%
Residents with income below 50% of the poverty level in 2022:
This zip code:
2.3%
Whole state:
5.5%
Median number of rooms in houses and condos:
Here:
7.3
State:
6.8
Median number of rooms in apartments:
Here:
5.7
State:
4.2
Notable locations in this zip code not listed on our city pages
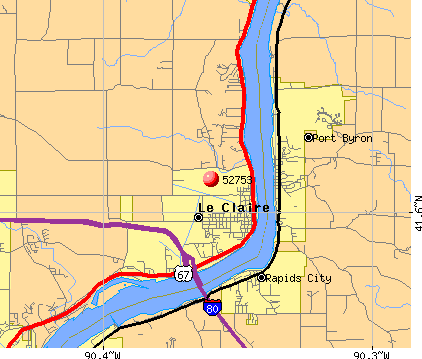
Notable locations in zip code 52753: Le Claire (A), Olathea Golf Course (B), Napsineke Heights (C), Scott County Library (D), Medic Emergency Medical Services Post 11 (E), Mississippi Valley Welcome Center (F), Le Claire Library (G), Le Claire City Hall (H), Le Claire Police Department (I), Le Claire Fire Department (J), Buffalo Bill Museum (K). Display/hide their locations on the map
Churches in zip code 52753 include: United Church (A), New Life Community Church (B), First Presbyterian Church (C), Calvary Chapel (D), Our Lady of the River Church (E), First Presbyterian Church (F), Little Wayside Chapel (G), Calvary Chapel (H), First Assembly of God Church (I). Display/hide their locations on the map
Size of family households: 908 2-persons, 237 3-persons, 251 4-persons, 138 5-persons, 57 6-persons, 98 7-or-more-persons
Size of nonfamily households: 571 1-person, 71 2-persons
1,182 married couples with children.
428 single-parent households (15 men, 413 women).
98.2% of residents of 52753 zip code speak English at home.
0.9% of residents speak Spanish at home (100% very well).
0.1% of residents speak other Indo-European language at home (100% very well).
0.4% of residents speak Asian or Pacific Island language at home (100% very well).
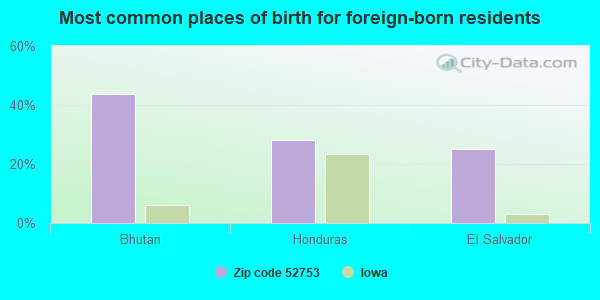
Foreign born population: 34 (0.6%) (75.7% of them are naturalized citizens)
This zip code:
0.6%
Whole state:
6.0%
44%Bhutan
28%Honduras
25%El Salvador
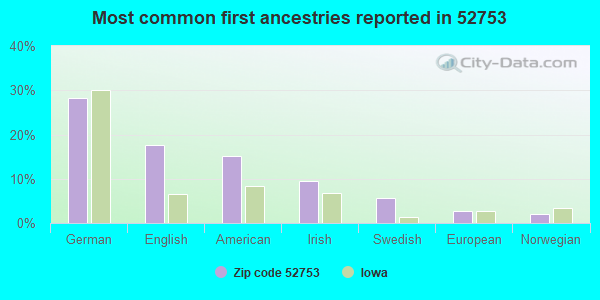
28%German
18%English
15%American
10%Irish
6%Swedish
3%European
2%Norwegian
Year of entry for the foreign-born population
02010 or later
02000 to 2009
211990 to 1999
72Before 1990
Facilities with environmental interests located in this zip code:
CODY ELEMENTARY SCH (2100 TERRITORIAL ROAD in LECLAIRE, IA)
STATE MASTER (Iowa emission factors information) - SDWIS-IA8271565, DRINKING WATER SYSTEM (National Center for Education Statistics) - STATE ID-825250 405 Organizations: CODY ELEMENTARY SCHOOL, CODY ELEMENTARY SCHOOL (CONTACT/OPERATOR)
, PLEASANT VALLEY COMM SCHOOL DISTRICT (SCHOOL DISTRICT)
BRIDGEVIEW ELEMENTARY SCHOOL (316 S.TWELFTH STREET in LECLAIRE, IA)
(National Center for Education Statistics) - STATE ID-825250 403 Organizations: PLEASANT VALLEY COMM SCHOOL DISTRICT (SCHOOL DISTRICT)
PLEASANT VALLEY JUNIOR HIGH SCHOOL (3501 WISCONSIN STREET in LECLAIRE, IA)
(National Center for Education Statistics) - STATE ID-825250 209 Organizations: PLEASANT VALLEY COMM SCHOOL DISTRICT (SCHOOL DISTRICT)
RIVERSTONE GROUP INC - LE CLAIRE QUARRY (400 TERRITORIAL ROAD in LE CLAIRE, IA)
AIR MINOR (AIRS/AFS) COMPLIANCE ACTIVITY (Tracking inspections of insecticide, fungicide, and rodenticide, and toxic substances) Business SIC classification: CRUSHED AND BROKEN LIMESTONE; SAWMILLS AND PLANING MILLS, GENERAL; CONCRETE PRODUCTS, EXCEPT BLOCK AND BRICK; CUT STONE AND STONE PRODUCTS Alternative names: LE CLAIRE QUARRIES, MCCARTHY IMPROVEMENT COMPANY LECLAIRE QUARRY
RIVERSTONE GROUP INC (1300 NORTH CODY ROAD in LE CLAIRE, IA)
National Pollutant Discharge Elimination System NON-MAJOR (Tracking pollutant discharge elimination systems) - permit Business SIC classification: CRUSHED AND BROKEN LIMESTONE Alternative names: LECLAIRE QUARRY (MC38), MOLINE CONSUMERS CO. (LECLAIRE
BEUSES PATTERN WORKS (304 S. CODY ROAD in LE CLAIRE, IA)
AIR MINOR (AIRS/AFS) Business SIC classification: NONCLASSIFIABLE ESTABLISHMENTS
CORSON EXCAVATING (23165 240TH AVENUE in LE CLAIRE, IA)
AIR MINOR (AIRS/AFS) Business SIC classification: EXCAVATION WORK
DONCO ENTERPRISE INC (302 S 5TH ST in LE CLAIRE, IA)
COMPLIANCE ACTIVITY (Tracking inspections of insecticide, fungicide, and rodenticide, and toxic substances)
PEBBLE CREEK FIFTH ADDITION (535TH & FOREST GROVE DRIVE in LE CLAIRE, IA)
National Pollutant Discharge Elimination System STORMWATER PERMIT (STATE)
PLEASANT VALLEY CSD (230 N 10 in LE CLAIRE, IA)
COMPLIANCE ACTIVITY (Tracking inspections of insecticide, fungicide, and rodenticide, and toxic substances)
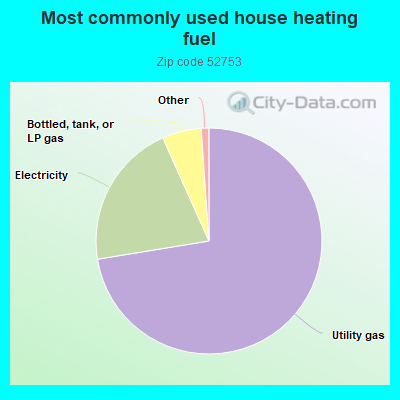
72.5%Utility gas
20.9%Electricity
5.6%Bottled, tank, or LP gas
0.6%Wood
0.5%Fuel oil, kerosene, etc.
Population in 1990: 4,176.
Place of birth for U.S.-born residents:
This state: 2,495
Northeast: 120
Midwest: 2,125
South: 348
West: 891
62% of the 52753 zip code residents lived in the same house 5 years ago. Out of people who lived in different houses, 69% lived in this county. Out of people who lived in different counties, 50% lived in Iowa.
86% of the 52753 zip code residents lived in the same house 1 year ago. Out of people who lived in different houses, 34% moved from this county. Out of people who lived in different houses, 20% moved from different county within same state. Out of people who lived in different houses, 45% moved from different state.
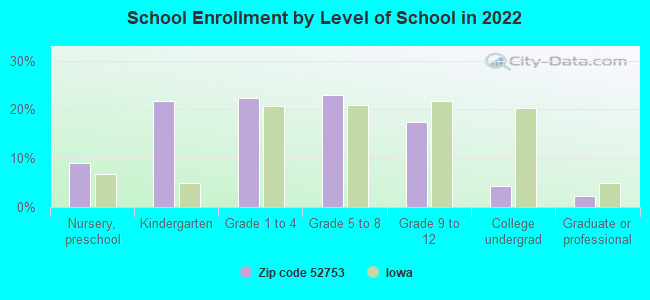
Private vs. public school enrollment:
Students in private schools in grades 1 to 8 (elementary and middle school): 15
Here:
1.8%
Iowa:
10.6%
Students in private schools in grades 9 to 12 (high school): 13
Here:
3.9%
Iowa:
7.9%
Students in private undergraduate colleges: 21
Here:
26.1%
Iowa:
23.9%
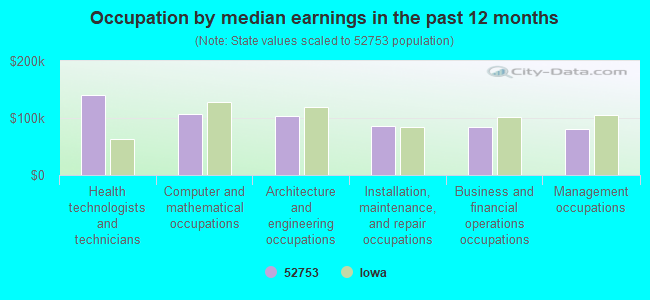
Occupation by median earnings in the past 12 months ($)
140,979Health technologists and technicians
106,669Computer and mathematical occupations
103,896Architecture and engineering occupations
85,382Installation, maintenance, and repair occupations
84,513Business and financial operations occupations
80,711Management occupations
Companies with federal contracts located in this zip code:
THE MAINTENANCE CREW (3435 VALLEY DRIVE in LE CLAIRE, IA; small business) : $101,363 in 14 contractsfrom 2001 to 2006
Contracts for Custodial Janitorial Services by Army, U.S. Army Corps of Engineers - civil program financing only Signed by year:2000: $0; 2001: $13,429; 2002: -$231; 2003: $14,255; 2004: $28,510; 2005: $29,272; 2006: $16,128.
Biggest contracts:
$14,981 with Army for Custodial Janitorial Services. Signed on 2006-03-06. Completion date: 2006-02-15.
$14,255 with U.S. Army Corps of Engineers - civil program financing only for Custodial Janitorial Services. Taking place in IL. Signed on 2005-02-02. Completion date: 2003-02-28.
$14,255 with Army for Custodial Janitorial Services. Taking place in IL. Signed on 2005-02-02. Completion date: 2003-02-28.
$14,255 with U.S. Army Corps of Engineers - civil program financing only for Custodial Janitorial Services. Taking place in IL. Signed on 2004-01-23. Completion date: 2003-02-28.
WILLIAM C WHETSTINE (28164 219TH STREET in LE CLAIRE, IA; small business) : $27,375 in 6 contractsfrom 2003 to 2006
Contracts for Education Services, Other Education and Training Services by Army, U.S. Army Corps of Engineers - civil program financing only Signed by year:2000: $0; 2001: $0; 2002: $0; 2003: $4,450; 2004: $17,800; 2005: $0; 2006: $5,125.
Biggest contracts:
$5,125 with Army for Education Services. Taking place in GA. Signed on 2006-02-24. Completion date: 2006-09-16.
$4,450 with U.S. Army Corps of Engineers - civil program financing only for Other Education and Training Services. Taking place in GA. Signed on 2004-11-18. Completion date: 2004-12-10.
$4,450 with Army for Other Education and Training Services. Taking place in GA. Signed on 2004-11-18. Completion date: 2004-12-10.
$4,450 with U.S. Army Corps of Engineers - civil program financing only for Other Education and Training Services. Taking place in GA. Signed on 2004-05-28. Completion date: 2004-06-30.
Top industries in this zip code by the number of employees in 2005:
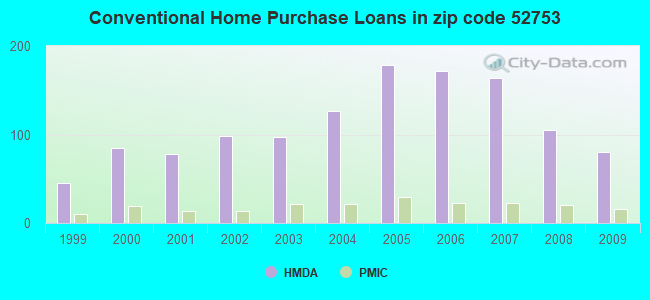
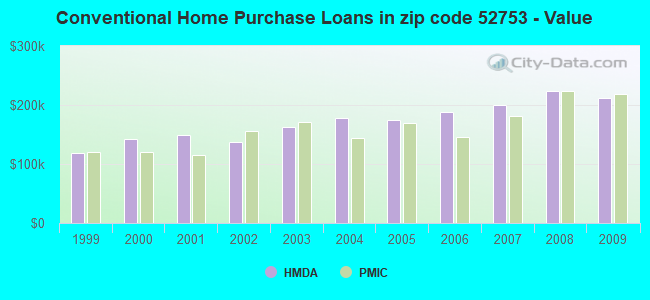
Detailed PMIC statistics for the following Tracts:0101.01
, 0101.02
2003 - 2018 National Fire Incident Reporting System (NFIRS) incidents
According to the data from the years 2003 - 2018 the average number of fires per year is 18. The highest number of reported fires - 29 took place in 2003, and the least - 0 in 2006. The data has a dropping trend.
When looking into fire subcategories, the most reports belonged to: Structure Fires (38.0%), and Outside Fires (34.5%).
Fire incident types reported to NFIRS in Zip Code 52753


 Nearest zip codes: 61278, 52768, 52767, 61275, 61256, 52722.


 According to the data from the years 2003 - 2018 the average number of fires per year is 18. The highest number of reported fires - 29 took place in 2003, and the least - 0 in 2006. The data has a dropping trend.
 When looking into fire subcategories, the most reports belonged to: Structure Fires (38.0%), and Outside Fires (34.5%).