Estimated zip code population in 2022: 30,466
Zip code population in 2010: 28,552
Zip code population in 2000: 28,062
Houses and condos: 13,400
Renter-occupied apartments: 4,463
% of renters here:
35%State:
27%
March 2022 cost of living index in zip code 49024: 83.0
(low, U.S. average is 100)
Land area: 17.2
sq. mi.
Water area: 0.2
sq. mi.
Population density: 1,776 people per square mile (low).
OSM Map
General Map
Google Map
MSN Map
OSM Map
General Map
Google Map
MSN Map
OSM Map
General Map
Google Map
MSN Map
OSM Map
General Map
Google Map
MSN Map
Please wait while loading the map...
Real estate property taxes paid for housing units in 2022:
This zip code:
1.5% ($3,988)Michigan:
1.2% ($2,746)
Median real estate property taxes paid for housing units with mortgages in 2022: $3,963 (1.6%)
Median real estate property taxes paid for housing units with no mortgage in 2022: $4,102 (1.5%)
Profiles of local businesses
Business Search - 14 Million verified businesses
Males: 14,681 Females: 15,785
For population 25 years and over in 49024:
High school or higher: 97.7%Bachelor's degree or higher: 52.9%Graduate or professional degree: 23.6%Unemployed: 5.2%Mean travel time to work (commute): 20.0 minutes
For population 15 years and over in 49024:
Never married: 31.8%Now married: 53.4%Separated: 0.6%Widowed: 5.0%Divorced: 9.2%
Zip code 49024 compared to state average:
Black race population percentage below state average. Length of stay since moving in above state average. House age below state average. Percentage of population with a bachelor's degree or higher above state average. 24,375 80.0% White 1,809 5.9% Black 1,673 5.5% Hispanic or Latino 1,263 4.1% Two or more races 1,116 3.7% Asian 164 0.5% Some other race 64 0.2% American Indian
Data:
Median household income ($)
Median household income (% change since 2000)
Household income diversity
Ratio of average income to average house value (%)
Ratio of average income to average rent
Median household income ($) - White
Median household income ($) - Black or African American
Median household income ($) - Asian
Median household income ($) - Hispanic or Latino
Median household income ($) - American Indian and Alaska Native
Median household income ($) - Multirace
Median household income ($) - Other Race
Median household income for houses/condos with a mortgage ($)
Median household income for apartments without a mortgage ($)
Races - White alone (%)
Races - White alone (% change since 2000)
Races - Black alone (%)
Races - Black alone (% change since 2000)
Races - American Indian alone (%)
Races - American Indian alone (% change since 2000)
Races - Asian alone (%)
Races - Asian alone (% change since 2000)
Races - Hispanic (%)
Races - Hispanic (% change since 2000)
Races - Native Hawaiian and Other Pacific Islander alone (%)
Races - Native Hawaiian and Other Pacific Islander alone (% change since 2000)
Races - Two or more races (%)
Races - Two or more races (% change since 2000)
Races - Other race alone (%)
Races - Other race alone (% change since 2000)
Racial diversity
Unemployment (%)
Unemployment (% change since 2000)
Unemployment (%) - White
Unemployment (%) - Black or African American
Unemployment (%) - Asian
Unemployment (%) - Hispanic or Latino
Unemployment (%) - American Indian and Alaska Native
Unemployment (%) - Multirace
Unemployment (%) - Other Race
Population density (people per square mile)
Population - Males (%)
Population - Females (%)
Population - Males (%) - White
Population - Males (%) - Black or African American
Population - Males (%) - Asian
Population - Males (%) - Hispanic or Latino
Population - Males (%) - American Indian and Alaska Native
Population - Males (%) - Multirace
Population - Males (%) - Other Race
Population - Females (%) - White
Population - Females (%) - Black or African American
Population - Females (%) - Asian
Population - Females (%) - Hispanic or Latino
Population - Females (%) - American Indian and Alaska Native
Population - Females (%) - Multirace
Population - Females (%) - Other Race
Coronavirus confirmed cases (Jun 10, 2024)
Deaths caused by coronavirus (Jun 10, 2024)
Coronavirus confirmed cases (per 100k population) (Jun 10, 2024)
Deaths caused by coronavirus (per 100k population) (Jun 10, 2024)
Daily increase in number of cases (Jun 10, 2024)
Weekly increase in number of cases (Jun 10, 2024)
Cases doubled (in days) (Jun 10, 2024)
Hospitalized patients (Apr 18, 2022)
Negative test results (Apr 18, 2022)
Total test results (Apr 18, 2022)
COVID Vaccine doses distributed (per 100k population) (Sep 19, 2023)
COVID Vaccine doses administered (per 100k population) (Sep 19, 2023)
COVID Vaccine doses distributed (Sep 19, 2023)
COVID Vaccine doses administered (Sep 19, 2023)
Likely homosexual households (%)
Likely homosexual households (% change since 2000)
Likely homosexual households - Lesbian couples (%)
Likely homosexual households - Lesbian couples (% change since 2000)
Likely homosexual households - Gay men (%)
Likely homosexual households - Gay men (% change since 2000)
Cost of living index
Median gross rent ($)
Median contract rent ($)
Median monthly housing costs ($)
Median house or condo value ($)
Median house or condo value ($ change since 2000)
Mean house or condo value by units in structure - 1, detached ($)
Mean house or condo value by units in structure - 1, attached ($)
Mean house or condo value by units in structure - 2 ($)
Mean house or condo value by units in structure by units in structure - 3 or 4 ($)
Mean house or condo value by units in structure - 5 or more ($)
Mean house or condo value by units in structure - Boat, RV, van, etc. ($)
Mean house or condo value by units in structure - Mobile home ($)
Median house or condo value ($) - White
Median house or condo value ($) - Black or African American
Median house or condo value ($) - Asian
Median house or condo value ($) - Hispanic or Latino
Median house or condo value ($) - American Indian and Alaska Native
Median house or condo value ($) - Multirace
Median house or condo value ($) - Other Race
Median resident age
Resident age diversity
Median resident age - Males
Median resident age - Females
Median resident age - White
Median resident age - Black or African American
Median resident age - Asian
Median resident age - Hispanic or Latino
Median resident age - American Indian and Alaska Native
Median resident age - Multirace
Median resident age - Other Race
Median resident age - Males - White
Median resident age - Males - Black or African American
Median resident age - Males - Asian
Median resident age - Males - Hispanic or Latino
Median resident age - Males - American Indian and Alaska Native
Median resident age - Males - Multirace
Median resident age - Males - Other Race
Median resident age - Females - White
Median resident age - Females - Black or African American
Median resident age - Females - Asian
Median resident age - Females - Hispanic or Latino
Median resident age - Females - American Indian and Alaska Native
Median resident age - Females - Multirace
Median resident age - Females - Other Race
Commute - mean travel time to work (minutes)
Travel time to work - Less than 5 minutes (%)
Travel time to work - Less than 5 minutes (% change since 2000)
Travel time to work - 5 to 9 minutes (%)
Travel time to work - 5 to 9 minutes (% change since 2000)
Travel time to work - 10 to 19 minutes (%)
Travel time to work - 10 to 19 minutes (% change since 2000)
Travel time to work - 20 to 29 minutes (%)
Travel time to work - 20 to 29 minutes (% change since 2000)
Travel time to work - 30 to 39 minutes (%)
Travel time to work - 30 to 39 minutes (% change since 2000)
Travel time to work - 40 to 59 minutes (%)
Travel time to work - 40 to 59 minutes (% change since 2000)
Travel time to work - 60 to 89 minutes (%)
Travel time to work - 60 to 89 minutes (% change since 2000)
Travel time to work - 90 or more minutes (%)
Travel time to work - 90 or more minutes (% change since 2000)
Marital status - Never married (%)
Marital status - Now married (%)
Marital status - Separated (%)
Marital status - Widowed (%)
Marital status - Divorced (%)
Median family income ($)
Median family income (% change since 2000)
Median non-family income ($)
Median non-family income (% change since 2000)
Median per capita income ($)
Median per capita income (% change since 2000)
Median family income ($) - White
Median family income ($) - Black or African American
Median family income ($) - Asian
Median family income ($) - Hispanic or Latino
Median family income ($) - American Indian and Alaska Native
Median family income ($) - Multirace
Median family income ($) - Other Race
Median year house/condo built
Median year apartment built
Year house built - Built 2005 or later (%)
Year house built - Built 2000 to 2004 (%)
Year house built - Built 1990 to 1999 (%)
Year house built - Built 1980 to 1989 (%)
Year house built - Built 1970 to 1979 (%)
Year house built - Built 1960 to 1969 (%)
Year house built - Built 1950 to 1959 (%)
Year house built - Built 1940 to 1949 (%)
Year house built - Built 1939 or earlier (%)
Average household size
Household density (households per square mile)
Average household size - White
Average household size - Black or African American
Average household size - Asian
Average household size - Hispanic or Latino
Average household size - American Indian and Alaska Native
Average household size - Multirace
Average household size - Other Race
Occupied housing units (%)
Vacant housing units (%)
Owner occupied housing units (%)
Renter occupied housing units (%)
Vacancy status - For rent (%)
Vacancy status - For sale only (%)
Vacancy status - Rented or sold, not occupied (%)
Vacancy status - For seasonal, recreational, or occasional use (%)
Vacancy status - For migrant workers (%)
Vacancy status - Other vacant (%)
Residents with income below the poverty level (%)
Residents with income below 50% of the poverty level (%)
Children below poverty level (%)
Poor families by family type - Married-couple family (%)
Poor families by family type - Male, no wife present (%)
Poor families by family type - Female, no husband present (%)
Poverty status for native-born residents (%)
Poverty status for foreign-born residents (%)
Poverty among high school graduates not in families (%)
Poverty among people who did not graduate high school not in families (%)
Residents with income below the poverty level (%) - White
Residents with income below the poverty level (%) - Black or African American
Residents with income below the poverty level (%) - Asian
Residents with income below the poverty level (%) - Hispanic or Latino
Residents with income below the poverty level (%) - American Indian and Alaska Native
Residents with income below the poverty level (%) - Multirace
Residents with income below the poverty level (%) - Other Race
Air pollution - Air Quality Index (AQI)
Air pollution - CO
Air pollution - NO2
Air pollution - SO2
Air pollution - Ozone
Air pollution - PM10
Air pollution - PM25
Air pollution - Pb
Crime - Murders per 100,000 population
Crime - Rapes per 100,000 population
Crime - Robberies per 100,000 population
Crime - Assaults per 100,000 population
Crime - Burglaries per 100,000 population
Crime - Thefts per 100,000 population
Crime - Auto thefts per 100,000 population
Crime - Arson per 100,000 population
Crime - City-data.com crime index
Crime - Violent crime index
Crime - Property crime index
Crime - Murders per 100,000 population (5 year average)
Crime - Rapes per 100,000 population (5 year average)
Crime - Robberies per 100,000 population (5 year average)
Crime - Assaults per 100,000 population (5 year average)
Crime - Burglaries per 100,000 population (5 year average)
Crime - Thefts per 100,000 population (5 year average)
Crime - Auto thefts per 100,000 population (5 year average)
Crime - Arson per 100,000 population (5 year average)
Crime - City-data.com crime index (5 year average)
Crime - Violent crime index (5 year average)
Crime - Property crime index (5 year average)
1996 Presidential Elections Results (%) - Democratic Party (Clinton)
1996 Presidential Elections Results (%) - Republican Party (Dole)
1996 Presidential Elections Results (%) - Other
2000 Presidential Elections Results (%) - Democratic Party (Gore)
2000 Presidential Elections Results (%) - Republican Party (Bush)
2000 Presidential Elections Results (%) - Other
2004 Presidential Elections Results (%) - Democratic Party (Kerry)
2004 Presidential Elections Results (%) - Republican Party (Bush)
2004 Presidential Elections Results (%) - Other
2008 Presidential Elections Results (%) - Democratic Party (Obama)
2008 Presidential Elections Results (%) - Republican Party (McCain)
2008 Presidential Elections Results (%) - Other
2012 Presidential Elections Results (%) - Democratic Party (Obama)
2012 Presidential Elections Results (%) - Republican Party (Romney)
2012 Presidential Elections Results (%) - Other
2016 Presidential Elections Results (%) - Democratic Party (Clinton)
2016 Presidential Elections Results (%) - Republican Party (Trump)
2016 Presidential Elections Results (%) - Other
2020 Presidential Elections Results (%) - Democratic Party (Biden)
2020 Presidential Elections Results (%) - Republican Party (Trump)
2020 Presidential Elections Results (%) - Other
Ancestries Reported - Arab (%)
Ancestries Reported - Czech (%)
Ancestries Reported - Danish (%)
Ancestries Reported - Dutch (%)
Ancestries Reported - English (%)
Ancestries Reported - French (%)
Ancestries Reported - French Canadian (%)
Ancestries Reported - German (%)
Ancestries Reported - Greek (%)
Ancestries Reported - Hungarian (%)
Ancestries Reported - Irish (%)
Ancestries Reported - Italian (%)
Ancestries Reported - Lithuanian (%)
Ancestries Reported - Norwegian (%)
Ancestries Reported - Polish (%)
Ancestries Reported - Portuguese (%)
Ancestries Reported - Russian (%)
Ancestries Reported - Scotch-Irish (%)
Ancestries Reported - Scottish (%)
Ancestries Reported - Slovak (%)
Ancestries Reported - Subsaharan African (%)
Ancestries Reported - Swedish (%)
Ancestries Reported - Swiss (%)
Ancestries Reported - Ukrainian (%)
Ancestries Reported - United States (%)
Ancestries Reported - Welsh (%)
Ancestries Reported - West Indian (%)
Ancestries Reported - Other (%)
Educational Attainment - No schooling completed (%)
Educational Attainment - Less than high school (%)
Educational Attainment - High school or equivalent (%)
Educational Attainment - Less than 1 year of college (%)
Educational Attainment - 1 or more years of college (%)
Educational Attainment - Associate degree (%)
Educational Attainment - Bachelor's degree (%)
Educational Attainment - Master's degree (%)
Educational Attainment - Professional school degree (%)
Educational Attainment - Doctorate degree (%)
School Enrollment - Nursery, preschool (%)
School Enrollment - Kindergarten (%)
School Enrollment - Grade 1 to 4 (%)
School Enrollment - Grade 5 to 8 (%)
School Enrollment - Grade 9 to 12 (%)
School Enrollment - College undergrad (%)
School Enrollment - Graduate or professional (%)
School Enrollment - Not enrolled in school (%)
School enrollment - Public schools (%)
School enrollment - Private schools (%)
School enrollment - Not enrolled (%)
Median number of rooms in houses and condos
Median number of rooms in apartments
Housing units lacking complete plumbing facilities (%)
Housing units lacking complete kitchen facilities (%)
Density of houses
Urban houses (%)
Rural houses (%)
Households with people 60 years and over (%)
Households with people 65 years and over (%)
Households with people 75 years and over (%)
Households with one or more nonrelatives (%)
Households with no nonrelatives (%)
Population in households (%)
Family households (%)
Nonfamily households (%)
Population in families (%)
Family households with own children (%)
Median number of bedrooms in owner occupied houses
Mean number of bedrooms in owner occupied houses
Median number of bedrooms in renter occupied houses
Mean number of bedrooms in renter occupied houses
Median number of vehichles in owner occupied houses
Mean number of vehichles in owner occupied houses
Median number of vehichles in renter occupied houses
Mean number of vehichles in renter occupied houses
Mortgage status - with mortgage (%)
Mortgage status - with second mortgage (%)
Mortgage status - with home equity loan (%)
Mortgage status - with both second mortgage and home equity loan (%)
Mortgage status - without a mortgage (%)
Average family size
Average family size - White
Average family size - Black or African American
Average family size - Asian
Average family size - Hispanic or Latino
Average family size - American Indian and Alaska Native
Average family size - Multirace
Average family size - Other Race
Geographical mobility - Same house 1 year ago (%)
Geographical mobility - Moved within same county (%)
Geographical mobility - Moved from different county within same state (%)
Geographical mobility - Moved from different state (%)
Geographical mobility - Moved from abroad (%)
Place of birth - Born in state of residence (%)
Place of birth - Born in other state (%)
Place of birth - Native, outside of US (%)
Place of birth - Foreign born (%)
Housing units in structures - 1, detached (%)
Housing units in structures - 1, attached (%)
Housing units in structures - 2 (%)
Housing units in structures - 3 or 4 (%)
Housing units in structures - 5 to 9 (%)
Housing units in structures - 10 to 19 (%)
Housing units in structures - 20 to 49 (%)
Housing units in structures - 50 or more (%)
Housing units in structures - Mobile home (%)
Housing units in structures - Boat, RV, van, etc. (%)
House/condo owner moved in on average (years ago)
Renter moved in on average (years ago)
Year householder moved into unit - Moved in 1999 to March 2000 (%)
Year householder moved into unit - Moved in 1995 to 1998 (%)
Year householder moved into unit - Moved in 1990 to 1994 (%)
Year householder moved into unit - Moved in 1980 to 1989 (%)
Year householder moved into unit - Moved in 1970 to 1979 (%)
Year householder moved into unit - Moved in 1969 or earlier (%)
Means of transportation to work - Drove car alone (%)
Means of transportation to work - Carpooled (%)
Means of transportation to work - Public transportation (%)
Means of transportation to work - Bus or trolley bus (%)
Means of transportation to work - Streetcar or trolley car (%)
Means of transportation to work - Subway or elevated (%)
Means of transportation to work - Railroad (%)
Means of transportation to work - Ferryboat (%)
Means of transportation to work - Taxicab (%)
Means of transportation to work - Motorcycle (%)
Means of transportation to work - Bicycle (%)
Means of transportation to work - Walked (%)
Means of transportation to work - Other means (%)
Working at home (%)
Industry diversity
Most Common Industries - Agriculture, forestry, fishing and hunting, and mining (%)
Most Common Industries - Agriculture, forestry, fishing and hunting (%)
Most Common Industries - Mining, quarrying, and oil and gas extraction (%)
Most Common Industries - Construction (%)
Most Common Industries - Manufacturing (%)
Most Common Industries - Wholesale trade (%)
Most Common Industries - Retail trade (%)
Most Common Industries - Transportation and warehousing, and utilities (%)
Most Common Industries - Transportation and warehousing (%)
Most Common Industries - Utilities (%)
Most Common Industries - Information (%)
Most Common Industries - Finance and insurance, and real estate and rental and leasing (%)
Most Common Industries - Finance and insurance (%)
Most Common Industries - Real estate and rental and leasing (%)
Most Common Industries - Professional, scientific, and management, and administrative and waste management services (%)
Most Common Industries - Professional, scientific, and technical services (%)
Most Common Industries - Management of companies and enterprises (%)
Most Common Industries - Administrative and support and waste management services (%)
Most Common Industries - Educational services, and health care and social assistance (%)
Most Common Industries - Educational services (%)
Most Common Industries - Health care and social assistance (%)
Most Common Industries - Arts, entertainment, and recreation, and accommodation and food services (%)
Most Common Industries - Arts, entertainment, and recreation (%)
Most Common Industries - Accommodation and food services (%)
Most Common Industries - Other services, except public administration (%)
Most Common Industries - Public administration (%)
Occupation diversity
Most Common Occupations - Management, business, science, and arts occupations (%)
Most Common Occupations - Management, business, and financial occupations (%)
Most Common Occupations - Management occupations (%)
Most Common Occupations - Business and financial operations occupations (%)
Most Common Occupations - Computer, engineering, and science occupations (%)
Most Common Occupations - Computer and mathematical occupations (%)
Most Common Occupations - Architecture and engineering occupations (%)
Most Common Occupations - Life, physical, and social science occupations (%)
Most Common Occupations - Education, legal, community service, arts, and media occupations (%)
Most Common Occupations - Community and social service occupations (%)
Most Common Occupations - Legal occupations (%)
Most Common Occupations - Education, training, and library occupations (%)
Most Common Occupations - Arts, design, entertainment, sports, and media occupations (%)
Most Common Occupations - Healthcare practitioners and technical occupations (%)
Most Common Occupations - Health diagnosing and treating practitioners and other technical occupations (%)
Most Common Occupations - Health technologists and technicians (%)
Most Common Occupations - Service occupations (%)
Most Common Occupations - Healthcare support occupations (%)
Most Common Occupations - Protective service occupations (%)
Most Common Occupations - Fire fighting and prevention, and other protective service workers including supervisors (%)
Most Common Occupations - Law enforcement workers including supervisors (%)
Most Common Occupations - Food preparation and serving related occupations (%)
Most Common Occupations - Building and grounds cleaning and maintenance occupations (%)
Most Common Occupations - Personal care and service occupations (%)
Most Common Occupations - Sales and office occupations (%)
Most Common Occupations - Sales and related occupations (%)
Most Common Occupations - Office and administrative support occupations (%)
Most Common Occupations - Natural resources, construction, and maintenance occupations (%)
Most Common Occupations - Farming, fishing, and forestry occupations (%)
Most Common Occupations - Construction and extraction occupations (%)
Most Common Occupations - Installation, maintenance, and repair occupations (%)
Most Common Occupations - Production, transportation, and material moving occupations (%)
Most Common Occupations - Production occupations (%)
Most Common Occupations - Transportation occupations (%)
Most Common Occupations - Material moving occupations (%)
People in Group quarters - Institutionalized population (%)
People in Group quarters - Correctional institutions (%)
People in Group quarters - Federal prisons and detention centers (%)
People in Group quarters - Halfway houses (%)
People in Group quarters - Local jails and other confinement facilities (including police lockups) (%)
People in Group quarters - Military disciplinary barracks (%)
People in Group quarters - State prisons (%)
People in Group quarters - Other types of correctional institutions (%)
People in Group quarters - Nursing homes (%)
People in Group quarters - Hospitals/wards, hospices, and schools for the handicapped (%)
People in Group quarters - Hospitals/wards and hospices for chronically ill (%)
People in Group quarters - Hospices or homes for chronically ill (%)
People in Group quarters - Military hospitals or wards for chronically ill (%)
People in Group quarters - Other hospitals or wards for chronically ill (%)
People in Group quarters - Hospitals or wards for drug/alcohol abuse (%)
People in Group quarters - Mental (Psychiatric) hospitals or wards (%)
People in Group quarters - Schools, hospitals, or wards for the mentally retarded (%)
People in Group quarters - Schools, hospitals, or wards for the physically handicapped (%)
People in Group quarters - Institutions for the deaf (%)
People in Group quarters - Institutions for the blind (%)
People in Group quarters - Orthopedic wards and institutions for the physically handicapped (%)
People in Group quarters - Wards in general hospitals for patients who have no usual home elsewhere (%)
People in Group quarters - Wards in military hospitals for patients who have no usual home elsewhere (%)
People in Group quarters - Juvenile institutions (%)
People in Group quarters - Long-term care (%)
People in Group quarters - Homes for abused, dependent, and neglected children (%)
People in Group quarters - Residential treatment centers for emotionally disturbed children (%)
People in Group quarters - Training schools for juvenile delinquents (%)
People in Group quarters - Short-term care, detention or diagnostic centers for delinquent children (%)
People in Group quarters - Type of juvenile institution unknown (%)
People in Group quarters - Noninstitutionalized population (%)
People in Group quarters - College dormitories (includes college quarters off campus) (%)
People in Group quarters - Military quarters (%)
People in Group quarters - On base (%)
People in Group quarters - Barracks, unaccompanied personnel housing (UPH), (Enlisted/Officer), ;and similar group living quarters for military personnel (%)
People in Group quarters - Transient quarters for temporary residents (%)
People in Group quarters - Military ships (%)
People in Group quarters - Group homes (%)
People in Group quarters - Homes or halfway houses for drug/alcohol abuse (%)
People in Group quarters - Homes for the mentally ill (%)
People in Group quarters - Homes for the mentally retarded (%)
People in Group quarters - Homes for the physically handicapped (%)
People in Group quarters - Other group homes (%)
People in Group quarters - Religious group quarters (%)
People in Group quarters - Dormitories (%)
People in Group quarters - Agriculture workers' dormitories on farms (%)
People in Group quarters - Job Corps and vocational training facilities (%)
People in Group quarters - Other workers' dormitories (%)
People in Group quarters - Crews of maritime vessels (%)
People in Group quarters - Other nonhousehold living situations (%)
People in Group quarters - Other noninstitutional group quarters (%)
Residents speaking English at home (%)
Residents speaking English at home - Born in the United States (%)
Residents speaking English at home - Native, born elsewhere (%)
Residents speaking English at home - Foreign born (%)
Residents speaking Spanish at home (%)
Residents speaking Spanish at home - Born in the United States (%)
Residents speaking Spanish at home - Native, born elsewhere (%)
Residents speaking Spanish at home - Foreign born (%)
Residents speaking other language at home (%)
Residents speaking other language at home - Born in the United States (%)
Residents speaking other language at home - Native, born elsewhere (%)
Residents speaking other language at home - Foreign born (%)
Class of Workers - Employee of private company (%)
Class of Workers - Self-employed in own incorporated business (%)
Class of Workers - Private not-for-profit wage and salary workers (%)
Class of Workers - Local government workers (%)
Class of Workers - State government workers (%)
Class of Workers - Federal government workers (%)
Class of Workers - Self-employed workers in own not incorporated business and Unpaid family workers (%)
House heating fuel used in houses and condos - Utility gas (%)
House heating fuel used in houses and condos - Bottled, tank, or LP gas (%)
House heating fuel used in houses and condos - Electricity (%)
House heating fuel used in houses and condos - Fuel oil, kerosene, etc. (%)
House heating fuel used in houses and condos - Coal or coke (%)
House heating fuel used in houses and condos - Wood (%)
House heating fuel used in houses and condos - Solar energy (%)
House heating fuel used in houses and condos - Other fuel (%)
House heating fuel used in houses and condos - No fuel used (%)
House heating fuel used in apartments - Utility gas (%)
House heating fuel used in apartments - Bottled, tank, or LP gas (%)
House heating fuel used in apartments - Electricity (%)
House heating fuel used in apartments - Fuel oil, kerosene, etc. (%)
House heating fuel used in apartments - Coal or coke (%)
House heating fuel used in apartments - Wood (%)
House heating fuel used in apartments - Solar energy (%)
House heating fuel used in apartments - Other fuel (%)
House heating fuel used in apartments - No fuel used (%)
Armed forces status - In Armed Forces (%)
Armed forces status - Civilian (%)
Armed forces status - Civilian - Veteran (%)
Armed forces status - Civilian - Nonveteran (%)
Fatal accidents locations in years 2005-2021
Fatal accidents locations in 2005
Fatal accidents locations in 2006
Fatal accidents locations in 2007
Fatal accidents locations in 2008
Fatal accidents locations in 2009
Fatal accidents locations in 2010
Fatal accidents locations in 2011
Fatal accidents locations in 2012
Fatal accidents locations in 2013
Fatal accidents locations in 2014
Fatal accidents locations in 2015
Fatal accidents locations in 2016
Fatal accidents locations in 2017
Fatal accidents locations in 2018
Fatal accidents locations in 2019
Fatal accidents locations in 2020
Fatal accidents locations in 2021
Alcohol use - People drinking some alcohol every month (%)
Alcohol use - People not drinking at all (%)
Alcohol use - Average days/month drinking alcohol
Alcohol use - Average drinks/week
Alcohol use - Average days/year people drink much
Audiometry - Average condition of hearing (%)
Audiometry - People that can hear a whisper from across a quiet room (%)
Audiometry - People that can hear normal voice from across a quiet room (%)
Audiometry - Ears ringing, roaring, buzzing (%)
Audiometry - Had a job exposure to loud noise (%)
Audiometry - Had off-work exposure to loud noise (%)
Blood Pressure & Cholesterol - Has high blood pressure (%)
Blood Pressure & Cholesterol - Checking blood pressure at home (%)
Blood Pressure & Cholesterol - Frequently checking blood cholesterol (%)
Blood Pressure & Cholesterol - Has high cholesterol level (%)
Consumer Behavior - Money monthly spent on food at supermarket/grocery store
Consumer Behavior - Money monthly spent on food at other stores
Consumer Behavior - Money monthly spent on eating out
Consumer Behavior - Money monthly spent on carryout/delivered foods
Consumer Behavior - Income spent on food at supermarket/grocery store (%)
Consumer Behavior - Income spent on food at other stores (%)
Consumer Behavior - Income spent on eating out (%)
Consumer Behavior - Income spent on carryout/delivered foods (%)
Current Health Status - General health condition (%)
Current Health Status - Blood donors (%)
Current Health Status - Has blood ever tested for HIV virus (%)
Current Health Status - Left-handed people (%)
Dermatology - People using sunscreen (%)
Diabetes - Diabetics (%)
Diabetes - Had a blood test for high blood sugar (%)
Diabetes - People taking insulin (%)
Diet Behavior & Nutrition - Diet health (%)
Diet Behavior & Nutrition - Milk product consumption (# of products/month)
Diet Behavior & Nutrition - Meals not home prepared (#/week)
Diet Behavior & Nutrition - Meals from fast food or pizza place (#/week)
Diet Behavior & Nutrition - Ready-to-eat foods (#/month)
Diet Behavior & Nutrition - Frozen meals/pizza (#/month)
Drug Use - People that ever used marijuana or hashish (%)
Drug Use - Ever used hard drugs (%)
Drug Use - Ever used any form of cocaine (%)
Drug Use - Ever used heroin (%)
Drug Use - Ever used methamphetamine (%)
Health Insurance - People covered by health insurance (%)
Kidney Conditions-Urology - Avg. # of times urinating at night
Medical Conditions - People with asthma (%)
Medical Conditions - People with anemia (%)
Medical Conditions - People with psoriasis (%)
Medical Conditions - People with overweight (%)
Medical Conditions - Elderly people having difficulties in thinking or remembering (%)
Medical Conditions - People who ever received blood transfusion (%)
Medical Conditions - People having trouble seeing even with glass/contacts (%)
Medical Conditions - People with arthritis (%)
Medical Conditions - People with gout (%)
Medical Conditions - People with congestive heart failure (%)
Medical Conditions - People with coronary heart disease (%)
Medical Conditions - People with angina pectoris (%)
Medical Conditions - People who ever had heart attack (%)
Medical Conditions - People who ever had stroke (%)
Medical Conditions - People with emphysema (%)
Medical Conditions - People with thyroid problem (%)
Medical Conditions - People with chronic bronchitis (%)
Medical Conditions - People with any liver condition (%)
Medical Conditions - People who ever had cancer or malignancy (%)
Mental Health - People who have little interest in doing things (%)
Mental Health - People feeling down, depressed, or hopeless (%)
Mental Health - People who have trouble sleeping or sleeping too much (%)
Mental Health - People feeling tired or having little energy (%)
Mental Health - People with poor appetite or overeating (%)
Mental Health - People feeling bad about themself (%)
Mental Health - People who have trouble concentrating on things (%)
Mental Health - People moving or speaking slowly or too fast (%)
Mental Health - People having thoughts they would be better off dead (%)
Oral Health - Average years since last visit a dentist
Oral Health - People embarrassed because of mouth (%)
Oral Health - People with gum disease (%)
Oral Health - General health of teeth and gums (%)
Oral Health - Average days a week using dental floss/device
Oral Health - Average days a week using mouthwash for dental problem
Oral Health - Average number of teeth
Pesticide Use - Households using pesticides to control insects (%)
Pesticide Use - Households using pesticides to kill weeds (%)
Physical Activity - People doing vigorous-intensity work activities (%)
Physical Activity - People doing moderate-intensity work activities (%)
Physical Activity - People walking or bicycling (%)
Physical Activity - People doing vigorous-intensity recreational activities (%)
Physical Activity - People doing moderate-intensity recreational activities (%)
Physical Activity - Average hours a day doing sedentary activities
Physical Activity - Average hours a day watching TV or videos
Physical Activity - Average hours a day using computer
Physical Functioning - People having limitations keeping them from working (%)
Physical Functioning - People limited in amount of work they can do (%)
Physical Functioning - People that need special equipment to walk (%)
Physical Functioning - People experiencing confusion/memory problems (%)
Physical Functioning - People requiring special healthcare equipment (%)
Prescription Medications - Average number of prescription medicines taking
Preventive Aspirin Use - Adults 40+ taking low-dose aspirin (%)
Reproductive Health - Vaginal deliveries (%)
Reproductive Health - Cesarean deliveries (%)
Reproductive Health - Deliveries resulted in a live birth (%)
Reproductive Health - Pregnancies resulted in a delivery (%)
Reproductive Health - Women breastfeeding newborns (%)
Reproductive Health - Women that had a hysterectomy (%)
Reproductive Health - Women that had both ovaries removed (%)
Reproductive Health - Women that have ever taken birth control pills (%)
Reproductive Health - Women taking birth control pills (%)
Reproductive Health - Women that have ever used Depo-Provera or injectables (%)
Reproductive Health - Women that have ever used female hormones (%)
Sexual Behavior - People 18+ that ever had sex (vaginal, anal, or oral) (%)
Sexual Behavior - Males 18+ that ever had vaginal sex with a woman (%)
Sexual Behavior - Males 18+ that ever performed oral sex on a woman (%)
Sexual Behavior - Males 18+ that ever had anal sex with a woman (%)
Sexual Behavior - Males 18+ that ever had any sex with a man (%)
Sexual Behavior - Females 18+ that ever had vaginal sex with a man (%)
Sexual Behavior - Females 18+ that ever performed oral sex on a man (%)
Sexual Behavior - Females 18+ that ever had anal sex with a man (%)
Sexual Behavior - Females 18+ that ever had any kind of sex with a woman (%)
Sexual Behavior - Average age people first had sex
Sexual Behavior - Average number of female sex partners in lifetime (males 18+)
Sexual Behavior - Average number of female vaginal sex partners in lifetime (males 18+)
Sexual Behavior - Average age people first performed oral sex on a woman (18+)
Sexual Behavior - Average number of woman performed oral sex on in lifetime (18+)
Sexual Behavior - Average number of male sex partners in lifetime (males 18+)
Sexual Behavior - Average number of male anal sex partners in lifetime (males 18+)
Sexual Behavior - Average age people first performed oral sex on a man (18+)
Sexual Behavior - Average number of male oral sex partners in lifetime (18+)
Sexual Behavior - People using protection when performing oral sex (%)
Sexual Behavior - Average number of times people have vaginal or anal sex a year
Sexual Behavior - People having sex without condom (%)
Sexual Behavior - Average number of male sex partners in lifetime (females 18+)
Sexual Behavior - Average number of male vaginal sex partners in lifetime (females 18+)
Sexual Behavior - Average number of female sex partners in lifetime (females 18+)
Sexual Behavior - Circumcised males 18+ (%)
Sleep Disorders - Average hours sleeping at night
Sleep Disorders - People that has trouble sleeping (%)
Smoking-Cigarette Use - People smoking cigarettes (%)
Taste & Smell - People 40+ having problems with smell (%)
Taste & Smell - People 40+ having problems with taste (%)
Taste & Smell - People 40+ that ever had wisdom teeth removed (%)
Taste & Smell - People 40+ that ever had tonsils teeth removed (%)
Taste & Smell - People 40+ that ever had a loss of consciousness because of a head injury (%)
Taste & Smell - People 40+ that ever had a broken nose or other serious injury to face or skull (%)
Taste & Smell - People 40+ that ever had two or more sinus infections (%)
Weight - Average height (inches)
Weight - Average weight (pounds)
Weight - Average BMI
Weight - People that are obese (%)
Weight - People that ever were obese (%)
Weight - People trying to lose weight (%)
Urban population: 30,464
Rural population: 1
Estimated median house/condo value in 2022: $257,653
49024:
$257,653Michigan:
$224,400
According to our research of Michigan and other state lists, there were 33 registered sex offenders living in 49024 zip code as of June 10, 2024 . The ratio of all residents to sex offenders in zip code 49024 is 881 to 1.The ratio of registered sex offenders to all residents in this zip code is much lower than the state average.
Median resident age: This zip code:
36.5 yearsMichigan median age:
40.3 years
Average household size: This zip code:
2.4 peopleMichigan:
2.4 people
Averages for the 2020 tax year for zip code 49024, filed in 2021:
Average Adjusted Gross Income (AGI) in 2020: $80,215 (Individual Income Tax Returns) Here:
$80,215State:
$68,945
Salary/wage: $69,374 (reported on 80.2% of returns )Here:
$69,374State:
$57,142
(% of AGI for various income ranges: 1048.8% for AGIs below $25k , 3359.7% for AGIs $25k-50k , 6031.6% for AGIs $50k-75k , 9161.1% for AGIs $75k-100k , 17148.0% for AGIs $100k-200k , 70551.2% for AGIs over 200k ) Taxable interest for individuals: $1,138 (reported on 40.2% of returns )This zip code:
$1,138Michigan:
$1,630
(% of AGI for various income ranges: 19.0% for AGIs below $25k , 19.9% for AGIs $25k-50k , 32.4% for AGIs $50k-75k , 59.7% for AGIs $75k-100k , 125.2% for AGIs $100k-200k , 773.8% for AGIs over 200k ) Ordinary dividends: $6,219 (reported on 26.7% of returns )(% of AGI for various income ranges: 43.5% for AGIs below $25k , 49.0% for AGIs $25k-50k , 103.8% for AGIs $50k-75k , 186.4% for AGIs $75k-100k , 424.9% for AGIs $100k-200k , 3520.0% for AGIs over 200k ) Net capital gain/loss in AGI: +$15,413 (reported on 24.4% of returns )Here:
+$15,413State:
+$20,064
(% of AGI for various income ranges: 21.8% for AGIs below $25k , 30.4% for AGIs $25k-50k , 99.2% for AGIs $50k-75k , 209.3% for AGIs $75k-100k , 557.6% for AGIs $100k-200k , 12602.6% for AGIs over 200k ) Profit/loss from business: +$16,263 (reported on 13.8% of returns )Here:
+$16,263State:
+$11,172
(% of AGI for various income ranges: 75.1% for AGIs below $25k , 118.9% for AGIs $25k-50k , 175.7% for AGIs $50k-75k , 254.6% for AGIs $75k-100k , 632.4% for AGIs $100k-200k , 3745.9% for AGIs over 200k ) Taxable individual retirement arrangement distribution: $22,799 (reported on 13.3% of returns )49024:
$22,799Michigan:
$19,803
(% of AGI for various income ranges: 105.1% for AGIs below $25k , 190.1% for AGIs $25k-50k , 342.6% for AGIs $50k-75k , 561.0% for AGIs $75k-100k , 1030.7% for AGIs $100k-200k , 2647.1% for AGIs over 200k ) Self-employed (Keogh) retirement plans: $23,391 (reported on 0.7% of returns )49024:
$23,391Michigan:
$25,132
(% of AGI for various income ranges: 7.3% for AGIs $25k-50k , 39.8% for AGIs $100k-200k , 510.3% for AGIs over 200k ) Total itemized deductions: $33,522 (reported on 7.4% of returns )Here:
$33,522State:
$34,117
(% of AGI for various income ranges: 77.1% for AGIs below $25k , 98.6% for AGIs $25k-50k , 211.1% for AGIs $50k-75k , 339.1% for AGIs $75k-100k , 660.4% for AGIs $100k-200k , 4331.5% for AGIs over 200k ) Charity contributions: $13,720 (reported on 6.0% of returns )Here:
$13,720State:
$13,548
(% of AGI for various income ranges: 5.5% for AGIs below $25k , 16.2% for AGIs $25k-50k , 29.7% for AGIs $50k-75k , 57.5% for AGIs $75k-100k , 214.1% for AGIs $100k-200k , 2128.5% for AGIs over 200k ) Taxes paid: $7,843 (reported on 7.3% of returns )(% of AGI for various income ranges: 7.6% for AGIs below $25k , 17.5% for AGIs $25k-50k , 52.5% for AGIs $50k-75k , 93.0% for AGIs $75k-100k , 198.1% for AGIs $100k-200k , 848.5% for AGIs over 200k ) Earned income credit: $1,915 (reported on 9.0% of returns )(% of AGI for various income ranges: 52.5% for AGIs below $25k , 43.8% for AGIs $25k-50k ) Percentage of individuals using paid preparers for their 2020 taxes: 93.7%(% for various income ranges: 92.1% for AGIs below $25k , 94.6% for AGIs $25k-50k , 94.1% for AGIs $50k-75k , 92.8% for AGIs $75k-100k , 94.9% for AGIs $100k-200k , 94.7% for AGIs over 200k )
Averages for the 2012 tax year for zip code 49024, filed in 2013:
Average Adjusted Gross Income (AGI) in 2012: $69,436 (Individual Income Tax Returns) Here:
$69,436State:
$55,609
Salary/wage: $59,729 (reported on 82.8% of returns )Here:
$59,729State:
$46,782
(% of AGI for various income ranges: 70.5% for AGIs below $25k , 77.0% for AGIs $25k-50k , 76.4% for AGIs $50k-75k , 76.3% for AGIs $75k-100k , 78.7% for AGIs $100k-200k , 58.0% for AGIs over 200k ) Taxable interest for individuals: $1,127 (reported on 40.3% of returns )This zip code:
$1,127Michigan:
$1,491
(% of AGI for various income ranges: 1.3% for AGIs below $25k , 0.6% for AGIs $25k-50k , 0.5% for AGIs $50k-75k , 0.5% for AGIs $75k-100k , 0.6% for AGIs $100k-200k , 0.7% for AGIs over 200k ) Ordinary dividends: $6,150 (reported on 27.0% of returns )(% of AGI for various income ranges: 2.4% for AGIs below $25k , 1.5% for AGIs $25k-50k , 1.4% for AGIs $50k-75k , 1.3% for AGIs $75k-100k , 1.7% for AGIs $100k-200k , 4.3% for AGIs over 200k ) Net capital gain/loss in AGI: +$10,233 (reported on 21.4% of returns )Here:
+$10,233State:
+$9,326
(% of AGI for various income ranges: 0.2% for AGIs $25k-50k , 0.4% for AGIs $50k-75k , 0.7% for AGIs $75k-100k , 1.2% for AGIs $100k-200k , 9.0% for AGIs over 200k ) Profit/loss from business: +$15,820 (reported on 14.2% of returns )Here:
+$15,820State:
+$11,523
(% of AGI for various income ranges: 6.5% for AGIs below $25k , 2.9% for AGIs $25k-50k , 2.4% for AGIs $50k-75k , 2.3% for AGIs $75k-100k , 3.3% for AGIs $100k-200k , 3.5% for AGIs over 200k ) Taxable individual retirement arrangement distribution: $21,605 (reported on 14.2% of returns )49024:
$21,605Michigan:
$15,298
(% of AGI for various income ranges: 5.7% for AGIs below $25k , 4.4% for AGIs $25k-50k , 4.6% for AGIs $50k-75k , 5.2% for AGIs $75k-100k , 4.7% for AGIs $100k-200k , 3.4% for AGIs over 200k ) Self-employment retirement plans: $17,064 (reported on 0.8% of returns )49024:
$17,064Michigan:
$20,834
(% of AGI for various income ranges: 0.2% for AGIs $50k-75k , 0.2% for AGIs $100k-200k , 0.4% for AGIs over 200k ) Total itemized deductions: $22,354 (17% of AGI, reported on 36.8% of returns )Here:
$22,354State:
$21,628
Here:
16.9% of AGIState:
18.4% of AGI
(% of AGI for various income ranges: 8.4% for AGIs below $25k , 9.5% for AGIs $25k-50k , 11.5% for AGIs $50k-75k , 12.2% for AGIs $75k-100k , 13.3% for AGIs $100k-200k , 12.0% for AGIs over 200k ) Charity contributions: $4,195 (reported on 31.3% of returns )(% of AGI for various income ranges: 0.8% for AGIs below $25k , 1.2% for AGIs $25k-50k , 1.6% for AGIs $50k-75k , 1.9% for AGIs $75k-100k , 2.5% for AGIs $100k-200k , 1.9% for AGIs over 200k ) Taxes paid: $9,220 (reported on 36.7% of returns )(% of AGI for various income ranges: 1.9% for AGIs below $25k , 2.8% for AGIs $25k-50k , 3.8% for AGIs $50k-75k , 4.7% for AGIs $75k-100k , 5.9% for AGIs $100k-200k , 5.8% for AGIs over 200k ) Earned income credit: $1,973 (reported on 11.5% of returns )(% of AGI for various income ranges: 4.2% for AGIs below $25k , 0.8% for AGIs $25k-50k ) Percentage of individuals using paid preparers for their 2012 taxes: 47.7%(% for various income ranges: 43.4% for AGIs below $25k , 45.4% for AGIs $25k-50k , 50.0% for AGIs $50k-75k , 49.4% for AGIs $75k-100k , 50.8% for AGIs $100k-200k , 72.1% for AGIs over 200k )
Averages for the 2004 tax year for zip code 49024, filed in 2005:
Average Adjusted Gross Income (AGI) in 2004: $59,400 (Individual Income Tax Returns) Here:
$59,400State:
$48,204
Salary/wage: $55,449 (reported on 84.9% of returns )Here:
$55,449State:
$42,791
(% of AGI for various income ranges: 109.7% for AGIs below $10k , 70.5% for AGIs $10k-25k , 78.8% for AGIs $25k-50k , 82.4% for AGIs $50k-75k , 83.0% for AGIs $75k-100k , 77.4% for AGIs over 100k ) Taxable interest for individuals: $1,415 (reported on 52.9% of returns )This zip code:
$1,415Michigan:
$1,725
(% of AGI for various income ranges: 6.0% for AGIs below $10k , 2.5% for AGIs $10k-25k , 1.4% for AGIs $25k-50k , 1.0% for AGIs $50k-75k , 0.9% for AGIs $75k-100k , 1.2% for AGIs over 100k ) Taxable dividends: $3,039 (reported on 33.6% of returns )(% of AGI for various income ranges: 6.4% for AGIs below $10k , 2.4% for AGIs $10k-25k , 1.5% for AGIs $25k-50k , 1.0% for AGIs $50k-75k , 1.0% for AGIs $75k-100k , 2.0% for AGIs over 100k ) Net capital gain/loss: +$6,592 (reported on 26.8% of returns )Here:
+$6,592State:
+$8,532
(% of AGI for various income ranges: -4.1% for AGIs below $10k , 0.5% for AGIs $10k-25k , 0.5% for AGIs $25k-50k , 0.8% for AGIs $50k-75k , 1.5% for AGIs $75k-100k , 5.1% for AGIs over 100k ) Profit/loss from business: +$14,069 (reported on 13.7% of returns )Here:
+$14,069State:
+$9,547
(% of AGI for various income ranges: 5.9% for AGIs below $10k , 4.4% for AGIs $10k-25k , 2.8% for AGIs $25k-50k , 2.6% for AGIs $50k-75k , 3.3% for AGIs $75k-100k , 3.3% for AGIs over 100k ) IRA payment deduction: $2,740 (reported on 2.5% of returns )49024:
$2,740Michigan:
$2,875
(% of AGI for various income ranges: 0.3% for AGIs below $10k , 0.2% for AGIs $10k-25k , 0.3% for AGIs $25k-50k , 0.1% for AGIs $50k-75k , 0.1% for AGIs $75k-100k , 0.1% for AGIs over 100k ) Self-employed pension: $12,463 (reported on 1.2% of returns )Here:
$12,463Michigan:
$13,826
(% of AGI for various income ranges: 0.1% for AGIs $25k-50k , 0.1% for AGIs $50k-75k , 0.3% for AGIs $75k-100k , 0.4% for AGIs over 100k ) Total itemized deductions: $19,044 (18% of AGI, reported on 42.0% of returns )Here:
$19,044State:
$18,509
Here:
17.7% of AGIState:
20.7% of AGI
(% of AGI for various income ranges: 13.6% for AGIs below $10k , 10.5% for AGIs $10k-25k , 15.9% for AGIs $25k-50k , 14.7% for AGIs $50k-75k , 15.9% for AGIs $75k-100k , 12.1% for AGIs over 100k ) Charity contributions deductions: $3,813 (3% of AGI, reported on 37.9% of returns )Here:
3.4% of AGIState:
3.6% of AGI
(% of AGI for various income ranges: 0.8% for AGIs below $10k , 1.2% for AGIs $10k-25k , 1.7% for AGIs $25k-50k , 2.1% for AGIs $50k-75k , 2.6% for AGIs $75k-100k , 2.9% for AGIs over 100k ) Total tax: $10,680 (reported on 78.6% of returns )49024:
$10,680State:
$7,691
(% of AGI for various income ranges: 3.0% for AGIs below $10k , 4.4% for AGIs $10k-25k , 7.4% for AGIs $25k-50k , 8.8% for AGIs $50k-75k , 10.1% for AGIs $75k-100k , 20.0% for AGIs over 100k ) Earned income credit: $1,555 (reported on 8.9% of returns )Percentage of individuals using paid preparers for their 2004 taxes: 51.1%(% for various income ranges: 44.0% for AGIs below $10k , 53.0% for AGIs $10k-25k , 51.2% for AGIs $25k-50k , 51.7% for AGIs $50k-75k , 51.1% for AGIs $75k-100k , 58.3% for AGIs over 100k )
Estimated median household income in 2022: This zip code:
$76,922Michigan:
$66,986
Nearest zip codes: 49002 ,
49008 ,
49001 ,
49006 ,
49007 ,
49087 .
Portage Zip Code Map
Percentage of family households: This zip code:
47.6%Michigan:
43.3%
Percentage of households with unmarried partners: This zip code:
6.1%Michigan:
45.7%
Likely homosexual households (counted as self-reported same-sex unmarried-partner households)
Lesbian couples: 0.4% of all households Gay men: 0.1% of all households
Household received Food Stamps/SNAP in the past 12 months: 661Household did not receive Food Stamps/SNAP in the past 12 months: 12,186
Women who had a birth in the past 12 months: 282 (253 now married , 33 unmarried) Women who did not have a birth in the past 12 months: 7,413 (3,221 now married , 4,185 unmarried)
Housing units in zip code 49024 with a mortgage: 5,391 (570
second mortgage , 8
home equity loan , 553
both second mortgage and home equity loan )
Houses without a mortgage: 303
Median monthly owner costs for units with a mortgage: $1,548
Median monthly owner costs for units without a mortgage: $684
Residents with income below the poverty level in 2022:
This zip code:
8.4%Whole state:
13.4%
Residents with income below 50% of the poverty level in 2022:
This zip code:
3.2%Whole state:
6.9%
Median number of rooms in houses and condos: Median number of rooms in apartments: Notable locations in this zip code not listed on our city pages
Click to draw/clear zip code borders Notable locations in zip code 49024: (A) , Moors Golf Club (B) , Oakland Hills Golf Club (C) , Portage Fire Department Station 2 (D) . Display/hide their locations on the map
Shopping Center: (1) . Display/hide its location on the map
Churches in zip code 49024 include: (A) , First Church of the Nazarene (B) , First Assembly of God Church (C) , Victory Baptist Church (D) , Portage United Church of Christ (E) , Prince of Peace Lutheran Church (F) , Saint James Lutheran Church (G) , Cornerstone Pentecostal Church (H) , Chapel Hill United Methodist Church (I) . Display/hide their locations on the map
Cemetery: (1) . Display/hide its location on the map
Lakes: (A) , Sugarloaf Lake (B) . Display/hide their locations on the map
Parks in zip code 49024 include: (1) , Allen Field (2) , Gourdneck State Game Area (3) . Display/hide their locations on the map
Year house built (houses)
24 2020 or later849 2010 to 20191,714 2000 to 20091,970 1990 to 19992,177 1980 to 19892,576 1970 to 19792,274 1960 to 19691,383 1950 to 195988 1940 to 1949276 1939 or earlier
Zip code 49024 household income distribution in 2022 862 Less than $10,000154 $10,000 to $14,999347 $15,000 to $19,999255 $20,000 to $24,999514 $25,000 to $29,999366 $30,000 to $34,999346 $35,000 to $39,999395 $40,000 to $44,999335 $45,000 to $49,9991,023 $50,000 to $59,9991,668 $60,000 to $74,9991,565 $75,000 to $99,9991,294 $100,000 to $124,9991,125 $125,000 to $149,9991,496 $150,000 to $199,9991,180 $200,000 or moreEstimate of home value of owner-occupied houses/condos in 2022 in zip code 49024 19 Less than $10,00015 $10,000 to $14,99915 $15,000 to $19,9994 $20,000 to $24,9998 $25,000 to $29,99922 $30,000 to $34,99922 $40,000 to $49,99967 $50,000 to $59,9996 $60,000 to $69,99922 $70,000 to $79,99927 $80,000 to $89,99922 $90,000 to $99,999238 $100,000 to $124,999466 $125,000 to $149,999900 $150,000 to $174,999914 $175,000 to $199,9991,671 $200,000 to $249,9991,569 $250,000 to $299,9991,491 $300,000 to $399,999381 $400,000 to $499,999608 $500,000 to $749,99939 $750,000 to $999,99923 $1,000,000 to $1,499,999Rent paid by renters in 2022 in zip code 49024 82 $150 to $19934 $250 to $299105 $300 to $34979 $350 to $39984 $400 to $44932 $500 to $54929 $550 to $59944 $600 to $649190 $650 to $699183 $700 to $749193 $750 to $799579 $800 to $899635 $900 to $999623 $1,000 to $1,249732 $1,250 to $1,499717 $1,500 to $1,99944 $2,000 to $2,49927 $2,500 to $2,99947 $3,000 to $3,49939 $3,500 or more51 No cash rent
Median gross rent in 2022: $1,154.
Median price asked for vacant for-sale houses and condos in 2022: $131,768.
Estimated median house (or condo) value in 2022 for: White Non-Hispanic householders: $260,399Black or African American householders: $242,935American Indian or Alaska Native householders: $207,221Asian householders: $300,235Some other race householders: $185,046Two or more races householders: $217,228Hispanic or Latino householders: $218,406Estimated median house or condo value in 2022: $257,653
49024:
$257,653Michigan:
$224,400
Lower value quartile - upper value quartile: $193,720 - $333,425
Mean price in 2022: Detached houses: $294,594Here:
$294,594State:
$280,038
Townhouses or other attached units: $260,061Here:
$260,061State:
$239,520
In 2-unit structures: $406,230Here:
$406,230State:
$219,481
In 3-to-4-unit structures: $111,775Here:
$111,775State:
$207,067
In 5-or-more-unit structures: $126,615Here:
$126,615State:
$192,733
Mobile homes: $487,745Here:
$487,745State:
$72,868
Housing units in structures:
One, detached: 8,735One, attached: 1,034Two: 1603 or 4: 4635 to 9: 1,03910 to 19: 1,06920 to 49: 41650 or more: 464Boats, RVs, vans, etc.: 31Unemployment : 5.2%
Means of transportation to work in zip code 49024 77.4% 12,469 Drove a car alone4.3% 698 Carpooled1.1% 170 Bus or trolley bus0.6% 89 Bicycle1.4% 232 Walked0.2% 32 Other means15.2% 2,445 Worked at homeTravel time to work (commute) in zip code 49024 410 Less than 5 minutes1,650 5 to 9 minutes2,958 10 to 14 minutes3,289 15 to 19 minutes1,838 20 to 24 minutes840 25 to 29 minutes1,144 30 to 34 minutes335 35 to 39 minutes127 40 to 44 minutes466 45 to 59 minutes516 60 to 89 minutes155 90 or more minutes
Percentage of zip code residents living and working in this county: 87.7%
Household type by relationship:
Households: 30,466
Male householders: 6,166 (1,641 living alone ), Female householders: 6,772 (2,159 living alone )6,496 spouses (6,399 opposite-sex spouses ), 881 unmarried partners , (838 opposite-sex unmarried partners ), 8,526 children (8,090 natural , 187 adopted , 249 stepchildren ), 233 grandchildren , 248 brothers or sisters , 177 parents , 69 foster children , 170 other relatives , 702 non-relatives In group quarters: 66 (-1 institutionalized population )
Size of family households: 3,774 2-persons , 1,926 3-persons , 1,597 4-persons , 718 5-persons , 101 6-persons , 39 7-or-more-persons
Size of nonfamily households: 3,800 1-person , 794 2-persons , 93 3-persons , 73 4-persons
4,550 married couples with children. single-parent households (189 men , 1,619 women ).
91.5% of residents of 49024 zip code speak English at home. of residents speak Spanish at home (78% very well, 18% well, 4% not well ).of residents speak other Indo-European language at home (95% very well, 2% well, 2% not well ).of residents speak Asian or Pacific Island language at home (63% very well, 30% well, 7% not well ).of residents speak other language at home (88% very well, 12% well ).
Foreign born population: 1,968 (6.5%)
(47.4%
of them are naturalized citizens )
This zip code:
6.5%Whole state:
6.9%
27% Bhutan 21% Honduras 5% China, excluding Hong Kong and Taiwan 4% Sweden 3% United Kingdom, excluding England and Scotland 3% Bolivia 3% Poland 14% German 12% English 9% Dutch 7% American 5% Irish 4% European 3% Polish
Year of entry for the foreign-born population
1,058 2010 or later 497 2000 to 2009 240 1990 to 1999 474 Before 1990
There are
319 Other Medical Specialists in Zip Code 49024.
Facilities with environmental interests located in this zip code:
AGGREGATE INDUSTRIES - AC1 PORTABLE PLANT (8075 CREEKSIDE DRIVE - SUITE 2 in KALAMAZOO, MI)
CRITERIA AND HAZARDOUS AIR POLLUTANT INVENTORY (Inventory of air pollution sources) Business SIC classification: CONSTRUCTION SAND AND GRAVELAlternative names: AGGREGATE INDUSTRIES - AC2 PORTABLE PLANT, AGGREGATE INDUSTRIES - AC3 PORTABLE PLANT, AGGREGATE INDUSTRIES - NORDBERG HP300 PLANT
AMBERLY ELEMENTARY SCHOOL (6637 AMBERLY STREET in PORTAGE, MI)
(National Center for Education Statistics) - STATE ID-00081 Organizations: PORTAGE PUBLIC SCHOOLS (SCHOOL DISTRICT)
ANGLING ROAD ELEMENTARY SCHOOL (5340 ANGLING ROAD in PORTAGE, MI)
(National Center for Education Statistics) - STATE ID-00100 Organizations: PORTAGE PUBLIC SCHOOLS (SCHOOL DISTRICT)
GREAT LAKES COACH SALES CO (8922 SHAVER RD in PORTAGE, MI)
(Resource Conservation and Recovery Act (tracking hazardous waste))
GREAT LAKES STEEL FABRICATORS INC (9340 SHAVER RD in PORTAGE, MI)
(Resource Conservation and Recovery Act (tracking hazardous waste)) Business NAICS classification: IRON AND STEEL FORGING.
A 1 AUTO BODY SHOP INC (416 ROMENCE RD in PORTAGE, MI)
Conditionally Exempt Small Quantity Generators, less than 100 kg/month of hazardous waste (Resource Conservation and Recovery Act (tracking hazardous waste)) - notification Organizations: PHILIPP DON (CONTACT/OPERATOR)
AUTOBODY USA SOUTHSIDE (8326 SHAVER ROAD in PORTAGE, MI)
Conditionally Exempt Small Quantity Generators, less than 100 kg/month of hazardous waste (Resource Conservation and Recovery Act (tracking hazardous waste)) Business NAICS classification: AUTOMOTIVE BODY, PAINT, AND INTERIOR REPAIR AND MAINTENANCE.Organizations: ROBERT C. JACKSON, SR. (CONTACT/OPERATOR)
Alternative names: SOUTHSIDE COLLISION, INC.
MEIJER INC (8850 SHAVER RD in PORTAGE, MI)
Conditionally Exempt Small Quantity Generators, less than 100 kg/month of hazardous waste (Resource Conservation and Recovery Act (tracking hazardous waste)) Business NAICS classification: DISCOUNT DEPARTMENT STORES.Alternative names: MEIJER INC 196
MERVYNS LLC (6720 RING ROAD in PORTAGE, MI)
Conditionally Exempt Small Quantity Generators, less than 100 kg/month of hazardous waste (Resource Conservation and Recovery Act (tracking hazardous waste)) Alternative names: TARGET CORPORATION
DOVER RESOURCES CORPORATION (9151 SHAVER RD in PORTAGE, MI)
Small Quantity Generators, between 100 kg and 1000 kg of hazardous waste/month (Resource Conservation and Recovery Act (tracking hazardous waste)) Organizations: DOVER CORPORATION (CONTACT/OPERATOR)
Alternative names: DOVER CORP RONNIGEN-PETTER DIV
BIO KLEEN PROD (7043 LEAWOOD ST in KALAMAZOO, MI)
COMPLIANCE ACTIVITY (Tracking inspections of insecticide, fungicide, and rodenticide, and toxic substances)
Housing units lacking complete plumbing facilities: 0.2%
Housing units lacking complete kitchen facilities: 0.8%
80.8% Utility gas 17.0% Electricity 1.0% Fuel oil, kerosene, etc. 1.0% Bottled, tank, or LP gas
Place of birth for U.S.-born residents:
This state: 21,446Northeast: 1,016Midwest: 3,236South: 1,574West: 1,030
53% of the 49024 zip code residents lived in the same house 5 years ago.
Out of people who lived in different houses, 59% lived in this county.
Out of people who lived in different counties, 50% lived in Michigan.
86% of the 49024 zip code residents lived in the same house 1 year ago.
Out of people who lived in different houses, 52% moved from this county.
Out of people who lived in different houses, 21% moved from different county within same state.
Out of people who lived in different houses, 19% moved from different state.
Out of people who lived in different houses, 9% moved from abroad.
Private vs. public school enrollment:
Students in private schools in grades 1 to 8 (elementary and middle school): 430
Students in private schools in grades 9 to 12 (high school): 110
Students in private undergraduate colleges: 97
Occupation by median earnings in the past 12 months ($)
111,332 Legal occupations 91,779 Health diagnosing and treating practitioners and other technical occupations 89,830 Computer and mathematical occupations 83,607 Management occupations 82,367 Architecture and engineering occupations 58,579 Education, training, and library occupations
Companies with federal contracts located in this zip code:
CORRINE''S CATERING INC (10023 OAKLAND DR in PORTAGE, MI; small business)
$10,425 with Army for Meat, Poultry, and Fish. Signed on 2003-04-16. Completion date: 2003-04-15.
Top industries in this zip code by the number of employees in 2005:
Accommodation and Food Services: Limited-Service Restaurants (100-249 employees: 1 establishment, 50-99 employees: 3 establishments, 20-49 employees: 2 establishments, 10-19 employees: 5 establishments, 1-4 employees: 3 establishments)Health Care and Social Assistance: Offices of Dentists (20-49: 2, 10-19: 3, 5-9: 20, 1-4: 1)Finance and Insurance: Insurance Agencies and Brokerages (100-249: 1, 5-9: 4, 1-4: 14)Health Care and Social Assistance: Offices of Physicians (except Mental Health Specialists) (20-49: 3, 10-19: 6, 5-9: 1, 1-4: 12)Construction: Plumbing, Heating, and Air-Conditioning Contractors (100-249: 1, 10-19: 2, 5-9: 1, 1-4: 2)Other Services (except Public Administration): Religious Organizations (20-49: 3, 10-19: 4, 5-9: 3, 1-4: 5)Administrative and Support and Waste Management and Remediation Services: Temporary Help Services (50-99: 2, 20-49: 1, 1-4: 2)Construction: New Housing Operative Builders (100-249: 1, 5-9: 1, 1-4: 3)
People in group quarters in 2010:
15 people in residential treatment centers for adults
11 people in group homes intended for adults
People in group quarters in 2000:
101 people in other noninstitutional group quarters
45 people in other group homes
18 people in other workers' dormitories
13 people in homes for the mentally ill
8 people in homes for the mentally retarded
4 people in religious group quarters
Fatal accident statistics in 2013:
Fatal accident count: 3Vehicles involved in fatal accidents: 3Fatal accidents caused by drunken drivers: 2Fatalities: 3Persons involved in fatal accidents: 5Pedestrians involved in fatal accidents: 1
Fatal accident statistics in 2012:
Fatal accident count: 1Vehicles involved in fatal accidents: 1Fatal accidents caused by drunken drivers: 1Fatalities: 1Persons involved in fatal accidents: 1Pedestrians involved in fatal accidents: 0
Home Mortgage Disclosure Act Aggregated Statistics For Year 2009(Based on 5 full and 10 partial tracts) A) FHA, FSA/RHS & VA B) Conventional C) Refinancings D) Home Improvement Loans F) Non-occupant Loans on G) Loans On Manufactured Number Average Value Number Average Value Number Average Value Number Average Value Number Average Value Number Average Value
LOANS ORIGINATED 260 $123,400 229 $148,870 1,031 $145,238 38 $46,329 32 $102,277 4 $65,317 APPLICATIONS APPROVED, NOT ACCEPTED 15 $146,181 17 $161,134 95 $159,521 3 $6,257 2 $241,440 0 $0 APPLICATIONS DENIED 18 $135,720 16 $161,951 246 $142,005 17 $61,945 16 $100,776 3 $53,843 APPLICATIONS WITHDRAWN 26 $115,074 20 $166,491 213 $150,725 2 $76,330 3 $145,800 0 $0 FILES CLOSED FOR INCOMPLETENESS 7 $159,069 1 $77,000 38 $146,740 2 $6,000 0 $0 0 $0
Aggregated Statistics For Year 2008(Based on 5 full and 10 partial tracts) A) FHA, FSA/RHS & VA B) Conventional C) Refinancings D) Home Improvement Loans E) Loans on Dwellings For 5+ Families F) Non-occupant Loans on G) Loans On Manufactured Number Average Value Number Average Value Number Average Value Number Average Value Number Average Value Number Average Value Number Average Value
LOANS ORIGINATED 180 $130,873 326 $146,916 475 $139,897 38 $32,984 4 $537,738 37 $88,245 1 $9,500 APPLICATIONS APPROVED, NOT ACCEPTED 14 $155,523 29 $190,300 88 $115,255 3 $65,370 2 $233,735 3 $87,383 0 $0 APPLICATIONS DENIED 22 $117,101 28 $89,316 218 $137,615 33 $46,488 0 $0 5 $103,160 5 $18,472 APPLICATIONS WITHDRAWN 14 $91,580 21 $164,240 135 $143,811 9 $67,729 0 $0 5 $156,104 0 $0 FILES CLOSED FOR INCOMPLETENESS 2 $118,815 8 $73,266 48 $140,506 0 $0 0 $0 4 $108,832 0 $0
Aggregated Statistics For Year 2007(Based on 5 full and 10 partial tracts) A) FHA, FSA/RHS & VA B) Conventional C) Refinancings D) Home Improvement Loans E) Loans on Dwellings For 5+ Families F) Non-occupant Loans on G) Loans On Manufactured Number Average Value Number Average Value Number Average Value Number Average Value Number Average Value Number Average Value Number Average Value
LOANS ORIGINATED 46 $139,275 630 $128,759 591 $122,114 99 $42,062 0 $0 81 $112,015 1 $35,520 APPLICATIONS APPROVED, NOT ACCEPTED 3 $151,043 73 $118,270 152 $125,969 15 $48,739 0 $0 13 $120,865 5 $15,100 APPLICATIONS DENIED 15 $140,283 74 $102,611 486 $123,595 81 $46,008 2 $895,015 26 $128,917 7 $50,336 APPLICATIONS WITHDRAWN 4 $137,332 40 $114,346 173 $150,989 24 $91,179 2 $265,020 12 $99,962 0 $0 FILES CLOSED FOR INCOMPLETENESS 1 $134,980 17 $124,277 46 $113,407 8 $62,572 0 $0 4 $86,852 0 $0
Aggregated Statistics For Year 2006(Based on 5 full and 10 partial tracts) A) FHA, FSA/RHS & VA B) Conventional C) Refinancings D) Home Improvement Loans E) Loans on Dwellings For 5+ Families F) Non-occupant Loans on G) Loans On Manufactured Number Average Value Number Average Value Number Average Value Number Average Value Number Average Value Number Average Value Number Average Value
LOANS ORIGINATED 97 $133,297 898 $120,057 746 $109,483 175 $47,761 4 $5,852,840 90 $103,378 7 $70,834 APPLICATIONS APPROVED, NOT ACCEPTED 7 $115,913 77 $121,137 152 $110,903 12 $52,042 0 $0 16 $92,197 2 $22,895 APPLICATIONS DENIED 4 $133,495 99 $133,041 404 $123,622 92 $55,964 0 $0 27 $112,833 6 $47,137 APPLICATIONS WITHDRAWN 9 $101,407 75 $106,723 236 $123,878 26 $95,732 0 $0 13 $109,965 7 $87,553 FILES CLOSED FOR INCOMPLETENESS 1 $112,000 14 $99,402 96 $132,507 2 $30,920 0 $0 3 $203,560 0 $0
Aggregated Statistics For Year 2005(Based on 5 full and 10 partial tracts) A) FHA, FSA/RHS & VA B) Conventional C) Refinancings D) Home Improvement Loans E) Loans on Dwellings For 5+ Families F) Non-occupant Loans on G) Loans On Manufactured Number Average Value Number Average Value Number Average Value Number Average Value Number Average Value Number Average Value Number Average Value
LOANS ORIGINATED 100 $132,136 958 $124,668 935 $119,904 141 $52,099 3 $834,590 100 $101,012 8 $67,058 APPLICATIONS APPROVED, NOT ACCEPTED 7 $120,240 89 $112,390 144 $119,546 24 $31,286 0 $0 8 $141,112 8 $45,735 APPLICATIONS DENIED 7 $93,907 134 $89,765 576 $128,031 85 $43,667 0 $0 21 $126,086 7 $23,326 APPLICATIONS WITHDRAWN 6 $103,998 115 $138,902 325 $129,976 28 $120,711 0 $0 17 $132,250 1 $227,490 FILES CLOSED FOR INCOMPLETENESS 0 $0 31 $114,872 203 $141,289 8 $19,129 0 $0 6 $104,803 0 $0
Aggregated Statistics For Year 2004(Based on 5 full and 10 partial tracts) A) FHA, FSA/RHS & VA B) Conventional C) Refinancings D) Home Improvement Loans E) Loans on Dwellings For 5+ Families F) Non-occupant Loans on G) Loans On Manufactured Number Average Value Number Average Value Number Average Value Number Average Value Number Average Value Number Average Value Number Average Value
LOANS ORIGINATED 134 $130,880 887 $132,175 1,210 $122,180 119 $52,519 1 $207,420 107 $105,963 4 $75,085 APPLICATIONS APPROVED, NOT ACCEPTED 4 $126,545 98 $121,567 199 $119,621 12 $34,351 0 $0 14 $89,361 7 $29,660 APPLICATIONS DENIED 15 $103,145 74 $107,242 485 $126,252 78 $34,318 0 $0 17 $98,052 13 $36,826 APPLICATIONS WITHDRAWN 4 $111,642 35 $96,888 258 $130,153 25 $56,099 0 $0 5 $86,258 0 $0 FILES CLOSED FOR INCOMPLETENESS 2 $107,900 18 $125,571 114 $137,536 4 $48,378 0 $0 2 $50,000 0 $0
Aggregated Statistics For Year 2003(Based on 5 full and 10 partial tracts) A) FHA, FSA/RHS & VA B) Conventional C) Refinancings D) Home Improvement Loans E) Loans on Dwellings For 5+ Families F) Non-occupant Loans on Number Average Value Number Average Value Number Average Value Number Average Value Number Average Value Number Average Value
LOANS ORIGINATED 128 $125,907 895 $143,279 3,065 $121,556 91 $30,887 2 $1,625,005 133 $102,891 APPLICATIONS APPROVED, NOT ACCEPTED 5 $133,470 84 $148,488 413 $121,232 17 $20,557 0 $0 20 $82,356 APPLICATIONS DENIED 9 $129,000 73 $118,647 542 $113,861 51 $25,463 0 $0 37 $107,091 APPLICATIONS WITHDRAWN 5 $138,980 75 $144,710 391 $126,841 4 $24,725 0 $0 13 $131,514 FILES CLOSED FOR INCOMPLETENESS 0 $0 11 $129,194 82 $129,802 8 $22,958 0 $0 1 $100,360
Aggregated Statistics For Year 2002(Based on 1 full and 10 partial tracts) A) FHA, FSA/RHS & VA B) Conventional C) Refinancings D) Home Improvement Loans E) Loans on Dwellings For 5+ Families F) Non-occupant Loans on Number Average Value Number Average Value Number Average Value Number Average Value Number Average Value Number Average Value
LOANS ORIGINATED 88 $113,959 442 $119,060 1,194 $105,173 86 $23,474 4 $264,072 69 $102,387 APPLICATIONS APPROVED, NOT ACCEPTED 0 $0 35 $125,478 186 $100,505 17 $15,211 0 $0 7 $149,540 APPLICATIONS DENIED 3 $87,623 33 $80,551 228 $97,202 28 $18,770 0 $0 11 $75,013 APPLICATIONS WITHDRAWN 6 $122,087 21 $134,196 156 $105,957 10 $35,635 0 $0 13 $104,653 FILES CLOSED FOR INCOMPLETENESS 1 $49,730 8 $125,618 74 $107,025 0 $0 0 $0 0 $0
Aggregated Statistics For Year 2001(Based on 1 full and 10 partial tracts) A) FHA, FSA/RHS & VA B) Conventional C) Refinancings D) Home Improvement Loans E) Loans on Dwellings For 5+ Families F) Non-occupant Loans on Number Average Value Number Average Value Number Average Value Number Average Value Number Average Value Number Average Value
LOANS ORIGINATED 93 $106,887 402 $119,450 885 $96,185 124 $19,295 4 $85,185 44 $85,512 APPLICATIONS APPROVED, NOT ACCEPTED 3 $96,137 31 $101,453 126 $87,303 26 $19,019 0 $0 0 $0 APPLICATIONS DENIED 6 $84,178 63 $87,654 223 $79,420 35 $16,715 0 $0 19 $136,306 APPLICATIONS WITHDRAWN 4 $119,430 30 $146,534 133 $85,475 4 $23,962 0 $0 13 $134,489 FILES CLOSED FOR INCOMPLETENESS 0 $0 6 $82,330 27 $108,303 2 $8,035 0 $0 0 $0
Aggregated Statistics For Year 2000(Based on 1 full and 10 partial tracts) A) FHA, FSA/RHS & VA B) Conventional C) Refinancings D) Home Improvement Loans E) Loans on Dwellings For 5+ Families F) Non-occupant Loans on Number Average Value Number Average Value Number Average Value Number Average Value Number Average Value Number Average Value
LOANS ORIGINATED 87 $95,396 326 $113,508 295 $70,475 113 $19,062 2 $346,210 48 $84,608 APPLICATIONS APPROVED, NOT ACCEPTED 2 $109,760 27 $76,910 73 $66,717 31 $21,570 0 $0 5 $48,510 APPLICATIONS DENIED 5 $87,296 56 $74,285 163 $77,922 70 $20,296 0 $0 3 $97,697 APPLICATIONS WITHDRAWN 3 $89,647 19 $96,068 72 $56,986 10 $36,954 0 $0 3 $85,090 FILES CLOSED FOR INCOMPLETENESS 1 $52,690 1 $120,040 18 $70,316 0 $0 0 $0 0 $0
Aggregated Statistics For Year 1999(Based on 2 full and 5 partial tracts) A) FHA, FSA/RHS & VA B) Conventional C) Refinancings D) Home Improvement Loans F) Non-occupant Loans on Number Average Value Number Average Value Number Average Value Number Average Value Number Average Value
LOANS ORIGINATED 96 $95,962 525 $131,804 584 $92,312 104 $20,248 27 $81,820 APPLICATIONS APPROVED, NOT ACCEPTED 3 $73,633 43 $101,311 80 $87,849 25 $16,394 7 $78,491 APPLICATIONS DENIED 3 $90,997 70 $77,963 104 $92,442 40 $23,765 9 $96,868 APPLICATIONS WITHDRAWN 6 $89,350 14 $110,125 111 $77,037 10 $54,822 2 $38,435 FILES CLOSED FOR INCOMPLETENESS 2 $72,155 4 $112,738 30 $104,589 1 $39,890 0 $0
Private Mortgage Insurance Companies Aggregated Statistics For Year 2009(Based on 5 full and 10 partial tracts) A) Conventional B) Refinancings C) Non-occupant Loans on Number Average Value Number Average Value Number Average Value
LOANS ORIGINATED 59 $185,201 28 $152,183 1 $115,000 APPLICATIONS APPROVED, NOT ACCEPTED 12 $152,593 14 $148,936 0 $0 APPLICATIONS DENIED 5 $180,072 7 $160,334 0 $0 APPLICATIONS WITHDRAWN 3 $247,367 0 $0 0 $0 FILES CLOSED FOR INCOMPLETENESS 0 $0 0 $0 0 $0
Aggregated Statistics For Year 2008(Based on 5 full and 10 partial tracts) A) Conventional B) Refinancings C) Non-occupant Loans on Number Average Value Number Average Value Number Average Value
LOANS ORIGINATED 118 $146,026 42 $140,014 9 $85,621 APPLICATIONS APPROVED, NOT ACCEPTED 44 $173,133 26 $177,948 3 $87,410 APPLICATIONS DENIED 2 $166,585 0 $0 0 $0 APPLICATIONS WITHDRAWN 3 $126,750 0 $0 0 $0 FILES CLOSED FOR INCOMPLETENESS 1 $141,000 0 $0 0 $0
Aggregated Statistics For Year 2007(Based on 5 full and 10 partial tracts) A) Conventional B) Refinancings C) Non-occupant Loans on Number Average Value Number Average Value Number Average Value
LOANS ORIGINATED 183 $139,341 71 $158,565 7 $73,841 APPLICATIONS APPROVED, NOT ACCEPTED 11 $184,672 14 $191,921 1 $87,020 APPLICATIONS DENIED 1 $92,000 0 $0 0 $0 APPLICATIONS WITHDRAWN 4 $160,692 1 $405,000 0 $0 FILES CLOSED FOR INCOMPLETENESS 0 $0 4 $229,342 0 $0
Aggregated Statistics For Year 2006(Based on 5 full and 10 partial tracts) A) Conventional B) Refinancings C) Non-occupant Loans on Number Average Value Number Average Value Number Average Value
LOANS ORIGINATED 103 $152,297 49 $147,455 6 $98,500 APPLICATIONS APPROVED, NOT ACCEPTED 16 $171,498 6 $168,968 2 $70,040 APPLICATIONS DENIED 0 $0 1 $85,250 0 $0 APPLICATIONS WITHDRAWN 1 $80,090 1 $76,370 1 $80,090 FILES CLOSED FOR INCOMPLETENESS 0 $0 0 $0 0 $0
Aggregated Statistics For Year 2005(Based on 5 full and 10 partial tracts) A) Conventional B) Refinancings C) Non-occupant Loans on Number Average Value Number Average Value Number Average Value
LOANS ORIGINATED 122 $155,315 52 $144,662 10 $98,154 APPLICATIONS APPROVED, NOT ACCEPTED 27 $179,252 22 $139,062 3 $136,910 APPLICATIONS DENIED 3 $96,207 1 $57,420 0 $0 APPLICATIONS WITHDRAWN 9 $176,819 3 $193,420 0 $0 FILES CLOSED FOR INCOMPLETENESS 0 $0 0 $0 0 $0
Aggregated Statistics For Year 2004(Based on 5 full and 10 partial tracts) A) Conventional B) Refinancings C) Non-occupant Loans on Number Average Value Number Average Value Number Average Value
LOANS ORIGINATED 146 $139,839 68 $153,958 14 $109,763 APPLICATIONS APPROVED, NOT ACCEPTED 15 $150,561 35 $139,098 2 $159,720 APPLICATIONS DENIED 0 $0 1 $279,000 0 $0 APPLICATIONS WITHDRAWN 4 $139,720 9 $134,251 0 $0 FILES CLOSED FOR INCOMPLETENESS 0 $0 0 $0 0 $0
Aggregated Statistics For Year 2003(Based on 5 full and 10 partial tracts) A) Conventional B) Refinancings C) Non-occupant Loans on Number Average Value Number Average Value Number Average Value
LOANS ORIGINATED 196 $141,292 206 $143,168 20 $104,356 APPLICATIONS APPROVED, NOT ACCEPTED 19 $142,084 42 $129,283 2 $128,725 APPLICATIONS DENIED 2 $152,000 2 $63,390 2 $76,390 APPLICATIONS WITHDRAWN 5 $145,430 8 $141,161 0 $0 FILES CLOSED FOR INCOMPLETENESS 1 $52,690 0 $0 0 $0
Aggregated Statistics For Year 2002(Based on 1 full and 10 partial tracts) A) Conventional B) Refinancings C) Non-occupant Loans on Number Average Value Number Average Value Number Average Value
LOANS ORIGINATED 94 $129,363 84 $124,788 5 $78,354 APPLICATIONS APPROVED, NOT ACCEPTED 16 $116,285 29 $111,120 3 $71,943 APPLICATIONS DENIED 2 $128,470 0 $0 0 $0 APPLICATIONS WITHDRAWN 2 $78,745 2 $82,665 1 $90,000 FILES CLOSED FOR INCOMPLETENESS 0 $0 0 $0 0 $0
Aggregated Statistics For Year 2001(Based on 1 full and 10 partial tracts) A) Conventional B) Refinancings C) Non-occupant Loans on Number Average Value Number Average Value Number Average Value
LOANS ORIGINATED 117 $127,085 84 $123,554 6 $69,082 APPLICATIONS APPROVED, NOT ACCEPTED 11 $119,467 16 $141,947 0 $0 APPLICATIONS DENIED 2 $188,240 1 $159,250 0 $0 APPLICATIONS WITHDRAWN 1 $326,780 0 $0 0 $0 FILES CLOSED FOR INCOMPLETENESS 0 $0 1 $52,100 0 $0
Aggregated Statistics For Year 2000(Based on 1 full and 10 partial tracts) A) Conventional B) Refinancings C) Non-occupant Loans on Number Average Value Number Average Value Number Average Value
LOANS ORIGINATED 132 $118,932 25 $109,940 7 $77,290 APPLICATIONS APPROVED, NOT ACCEPTED 9 $104,393 4 $110,362 1 $30,780 APPLICATIONS DENIED 3 $84,543 1 $192,700 0 $0 APPLICATIONS WITHDRAWN 1 $107,740 1 $118,000 0 $0 FILES CLOSED FOR INCOMPLETENESS 0 $0 0 $0 0 $0
Aggregated Statistics For Year 1999(Based on 2 full and 5 partial tracts) A) Conventional B) Refinancings C) Non-occupant Loans on Number Average Value Number Average Value Number Average Value
LOANS ORIGINATED 175 $130,053 42 $119,131 4 $78,100 APPLICATIONS APPROVED, NOT ACCEPTED 3 $131,720 8 $152,452 0 $0 APPLICATIONS DENIED 0 $0 2 $65,910 0 $0 APPLICATIONS WITHDRAWN 2 $156,835 1 $87,100 0 $0 FILES CLOSED FOR INCOMPLETENESS 0 $0 0 $0 0 $0
2002 - 2018 National Fire Incident Reporting System (NFIRS) incidents See full 2006 National Fire Incident Reporting System statistics for zip code 49024, Michigan
Most common first names in zip code 49024 among deceased individuals Name Count Lived (average)
Robert 63 77.0 years John 43 80.4 years James 39 71.9 years William 39 78.2 years Helen 38 85.8 years Mary 37 83.8 years Margaret 35 83.5 years Richard 29 74.2 years Dorothy 28 83.6 years Charles 23 77.4 years
Most common last names in zip code 49024 among deceased individuals Last name Count Lived (average)
Smith 14 79.3 years Miller 12 77.2 years Johnson 12 77.8 years Brown 12 83.3 years Martin 11 80.8 years Williams 11 75.4 years Price 10 80.1 years Allen 9 82.0 years King 6 80.5 years Olson 6 78.5 years
Businesses in zip code 49024
Name Count Name Count
ALDO 1 La-Z-Boy 3 AT&T 1 Lane Bryant 1 Abercrombie & Fitch 1 Lane Furniture 3 Aeropostale 1 Little Caesars Pizza 1 American Eagle Outfitters 1 MasterBrand Cabinets 5 Ann Taylor 1 Maurices 1 Arby's 1 Meijer 1 Banana Republic 1 Men's Wearhouse 1 Bed Bath & Beyond 1 Menards 1 Charlotte Russe 1 Motherhood Maternity 2 Chico's 1 Nike 3 Circle K 1 Pac Sun 1 Coldwater Creek 1 Papa John's Pizza 1 Curves 1 Payless 1 DHL 1 Pizza Hut 1 Deb 1 Qdoba Mexican Grill 1 Domino's Pizza 1 RadioShack 1 DressBarn 1 Rite Aid 1 Dressbarn 1 SONIC Drive-In 1 Eddie Bauer 1 Sears 2 Famous Footwear 1 Spencer Gifts 1 FedEx 5 Sprint Nextel 2 Finish Line 1 Starbucks 1 Foot Locker 1 Subway 3 Forever 21 1 T-Mobile 2 Fredericks Of Hollywood 1 Toys"R"Us 1 GNC 1 U-Haul 1 GameStop 1 UPS 10 Gap 1 Vans 1 H&R Block 1 Victoria's Secret 1 Hollister Co. 1 Walgreens 1 Hot Topic 1 Walmart 1 JCPenney 1 Wendy's 1 Journeys 1 Wet Seal 1 Justice 1 YMCA 1 Kincaid 2
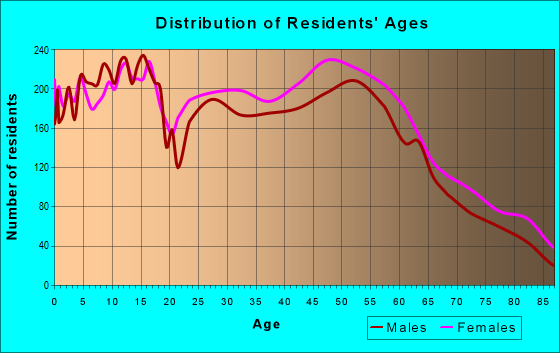
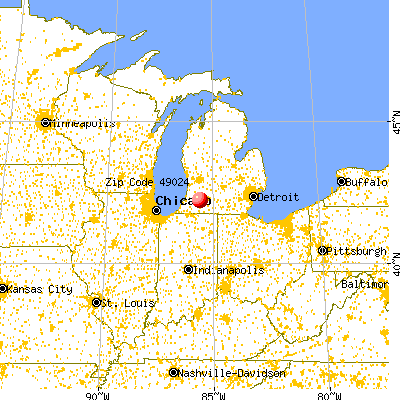


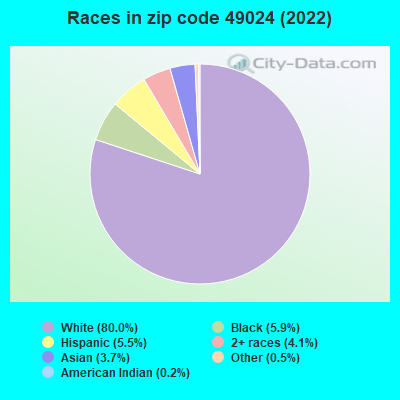


 Nearest zip codes: 49002, 49008, 49001, 49006, 49007, 49087.
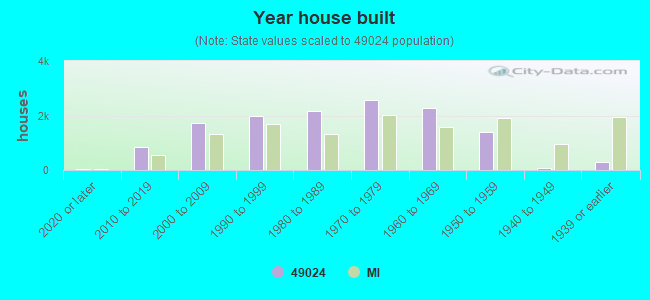

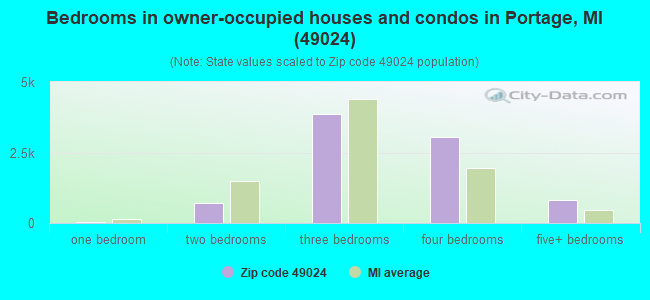
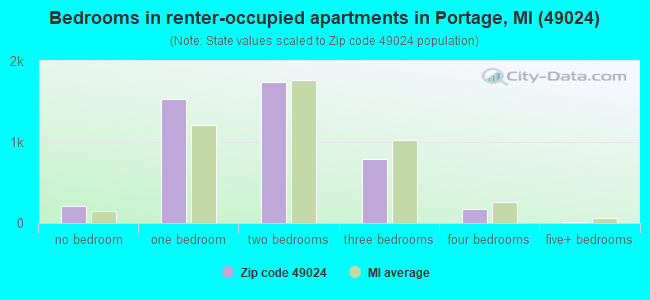
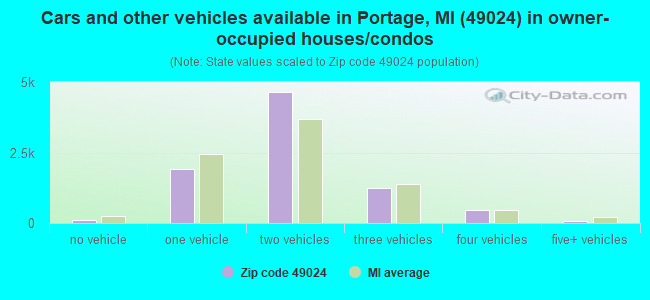
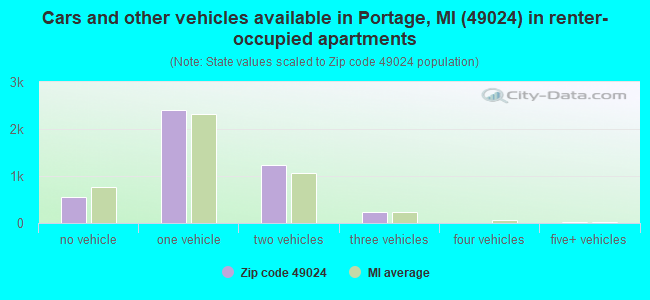


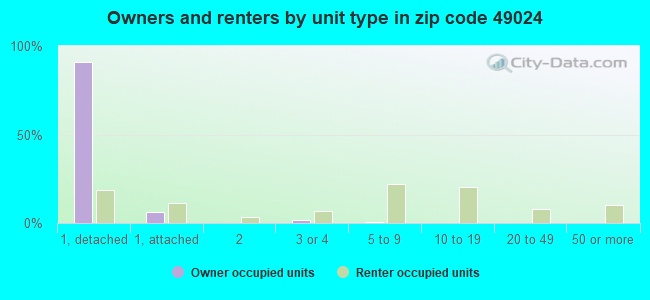


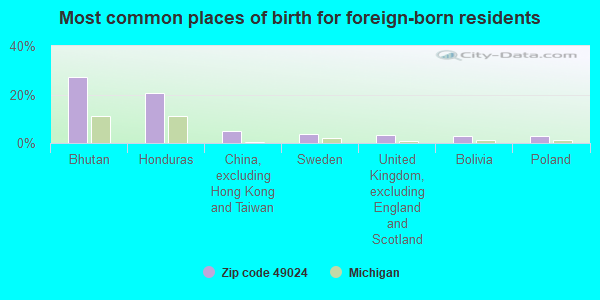
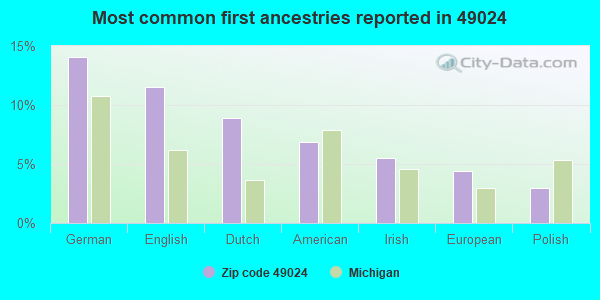
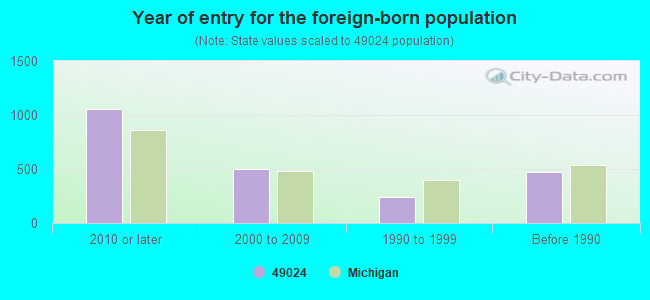

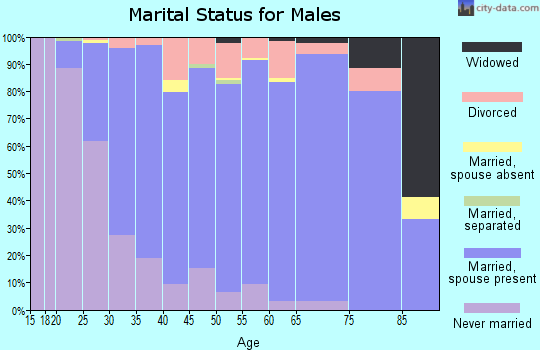

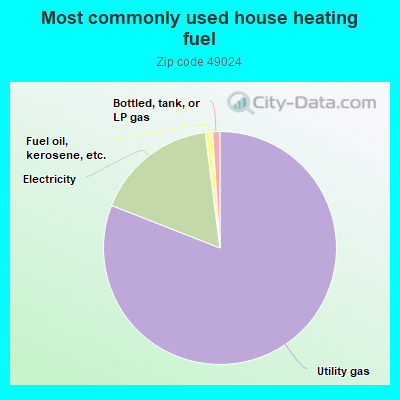
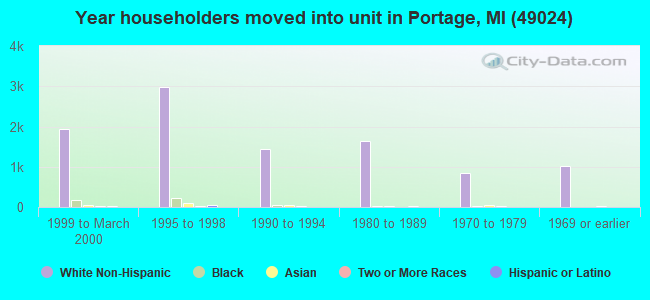
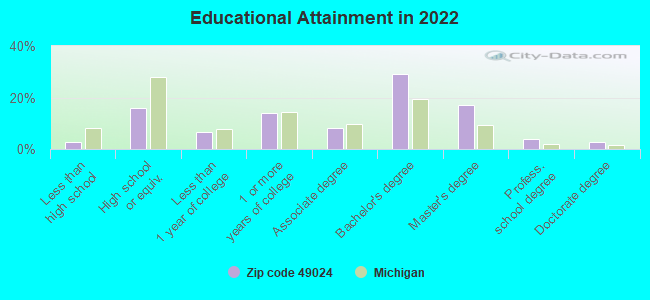
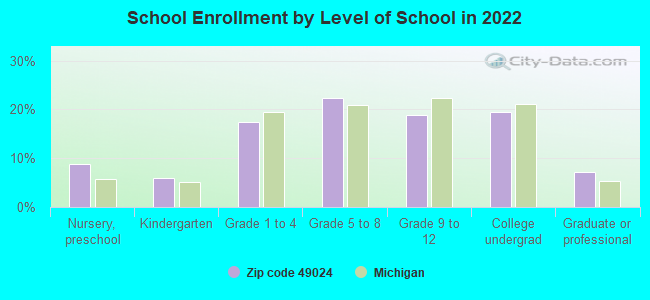

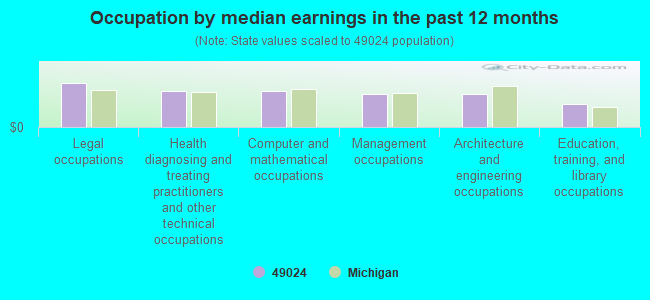
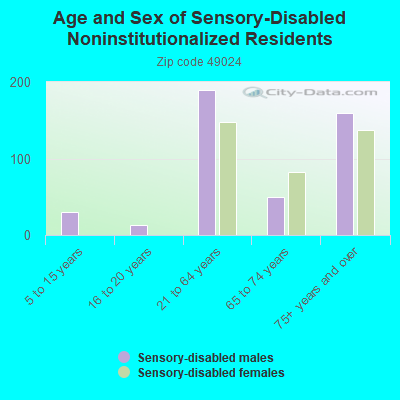


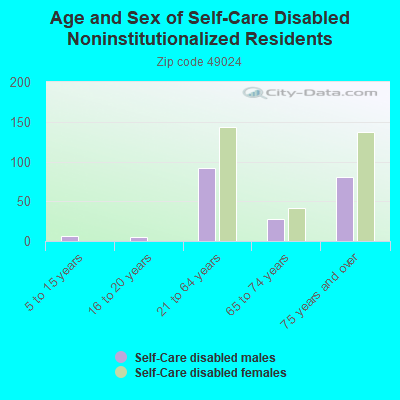
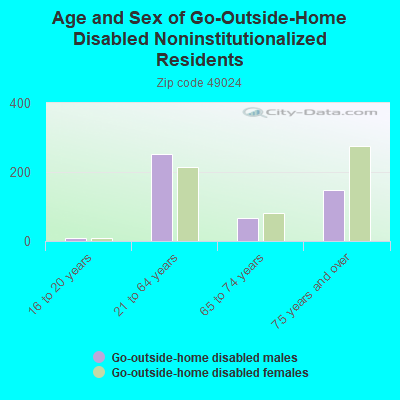
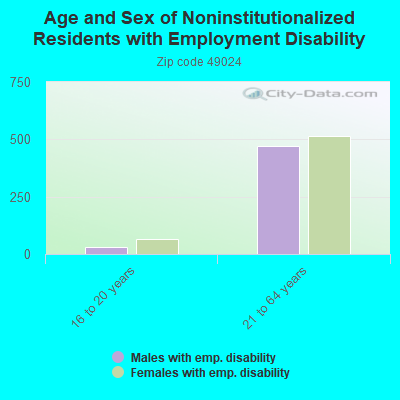
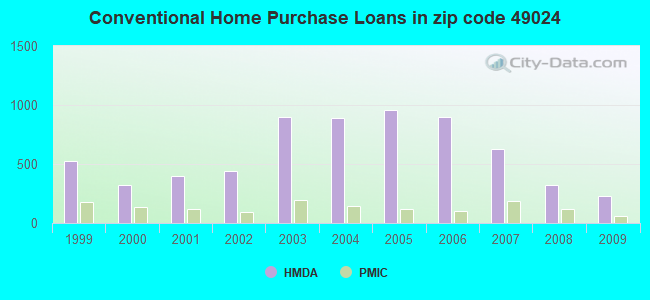
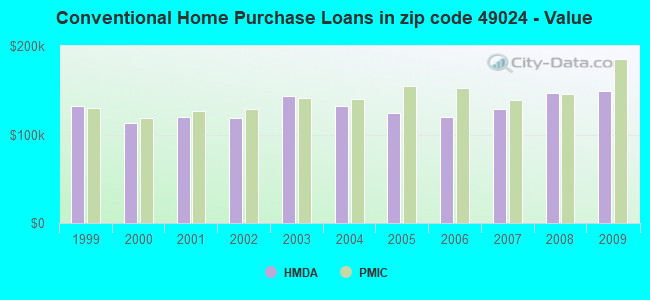
 Based on the data from the years 2002 - 2018 the average number of fire incidents per year is 38. The highest number of reported fires - 86 took place in 2008, and the least - 4 in 2003. The data has a rising trend.
 When looking into fire subcategories, the most incidents belonged to: Structure Fires (50.9%), and Outside Fires (26.6%).