Estimated zip code population in 2022: 39,089 Zip code population in 2010: 40,596 Zip code population in 2000: 40,647
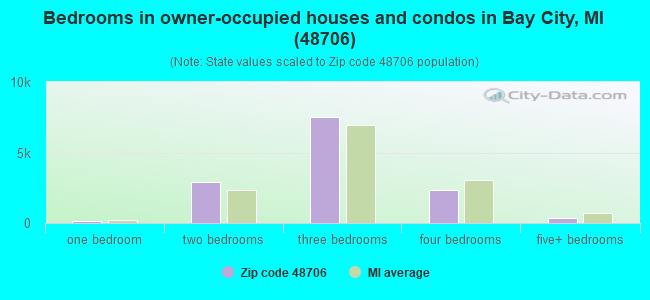
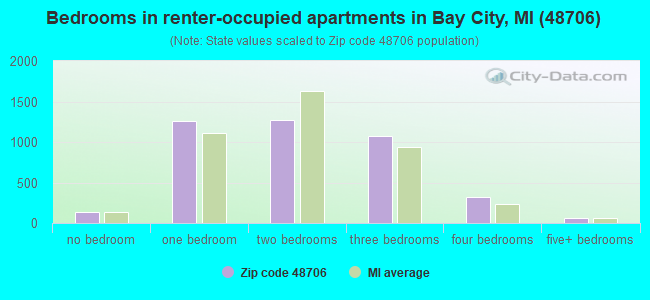
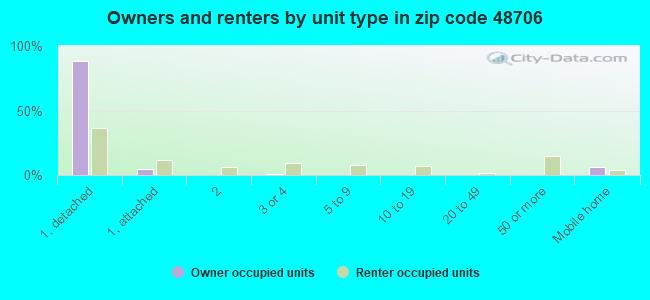
Houses and condos: 18,423 Renter-occupied apartments: 4,122
% of renters here:
24%
State:
27%
March 2022 cost of living index in zip code 48706: 80.5 (low, U.S. average is 100)
Land area: 67.0 sq. mi. Water area: 7.2 sq. mi.
Population density: 584 people per square mile
(low).
OSM Map
General Map
Google Map
MSN Map
OSM Map
General Map
Google Map
MSN Map
OSM Map
General Map
Google Map
MSN Map
OSM Map
General Map
Google Map
MSN Map
Please wait while loading the map...
Real estate property taxes paid for housing units in 2022:
This zip code:
1.5% ($2,106)
Michigan:
1.2% ($2,746)
Median real estate property taxes paid for housing units with mortgages in 2022: $2,302 (1.5%) Median real estate property taxes paid for housing units with no mortgage in 2022: $1,944 (1.5%)
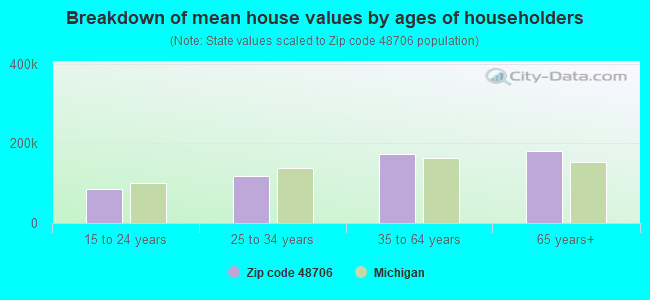
Estimated median house/condo value in 2022: $141,268
48706:
$141,268
Michigan:
$224,400
According to our research of Michigan and other state lists, there were 142 registered sex offenders living in 48706 zip code as of June 10, 2024. The ratio of all residents to sex offenders in zip code 48706 is 283 to 1. The ratio of registered sex offenders to all residents in this zip code is near the state average.
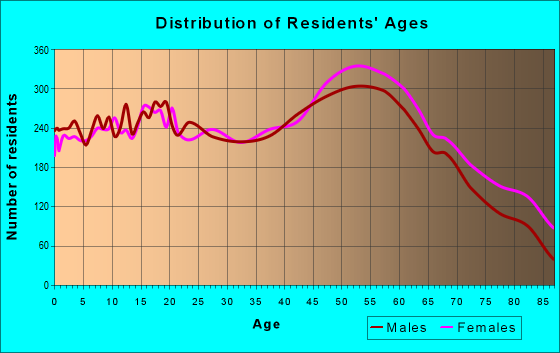
Median resident age:
This zip code:
45.0 years
Michigan median age:
40.3 years
Average household size:
This zip code:
2.2 people
Michigan:
2.4 people
Averages for the 2020 tax year for zip code 48706, filed in 2021:
Average Adjusted Gross Income (AGI) in 2020: $55,547 (Individual Income Tax Returns)
Here:
$55,547
State:
$68,945
Salary/wage: $47,859 (reported on 73.6% of returns)
Here:
$47,859
State:
$57,142
(% of AGI for various income ranges: 964.7% for AGIs below $25k, 2924.1% for AGIs $25k-50k, 5404.4% for AGIs $50k-75k, 8416.9% for AGIs $75k-100k, 15137.8% for AGIs $100k-200k, 59027.8% for AGIs over 200k)
Taxable interest for individuals: $1,500 (reported on 33.1% of returns)
This zip code:
$1,500
Michigan:
$1,630
(% of AGI for various income ranges: 19.1% for AGIs below $25k, 30.6% for AGIs $25k-50k, 52.8% for AGIs $50k-75k, 74.6% for AGIs $75k-100k, 156.1% for AGIs $100k-200k, 1978.9% for AGIs over 200k)
Ordinary dividends: $4,470 (reported on 18.2% of returns)
Here:
$4,470
State:
$6,972
(% of AGI for various income ranges: 23.1% for AGIs below $25k, 42.1% for AGIs $25k-50k, 73.5% for AGIs $50k-75k, 146.9% for AGIs $75k-100k, 265.0% for AGIs $100k-200k, 3581.1% for AGIs over 200k)
Net capital gain/loss in AGI: +$9,105 (reported on 15.7% of returns)
Here:
+$9,105
State:
+$20,064
(% of AGI for various income ranges: 2.6% for AGIs below $25k, 27.1% for AGIs $25k-50k, 82.6% for AGIs $50k-75k, 143.8% for AGIs $75k-100k, 422.9% for AGIs $100k-200k, 10212.2% for AGIs over 200k)
Profit/loss from business: +$13,838 (reported on 10.6% of returns)
Here:
+$13,838
State:
+$11,172
(% of AGI for various income ranges: 49.4% for AGIs below $25k, 77.0% for AGIs $25k-50k, 146.7% for AGIs $50k-75k, 137.3% for AGIs $75k-100k, 383.3% for AGIs $100k-200k, 7681.7% for AGIs over 200k)
Taxable individual retirement arrangement distribution: $16,633 (reported on 12.4% of returns)
48706:
$16,633
Michigan:
$19,803
(% of AGI for various income ranges: 74.8% for AGIs below $25k, 131.0% for AGIs $25k-50k, 303.1% for AGIs $50k-75k, 516.0% for AGIs $75k-100k, 904.5% for AGIs $100k-200k, 3622.2% for AGIs over 200k)
Self-employed (Keogh) retirement plans: $28,760 (reported on 0.2% of returns)
48706:
$28,760
Michigan:
$25,132
(% of AGI for various income ranges: 13.1% for AGIs $50k-75k, 640.6% for AGIs over 200k)
Total itemized deductions: $33,922 (reported on 3.2% of returns)
Here:
$33,922
State:
$34,117
(% of AGI for various income ranges: 31.5% for AGIs below $25k, 57.1% for AGIs $25k-50k, 103.9% for AGIs $50k-75k, 187.5% for AGIs $75k-100k, 448.0% for AGIs $100k-200k, 4026.1% for AGIs over 200k)
Charity contributions: $11,141 (reported on 2.6% of returns)
Here:
$11,141
State:
$13,548
(% of AGI for various income ranges: 1.2% for AGIs below $25k, 10.4% for AGIs $25k-50k, 17.3% for AGIs $50k-75k, 33.1% for AGIs $75k-100k, 123.5% for AGIs $100k-200k, 1580.6% for AGIs over 200k)
Taxes paid: $6,880 (reported on 3.2% of returns)
48706:
$6,880
State:
$7,972
(% of AGI for various income ranges: 2.8% for AGIs below $25k, 7.9% for AGIs $25k-50k, 18.5% for AGIs $50k-75k, 45.2% for AGIs $75k-100k, 107.5% for AGIs $100k-200k, 811.7% for AGIs over 200k)
Earned income credit: $2,079 (reported on 13.7% of returns)
Here:
$2,079
State:
$2,251
(% of AGI for various income ranges: 67.7% for AGIs below $25k, 53.6% for AGIs $25k-50k, 0.9% for AGIs $50k-75k)
Percentage of individuals using paid preparers for their 2020 taxes: 94.5%
Here:
95%
State:
93%
(% for various income ranges: 93.9% for AGIs below $25k, 95.1% for AGIs $25k-50k, 94.6% for AGIs $50k-75k, 94.9% for AGIs $75k-100k, 94.3% for AGIs $100k-200k, 96.3% for AGIs over 200k)
Averages for the 2012 tax year for zip code 48706, filed in 2013:
Average Adjusted Gross Income (AGI) in 2012: $47,613 (Individual Income Tax Returns)
Here:
$47,613
State:
$55,609
Salary/wage: $39,152 (reported on 79.8% of returns)
Here:
$39,152
State:
$46,782
(% of AGI for various income ranges: 64.3% for AGIs below $25k, 68.1% for AGIs $25k-50k, 69.8% for AGIs $50k-75k, 71.6% for AGIs $75k-100k, 73.6% for AGIs $100k-200k, 42.2% for AGIs over 200k)
Taxable interest for individuals: $1,203 (reported on 39.5% of returns)
This zip code:
$1,203
Michigan:
$1,491
(% of AGI for various income ranges: 1.5% for AGIs below $25k, 0.9% for AGIs $25k-50k, 0.8% for AGIs $50k-75k, 0.7% for AGIs $75k-100k, 0.8% for AGIs $100k-200k, 1.6% for AGIs over 200k)
Ordinary dividends: $4,496 (reported on 20.6% of returns)
Here:
$4,496
State:
$6,225
(% of AGI for various income ranges: 1.5% for AGIs below $25k, 1.2% for AGIs $25k-50k, 1.3% for AGIs $50k-75k, 1.1% for AGIs $75k-100k, 1.3% for AGIs $100k-200k, 5.6% for AGIs over 200k)
Net capital gain/loss in AGI: +$5,136 (reported on 15.3% of returns)
Here:
+$5,136
State:
+$9,326
(% of AGI for various income ranges: 0.2% for AGIs $50k-75k, 0.5% for AGIs $75k-100k, 1.1% for AGIs $100k-200k, 8.1% for AGIs over 200k)
Profit/loss from business: +$13,716 (reported on 11.0% of returns)
Here:
+$13,716
State:
+$11,523
(% of AGI for various income ranges: 4.2% for AGIs below $25k, 1.7% for AGIs $25k-50k, 1.7% for AGIs $50k-75k, 1.6% for AGIs $75k-100k, 2.6% for AGIs $100k-200k, 7.8% for AGIs over 200k)
Taxable individual retirement arrangement distribution: $12,039 (reported on 12.9% of returns)
48706:
$12,039
Michigan:
$15,298
(% of AGI for various income ranges: 3.4% for AGIs below $25k, 3.1% for AGIs $25k-50k, 3.3% for AGIs $50k-75k, 3.7% for AGIs $75k-100k, 3.4% for AGIs $100k-200k, 2.7% for AGIs over 200k)
Self-employment retirement plans: $23,314 (reported on 0.3% of returns)
48706:
$23,314
Michigan:
$20,834
Total itemized deductions: $18,765 (19% of AGI, reported on 24.4% of returns)
Here:
$18,765
State:
$21,628
Here:
18.7% of AGI
State:
18.4% of AGI
(% of AGI for various income ranges: 6.7% for AGIs below $25k, 7.9% for AGIs $25k-50k, 9.4% for AGIs $50k-75k, 9.4% for AGIs $75k-100k, 12.1% for AGIs $100k-200k, 10.6% for AGIs over 200k)
Charity contributions: $3,616 (reported on 20.6% of returns)
Here:
$3,616
State:
$4,225
(% of AGI for various income ranges: 0.6% for AGIs below $25k, 0.9% for AGIs $25k-50k, 1.3% for AGIs $50k-75k, 1.5% for AGIs $75k-100k, 2.1% for AGIs $100k-200k, 2.5% for AGIs over 200k)
Taxes paid: $6,742 (reported on 24.4% of returns)
48706:
$6,742
State:
$8,327
(% of AGI for various income ranges: 1.3% for AGIs below $25k, 2.0% for AGIs $25k-50k, 2.9% for AGIs $50k-75k, 3.3% for AGIs $75k-100k, 4.9% for AGIs $100k-200k, 5.3% for AGIs over 200k)
Earned income credit: $2,000 (reported on 16.8% of returns)
Here:
$2,000
State:
$2,306
(% of AGI for various income ranges: 4.9% for AGIs below $25k, 0.9% for AGIs $25k-50k)
Percentage of individuals using paid preparers for their 2012 taxes: 60.8%
Here:
61%
State:
57%
(% for various income ranges: 54.4% for AGIs below $25k, 62.0% for AGIs $25k-50k, 67.1% for AGIs $50k-75k, 67.2% for AGIs $75k-100k, 69.6% for AGIs $100k-200k, 90.9% for AGIs over 200k)
Averages for the 2004 tax year for zip code 48706, filed in 2005:
Average Adjusted Gross Income (AGI) in 2004: $41,519 (Individual Income Tax Returns)
Here:
$41,519
State:
$48,204
Salary/wage: $36,904 (reported on 83.2% of returns)
Here:
$36,904
State:
$42,791
(% of AGI for various income ranges: 107.4% for AGIs below $10k, 64.6% for AGIs $10k-25k, 72.4% for AGIs $25k-50k, 79.2% for AGIs $50k-75k, 82.2% for AGIs $75k-100k, 67.4% for AGIs over 100k)
Taxable interest for individuals: $1,658 (reported on 53.9% of returns)
This zip code:
$1,658
Michigan:
$1,725
(% of AGI for various income ranges: 7.1% for AGIs below $10k, 3.5% for AGIs $10k-25k, 1.9% for AGIs $25k-50k, 1.4% for AGIs $50k-75k, 1.4% for AGIs $75k-100k, 2.5% for AGIs over 100k)
Taxable dividends: $2,870 (reported on 27.2% of returns)
Here:
$2,870
State:
$3,420
(% of AGI for various income ranges: 4.0% for AGIs below $10k, 2.0% for AGIs $10k-25k, 1.3% for AGIs $25k-50k, 1.1% for AGIs $50k-75k, 0.9% for AGIs $75k-100k, 3.2% for AGIs over 100k)
Net capital gain/loss: +$2,940 (reported on 19.8% of returns)
Here:
+$2,940
State:
+$8,532
(% of AGI for various income ranges: -2.2% for AGIs below $10k, -0.0% for AGIs $10k-25k, 0.3% for AGIs $25k-50k, 0.8% for AGIs $50k-75k, 1.1% for AGIs $75k-100k, 3.5% for AGIs over 100k)
Profit/loss from business: +$10,308 (reported on 12.0% of returns)
Here:
+$10,308
State:
+$9,547
(% of AGI for various income ranges: 5.6% for AGIs below $10k, 3.0% for AGIs $10k-25k, 1.7% for AGIs $25k-50k, 1.5% for AGIs $50k-75k, 1.5% for AGIs $75k-100k, 5.6% for AGIs over 100k)
IRA payment deduction: $3,027 (reported on 2.2% of returns)
48706:
$3,027
Michigan:
$2,875
(% of AGI for various income ranges: 0.2% for AGIs below $10k, 0.2% for AGIs $10k-25k, 0.3% for AGIs $25k-50k, 0.2% for AGIs $50k-75k, 0.1% for AGIs $75k-100k, 0.1% for AGIs over 100k)
Self-employed pension: $16,225 (reported on 0.5% of returns)
Here:
$16,225
Michigan:
$13,826
(% of AGI for various income ranges: 0.0% for AGIs $25k-50k, 0.0% for AGIs $50k-75k, 0.1% for AGIs $75k-100k, 0.5% for AGIs over 100k)
Total itemized deductions: $15,833 (20% of AGI, reported on 31.0% of returns)
Here:
$15,833
State:
$18,509
Here:
20.3% of AGI
State:
20.7% of AGI
(% of AGI for various income ranges: 11.4% for AGIs below $10k, 8.1% for AGIs $10k-25k, 11.3% for AGIs $25k-50k, 12.2% for AGIs $50k-75k, 13.1% for AGIs $75k-100k, 12.4% for AGIs over 100k)
Charity contributions deductions: $2,881 (4% of AGI, reported on 28.5% of returns)
Here:
$2,881
State:
$3,365
Here:
3.6% of AGI
State:
3.6% of AGI
(% of AGI for various income ranges: 1.0% for AGIs below $10k, 1.2% for AGIs $10k-25k, 1.5% for AGIs $25k-50k, 1.8% for AGIs $50k-75k, 2.1% for AGIs $75k-100k, 2.8% for AGIs over 100k)
Total tax: $5,985 (reported on 74.8% of returns)
48706:
$5,985
State:
$7,691
(% of AGI for various income ranges: 2.3% for AGIs below $10k, 3.8% for AGIs $10k-25k, 6.7% for AGIs $25k-50k, 8.8% for AGIs $50k-75k, 10.4% for AGIs $75k-100k, 18.3% for AGIs over 100k)
Earned income credit: $1,662 (reported on 13.8% of returns)
Here:
$1,662
State:
$1,737
Percentage of individuals using paid preparers for their 2004 taxes: 64.6%
Here:
65%
State:
60%
(% for various income ranges: 55.4% for AGIs below $10k, 64.5% for AGIs $10k-25k, 65.9% for AGIs $25k-50k, 68.0% for AGIs $50k-75k, 69.7% for AGIs $75k-100k, 75.5% for AGIs over 100k)
Likely homosexual households (counted as self-reported same-sex unmarried-partner households)
Lesbian couples: 0.3% of all households
Gay men: 0.2% of all households
Household received Food Stamps/SNAP in the past 12 months: 2,108 Household did not receive Food Stamps/SNAP in the past 12 months: 15,323
Women who had a birth in the past 12 months: 439 (168 now married, 261 unmarried) Women who did not have a birth in the past 12 months: 7,399 (2,630 now married, 4,775 unmarried)
Housing units in zip code 48706 with a mortgage: 6,643 (464 second mortgage, 312 both second mortgage and home equity loan) Houses without a mortgage: 220
Median monthly owner costs for units with a mortgage: $1,163 Median monthly owner costs for units without a mortgage: $528
Residents with income below the poverty level in 2022:
This zip code:
16.5%
Whole state:
13.4%
Residents with income below 50% of the poverty level in 2022:
This zip code:
7.9%
Whole state:
6.9%
Median number of rooms in houses and condos:
Here:
6.2
State:
6.5
Median number of rooms in apartments:
Here:
4.4
State:
4.3
Notable locations in this zip code not listed on our city pages
4,048 married couples with children.
3,552 single-parent households (968 men, 2,584 women).
98.5% of residents of 48706 zip code speak English at home.
0.6% of residents speak Spanish at home (66% very well, 27% well, 7% not well).
0.9% of residents speak other Indo-European language at home (60% very well, 15% well, 19% not well, 6% not at all).
0.1% of residents speak Asian or Pacific Island language at home (5% very well, 95% not well).
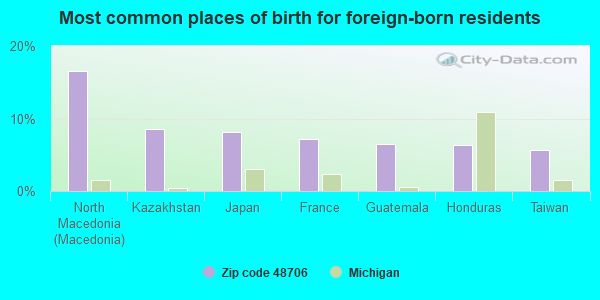
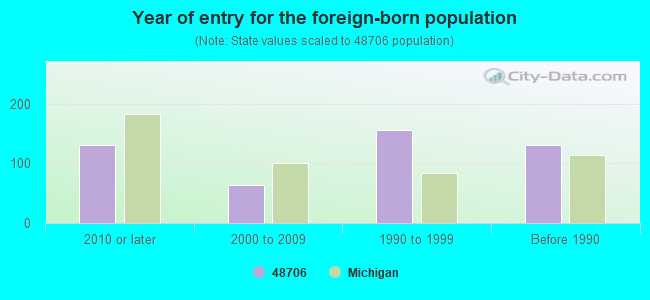
Foreign born population: 449 (1.1%) (70.1% of them are naturalized citizens)
Major facilities with environmental interests located in this zip code:
DOW CHEMICAL COMPANY (4868 EAST WILDER ROAD in BAY CITY, MI)
HAZARDOUS WASTE BIENNIAL REPORTER (Resource Conservation and Recovery Act (tracking hazardous waste)) - ICIS-05-2005-9900, FORMAL ENFORCEMENT ACTION TSD (Resource Conservation and Recovery Act (tracking hazardous waste)) - ICIS-05-2005-9900, FORMAL ENFORCEMENT ACTION TRI REPORTER (Tracking of toxic chemicals releasing facilities) Business SIC classification: UNSUPPORTED PLASTICS FILM AND SHEET Business NAICS classification: ALL OTHER BASIC ORGANIC CHEMICAL MANUFACTURING. Alternative names: DOW BRANDS, DOW CHEMICAL CO BAY CITY PLT, DOW CHEMICAL COMPANY BAY CITY TERMINAL
AEROSPACE AMERICA INC (900 S TRUMAN PKWY in BAY CITY, MI)
(Integrated Compliance Information System) - ICIS-05-2002-0109, FORMAL ENFORCEMENT ACTION (Resource Conservation and Recovery Act (tracking hazardous waste)) Business SIC classification: NONCLASSIFIABLE ESTABLISHMENTS Organizations: DORE ARTHUR P (CONTACT/OPERATOR)
DORE AND ASSOC CONTRACTING INC (900 S HARRY S TRUMAN PKY in BAY CITY, MI)
(Integrated Compliance Information System) - ICIS-05-1998-0554, FORMAL ENFORCEMENT ACTION (Resource Conservation and Recovery Act (tracking hazardous waste)) Business SIC classification: SPECIAL TRADE CONTRACTORS; NONCLASSIFIABLE ESTABLISHMENTS Business NAICS classification: OTHER WASTE COLLECTION. Organizations: DORE & ASSOCIATES CONTRACTING INC (CONTACT/OPERATOR)
BAY CITY PUBLIC SCHOOLS (910 N WALNUT ST in BAY CITY, MI)
(Integrated Compliance Information System) - ICIS-05-1985-0106, FORMAL ENFORCEMENT ACTION COMPLIANCE ACTIVITY (Tracking inspections of insecticide, fungicide, and rodenticide, and toxic substances) Business SIC classification: ELEMENTARY AND SECONDARY SCHOOLS Alternative names: BAY CITY PS
GOUGEON BROTHERS INCORPORATED (100 PATTERSON AVE. in BAY CITY, MI)
AIR MINOR (AIRS/AFS) ENFORCEMENT/COMPLIANCE ACTIVITY (Integrated Compliance Information System) COMPLIANCE ACTIVITY (Tracking inspections of insecticide, fungicide, and rodenticide, and toxic substances) Conditionally Exempt Small Quantity Generators, less than 100 kg/month of hazardous waste (Resource Conservation and Recovery Act (tracking hazardous waste)) TRI REPORTER (Tracking of toxic chemicals releasing facilities) Business SIC classification: PLASTICS MATERIALS, SYNTHETIC RESINS, AND NONVULCANIZABLE ELASTOMERS; PAINTS, VARNISHES, LACQUERS, ENAMELS, AND ALLIED PRODUCTS; NONCLASSIFIABLE ESTABLISHMENTS Organizations: GOUGEON HOLDING CO (CONTACT/OPERATOR)
BANGOR CENTRAL SCHOOL (208 STATE PARK DRIVE in BAY CITY, MI)
(Geographic Names Information System) (National Center for Education Statistics) - STATE ID-00186 Organizations: BANGOR TOWNSHIP SCHOOLS (SCHOOL DISTRICT)
BANGOR LINCOLN SCHOOL (2771 N. EUCLID AVENUE in BAY CITY, MI)
(Geographic Names Information System) (National Center for Education Statistics) - STATE ID-00191 Organizations: BANGOR TOWNSHIP SCHOOLS (SCHOOL DISTRICT)
BAY COUNTY PSA (1110 STATE STREET in BAY CITY, MI)
(National Center for Education Statistics) - STATE ID-08856
EASTSIDE MIDDLE SCHOOL (201 WOODSIDE LANE in BAY CITY, MI)
(National Center for Education Statistics) - STATE ID-00804 Organizations: BAY CITY SCHOOL DISTRICT (SCHOOL DISTRICT)
CHRISTA MCAULIFFE MIDDLE SCHOOL (3281 E. KIESEL ROAD in BAY CITY, MI)
(National Center for Education Statistics) - STATE ID-00190 Organizations: BANGOR TOWNSHIP SCHOOLS (SCHOOL DISTRICT)
BANGOR NORTH PRESCHOOL AND DAY CARE (504 REVILO DRIVE in BAY CITY, MI)
(National Center for Education Statistics) - STATE ID-00192 Organizations: BANGOR TOWNSHIP SCHOOLS (SCHOOL DISTRICT)
BANGOR WEST CENTRAL SCHOOL (3175 E. WILDER ROAD in BAY CITY, MI)
(National Center for Education Statistics) - STATE ID-00194 Organizations: BANGOR TOWNSHIP SCHOOLS (SCHOOL DISTRICT)
CENTRAL MICHIGAN RAILWAY CO BAY CITY YARD (3688 NORTH EUCLID STREET in BAY CITY, MI)
National Pollutant Discharge Elimination System NON-MAJOR (Tracking pollutant discharge elimination systems) - permit Business SIC classification: RAILROAD SWITCHING AND TERMINAL ESTABLISHMENTS Organizations: TOWN 4N (CONTACT/OPERATOR)
Housing units lacking complete plumbing facilities: 0.7% Housing units lacking complete kitchen facilities: 1.4%
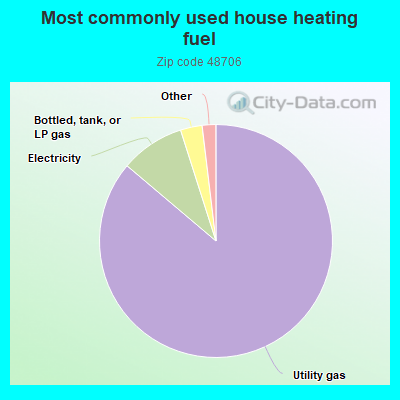
86.1%Utility gas
8.9%Electricity
3.0%Bottled, tank, or LP gas
0.7%Wood
0.7%Other fuel
Population in 1990: 41,677.
Place of birth for U.S.-born residents:
This state: 35,288
Northeast: 438
Midwest: 1,190
South: 1,086
West: 511
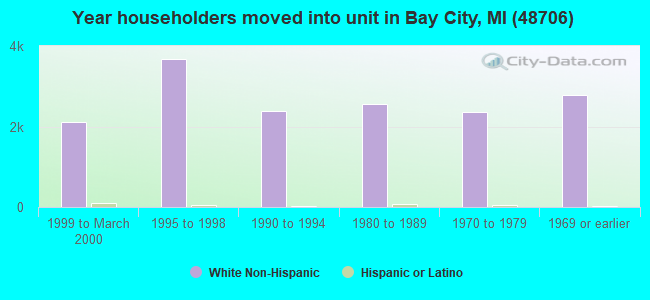
65% of the 48706 zip code residents lived in the same house 5 years ago. Out of people who lived in different houses, 72% lived in this county. Out of people who lived in different counties, 50% lived in Michigan.
92% of the 48706 zip code residents lived in the same house 1 year ago. Out of people who lived in different houses, 57% moved from this county. Out of people who lived in different houses, 30% moved from different county within same state. Out of people who lived in different houses, 9% moved from different state. Out of people who lived in different houses, 3% moved from abroad.
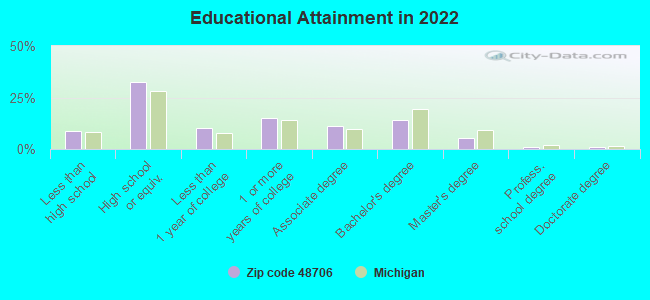
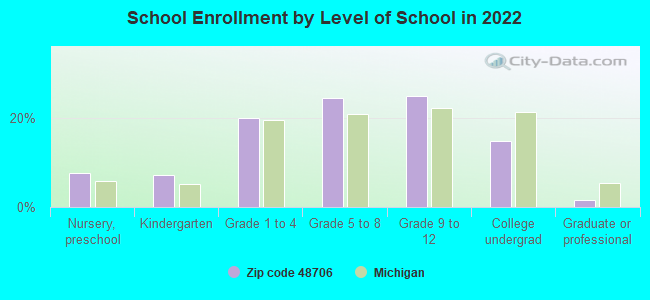
Private vs. public school enrollment:
Students in private schools in grades 1 to 8 (elementary and middle school): 568
Here:
16.3%
Michigan:
12.4%
Students in private schools in grades 9 to 12 (high school): 148
Here:
7.6%
Michigan:
9.8%
Students in private undergraduate colleges: 126
Here:
10.9%
Michigan:
14.9%
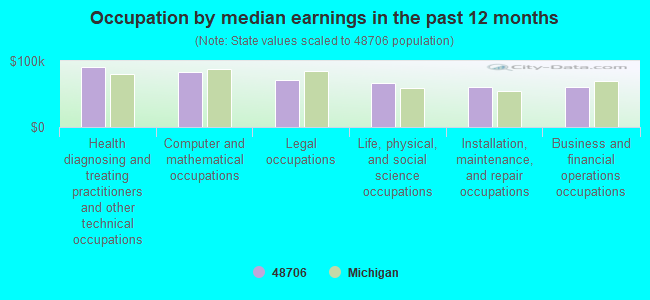
Occupation by median earnings in the past 12 months ($)
90,971Health diagnosing and treating practitioners and other technical occupations
84,029Computer and mathematical occupations
70,961Legal occupations
66,784Life, physical, and social science occupations
61,120Installation, maintenance, and repair occupations
61,113Business and financial operations occupations
Companies with federal contracts located in this zip code (BAY CITY, MI):
BAY CARBON INC (800 MARQUETTE ST; small business) : $1,712,767 in 25 contractsfrom 1999 to 2006
Contracts for Electrical Contact Brushes and Electrodes by Defense Logistics Agency Signed by year:2000: $282,513; 2001: $617,738; 2002: $338,290; 2003: $0; 2004: $0; 2005: $291,391; 2006: $75,885.
Biggest contracts:
$192,214 with Defense Logistics Agency for Electrical Contact Brushes and Electrodes. Signed on 2005-08-18. Completion date: 2005-12-16.
$141,900, same as above.Signed on 2001-09-28. Completion date: 2002-01-26.
$132,000, same as above.Signed on 2002-04-25. Completion date: 2002-08-23.
$128,613, same as above.Signed on 2001-06-20. Completion date: 2001-10-18.
DORE & ASSOCIATES CONTRACTING, (900 HARRY S TRUMAN PKWY) : $608,441 in 6 contractsfrom 1999 to 2004
Contracts for Construction of Structures and Facilities -- Other Non-Building Facilities, Maintenance, Repair or Alteration of Real Property -- Miscellaneous Buildings by Air Force, United States Coast Guard (disused code: now 7008), Bureau of Prisoners/Federal Prison System Signed by year:2000: $15,000; 2001: $0; 2002: $0; 2003: $492,015; 2004: $35,426; 2005: $0; 2006: $0.
Biggest contracts:
$473,120 with Air Force for Construction of Structures and Facilities -- Other Non-Building Facilities. Signed on 2003-06-09. Completion date: 2003-11-10.
$66,000 with United States Coast Guard (disused code: now 7008) for Maintenance, Repair or Alteration of Real Property -- Miscellaneous Buildings. Signed on 1999-11-15. Completion date: 2000-05-15.
$35,426 with Air Force for Construction of Structures and Facilities -- Other Non-Building Facilities. Signed on 2004-09-11. Completion date: 2004-06-30.
$18,895, same as above.Signed on 2003-10-10. Completion date: 2003-12-05.
BAY COUNTY LAWN INC (1616 TECH DR; small business) : $149,208 in 4 contractsfrom 2003 to 2006
$46,950 with Army for Landscaping/Groundskeeping Services. Signed on 2005-04-15. Completion date: 2005-09-01.
$40,000 with Army for Food Services. Signed on 2004-05-09. Completion date: 2004-06-30.
$39,950 with Army for Landscaping/Groundskeeping Services. Signed on 2006-04-28. Completion date: 2006-09-01.
$22,308, same as above.Signed on 2003-04-22. Completion date: 2003-10-22.
BROTHERS FABRICATION LLC (4441 ACE COMMERCIAL COURT; small business) : $62,851 in 3 contractsin 2005
$28,825 with Defense Logistics Agency for Motor Vehicle Maintenance and Repair Shop Specialized Equipment. Signed on 2005-04-23. Completion date: 2005-10-10.
$21,961 with Defense Logistics Agency for Vehicular Furniture and Accessories. Signed on 2005-04-14. Completion date: 2005-07-12.
$12,065, same as above.Signed on 2005-03-16. Completion date: 2005-06-09.
THARALDSON PROPERTY MANAGEMENT (4105 WILDER RD) : $40,053 in 6 contractsfrom 2003 to 2004
Contracts for Lodging - Hotel/Motel by Army Signed by year:2000: $0; 2001: $0; 2002: $0; 2003: $32,112; 2004: $7,941; 2005: $0; 2006: $0.
Biggest contracts:
$12,045 with Army for Lodging - Hotel/Motel. Signed on 2003-05-01. Completion date: 2003-02-21.
$12,045, same as above.Signed on 2003-05-01. Completion date: 2003-02-21.
$8,910, same as above.Signed on 2004-10-13. Completion date: 2004-10-19.
$7,069, same as above.Signed on 2003-02-21. Completion date: 2003-02-21.
GLOBALHVACR SUPPLY LLC (214 S HENRY ST; small business) : $39,274 in 5 contractsin 2006
Contracts for Pressure, Temperature, and Humidity Measuring and Controlling Instruments, Refrigeration and Air Conditioning Components by Defense Logistics Agency Signed by year:2000: $0; 2001: $0; 2002: $0; 2003: $0; 2004: $0; 2005: $0; 2006: $39,274.
Biggest contracts:
$21,149 with Defense Logistics Agency for Pressure, Temperature, and Humidity Measuring and Controlling Instruments. Taking place in CA. Signed on 2006-05-06. Completion date: 2006-11-06.
$7,130 with Defense Logistics Agency for Pressure, Temperature, and Humidity Measuring and Controlling Instruments. Signed on 2006-01-24. Completion date: 2006-02-23.
$4,778, same as above.Signed on 2006-06-14. Completion date: 2006-08-13.
$3,549 with Defense Logistics Agency for Refrigeration and Air Conditioning Components. Signed on 2006-06-29. Completion date: 2006-08-14.
THE LOGAN GROUP, INC (214 S HENRY ST #2, 2ND FL)
$25,359 with Defense Logistics Agency for Centrifugals, Separators, and Pressure and Vacuum Filters. Taking place in FL. Signed on 2004-08-25. Completion date: 2004-10-08.
TEMPERATURE SUPPLY, INC (214 S HENRY ST #2, 2ND FL; small business) : $12,520 in 4 contractsfrom 2005 to 2006
$4,661 with Defense Logistics Agency for Power and Hand Pumps. Signed on 2005-10-26. Completion date: 2005-11-25.
$4,649 with Defense Logistics Agency for Refrigeration and Air Conditioning Components. Signed on 2005-12-06. Completion date: 2006-01-16.
$3,210 with Defense Logistics Agency for Motors, Electrical. Signed on 2006-05-04. Completion date: 2006-06-02.
$0, same as above.Signed on 2006-05-04. Completion date: 2006-06-02.
RECROOMS COM, INC (333 MORTON STREET)
$9,800 with Army for Recreational and Gymnastic Equipment. Signed on 2004-02-10. Completion date: 2004-04-01.
Top industries in this zip code by the number of employees in 2005:
Administrative and Support and Waste Management and Remediation Services: Professional Employer Organizations (250-499: 1, 100-249: 1, 50-99: 2, 10-19: 1, 1-4: 2)
Administrative and Support and Waste Management and Remediation Services: Temporary Help Services (100-249: 2, 10-19: 2, 1-4: 1)
People in group quarters in 2010:
294 people in nursing facilities/skilled-nursing facilities
125 people in group homes intended for adults
32 people in other noninstitutional facilities
25 people in residential treatment centers for adults
15 people in in-patient hospice facilities
3 people in correctional residential facilities
People in group quarters in 2000:
274 people in nursing homes
78 people in other group homes
61 people in homes for the mentally retarded
38 people in homes for the mentally ill
38 people in other noninstitutional group quarters
4 people in homes for the physically handicapped
Home Mortgage Disclosure Act Aggregated Statistics For Year 2009 (Based on 5 full and 14 partial tracts)
A) FHA, FSA/RHS & VA Home Purchase Loans
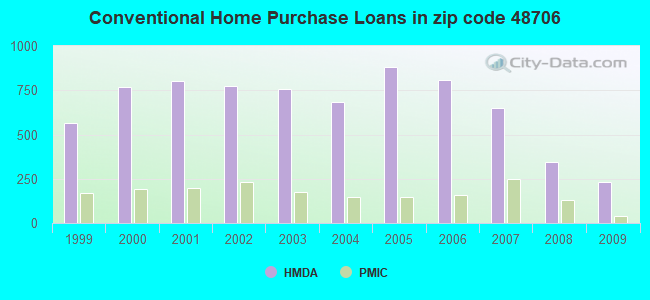
B) Conventional Home Purchase Loans
C) Refinancings
D) Home Improvement Loans
E) Loans on Dwellings For 5+ Families
F) Non-occupant Loans on < 5 Family Dwellings (A B C & D)
G) Loans On Manufactured Home Dwelling (A B C & D)
Number
Average Value
Number
Average Value
Number
Average Value
Number
Average Value
Number
Average Value
Number
Average Value
Number
Average Value
LOANS ORIGINATED
184
$90,790
231
$105,195
975
$109,931
128
$31,163
4
$115,935
61
$65,900
36
$40,209
APPLICATIONS APPROVED, NOT ACCEPTED
5
$72,180
8
$88,250
74
$117,760
12
$22,214
0
$0
5
$122,524
4
$41,862
APPLICATIONS DENIED
50
$82,289
52
$57,380
358
$115,655
50
$19,204
0
$0
25
$45,789
30
$32,163
APPLICATIONS WITHDRAWN
29
$89,143
34
$105,834
199
$125,435
7
$45,486
0
$0
9
$91,123
3
$93,557
FILES CLOSED FOR INCOMPLETENESS
6
$90,783
4
$108,760
37
$100,608
3
$59,473
0
$0
0
$0
2
$43,725
Aggregated Statistics For Year 2008 (Based on 5 full and 14 partial tracts)
A) FHA, FSA/RHS & VA Home Purchase Loans
B) Conventional Home Purchase Loans
C) Refinancings
D) Home Improvement Loans
E) Loans on Dwellings For 5+ Families
F) Non-occupant Loans on < 5 Family Dwellings (A B C & D)
G) Loans On Manufactured Home Dwelling (A B C & D)
Number
Average Value
Number
Average Value
Number
Average Value
Number
Average Value
Number
Average Value
Number
Average Value
Number
Average Value
LOANS ORIGINATED
227
$85,459
344
$95,556
707
$99,362
189
$27,078
4
$133,970
88
$69,831
43
$35,423
APPLICATIONS APPROVED, NOT ACCEPTED
13
$127,784
26
$95,745
97
$99,872
22
$43,625
0
$0
15
$79,218
7
$23,180
APPLICATIONS DENIED
64
$90,685
98
$60,085
438
$105,364
124
$26,172
3
$1,651,627
36
$79,514
72
$30,930
APPLICATIONS WITHDRAWN
28
$82,951
27
$101,366
163
$114,720
10
$16,396
3
$2,162,930
7
$58,110
5
$44,768
FILES CLOSED FOR INCOMPLETENESS
3
$44,867
13
$92,273
40
$130,102
2
$216,560
0
$0
4
$82,250
0
$0
Aggregated Statistics For Year 2007 (Based on 5 full and 14 partial tracts)
A) FHA, FSA/RHS & VA Home Purchase Loans
B) Conventional Home Purchase Loans
C) Refinancings
D) Home Improvement Loans
E) Loans on Dwellings For 5+ Families
F) Non-occupant Loans on < 5 Family Dwellings (A B C & D)
G) Loans On Manufactured Home Dwelling (A B C & D)
Number
Average Value
Number
Average Value
Number
Average Value
Number
Average Value
Number
Average Value
Number
Average Value
Number
Average Value
LOANS ORIGINATED
138
$86,987
651
$96,423
961
$94,494
221
$31,565
0
$0
86
$83,302
59
$44,927
APPLICATIONS APPROVED, NOT ACCEPTED
9
$117,848
98
$94,301
181
$98,683
33
$19,512
0
$0
11
$46,161
18
$30,732
APPLICATIONS DENIED
21
$93,614
168
$61,443
610
$103,014
196
$42,830
0
$0
43
$49,622
67
$35,896
APPLICATIONS WITHDRAWN
21
$86,676
53
$85,444
221
$102,452
25
$60,470
2
$43,110
14
$67,751
6
$69,160
FILES CLOSED FOR INCOMPLETENESS
4
$93,708
15
$91,119
80
$97,656
4
$142,428
0
$0
7
$93,707
0
$0
Aggregated Statistics For Year 2006 (Based on 5 full and 14 partial tracts)
A) FHA, FSA/RHS & VA Home Purchase Loans
B) Conventional Home Purchase Loans
C) Refinancings
D) Home Improvement Loans
E) Loans on Dwellings For 5+ Families
F) Non-occupant Loans on < 5 Family Dwellings (A B C & D)
G) Loans On Manufactured Home Dwelling (A B C & D)
Number
Average Value
Number
Average Value
Number
Average Value
Number
Average Value
Number
Average Value
Number
Average Value
Number
Average Value
LOANS ORIGINATED
184
$87,932
807
$92,279
1,324
$85,463
317
$29,588
3
$165,817
173
$88,058
84
$45,560
APPLICATIONS APPROVED, NOT ACCEPTED
14
$75,905
111
$76,784
202
$100,809
33
$48,178
0
$0
23
$83,880
15
$51,969
APPLICATIONS DENIED
18
$87,819
199
$76,068
737
$98,873
146
$40,024
0
$0
46
$87,998
63
$34,110
APPLICATIONS WITHDRAWN
12
$114,632
60
$96,495
408
$103,432
48
$65,966
0
$0
18
$124,205
6
$51,032
FILES CLOSED FOR INCOMPLETENESS
8
$93,495
12
$73,582
169
$112,561
4
$61,210
0
$0
9
$63,171
2
$72,425
Aggregated Statistics For Year 2005 (Based on 5 full and 14 partial tracts)
A) FHA, FSA/RHS & VA Home Purchase Loans
B) Conventional Home Purchase Loans
C) Refinancings
D) Home Improvement Loans
E) Loans on Dwellings For 5+ Families
F) Non-occupant Loans on < 5 Family Dwellings (A B C & D)
G) Loans On Manufactured Home Dwelling (A B C & D)
Number
Average Value
Number
Average Value
Number
Average Value
Number
Average Value
Number
Average Value
Number
Average Value
Number
Average Value
LOANS ORIGINATED
155
$87,011
882
$96,398
1,412
$92,687
303
$28,147
1
$160,000
155
$76,957
59
$35,293
APPLICATIONS APPROVED, NOT ACCEPTED
7
$79,656
128
$83,403
253
$99,861
26
$117,990
0
$0
22
$57,124
14
$35,436
APPLICATIONS DENIED
31
$77,993
197
$58,781
812
$97,081
177
$46,833
0
$0
52
$71,880
76
$29,865
APPLICATIONS WITHDRAWN
10
$85,228
105
$179,797
475
$115,871
59
$123,475
0
$0
13
$58,837
5
$50,480
FILES CLOSED FOR INCOMPLETENESS
0
$0
20
$80,560
268
$101,890
9
$65,898
0
$0
11
$85,295
0
$0
Aggregated Statistics For Year 2004 (Based on 5 full and 14 partial tracts)
A) FHA, FSA/RHS & VA Home Purchase Loans
B) Conventional Home Purchase Loans
C) Refinancings
D) Home Improvement Loans
E) Loans on Dwellings For 5+ Families
F) Non-occupant Loans on < 5 Family Dwellings (A B C & D)
G) Loans On Manufactured Home Dwelling (A B C & D)
Number
Average Value
Number
Average Value
Number
Average Value
Number
Average Value
Number
Average Value
Number
Average Value
Number
Average Value
LOANS ORIGINATED
220
$92,153
683
$105,515
1,611
$91,235
356
$33,652
0
$0
177
$72,741
50
$54,647
APPLICATIONS APPROVED, NOT ACCEPTED
7
$82,640
89
$95,845
256
$87,635
39
$30,246
1
$144,000
23
$79,616
21
$44,647
APPLICATIONS DENIED
44
$75,005
132
$80,592
722
$89,822
134
$31,962
0
$0
51
$61,629
50
$41,324
APPLICATIONS WITHDRAWN
29
$78,099
59
$110,423
381
$100,858
15
$42,726
1
$115,000
23
$99,853
7
$90,754
FILES CLOSED FOR INCOMPLETENESS
1
$145,000
15
$94,229
186
$109,957
20
$50,158
0
$0
6
$106,180
0
$0
Aggregated Statistics For Year 2003 (Based on 5 full and 14 partial tracts)
A) FHA, FSA/RHS & VA Home Purchase Loans
B) Conventional Home Purchase Loans
C) Refinancings
D) Home Improvement Loans
E) Loans on Dwellings For 5+ Families
F) Non-occupant Loans on < 5 Family Dwellings (A B C & D)
Number
Average Value
Number
Average Value
Number
Average Value
Number
Average Value
Number
Average Value
Number
Average Value
LOANS ORIGINATED
241
$88,419
759
$101,720
3,698
$94,139
251
$22,321
4
$471,750
193
$66,801
APPLICATIONS APPROVED, NOT ACCEPTED
7
$92,621
85
$115,734
380
$98,029
27
$22,248
0
$0
33
$68,750
APPLICATIONS DENIED
11
$121,965
131
$52,834
742
$80,151
101
$18,565
0
$0
28
$65,733
APPLICATIONS WITHDRAWN
31
$98,653
45
$107,477
371
$95,344
4
$53,638
1
$500,000
9
$105,459
FILES CLOSED FOR INCOMPLETENESS
8
$91,920
19
$91,558
97
$89,299
5
$41,428
0
$0
2
$43,055
Aggregated Statistics For Year 2002 (Based on 5 full and 14 partial tracts)
A) FHA, FSA/RHS & VA Home Purchase Loans
B) Conventional Home Purchase Loans
C) Refinancings
D) Home Improvement Loans
F) Non-occupant Loans on < 5 Family Dwellings (A B C & D)
Number
Average Value
Number
Average Value
Number
Average Value
Number
Average Value
Number
Average Value
LOANS ORIGINATED
221
$81,352
772
$94,635
2,782
$92,318
344
$16,748
178
$68,772
APPLICATIONS APPROVED, NOT ACCEPTED
8
$66,655
71
$92,628
342
$94,917
27
$18,229
25
$97,664
APPLICATIONS DENIED
7
$79,947
140
$40,104
538
$75,901
81
$25,638
31
$67,556
APPLICATIONS WITHDRAWN
8
$63,695
48
$91,048
378
$77,193
24
$17,634
5
$59,538
FILES CLOSED FOR INCOMPLETENESS
2
$48,555
18
$118,616
106
$93,373
1
$30,000
3
$115,930
Aggregated Statistics For Year 2001 (Based on 5 full and 14 partial tracts)
A) FHA, FSA/RHS & VA Home Purchase Loans
B) Conventional Home Purchase Loans
C) Refinancings
D) Home Improvement Loans
E) Loans on Dwellings For 5+ Families
F) Non-occupant Loans on < 5 Family Dwellings (A B C & D)
Number
Average Value
Number
Average Value
Number
Average Value
Number
Average Value
Number
Average Value
Number
Average Value
LOANS ORIGINATED
264
$75,014
800
$95,793
2,146
$84,007
505
$19,505
5
$571,844
109
$62,309
APPLICATIONS APPROVED, NOT ACCEPTED
17
$85,335
86
$80,159
269
$81,573
72
$28,450
1
$975,000
14
$55,950
APPLICATIONS DENIED
8
$64,991
158
$40,730
602
$70,284
139
$14,247
2
$1,625,820
33
$43,261
APPLICATIONS WITHDRAWN
13
$66,415
45
$76,146
276
$72,743
15
$12,551
1
$1,063,000
6
$56,413
FILES CLOSED FOR INCOMPLETENESS
2
$54,050
15
$139,703
87
$71,364
4
$26,500
0
$0
4
$82,785
Aggregated Statistics For Year 2000 (Based on 5 full and 14 partial tracts)
A) FHA, FSA/RHS & VA Home Purchase Loans
B) Conventional Home Purchase Loans
C) Refinancings
D) Home Improvement Loans
E) Loans on Dwellings For 5+ Families
F) Non-occupant Loans on < 5 Family Dwellings (A B C & D)
Number
Average Value
Number
Average Value
Number
Average Value
Number
Average Value
Number
Average Value
Number
Average Value
LOANS ORIGINATED
155
$73,975
767
$85,796
876
$63,631
443
$16,097
2
$696,780
96
$55,314
APPLICATIONS APPROVED, NOT ACCEPTED
10
$65,795
92
$51,994
189
$59,169
84
$22,098
0
$0
14
$32,537
APPLICATIONS DENIED
9
$57,588
316
$34,984
430
$58,849
178
$15,625
0
$0
31
$38,292
APPLICATIONS WITHDRAWN
11
$71,177
60
$96,198
276
$61,508
45
$46,641
0
$0
16
$38,766
FILES CLOSED FOR INCOMPLETENESS
0
$0
6
$158,458
82
$66,450
6
$46,933
0
$0
2
$54,965
Aggregated Statistics For Year 1999 (Based on 4 full and 7 partial tracts)
A) FHA, FSA/RHS & VA Home Purchase Loans
B) Conventional Home Purchase Loans
C) Refinancings
D) Home Improvement Loans
F) Non-occupant Loans on < 5 Family Dwellings (A B C & D)
2002 - 2018 National Fire Incident Reporting System (NFIRS) incidents
Based on the data from the years 2002 - 2018 the average number of fires per year is 116. The highest number of fires - 202 took place in 2003, and the least - 56 in 2005. The data has a declining trend.
When looking into fire subcategories, the most incidents belonged to: Structure Fires (43.4%), and Outside Fires (31.7%).
Fire incident types reported to NFIRS in Zip Code 48706
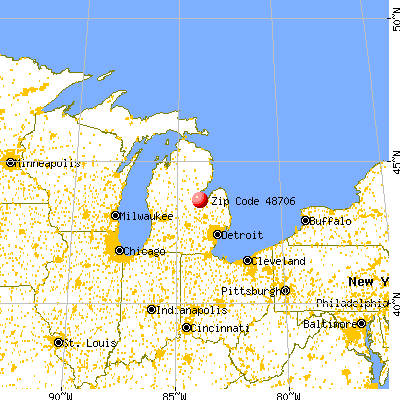


 Nearest zip codes: 48710, 48631, 48604, 48708, 48724, 48611.
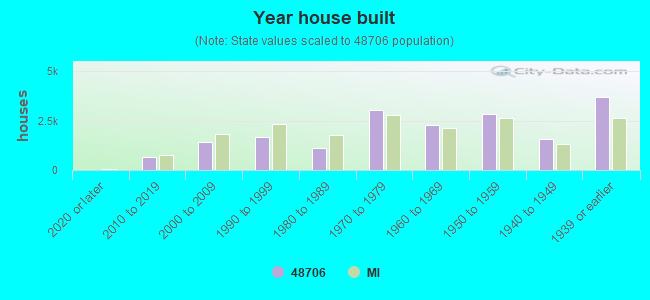


 Based on the data from the years 2002 - 2018 the average number of fires per year is 116. The highest number of fires - 202 took place in 2003, and the least - 56 in 2005. The data has a declining trend.
 When looking into fire subcategories, the most incidents belonged to: Structure Fires (43.4%), and Outside Fires (31.7%).