Estimated zip code population in 2022: 29,961 Zip code population in 2010: 29,128 Zip code population in 2000: 28,881
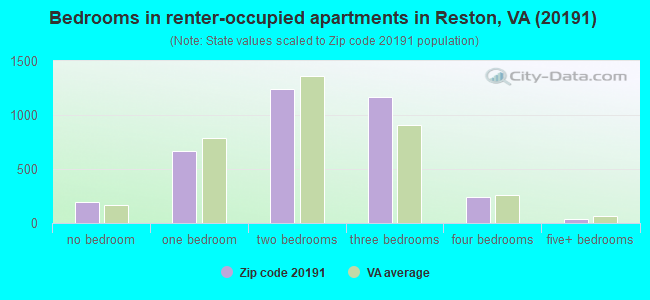
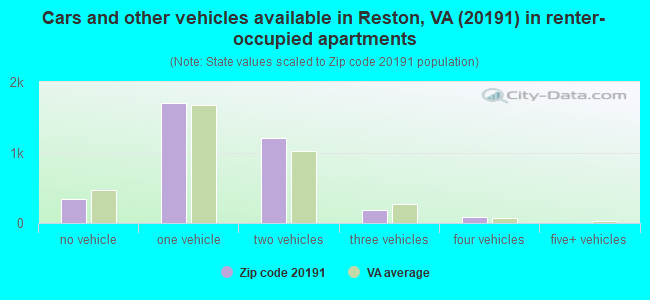
Houses and condos: 12,677 Renter-occupied apartments: 3,541
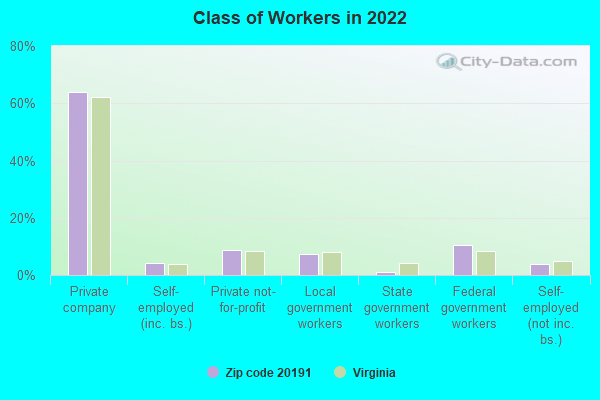
% of renters here:
29%
State:
33%
March 2022 cost of living index in zip code 20191: 163.6 (very high, U.S. average is 100)
Land area: 8.2 sq. mi. Water area: 0.2 sq. mi.
Population density: 3,643 people per square mile
(average).
OSM Map
General Map
Google Map
MSN Map
OSM Map
General Map
Google Map
MSN Map
OSM Map
General Map
Google Map
MSN Map
OSM Map
General Map
Google Map
MSN Map
Please wait while loading the map...
Real estate property taxes paid for housing units in 2022:
This zip code:
1.0% ($6,190)
Virginia:
0.7% ($2,617)
Median real estate property taxes paid for housing units with mortgages in 2022: $5,902 (1.0%) Median real estate property taxes paid for housing units with no mortgage in 2022: $7,133 (1.1%)
Estimated median house/condo value in 2022: $626,791
20191:
$626,791
Virginia:
$365,700
According to our research of Virginia and other state lists, there were 23 registered sex offenders living in 20191 zip code as of June 10, 2024. The ratio of all residents to sex offenders in zip code 20191 is 1,308 to 1. The ratio of registered sex offenders to all residents in this zip code is much lower than the state average.
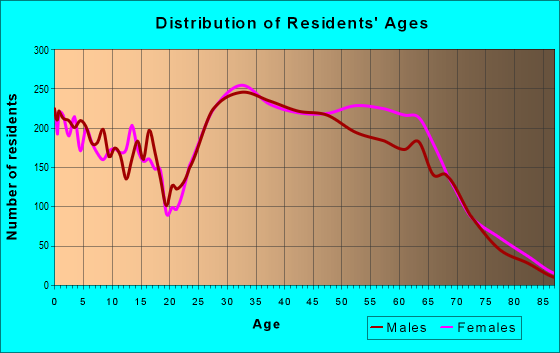
Median resident age:
This zip code:
39.6 years
Virginia median age:
39.0 years
Average household size:
This zip code:
2.5 people
Virginia:
2.5 people
Averages for the 2020 tax year for zip code 20191, filed in 2021:
Average Adjusted Gross Income (AGI) in 2020: $114,672 (Individual Income Tax Returns)
Here:
$114,672
State:
$86,446
Salary/wage: $98,639 (reported on 82.7% of returns)
Here:
$98,639
State:
$71,185
(% of AGI for various income ranges: 1214.8% for AGIs below $25k, 3794.6% for AGIs $25k-50k, 6789.6% for AGIs $50k-75k, 9514.5% for AGIs $75k-100k, 19009.3% for AGIs $100k-200k, 70361.6% for AGIs over 200k)
Taxable interest for individuals: $1,746 (reported on 41.5% of returns)
This zip code:
$1,746
Virginia:
$1,805
(% of AGI for various income ranges: 14.6% for AGIs below $25k, 17.9% for AGIs $25k-50k, 43.2% for AGIs $50k-75k, 65.3% for AGIs $75k-100k, 148.1% for AGIs $100k-200k, 760.4% for AGIs over 200k)
Ordinary dividends: $7,859 (reported on 33.9% of returns)
Here:
$7,859
State:
$8,327
(% of AGI for various income ranges: 32.9% for AGIs below $25k, 55.4% for AGIs $25k-50k, 133.8% for AGIs $50k-75k, 188.6% for AGIs $75k-100k, 488.7% for AGIs $100k-200k, 3140.6% for AGIs over 200k)
Net capital gain/loss in AGI: +$17,788 (reported on 31.8% of returns)
Here:
+$17,788
State:
+$24,644
(% of AGI for various income ranges: 19.7% for AGIs below $25k, 56.8% for AGIs $25k-50k, 117.4% for AGIs $50k-75k, 233.5% for AGIs $75k-100k, 653.2% for AGIs $100k-200k, 8464.8% for AGIs over 200k)
Profit/loss from business: +$21,117 (reported on 19.6% of returns)
Here:
+$21,117
State:
+$12,836
(% of AGI for various income ranges: 234.7% for AGIs below $25k, 197.1% for AGIs $25k-50k, 198.4% for AGIs $50k-75k, 326.5% for AGIs $75k-100k, 605.1% for AGIs $100k-200k, 4499.1% for AGIs over 200k)
Taxable individual retirement arrangement distribution: $26,454 (reported on 10.0% of returns)
20191:
$26,454
Virginia:
$21,535
(% of AGI for various income ranges: 33.0% for AGIs below $25k, 100.4% for AGIs $25k-50k, 197.1% for AGIs $50k-75k, 349.5% for AGIs $75k-100k, 770.0% for AGIs $100k-200k, 1957.0% for AGIs over 200k)
Self-employed (Keogh) retirement plans: $27,908 (reported on 1.6% of returns)
20191:
$27,908
Virginia:
$31,172
(% of AGI for various income ranges: 32.4% for AGIs $50k-75k, 46.4% for AGIs $100k-200k, 673.0% for AGIs over 200k)
Total itemized deductions: $29,261 (reported on 24.9% of returns)
Here:
$29,261
State:
$33,287
(% of AGI for various income ranges: 82.1% for AGIs below $25k, 234.5% for AGIs $25k-50k, 588.3% for AGIs $50k-75k, 1040.9% for AGIs $75k-100k, 1932.4% for AGIs $100k-200k, 5764.3% for AGIs over 200k)
Charity contributions: $6,478 (reported on 19.6% of returns)
Here:
$6,478
State:
$10,381
(% of AGI for various income ranges: 6.0% for AGIs below $25k, 26.4% for AGIs $25k-50k, 63.2% for AGIs $50k-75k, 128.1% for AGIs $75k-100k, 270.3% for AGIs $100k-200k, 1369.6% for AGIs over 200k)
Taxes paid: $9,034 (reported on 24.9% of returns)
20191:
$9,034
State:
$8,284
(% of AGI for various income ranges: 17.7% for AGIs below $25k, 58.7% for AGIs $25k-50k, 172.8% for AGIs $50k-75k, 356.6% for AGIs $75k-100k, 670.6% for AGIs $100k-200k, 1608.5% for AGIs over 200k)
Earned income credit: $2,104 (reported on 8.5% of returns)
Here:
$2,104
State:
$2,214
(% of AGI for various income ranges: 77.2% for AGIs below $25k, 56.6% for AGIs $25k-50k, 1.0% for AGIs $50k-75k)
Percentage of individuals using paid preparers for their 2020 taxes: 90.7%
Here:
91%
State:
92%
(% for various income ranges: 86.0% for AGIs below $25k, 92.0% for AGIs $25k-50k, 91.5% for AGIs $50k-75k, 92.5% for AGIs $75k-100k, 91.8% for AGIs $100k-200k, 92.6% for AGIs over 200k)
Averages for the 2012 tax year for zip code 20191, filed in 2013:
Average Adjusted Gross Income (AGI) in 2012: $96,741 (Individual Income Tax Returns)
Here:
$96,741
State:
$71,192
Salary/wage: $82,122 (reported on 86.3% of returns)
Here:
$82,122
State:
$59,229
(% of AGI for various income ranges: 81.5% for AGIs below $25k, 84.9% for AGIs $25k-50k, 81.0% for AGIs $50k-75k, 79.1% for AGIs $75k-100k, 76.8% for AGIs $100k-200k, 64.4% for AGIs over 200k)
Taxable interest for individuals: $1,300 (reported on 45.1% of returns)
This zip code:
$1,300
Virginia:
$1,600
(% of AGI for various income ranges: 0.8% for AGIs below $25k, 0.5% for AGIs $25k-50k, 0.6% for AGIs $50k-75k, 0.6% for AGIs $75k-100k, 0.5% for AGIs $100k-200k, 0.7% for AGIs over 200k)
Ordinary dividends: $5,906 (reported on 32.0% of returns)
Here:
$5,906
State:
$6,959
(% of AGI for various income ranges: 1.8% for AGIs below $25k, 1.1% for AGIs $25k-50k, 1.4% for AGIs $50k-75k, 1.6% for AGIs $75k-100k, 1.7% for AGIs $100k-200k, 2.5% for AGIs over 200k)
Net capital gain/loss in AGI: +$13,009 (reported on 26.1% of returns)
Here:
+$13,009
State:
+$16,672
(% of AGI for various income ranges: 0.3% for AGIs $25k-50k, 0.3% for AGIs $50k-75k, 0.4% for AGIs $75k-100k, 1.2% for AGIs $100k-200k, 7.9% for AGIs over 200k)
Profit/loss from business: +$25,002 (reported on 18.0% of returns)
Here:
+$25,002
State:
+$14,116
(% of AGI for various income ranges: 12.4% for AGIs below $25k, 4.3% for AGIs $25k-50k, 2.4% for AGIs $50k-75k, 3.3% for AGIs $75k-100k, 3.2% for AGIs $100k-200k, 6.2% for AGIs over 200k)
Taxable individual retirement arrangement distribution: $24,667 (reported on 10.6% of returns)
20191:
$24,667
Virginia:
$16,667
(% of AGI for various income ranges: 2.2% for AGIs below $25k, 1.7% for AGIs $25k-50k, 2.5% for AGIs $50k-75k, 2.5% for AGIs $75k-100k, 3.1% for AGIs $100k-200k, 2.7% for AGIs over 200k)
Self-employment retirement plans: $19,969 (reported on 1.9% of returns)
20191:
$19,969
Virginia:
$25,373
(% of AGI for various income ranges: 0.4% for AGIs $50k-75k, 0.3% for AGIs $100k-200k, 0.7% for AGIs over 200k)
Total itemized deductions: $28,499 (19% of AGI, reported on 53.7% of returns)
Here:
$28,499
State:
$26,596
Here:
19.2% of AGI
State:
20.1% of AGI
(% of AGI for various income ranges: 14.7% for AGIs below $25k, 14.6% for AGIs $25k-50k, 16.0% for AGIs $50k-75k, 17.9% for AGIs $75k-100k, 17.4% for AGIs $100k-200k, 14.2% for AGIs over 200k)
Charity contributions: $3,918 (reported on 44.3% of returns)
Here:
$3,918
State:
$4,443
(% of AGI for various income ranges: 0.7% for AGIs below $25k, 1.2% for AGIs $25k-50k, 1.3% for AGIs $50k-75k, 1.6% for AGIs $75k-100k, 1.8% for AGIs $100k-200k, 2.2% for AGIs over 200k)
Taxes paid: $12,142 (reported on 53.5% of returns)
20191:
$12,142
State:
$9,951
(% of AGI for various income ranges: 2.4% for AGIs below $25k, 3.1% for AGIs $25k-50k, 4.9% for AGIs $50k-75k, 6.4% for AGIs $75k-100k, 7.4% for AGIs $100k-200k, 7.5% for AGIs over 200k)
Earned income credit: $2,186 (reported on 9.4% of returns)
Here:
$2,186
State:
$2,211
(% of AGI for various income ranges: 5.0% for AGIs below $25k, 0.8% for AGIs $25k-50k)
Percentage of individuals using paid preparers for their 2012 taxes: 44.4%
Here:
44%
State:
46%
(% for various income ranges: 47.7% for AGIs below $25k, 46.4% for AGIs $25k-50k, 41.6% for AGIs $50k-75k, 40.9% for AGIs $75k-100k, 39.0% for AGIs $100k-200k, 52.3% for AGIs over 200k)
Averages for the 2004 tax year for zip code 20191, filed in 2005:
Average Adjusted Gross Income (AGI) in 2004: $76,833 (Individual Income Tax Returns)
Here:
$76,833
State:
$56,704
Salary/wage: $67,785 (reported on 88.3% of returns)
Here:
$67,785
State:
$48,441
(% of AGI for various income ranges: 127.4% for AGIs below $10k, 85.1% for AGIs $10k-25k, 85.7% for AGIs $25k-50k, 84.2% for AGIs $50k-75k, 80.6% for AGIs $75k-100k, 74.0% for AGIs over 100k)
Taxable interest for individuals: $1,380 (reported on 55.3% of returns)
This zip code:
$1,380
Virginia:
$1,688
(% of AGI for various income ranges: 6.9% for AGIs below $10k, 1.4% for AGIs $10k-25k, 1.1% for AGIs $25k-50k, 0.9% for AGIs $50k-75k, 1.1% for AGIs $75k-100k, 0.9% for AGIs over 100k)
Taxable dividends: $3,397 (reported on 36.0% of returns)
Here:
$3,397
State:
$4,028
(% of AGI for various income ranges: 5.3% for AGIs below $10k, 1.9% for AGIs $10k-25k, 1.1% for AGIs $25k-50k, 1.2% for AGIs $50k-75k, 1.7% for AGIs $75k-100k, 1.7% for AGIs over 100k)
Net capital gain/loss: +$8,175 (reported on 31.1% of returns)
Here:
+$8,175
State:
+$14,375
(% of AGI for various income ranges: -2.1% for AGIs below $10k, 0.4% for AGIs $10k-25k, 0.7% for AGIs $25k-50k, 0.6% for AGIs $50k-75k, 1.2% for AGIs $75k-100k, 4.9% for AGIs over 100k)
Profit/loss from business: +$26,059 (reported on 17.1% of returns)
Here:
+$26,059
State:
+$13,342
(% of AGI for various income ranges: 11.5% for AGIs below $10k, 7.3% for AGIs $10k-25k, 4.2% for AGIs $25k-50k, 2.8% for AGIs $50k-75k, 2.9% for AGIs $75k-100k, 7.1% for AGIs over 100k)
IRA payment deduction: $2,942 (reported on 3.2% of returns)
20191:
$2,942
Virginia:
$2,943
(% of AGI for various income ranges: 0.4% for AGIs below $10k, 0.2% for AGIs $10k-25k, 0.2% for AGIs $25k-50k, 0.2% for AGIs $50k-75k, 0.1% for AGIs $75k-100k, 0.1% for AGIs over 100k)
Self-employed pension: $16,500 (reported on 2.7% of returns)
Here:
$16,500
Virginia:
$17,430
(% of AGI for various income ranges: 0.2% for AGIs $25k-50k, 0.2% for AGIs $50k-75k, 0.3% for AGIs $75k-100k, 0.8% for AGIs over 100k)
Total itemized deductions: $23,031 (21% of AGI, reported on 58.5% of returns)
Here:
$23,031
State:
$21,492
Here:
20.6% of AGI
State:
21.0% of AGI
(% of AGI for various income ranges: 21.3% for AGIs below $10k, 17.7% for AGIs $10k-25k, 19.8% for AGIs $25k-50k, 20.7% for AGIs $50k-75k, 19.7% for AGIs $75k-100k, 16.1% for AGIs over 100k)
Charity contributions deductions: $3,149 (3% of AGI, reported on 51.0% of returns)
Here:
$3,149
State:
$3,794
Here:
2.7% of AGI
State:
3.5% of AGI
(% of AGI for various income ranges: 0.7% for AGIs below $10k, 1.4% for AGIs $10k-25k, 1.8% for AGIs $25k-50k, 2.0% for AGIs $50k-75k, 2.3% for AGIs $75k-100k, 2.2% for AGIs over 100k)
Total tax: $13,788 (reported on 84.8% of returns)
20191:
$13,788
State:
$9,537
(% of AGI for various income ranges: 3.8% for AGIs below $10k, 4.7% for AGIs $10k-25k, 7.7% for AGIs $25k-50k, 10.7% for AGIs $50k-75k, 12.0% for AGIs $75k-100k, 18.7% for AGIs over 100k)
Earned income credit: $1,611 (reported on 7.6% of returns)
Here:
$1,611
State:
$1,734
Percentage of individuals using paid preparers for their 2004 taxes: 45.8%
Here:
46%
State:
52%
(% for various income ranges: 40.7% for AGIs below $10k, 53.0% for AGIs $10k-25k, 51.1% for AGIs $25k-50k, 43.5% for AGIs $50k-75k, 39.0% for AGIs $75k-100k, 44.2% for AGIs over 100k)
Likely homosexual households (counted as self-reported same-sex unmarried-partner households)
Lesbian couples: 0.3% of all households
Gay men: 0.2% of all households
Household received Food Stamps/SNAP in the past 12 months: 770 Household did not receive Food Stamps/SNAP in the past 12 months: 11,351
Women who had a birth in the past 12 months: 406 (342 now married, 68 unmarried) Women who did not have a birth in the past 12 months: 6,680 (2,952 now married, 3,724 unmarried)
Housing units in zip code 20191 with a mortgage: 6,349 (738 second mortgage, 11 home equity loan, 557 both second mortgage and home equity loan) Houses without a mortgage: 68
Median monthly owner costs for units with a mortgage: $2,576 Median monthly owner costs for units without a mortgage: $925
Residents with income below the poverty level in 2022:
This zip code:
5.8%
Whole state:
10.6%
Residents with income below 50% of the poverty level in 2022:
This zip code:
2.6%
Whole state:
5.2%
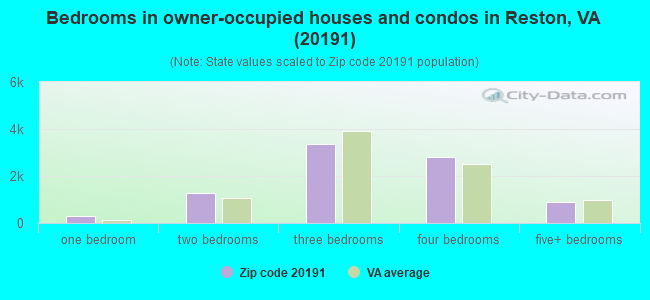
Median number of rooms in houses and condos:
Here:
7.3
State:
7.0
Median number of rooms in apartments:
Here:
4.3
State:
4.3
Notable locations in this zip code not listed on our city pages
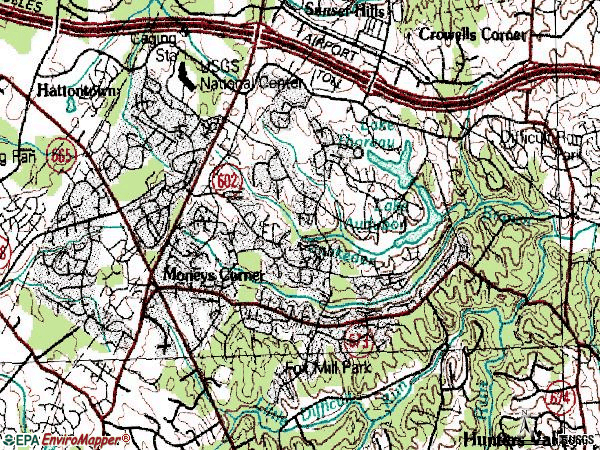
Notable locations in zip code 20191: Reston National Golf Course (A), Campus Commons Business Park (B), Commerce Executive Park (C), Parkridge Business Park (D), Southgate Community Center (E), John Wesley Powell Federal Building (F), Reston International Center (G), U.S. Geological Survey Clarence King Library (H). Display/hide their locations on the map
Churches in zip code 20191 include: Heritage Fellowship United Church of Christ (A), United Christian Parish of Reston (B), Saint John Neumann Church (C). Display/hide their locations on the map
Parks in zip code 20191 include: South Lakes Village Park (1), South Lakes Drive Park (2), Meadowlark Gardens Regional Park (3), Fox Mill District Park (4), Fox Mill Woods Park (5). Display/hide their locations on the map
4,363 married couples with children.
1,307 single-parent households (477 men, 830 women).
65.0% of residents of 20191 zip code speak English at home.
13.6% of residents speak Spanish at home (56% very well, 27% well, 13% not well, 4% not at all).
10.8% of residents speak other Indo-European language at home (73% very well, 20% well, 7% not well).
6.7% of residents speak Asian or Pacific Island language at home (61% very well, 20% well, 15% not well, 3% not at all).
4.3% of residents speak other language at home (66% very well, 23% well, 11% not well).
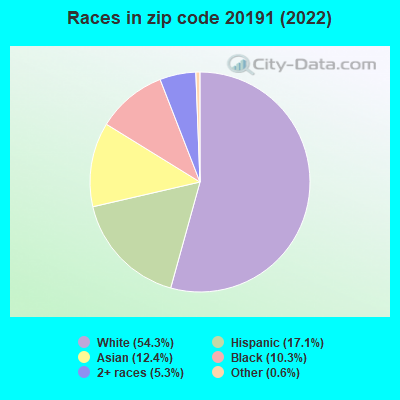
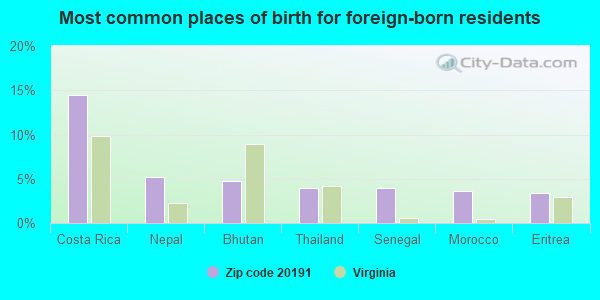
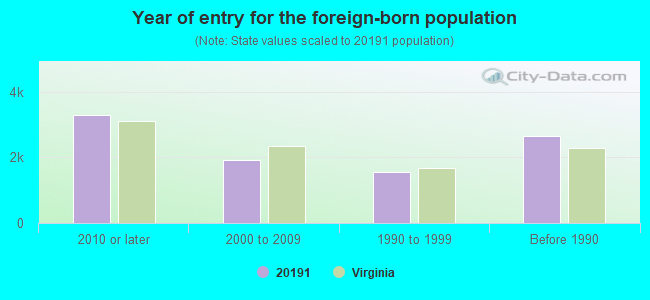
Foreign born population: 8,403 (28.0%) (64.2% of them are naturalized citizens)
Facilities with environmental interests located in this zip code:
AMERICA ONLINE INCORPORATED (12100 SUNRISE VALLEY DRIVE in RESTON, VA)
AIR SYNTHETIC MINOR (AIRS/AFS) STATE MASTER (Virginia pollutants databases) - CEDS-72296, AIR PROGRAM CRITERIA AND HAZARDOUS AIR POLLUTANT INVENTORY (Inventory of air pollution sources) Business SIC classification: INFORMATION RETRIEVAL SERVICES Business NAICS classification: INTERNET SERVICE PROVIDERS.; INTERNET SERVICE PROVIDERS.
CENTEX HOMES (PLAZA AMERICA INTERSECT. SUNSET HILLS/RESTPN PKY in RESTON, VA)
(Integrated Compliance Information System) - ICIS-03-2001-0247, FORMAL ENFORCEMENT ACTION Business SIC classification: GENERAL CONTRACTORS-SINGLE-FAMILY HOUSES
AMERICAN COLLEGE OF RADIOLOGY (1891 PRESTON WHITE DRIVE in RESTON, VA)
Small Quantity Generators, between 100 kg and 1000 kg of hazardous waste/month (Resource Conservation and Recovery Act (tracking hazardous waste)) - notification Organizations: OPERNAME (CONTACT/OPERATOR)
BETTER IMPRESSIONS INCORPORATED (12345-D SUNRISE VALLEY DRIVE in RESTON, VA)
Small Quantity Generators, between 100 kg and 1000 kg of hazardous waste/month (Resource Conservation and Recovery Act (tracking hazardous waste)) - notification Organizations: EQUITALBLE REAL ESTATE INVEST (CONTACT/OWNER)
Housing units lacking complete plumbing facilities: 0.4% Housing units lacking complete kitchen facilities: 0.6%
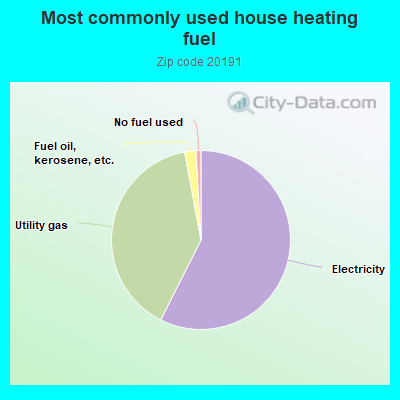
57.2%Electricity
39.5%Utility gas
2.0%Fuel oil, kerosene, etc.
0.9%No fuel used
Place of birth for U.S.-born residents:
This state: 8,936
Northeast: 3,768
Midwest: 2,476
South: 4,269
West: 1,223
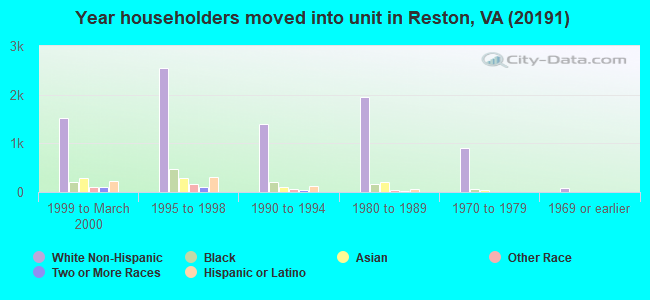
53% of the 20191 zip code residents lived in the same house 5 years ago. Out of people who lived in different houses, 49% lived in this county. Out of people who lived in different counties, 50% lived in Virginia.
86% of the 20191 zip code residents lived in the same house 1 year ago. Out of people who lived in different houses, 43% moved from this county. Out of people who lived in different houses, 26% moved from different county within same state. Out of people who lived in different houses, 22% moved from different state. Out of people who lived in different houses, 7% moved from abroad.
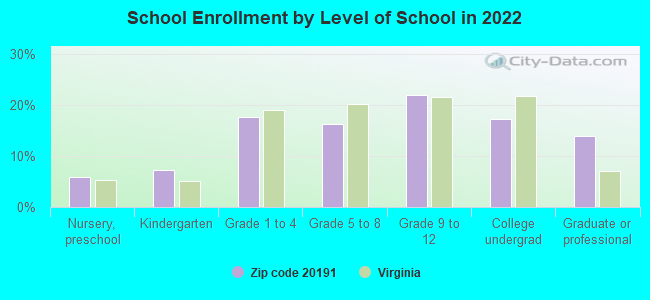
Private vs. public school enrollment:
Students in private schools in grades 1 to 8 (elementary and middle school): 282
Here:
12.1%
Virginia:
13.2%
Students in private schools in grades 9 to 12 (high school): 97
Here:
6.4%
Virginia:
10.2%
Students in private undergraduate colleges: 184
Here:
15.5%
Virginia:
18.7%
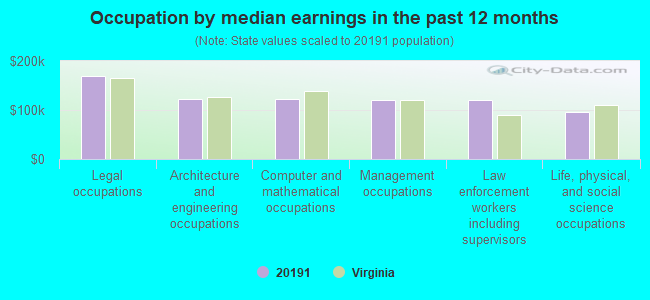
Occupation by median earnings in the past 12 months ($)
168,857Legal occupations
123,310Architecture and engineering occupations
123,113Computer and mathematical occupations
120,746Management occupations
120,682Law enforcement workers including supervisors
95,575Life, physical, and social science occupations
Companies with biggest federal contracts located in this zip code (RESTON, VA):
DYNCORP (2000 EDMUND HALLEY DR) : $3,435,968,599 in 7087 contractsfrom 1999 to 2006
Contracts for Other ADP and Telecommunications Services (includes data storage on tapes, compact disks, etc.), Logistics Support Services, Maintenance, Repair and Rebuilding of Equipment -- Aircraft and Airframe Structural Components, Defense Aircraft -- Applied Research and Exploratory Development (R&D), and moreby Federal Technology Service, Army, Air Force, Department of State, and others Signed by year:2000: $407,155,912; 2001: $644,432,290; 2002: $815,260,304; 2003: $343,244,806; 2004: $424,195,222; 2005: $449,642,377; 2006: $246,848,312.
Biggest contracts:
$91,915,000 with Federal Technology Service for Other ADP and Telecommunications Services (includes data storage on tapes, compact disks, etc.). Signed on 2002-02-15. Completion date: 2004-04-15.
$84,882,205 with Army for Logistics Support Services. Taking place in TX. Signed on 2006-01-31. Completion date: 2010-12-31.
$48,980,253 with Air Force for Maintenance, Repair and Rebuilding of Equipment -- Aircraft and Airframe Structural Components. Taking place in OK. Signed on 2005-10-13. Completion date: 2006-09-30.
$48,000,460, same as above.Signed on 2004-10-01. Completion date: 2005-09-30.
ARTEL INCORPORATED (1893 PRESTON WHITE DRIVE; small business) : $278,028,848 in 670 contractsfrom 1999 to 2006
Contracts for ADP Telecommunications and Transmission Services, Other ADP and Telecommunications Services (includes data storage on tapes, compact disks, etc.), ADP Facility Operation and Maintenance Services, Telecommunications Network Management Services, and moreby Defense Information Systems Agency, Department of Defense, Federal Emergency Management Agency, Federal Technology Service, and others Signed by year:2000: $10,884,255; 2001: $26,780,958; 2002: $60,448,216; 2003: $72,041,542; 2004: $94,216,728; 2005: $7,347,763; 2006: $2,861,910.
Biggest contracts:
$17,318,149 with Defense Information Systems Agency for ADP Telecommunications and Transmission Services. Signed on 2004-09-30. Completion date: 2003-10-16.
$11,092,449 with Department of Defense for ADP Telecommunications and Transmission Services. Signed on 2003-09-30. Completion date: 2004-02-13.
$10,191,225 with Defense Information Systems Agency for ADP Telecommunications and Transmission Services. Signed on 2004-09-30. Completion date: 2004-02-13.
$10,155,000 with Department of Defense for ADP Telecommunications and Transmission Services. Signed on 2003-09-30. Completion date: 2003-09-24.
DYN MARINE SERVICES OF VIRGINI (2000 EDMUND HALLEY DR) : $202,169,656 in 196 contractsfrom 2000 to 2005
Contracts for Marine Charter for Things, Operation of Government-Owned Facilities -- Other Non-Building Facilities, Miscellaneous Ship and Marine Equipment by Navy, National Oceanic and Atmospheric Administration/Under Secretary for Oceans and Atmosphere Signed by year:2000: $48,390,628; 2001: $23,904,520; 2002: $84,475,954; 2003: $44,617,701; 2004: -$2,192,249; 2005: $2,973,102; 2006: $0.
Biggest contracts:
$43,565,548 with Navy for Marine Charter for Things. Signed on 2003-11-07. Completion date: 2002-09-16.
$31,195,009 with Navy for Operation of Government-Owned Facilities -- Other Non-Building Facilities. Signed on 2002-10-24. Completion date: 2002-09-16.
$30,044,055, same as above.Signed on 2002-10-22. Completion date: 2002-09-16.
$19,506,023, same as above.Signed on 2001-10-12. Completion date: 2002-09-16.
PLANNING SYSTEMS INCORPORATED (12030 SUNRISE VALLEY DRIVE; small business) : $196,989,957 in 1102 contractsfrom 1999 to 2006
Contracts for Weapons -- Operational Systems Development (R&D), ADP Systems Analysis Services, Other Defense -- Operational Systems Development (R&D), Other Defense -- Applied Research and Exploratory Development (R&D), and moreby Navy, Federal Technology Service, Army, Air Force, and others Signed by year:2000: $20,170,740; 2001: $19,557,039; 2002: $28,683,666; 2003: $28,226,848; 2004: $27,045,695; 2005: $33,685,397; 2006: $35,462,935.
Biggest contracts:
$22,443,550 with Navy for Weapons -- Operational Systems Development (R&D). Signed on 2006-06-01. Completion date: 2007-06-01.
$4,705,000 with Federal Technology Service for ADP Systems Analysis Services. Taking place in ME. Signed on 2002-08-15. Completion date: 2002-04-15.
$2,202,335 with Army for Other Defense -- Operational Systems Development (R&D). Signed on 2004-03-29. Completion date: 2005-03-23.
$2,072,000 with Army for Other Defense -- Applied Research and Exploratory Development (R&D). Taking place in LA. Signed on 2005-06-20. Completion date: 2008-06-20.
PRC INC. (12005 SUNRISE VALLEY DR) : $180,994,159 in 777 contractsfrom 1999 to 2006
Contracts for ADPE System Configuration, ADP Software, ADP Input/Output and Storage Devices, Other ADP and Telecommunications Services (includes data storage on tapes, compact disks, etc.), and moreby Defense Logistics Agency, Navy, Department of Defense, Air Force, and others Signed by year:2000: $82,039,920; 2001: $59,939,854; 2002: $17,005,949; 2003: $2,326,156; 2004: -$53,185; 2005: -$7,621; 2006: $0.
Biggest contracts:
$5,999,982 with Defense Logistics Agency for ADPE System Configuration. Signed on 2000-05-09. Completion date: 2001-12-31.
$3,881,101 with Navy for ADP Software. Signed on 2000-09-11. Completion date: 2003-09-12.
$3,616,785 with Defense Logistics Agency for ADPE System Configuration. Signed on 2001-10-11. Completion date: 2002-09-30.
$3,542,135 with Navy for ADP Software. Signed on 2000-10-27. Completion date: 2004-10-28.
RAYTHEON TECHNICAL SERVICES CO (12160 SUNRISE VALLEY DR) : $161,773,780 in 66 contractsfrom 2000 to 2006
Contracts for Engineering and Technical Services, Other Management Support Services, Other ADP and Telecommunications Services (includes data storage on tapes, compact disks, etc.), Other Defense -- Applied Research and Exploratory Development (R&D), and moreby ENERGY, Department of, Defense Threat Reduction Agency, Department of Defense, Air Force, and others Signed by year:2000: $1,796,725; 2001: $1,130,990; 2002: $1,562,990; 2003: $9,817,379; 2004: $22,778,758; 2005: $56,518,273; 2006: $68,168,665.
Biggest contracts:
$31,606,816 with ENERGY, Department of for Engineering and Technical Services. Signed on 2005-09-30. Completion date: 2005-12-31.
$26,496,137, same as above.Signed on 2006-07-28. Completion date: 2006-12-31.
$12,250,000, same as above.Signed on 2006-09-14. Completion date: 2006-12-31.
$10,056,785, same as above.Signed on 2006-09-19. Completion date: 2006-12-31.
MCBRIDE AND ASSOCIATES (11400 COMMERCE PARK DR; small business) : $62,723,141 in 515 contractsfrom 1999 to 2005
Contracts for Other ADP and Telecommunications Services (includes data storage on tapes, compact disks, etc.), Computer Aided Design/Computer Aided Manufacturing (CAD/CAM) Services, ADP Support Equipment, Textiles, Clothing and Equipage -- Engineering Development (R&D), and moreby U.S. Army Corps of Engineers - civil program financing only, Navy, Department of Defense, Air Force, and others Signed by year:2000: $22,324,133; 2001: $12,372,247; 2002: $9,904,347; 2003: $4,839,582; 2004: $10,393,218; 2005: $0; 2006: $0.
Biggest contracts:
$2,369,682 with U.S. Army Corps of Engineers - civil program financing only for Other ADP and Telecommunications Services (includes data storage on tapes, compact disks, etc.). Taking place in MS. Signed on 2001-09-28. Completion date: 2002-09-30.
$2,116,265 with Navy for Computer Aided Design/Computer Aided Manufacturing (CAD/CAM) Services. Signed on 2002-03-21. Completion date: 2002-06-21.
$1,863,060, same as above.Signed on 2000-05-11. Completion date: 2000-07-11.
$1,832,708 with Department of Defense for ADP Support Equipment. Taking place in DC. Signed on 2000-09-19. Completion date: 2000-10-19.
GLOBAL INFOTEK, INC. (1920 ASSOCIATION DRIVE, SU; small business) : $39,251,009 in 105 contractsfrom 1999 to 2006
Contracts for Other Defense -- Applied Research and Exploratory Development (R&D), Other Defense -- Advanced Development (R&D), Mathematical and Computer Sciences -- Advanced Development (R&D), Other Sciences Not Elsewhere Classified -- Basic Research (R&D), and moreby Air Force, Navy, Office of Policy, Management and Budget/Chief Financial Officer, Army, and others Signed by year:2000: $7,969,078; 2001: $3,649,637; 2002: $4,585,049; 2003: $5,569,385; 2004: $4,986,342; 2005: $5,830,611; 2006: $3,264,956.
Biggest contracts:
$2,109,000 with Air Force for Other Defense -- Applied Research and Exploratory Development (R&D). Signed on 2005-02-10. Completion date: 2009-05-11.
$2,046,000 with Air Force for Other Defense -- Advanced Development (R&D). Signed on 2000-11-30. Completion date: 2003-06-30.
$1,871,000, same as above.Signed on 1999-12-13. Completion date: 2003-06-30.
$1,694,523 with Air Force for Other Defense -- Applied Research and Exploratory Development (R&D). Signed on 2006-05-08. Completion date: 2009-05-11.
INFORMATION TECHNOLOGY & APPLI (1875 CAMPUS COMMONS DR; small business) : $36,161,304 in 122 contractsfrom 1999 to 2006
Contracts for ADP Systems Analysis Services, Communications Security Equipment and Components, Engineering and Technical Services, Defense Electronics and Communication Equipment -- Engineering Development (R&D), and moreby Federal Technology Service, Air Force, Army, Department of Defense, and others Signed by year:2000: $9,464,743; 2001: $3,161,298; 2002: $1,656,598; 2003: $1,768,061; 2004: $7,399,110; 2005: $4,592,938; 2006: $2,930,466.
Biggest contracts:
$6,285,711 with Federal Technology Service for ADP Systems Analysis Services. Taking place in NJ. Signed on 2004-10-06. Completion date: 2004-12-31.
$2,776,651 with Air Force for Communications Security Equipment and Components. Signed on 2006-06-14. Completion date: 2008-08-01.
$2,319,014 with Air Force for Engineering and Technical Services. Taking place in CO. Signed on 2000-10-01. Completion date: 2001-09-30.
$1,849,477 with Air Force for Communications Security Equipment and Components. Signed on 2005-09-09. Completion date: 2006-12-31.
LITTON INDUSTRIES, INC (12001 SUNRISE VALLEY DR) : $34,167,216 in 78 contractsfrom 1999 to 2004
Contracts for ADP Facility Operation and Maintenance Services, Maintenance, Repair and Rebuilding of Equipment -- Automatic Data Processing Equipment (Including Firmware), Software, Supplies and Support Equipment, Other ADP and Telecommunications Services (includes data storage on tapes, compact disks, etc.), ADPE System Configuration, and moreby Federal Technology Service, Department of Defense, Air Force, Navy, and others Signed by year:2000: $9,850,253; 2001: $11,229,119; 2002: $0; 2003: $0; 2004: $10,369,883; 2005: $0; 2006: $0.
Biggest contracts:
$9,733,441 with Federal Technology Service for ADP Facility Operation and Maintenance Services. Taking place in CO. Signed on 2004-09-30. Completion date: 2005-01-31.
$8,051,000, same as above.Signed on 2001-08-15. Completion date: 2004-11-15.
$2,355,900 with Department of Defense for Maintenance, Repair and Rebuilding of Equipment -- Automatic Data Processing Equipment (Including Firmware), Software, Supplies and Support Equipment. Signed on 2000-05-22. Completion date: 2003-05-31.
$1,413,880 with Department of Defense for Other ADP and Telecommunications Services (includes data storage on tapes, compact disks, etc.). Signed on 2000-02-09. Completion date: 2000-09-30.
Top industries in this zip code by the number of employees in 2005:
Management of Companies and Enterprises: Corporate, Subsidiary, and Regional Managing Offices (500-999: 1, 100-249: 2, 10-19: 1, 5-9: 1, 1-4: 1)
Other Services (except Public Administration): Professional Organizations (100-249: 4, 50-99: 2, 20-49: 1, 10-19: 2, 5-9: 2, 1-4: 4)
Information: Internet Service Providers (500-999: 1, 10-19: 1, 1-4: 1)
Construction: New Single-Family Housing Construction (except Operative Builders) (500-999: 1, 5-9: 1)
Administrative and Support and Waste Management and Remediation Services: Temporary Help Services (100-249: 3, 50-99: 2, 20-49: 1, 10-19: 2, 5-9: 2, 1-4: 1)
People in group quarters in 2010:
13 people in other noninstitutional facilities
6 people in group homes intended for adults
Fatal accident statistics in 2013:
Fatal accident count: 1
Vehicles involved in fatal accidents: 2
Fatal accidents caused by drunken drivers: 0
Fatalities: 1
Persons involved in fatal accidents: 5
Pedestrians involved in fatal accidents: 0
Fatal accident statistics in 2010:
Fatal accident count: 1
Vehicles involved in fatal accidents: 1
Fatal accidents caused by drunken drivers: 0
Fatalities: 1
Persons involved in fatal accidents: 1
Pedestrians involved in fatal accidents: 1
Home Mortgage Disclosure Act Aggregated Statistics For Year 2009 (Based on 3 full and 6 partial tracts)
A) FHA, FSA/RHS & VA Home Purchase Loans
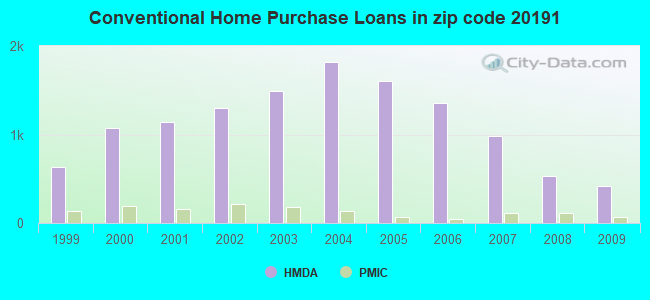
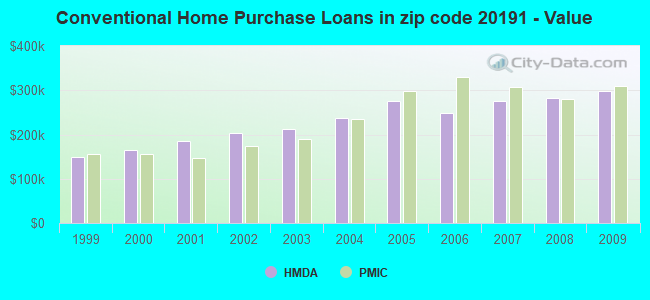
B) Conventional Home Purchase Loans
C) Refinancings
D) Home Improvement Loans
F) Non-occupant Loans on < 5 Family Dwellings (A B C & D)
Number
Average Value
Number
Average Value
Number
Average Value
Number
Average Value
Number
Average Value
LOANS ORIGINATED
273
$326,011
413
$297,416
1,594
$307,552
43
$135,413
99
$186,186
APPLICATIONS APPROVED, NOT ACCEPTED
5
$311,722
19
$290,027
120
$303,670
7
$132,517
3
$199,667
APPLICATIONS DENIED
21
$325,129
28
$204,782
392
$313,409
17
$81,003
41
$218,786
APPLICATIONS WITHDRAWN
35
$296,330
67
$271,523
367
$305,820
15
$178,639
25
$153,070
FILES CLOSED FOR INCOMPLETENESS
7
$249,221
25
$269,122
108
$330,408
3
$244,690
15
$187,055
Aggregated Statistics For Year 2008 (Based on 3 full and 6 partial tracts)
A) FHA, FSA/RHS & VA Home Purchase Loans
B) Conventional Home Purchase Loans
C) Refinancings
D) Home Improvement Loans
E) Loans on Dwellings For 5+ Families
F) Non-occupant Loans on < 5 Family Dwellings (A B C & D)
G) Loans On Manufactured Home Dwelling (A B C & D)
Number
Average Value
Number
Average Value
Number
Average Value
Number
Average Value
Number
Average Value
Number
Average Value
Number
Average Value
LOANS ORIGINATED
167
$295,566
532
$282,842
660
$272,997
77
$97,674
1
$196,000
131
$197,281
0
$0
APPLICATIONS APPROVED, NOT ACCEPTED
4
$345,715
57
$308,455
113
$287,050
22
$112,741
0
$0
22
$208,433
0
$0
APPLICATIONS DENIED
34
$270,796
72
$248,786
283
$273,683
35
$155,552
0
$0
45
$189,751
2
$30,265
APPLICATIONS WITHDRAWN
24
$313,804
94
$287,280
205
$286,068
16
$102,466
0
$0
26
$166,419
1
$12,000
FILES CLOSED FOR INCOMPLETENESS
6
$282,712
14
$313,725
41
$290,503
4
$108,532
0
$0
7
$164,193
0
$0
Aggregated Statistics For Year 2007 (Based on 3 full and 6 partial tracts)
A) FHA, FSA/RHS & VA Home Purchase Loans
B) Conventional Home Purchase Loans
C) Refinancings
D) Home Improvement Loans
E) Loans on Dwellings For 5+ Families
F) Non-occupant Loans on < 5 Family Dwellings (A B C & D)
Number
Average Value
Number
Average Value
Number
Average Value
Number
Average Value
Number
Average Value
Number
Average Value
LOANS ORIGINATED
20
$312,798
985
$276,813
854
$259,681
142
$140,655
1
$5,000
111
$218,302
APPLICATIONS APPROVED, NOT ACCEPTED
0
$0
110
$255,953
208
$254,261
38
$147,430
0
$0
37
$209,416
APPLICATIONS DENIED
0
$0
119
$265,241
403
$285,572
49
$117,934
0
$0
62
$231,042
APPLICATIONS WITHDRAWN
4
$358,552
72
$231,100
256
$296,629
25
$118,491
0
$0
22
$240,318
FILES CLOSED FOR INCOMPLETENESS
0
$0
17
$305,131
97
$304,769
5
$129,842
0
$0
8
$201,211
Aggregated Statistics For Year 2006 (Based on 3 full and 6 partial tracts)
A) FHA, FSA/RHS & VA Home Purchase Loans
B) Conventional Home Purchase Loans
C) Refinancings
D) Home Improvement Loans
E) Loans on Dwellings For 5+ Families
F) Non-occupant Loans on < 5 Family Dwellings (A B C & D)
G) Loans On Manufactured Home Dwelling (A B C & D)
Number
Average Value
Number
Average Value
Number
Average Value
Number
Average Value
Number
Average Value
Number
Average Value
Number
Average Value
LOANS ORIGINATED
7
$314,304
1,354
$248,728
1,362
$264,605
156
$122,850
0
$0
231
$214,112
0
$0
APPLICATIONS APPROVED, NOT ACCEPTED
0
$0
115
$236,944
226
$234,100
36
$66,962
2
$4,975
25
$244,746
1
$76,000
APPLICATIONS DENIED
1
$290,000
225
$230,777
387
$255,970
73
$104,926
0
$0
43
$233,835
2
$60,000
APPLICATIONS WITHDRAWN
2
$311,000
119
$253,771
386
$273,226
32
$157,536
2
$52,345
35
$254,564
1
$160,000
FILES CLOSED FOR INCOMPLETENESS
1
$320,000
19
$246,828
75
$267,183
5
$198,880
0
$0
9
$164,304
0
$0
Aggregated Statistics For Year 2005 (Based on 3 full and 6 partial tracts)
A) FHA, FSA/RHS & VA Home Purchase Loans
B) Conventional Home Purchase Loans
C) Refinancings
D) Home Improvement Loans
F) Non-occupant Loans on < 5 Family Dwellings (A B C & D)
G) Loans On Manufactured Home Dwelling (A B C & D)
Number
Average Value
Number
Average Value
Number
Average Value
Number
Average Value
Number
Average Value
Number
Average Value
LOANS ORIGINATED
12
$294,238
1,607
$274,596
2,051
$262,362
191
$173,006
310
$219,718
1
$156,000
APPLICATIONS APPROVED, NOT ACCEPTED
2
$256,660
130
$250,485
220
$226,728
31
$161,473
31
$148,293
0
$0
APPLICATIONS DENIED
0
$0
236
$249,752
435
$276,758
78
$106,755
56
$204,327
0
$0
APPLICATIONS WITHDRAWN
2
$253,675
135
$273,681
355
$230,616
50
$171,010
38
$219,348
0
$0
FILES CLOSED FOR INCOMPLETENESS
0
$0
29
$323,100
94
$261,984
7
$111,243
10
$183,125
0
$0
Aggregated Statistics For Year 2004 (Based on 3 full and 6 partial tracts)
A) FHA, FSA/RHS & VA Home Purchase Loans
B) Conventional Home Purchase Loans
C) Refinancings
D) Home Improvement Loans
F) Non-occupant Loans on < 5 Family Dwellings (A B C & D)
G) Loans On Manufactured Home Dwelling (A B C & D)
Number
Average Value
Number
Average Value
Number
Average Value
Number
Average Value
Number
Average Value
Number
Average Value
LOANS ORIGINATED
82
$229,909
1,816
$238,317
2,116
$228,732
161
$117,652
258
$171,486
3
$195,057
APPLICATIONS APPROVED, NOT ACCEPTED
2
$223,830
83
$232,317
277
$191,095
26
$84,667
20
$136,836
0
$0
APPLICATIONS DENIED
8
$188,198
131
$212,438
469
$210,150
94
$68,444
52
$184,562
3
$5,317
APPLICATIONS WITHDRAWN
0
$0
109
$223,528
394
$212,606
38
$128,868
29
$173,113
1
$130,000
FILES CLOSED FOR INCOMPLETENESS
0
$0
29
$246,771
86
$218,901
17
$89,995
5
$155,852
0
$0
Aggregated Statistics For Year 2003 (Based on 3 full and 6 partial tracts)
A) FHA, FSA/RHS & VA Home Purchase Loans
B) Conventional Home Purchase Loans
C) Refinancings
D) Home Improvement Loans
F) Non-occupant Loans on < 5 Family Dwellings (A B C & D)
Number
Average Value
Number
Average Value
Number
Average Value
Number
Average Value
Number
Average Value
LOANS ORIGINATED
158
$177,180
1,497
$213,248
5,215
$206,512
66
$85,318
358
$124,030
APPLICATIONS APPROVED, NOT ACCEPTED
4
$201,790
94
$238,424
585
$183,913
33
$41,733
25
$132,312
APPLICATIONS DENIED
8
$131,785
105
$194,814
563
$190,945
47
$37,017
32
$141,329
APPLICATIONS WITHDRAWN
13
$141,038
138
$252,524
506
$196,648
20
$60,010
42
$133,990
FILES CLOSED FOR INCOMPLETENESS
4
$150,165
25
$249,978
161
$206,169
3
$38,667
14
$119,375
Aggregated Statistics For Year 2002 (Based on 3 full and 6 partial tracts)
A) FHA, FSA/RHS & VA Home Purchase Loans
B) Conventional Home Purchase Loans
C) Refinancings
D) Home Improvement Loans
F) Non-occupant Loans on < 5 Family Dwellings (A B C & D)
Number
Average Value
Number
Average Value
Number
Average Value
Number
Average Value
Number
Average Value
LOANS ORIGINATED
238
$158,850
1,296
$204,027
3,533
$206,856
106
$48,469
235
$115,960
APPLICATIONS APPROVED, NOT ACCEPTED
9
$123,181
65
$218,454
346
$171,341
28
$30,432
28
$97,013
APPLICATIONS DENIED
17
$157,106
66
$214,748
524
$144,459
85
$42,425
48
$145,770
APPLICATIONS WITHDRAWN
11
$151,036
102
$193,059
412
$175,364
29
$38,943
27
$108,196
FILES CLOSED FOR INCOMPLETENESS
1
$128,000
22
$252,441
126
$194,197
1
$15,000
10
$102,041
Aggregated Statistics For Year 2001 (Based on 3 full and 6 partial tracts)
A) FHA, FSA/RHS & VA Home Purchase Loans
B) Conventional Home Purchase Loans
C) Refinancings
D) Home Improvement Loans
E) Loans on Dwellings For 5+ Families
F) Non-occupant Loans on < 5 Family Dwellings (A B C & D)
Number
Average Value
Number
Average Value
Number
Average Value
Number
Average Value
Number
Average Value
Number
Average Value
LOANS ORIGINATED
355
$142,738
1,140
$186,247
2,426
$188,523
117
$35,472
0
$0
162
$102,245
APPLICATIONS APPROVED, NOT ACCEPTED
11
$127,084
59
$156,584
205
$167,786
41
$49,953
0
$0
10
$143,218
APPLICATIONS DENIED
9
$135,464
64
$132,884
347
$127,983
92
$34,152
0
$0
33
$91,820
APPLICATIONS WITHDRAWN
11
$182,516
74
$157,912
347
$148,397
37
$25,105
1
$8,703,000
13
$129,709
FILES CLOSED FOR INCOMPLETENESS
2
$142,500
9
$203,639
94
$144,496
10
$20,768
0
$0
8
$100,784
Aggregated Statistics For Year 2000 (Based on 3 full and 6 partial tracts)
A) FHA, FSA/RHS & VA Home Purchase Loans
B) Conventional Home Purchase Loans
C) Refinancings
D) Home Improvement Loans
F) Non-occupant Loans on < 5 Family Dwellings (A B C & D)
Number
Average Value
Number
Average Value
Number
Average Value
Number
Average Value
Number
Average Value
LOANS ORIGINATED
369
$123,040
1,078
$165,879
404
$145,863
124
$45,207
81
$85,263
APPLICATIONS APPROVED, NOT ACCEPTED
14
$95,114
72
$179,587
75
$124,379
48
$45,054
10
$67,275
APPLICATIONS DENIED
20
$114,118
71
$127,490
195
$97,604
81
$25,977
8
$68,494
APPLICATIONS WITHDRAWN
13
$126,957
64
$146,311
112
$125,403
39
$56,278
12
$109,654
FILES CLOSED FOR INCOMPLETENESS
1
$73,000
12
$162,899
14
$107,074
6
$25,492
3
$97,593
Aggregated Statistics For Year 1999 (Based on 2 full and 3 partial tracts)
A) FHA, FSA/RHS & VA Home Purchase Loans
B) Conventional Home Purchase Loans
C) Refinancings
D) Home Improvement Loans
F) Non-occupant Loans on < 5 Family Dwellings (A B C & D)
2004 - 2018 National Fire Incident Reporting System (NFIRS) incidents
According to the data from the years 2004 - 2018 the average number of fires per year is 45. The highest number of fire incidents - 67 took place in 2006, and the least - 5 in 2004. The data has an increasing trend.
When looking into fire subcategories, the most incidents belonged to: Structure Fires (41.8%), and Outside Fires (39.9%).
Fire incident types reported to NFIRS in Zip Code 20191


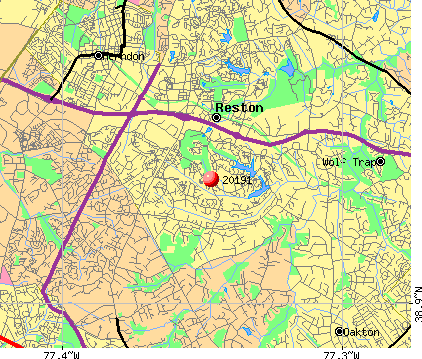 Nearest zip codes: 20190, 22124, 20171, 20194, 20170, 22181.
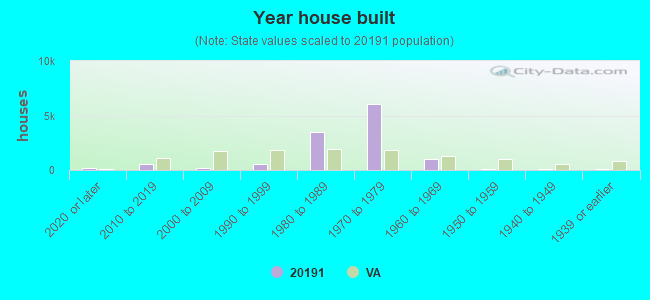


 According to the data from the years 2004 - 2018 the average number of fires per year is 45. The highest number of fire incidents - 67 took place in 2006, and the least - 5 in 2004. The data has an increasing trend.
 When looking into fire subcategories, the most incidents belonged to: Structure Fires (41.8%), and Outside Fires (39.9%).