Estimated zip code population in 2022: 35,164
Zip code population in 2010: 33,293
Zip code population in 2000: 31,379
Houses and condos: 13,977
Renter-occupied apartments: 5,495
% of renters here:
40%State:
31%
March 2022 cost of living index in zip code 19152: 104.3
(near average, U.S. average is 100)
Land area: 2.8
sq. mi.
Water area: 0.0
sq. mi.
Population density: 12,475 people per square mile (very high).
OSM Map
General Map
Google Map
MSN Map
OSM Map
General Map
Google Map
MSN Map
OSM Map
General Map
Google Map
MSN Map
OSM Map
General Map
Google Map
MSN Map
Please wait while loading the map...
Real estate property taxes paid for housing units in 2022:
This zip code:
0.9% ($2,488)Pennsylvania:
1.3% ($3,094)
Median real estate property taxes paid for housing units with mortgages in 2022: $2,516 (0.9%)
Median real estate property taxes paid for housing units with no mortgage in 2022: $2,462 (0.9%)
Profiles of local businesses
Business Search - 14 Million verified businesses
Males: 17,615 Females: 17,548
For population 25 years and over in 19152:
High school or higher: 88.0%Bachelor's degree or higher: 31.5%Graduate or professional degree: 12.2%Unemployed: 5.0%Mean travel time to work (commute): 33.0 minutes
For population 15 years and over in 19152:
Never married: 33.1%Now married: 48.1%Separated: 2.5%Widowed: 7.2%Divorced: 9.0%
Zip code 19152 compared to state average:
Foreign-born population percentage significantly above state average. Length of stay since moving in significantly above state average. 18,264 51.9% White 6,276 17.8% Asian 5,195 14.8% Black 3,920 11.1% Hispanic or Latino 1,270 3.6% Two or more races 201 0.6% Some other race 34 0.10% American Indian
Data:
Median household income ($)
Median household income (% change since 2000)
Household income diversity
Ratio of average income to average house value (%)
Ratio of average income to average rent
Median household income ($) - White
Median household income ($) - Black or African American
Median household income ($) - Asian
Median household income ($) - Hispanic or Latino
Median household income ($) - American Indian and Alaska Native
Median household income ($) - Multirace
Median household income ($) - Other Race
Median household income for houses/condos with a mortgage ($)
Median household income for apartments without a mortgage ($)
Races - White alone (%)
Races - White alone (% change since 2000)
Races - Black alone (%)
Races - Black alone (% change since 2000)
Races - American Indian alone (%)
Races - American Indian alone (% change since 2000)
Races - Asian alone (%)
Races - Asian alone (% change since 2000)
Races - Hispanic (%)
Races - Hispanic (% change since 2000)
Races - Native Hawaiian and Other Pacific Islander alone (%)
Races - Native Hawaiian and Other Pacific Islander alone (% change since 2000)
Races - Two or more races (%)
Races - Two or more races (% change since 2000)
Races - Other race alone (%)
Races - Other race alone (% change since 2000)
Racial diversity
Unemployment (%)
Unemployment (% change since 2000)
Unemployment (%) - White
Unemployment (%) - Black or African American
Unemployment (%) - Asian
Unemployment (%) - Hispanic or Latino
Unemployment (%) - American Indian and Alaska Native
Unemployment (%) - Multirace
Unemployment (%) - Other Race
Population density (people per square mile)
Population - Males (%)
Population - Females (%)
Population - Males (%) - White
Population - Males (%) - Black or African American
Population - Males (%) - Asian
Population - Males (%) - Hispanic or Latino
Population - Males (%) - American Indian and Alaska Native
Population - Males (%) - Multirace
Population - Males (%) - Other Race
Population - Females (%) - White
Population - Females (%) - Black or African American
Population - Females (%) - Asian
Population - Females (%) - Hispanic or Latino
Population - Females (%) - American Indian and Alaska Native
Population - Females (%) - Multirace
Population - Females (%) - Other Race
Coronavirus confirmed cases (Jun 10, 2024)
Deaths caused by coronavirus (Jun 10, 2024)
Coronavirus confirmed cases (per 100k population) (Jun 10, 2024)
Deaths caused by coronavirus (per 100k population) (Jun 10, 2024)
Daily increase in number of cases (Jun 10, 2024)
Weekly increase in number of cases (Jun 10, 2024)
Cases doubled (in days) (Jun 10, 2024)
Hospitalized patients (Apr 18, 2022)
Negative test results (Apr 18, 2022)
Total test results (Apr 18, 2022)
COVID Vaccine doses distributed (per 100k population) (Sep 19, 2023)
COVID Vaccine doses administered (per 100k population) (Sep 19, 2023)
COVID Vaccine doses distributed (Sep 19, 2023)
COVID Vaccine doses administered (Sep 19, 2023)
Likely homosexual households (%)
Likely homosexual households (% change since 2000)
Likely homosexual households - Lesbian couples (%)
Likely homosexual households - Lesbian couples (% change since 2000)
Likely homosexual households - Gay men (%)
Likely homosexual households - Gay men (% change since 2000)
Cost of living index
Median gross rent ($)
Median contract rent ($)
Median monthly housing costs ($)
Median house or condo value ($)
Median house or condo value ($ change since 2000)
Mean house or condo value by units in structure - 1, detached ($)
Mean house or condo value by units in structure - 1, attached ($)
Mean house or condo value by units in structure - 2 ($)
Mean house or condo value by units in structure by units in structure - 3 or 4 ($)
Mean house or condo value by units in structure - 5 or more ($)
Mean house or condo value by units in structure - Boat, RV, van, etc. ($)
Mean house or condo value by units in structure - Mobile home ($)
Median house or condo value ($) - White
Median house or condo value ($) - Black or African American
Median house or condo value ($) - Asian
Median house or condo value ($) - Hispanic or Latino
Median house or condo value ($) - American Indian and Alaska Native
Median house or condo value ($) - Multirace
Median house or condo value ($) - Other Race
Median resident age
Resident age diversity
Median resident age - Males
Median resident age - Females
Median resident age - White
Median resident age - Black or African American
Median resident age - Asian
Median resident age - Hispanic or Latino
Median resident age - American Indian and Alaska Native
Median resident age - Multirace
Median resident age - Other Race
Median resident age - Males - White
Median resident age - Males - Black or African American
Median resident age - Males - Asian
Median resident age - Males - Hispanic or Latino
Median resident age - Males - American Indian and Alaska Native
Median resident age - Males - Multirace
Median resident age - Males - Other Race
Median resident age - Females - White
Median resident age - Females - Black or African American
Median resident age - Females - Asian
Median resident age - Females - Hispanic or Latino
Median resident age - Females - American Indian and Alaska Native
Median resident age - Females - Multirace
Median resident age - Females - Other Race
Commute - mean travel time to work (minutes)
Travel time to work - Less than 5 minutes (%)
Travel time to work - Less than 5 minutes (% change since 2000)
Travel time to work - 5 to 9 minutes (%)
Travel time to work - 5 to 9 minutes (% change since 2000)
Travel time to work - 10 to 19 minutes (%)
Travel time to work - 10 to 19 minutes (% change since 2000)
Travel time to work - 20 to 29 minutes (%)
Travel time to work - 20 to 29 minutes (% change since 2000)
Travel time to work - 30 to 39 minutes (%)
Travel time to work - 30 to 39 minutes (% change since 2000)
Travel time to work - 40 to 59 minutes (%)
Travel time to work - 40 to 59 minutes (% change since 2000)
Travel time to work - 60 to 89 minutes (%)
Travel time to work - 60 to 89 minutes (% change since 2000)
Travel time to work - 90 or more minutes (%)
Travel time to work - 90 or more minutes (% change since 2000)
Marital status - Never married (%)
Marital status - Now married (%)
Marital status - Separated (%)
Marital status - Widowed (%)
Marital status - Divorced (%)
Median family income ($)
Median family income (% change since 2000)
Median non-family income ($)
Median non-family income (% change since 2000)
Median per capita income ($)
Median per capita income (% change since 2000)
Median family income ($) - White
Median family income ($) - Black or African American
Median family income ($) - Asian
Median family income ($) - Hispanic or Latino
Median family income ($) - American Indian and Alaska Native
Median family income ($) - Multirace
Median family income ($) - Other Race
Median year house/condo built
Median year apartment built
Year house built - Built 2005 or later (%)
Year house built - Built 2000 to 2004 (%)
Year house built - Built 1990 to 1999 (%)
Year house built - Built 1980 to 1989 (%)
Year house built - Built 1970 to 1979 (%)
Year house built - Built 1960 to 1969 (%)
Year house built - Built 1950 to 1959 (%)
Year house built - Built 1940 to 1949 (%)
Year house built - Built 1939 or earlier (%)
Average household size
Household density (households per square mile)
Average household size - White
Average household size - Black or African American
Average household size - Asian
Average household size - Hispanic or Latino
Average household size - American Indian and Alaska Native
Average household size - Multirace
Average household size - Other Race
Occupied housing units (%)
Vacant housing units (%)
Owner occupied housing units (%)
Renter occupied housing units (%)
Vacancy status - For rent (%)
Vacancy status - For sale only (%)
Vacancy status - Rented or sold, not occupied (%)
Vacancy status - For seasonal, recreational, or occasional use (%)
Vacancy status - For migrant workers (%)
Vacancy status - Other vacant (%)
Residents with income below the poverty level (%)
Residents with income below 50% of the poverty level (%)
Children below poverty level (%)
Poor families by family type - Married-couple family (%)
Poor families by family type - Male, no wife present (%)
Poor families by family type - Female, no husband present (%)
Poverty status for native-born residents (%)
Poverty status for foreign-born residents (%)
Poverty among high school graduates not in families (%)
Poverty among people who did not graduate high school not in families (%)
Residents with income below the poverty level (%) - White
Residents with income below the poverty level (%) - Black or African American
Residents with income below the poverty level (%) - Asian
Residents with income below the poverty level (%) - Hispanic or Latino
Residents with income below the poverty level (%) - American Indian and Alaska Native
Residents with income below the poverty level (%) - Multirace
Residents with income below the poverty level (%) - Other Race
Air pollution - Air Quality Index (AQI)
Air pollution - CO
Air pollution - NO2
Air pollution - SO2
Air pollution - Ozone
Air pollution - PM10
Air pollution - PM25
Air pollution - Pb
Crime - Murders per 100,000 population
Crime - Rapes per 100,000 population
Crime - Robberies per 100,000 population
Crime - Assaults per 100,000 population
Crime - Burglaries per 100,000 population
Crime - Thefts per 100,000 population
Crime - Auto thefts per 100,000 population
Crime - Arson per 100,000 population
Crime - City-data.com crime index
Crime - Violent crime index
Crime - Property crime index
Crime - Murders per 100,000 population (5 year average)
Crime - Rapes per 100,000 population (5 year average)
Crime - Robberies per 100,000 population (5 year average)
Crime - Assaults per 100,000 population (5 year average)
Crime - Burglaries per 100,000 population (5 year average)
Crime - Thefts per 100,000 population (5 year average)
Crime - Auto thefts per 100,000 population (5 year average)
Crime - Arson per 100,000 population (5 year average)
Crime - City-data.com crime index (5 year average)
Crime - Violent crime index (5 year average)
Crime - Property crime index (5 year average)
1996 Presidential Elections Results (%) - Democratic Party (Clinton)
1996 Presidential Elections Results (%) - Republican Party (Dole)
1996 Presidential Elections Results (%) - Other
2000 Presidential Elections Results (%) - Democratic Party (Gore)
2000 Presidential Elections Results (%) - Republican Party (Bush)
2000 Presidential Elections Results (%) - Other
2004 Presidential Elections Results (%) - Democratic Party (Kerry)
2004 Presidential Elections Results (%) - Republican Party (Bush)
2004 Presidential Elections Results (%) - Other
2008 Presidential Elections Results (%) - Democratic Party (Obama)
2008 Presidential Elections Results (%) - Republican Party (McCain)
2008 Presidential Elections Results (%) - Other
2012 Presidential Elections Results (%) - Democratic Party (Obama)
2012 Presidential Elections Results (%) - Republican Party (Romney)
2012 Presidential Elections Results (%) - Other
2016 Presidential Elections Results (%) - Democratic Party (Clinton)
2016 Presidential Elections Results (%) - Republican Party (Trump)
2016 Presidential Elections Results (%) - Other
2020 Presidential Elections Results (%) - Democratic Party (Biden)
2020 Presidential Elections Results (%) - Republican Party (Trump)
2020 Presidential Elections Results (%) - Other
Ancestries Reported - Arab (%)
Ancestries Reported - Czech (%)
Ancestries Reported - Danish (%)
Ancestries Reported - Dutch (%)
Ancestries Reported - English (%)
Ancestries Reported - French (%)
Ancestries Reported - French Canadian (%)
Ancestries Reported - German (%)
Ancestries Reported - Greek (%)
Ancestries Reported - Hungarian (%)
Ancestries Reported - Irish (%)
Ancestries Reported - Italian (%)
Ancestries Reported - Lithuanian (%)
Ancestries Reported - Norwegian (%)
Ancestries Reported - Polish (%)
Ancestries Reported - Portuguese (%)
Ancestries Reported - Russian (%)
Ancestries Reported - Scotch-Irish (%)
Ancestries Reported - Scottish (%)
Ancestries Reported - Slovak (%)
Ancestries Reported - Subsaharan African (%)
Ancestries Reported - Swedish (%)
Ancestries Reported - Swiss (%)
Ancestries Reported - Ukrainian (%)
Ancestries Reported - United States (%)
Ancestries Reported - Welsh (%)
Ancestries Reported - West Indian (%)
Ancestries Reported - Other (%)
Educational Attainment - No schooling completed (%)
Educational Attainment - Less than high school (%)
Educational Attainment - High school or equivalent (%)
Educational Attainment - Less than 1 year of college (%)
Educational Attainment - 1 or more years of college (%)
Educational Attainment - Associate degree (%)
Educational Attainment - Bachelor's degree (%)
Educational Attainment - Master's degree (%)
Educational Attainment - Professional school degree (%)
Educational Attainment - Doctorate degree (%)
School Enrollment - Nursery, preschool (%)
School Enrollment - Kindergarten (%)
School Enrollment - Grade 1 to 4 (%)
School Enrollment - Grade 5 to 8 (%)
School Enrollment - Grade 9 to 12 (%)
School Enrollment - College undergrad (%)
School Enrollment - Graduate or professional (%)
School Enrollment - Not enrolled in school (%)
School enrollment - Public schools (%)
School enrollment - Private schools (%)
School enrollment - Not enrolled (%)
Median number of rooms in houses and condos
Median number of rooms in apartments
Housing units lacking complete plumbing facilities (%)
Housing units lacking complete kitchen facilities (%)
Density of houses
Urban houses (%)
Rural houses (%)
Households with people 60 years and over (%)
Households with people 65 years and over (%)
Households with people 75 years and over (%)
Households with one or more nonrelatives (%)
Households with no nonrelatives (%)
Population in households (%)
Family households (%)
Nonfamily households (%)
Population in families (%)
Family households with own children (%)
Median number of bedrooms in owner occupied houses
Mean number of bedrooms in owner occupied houses
Median number of bedrooms in renter occupied houses
Mean number of bedrooms in renter occupied houses
Median number of vehichles in owner occupied houses
Mean number of vehichles in owner occupied houses
Median number of vehichles in renter occupied houses
Mean number of vehichles in renter occupied houses
Mortgage status - with mortgage (%)
Mortgage status - with second mortgage (%)
Mortgage status - with home equity loan (%)
Mortgage status - with both second mortgage and home equity loan (%)
Mortgage status - without a mortgage (%)
Average family size
Average family size - White
Average family size - Black or African American
Average family size - Asian
Average family size - Hispanic or Latino
Average family size - American Indian and Alaska Native
Average family size - Multirace
Average family size - Other Race
Geographical mobility - Same house 1 year ago (%)
Geographical mobility - Moved within same county (%)
Geographical mobility - Moved from different county within same state (%)
Geographical mobility - Moved from different state (%)
Geographical mobility - Moved from abroad (%)
Place of birth - Born in state of residence (%)
Place of birth - Born in other state (%)
Place of birth - Native, outside of US (%)
Place of birth - Foreign born (%)
Housing units in structures - 1, detached (%)
Housing units in structures - 1, attached (%)
Housing units in structures - 2 (%)
Housing units in structures - 3 or 4 (%)
Housing units in structures - 5 to 9 (%)
Housing units in structures - 10 to 19 (%)
Housing units in structures - 20 to 49 (%)
Housing units in structures - 50 or more (%)
Housing units in structures - Mobile home (%)
Housing units in structures - Boat, RV, van, etc. (%)
House/condo owner moved in on average (years ago)
Renter moved in on average (years ago)
Year householder moved into unit - Moved in 1999 to March 2000 (%)
Year householder moved into unit - Moved in 1995 to 1998 (%)
Year householder moved into unit - Moved in 1990 to 1994 (%)
Year householder moved into unit - Moved in 1980 to 1989 (%)
Year householder moved into unit - Moved in 1970 to 1979 (%)
Year householder moved into unit - Moved in 1969 or earlier (%)
Means of transportation to work - Drove car alone (%)
Means of transportation to work - Carpooled (%)
Means of transportation to work - Public transportation (%)
Means of transportation to work - Bus or trolley bus (%)
Means of transportation to work - Streetcar or trolley car (%)
Means of transportation to work - Subway or elevated (%)
Means of transportation to work - Railroad (%)
Means of transportation to work - Ferryboat (%)
Means of transportation to work - Taxicab (%)
Means of transportation to work - Motorcycle (%)
Means of transportation to work - Bicycle (%)
Means of transportation to work - Walked (%)
Means of transportation to work - Other means (%)
Working at home (%)
Industry diversity
Most Common Industries - Agriculture, forestry, fishing and hunting, and mining (%)
Most Common Industries - Agriculture, forestry, fishing and hunting (%)
Most Common Industries - Mining, quarrying, and oil and gas extraction (%)
Most Common Industries - Construction (%)
Most Common Industries - Manufacturing (%)
Most Common Industries - Wholesale trade (%)
Most Common Industries - Retail trade (%)
Most Common Industries - Transportation and warehousing, and utilities (%)
Most Common Industries - Transportation and warehousing (%)
Most Common Industries - Utilities (%)
Most Common Industries - Information (%)
Most Common Industries - Finance and insurance, and real estate and rental and leasing (%)
Most Common Industries - Finance and insurance (%)
Most Common Industries - Real estate and rental and leasing (%)
Most Common Industries - Professional, scientific, and management, and administrative and waste management services (%)
Most Common Industries - Professional, scientific, and technical services (%)
Most Common Industries - Management of companies and enterprises (%)
Most Common Industries - Administrative and support and waste management services (%)
Most Common Industries - Educational services, and health care and social assistance (%)
Most Common Industries - Educational services (%)
Most Common Industries - Health care and social assistance (%)
Most Common Industries - Arts, entertainment, and recreation, and accommodation and food services (%)
Most Common Industries - Arts, entertainment, and recreation (%)
Most Common Industries - Accommodation and food services (%)
Most Common Industries - Other services, except public administration (%)
Most Common Industries - Public administration (%)
Occupation diversity
Most Common Occupations - Management, business, science, and arts occupations (%)
Most Common Occupations - Management, business, and financial occupations (%)
Most Common Occupations - Management occupations (%)
Most Common Occupations - Business and financial operations occupations (%)
Most Common Occupations - Computer, engineering, and science occupations (%)
Most Common Occupations - Computer and mathematical occupations (%)
Most Common Occupations - Architecture and engineering occupations (%)
Most Common Occupations - Life, physical, and social science occupations (%)
Most Common Occupations - Education, legal, community service, arts, and media occupations (%)
Most Common Occupations - Community and social service occupations (%)
Most Common Occupations - Legal occupations (%)
Most Common Occupations - Education, training, and library occupations (%)
Most Common Occupations - Arts, design, entertainment, sports, and media occupations (%)
Most Common Occupations - Healthcare practitioners and technical occupations (%)
Most Common Occupations - Health diagnosing and treating practitioners and other technical occupations (%)
Most Common Occupations - Health technologists and technicians (%)
Most Common Occupations - Service occupations (%)
Most Common Occupations - Healthcare support occupations (%)
Most Common Occupations - Protective service occupations (%)
Most Common Occupations - Fire fighting and prevention, and other protective service workers including supervisors (%)
Most Common Occupations - Law enforcement workers including supervisors (%)
Most Common Occupations - Food preparation and serving related occupations (%)
Most Common Occupations - Building and grounds cleaning and maintenance occupations (%)
Most Common Occupations - Personal care and service occupations (%)
Most Common Occupations - Sales and office occupations (%)
Most Common Occupations - Sales and related occupations (%)
Most Common Occupations - Office and administrative support occupations (%)
Most Common Occupations - Natural resources, construction, and maintenance occupations (%)
Most Common Occupations - Farming, fishing, and forestry occupations (%)
Most Common Occupations - Construction and extraction occupations (%)
Most Common Occupations - Installation, maintenance, and repair occupations (%)
Most Common Occupations - Production, transportation, and material moving occupations (%)
Most Common Occupations - Production occupations (%)
Most Common Occupations - Transportation occupations (%)
Most Common Occupations - Material moving occupations (%)
People in Group quarters - Institutionalized population (%)
People in Group quarters - Correctional institutions (%)
People in Group quarters - Federal prisons and detention centers (%)
People in Group quarters - Halfway houses (%)
People in Group quarters - Local jails and other confinement facilities (including police lockups) (%)
People in Group quarters - Military disciplinary barracks (%)
People in Group quarters - State prisons (%)
People in Group quarters - Other types of correctional institutions (%)
People in Group quarters - Nursing homes (%)
People in Group quarters - Hospitals/wards, hospices, and schools for the handicapped (%)
People in Group quarters - Hospitals/wards and hospices for chronically ill (%)
People in Group quarters - Hospices or homes for chronically ill (%)
People in Group quarters - Military hospitals or wards for chronically ill (%)
People in Group quarters - Other hospitals or wards for chronically ill (%)
People in Group quarters - Hospitals or wards for drug/alcohol abuse (%)
People in Group quarters - Mental (Psychiatric) hospitals or wards (%)
People in Group quarters - Schools, hospitals, or wards for the mentally retarded (%)
People in Group quarters - Schools, hospitals, or wards for the physically handicapped (%)
People in Group quarters - Institutions for the deaf (%)
People in Group quarters - Institutions for the blind (%)
People in Group quarters - Orthopedic wards and institutions for the physically handicapped (%)
People in Group quarters - Wards in general hospitals for patients who have no usual home elsewhere (%)
People in Group quarters - Wards in military hospitals for patients who have no usual home elsewhere (%)
People in Group quarters - Juvenile institutions (%)
People in Group quarters - Long-term care (%)
People in Group quarters - Homes for abused, dependent, and neglected children (%)
People in Group quarters - Residential treatment centers for emotionally disturbed children (%)
People in Group quarters - Training schools for juvenile delinquents (%)
People in Group quarters - Short-term care, detention or diagnostic centers for delinquent children (%)
People in Group quarters - Type of juvenile institution unknown (%)
People in Group quarters - Noninstitutionalized population (%)
People in Group quarters - College dormitories (includes college quarters off campus) (%)
People in Group quarters - Military quarters (%)
People in Group quarters - On base (%)
People in Group quarters - Barracks, unaccompanied personnel housing (UPH), (Enlisted/Officer), ;and similar group living quarters for military personnel (%)
People in Group quarters - Transient quarters for temporary residents (%)
People in Group quarters - Military ships (%)
People in Group quarters - Group homes (%)
People in Group quarters - Homes or halfway houses for drug/alcohol abuse (%)
People in Group quarters - Homes for the mentally ill (%)
People in Group quarters - Homes for the mentally retarded (%)
People in Group quarters - Homes for the physically handicapped (%)
People in Group quarters - Other group homes (%)
People in Group quarters - Religious group quarters (%)
People in Group quarters - Dormitories (%)
People in Group quarters - Agriculture workers' dormitories on farms (%)
People in Group quarters - Job Corps and vocational training facilities (%)
People in Group quarters - Other workers' dormitories (%)
People in Group quarters - Crews of maritime vessels (%)
People in Group quarters - Other nonhousehold living situations (%)
People in Group quarters - Other noninstitutional group quarters (%)
Residents speaking English at home (%)
Residents speaking English at home - Born in the United States (%)
Residents speaking English at home - Native, born elsewhere (%)
Residents speaking English at home - Foreign born (%)
Residents speaking Spanish at home (%)
Residents speaking Spanish at home - Born in the United States (%)
Residents speaking Spanish at home - Native, born elsewhere (%)
Residents speaking Spanish at home - Foreign born (%)
Residents speaking other language at home (%)
Residents speaking other language at home - Born in the United States (%)
Residents speaking other language at home - Native, born elsewhere (%)
Residents speaking other language at home - Foreign born (%)
Class of Workers - Employee of private company (%)
Class of Workers - Self-employed in own incorporated business (%)
Class of Workers - Private not-for-profit wage and salary workers (%)
Class of Workers - Local government workers (%)
Class of Workers - State government workers (%)
Class of Workers - Federal government workers (%)
Class of Workers - Self-employed workers in own not incorporated business and Unpaid family workers (%)
House heating fuel used in houses and condos - Utility gas (%)
House heating fuel used in houses and condos - Bottled, tank, or LP gas (%)
House heating fuel used in houses and condos - Electricity (%)
House heating fuel used in houses and condos - Fuel oil, kerosene, etc. (%)
House heating fuel used in houses and condos - Coal or coke (%)
House heating fuel used in houses and condos - Wood (%)
House heating fuel used in houses and condos - Solar energy (%)
House heating fuel used in houses and condos - Other fuel (%)
House heating fuel used in houses and condos - No fuel used (%)
House heating fuel used in apartments - Utility gas (%)
House heating fuel used in apartments - Bottled, tank, or LP gas (%)
House heating fuel used in apartments - Electricity (%)
House heating fuel used in apartments - Fuel oil, kerosene, etc. (%)
House heating fuel used in apartments - Coal or coke (%)
House heating fuel used in apartments - Wood (%)
House heating fuel used in apartments - Solar energy (%)
House heating fuel used in apartments - Other fuel (%)
House heating fuel used in apartments - No fuel used (%)
Armed forces status - In Armed Forces (%)
Armed forces status - Civilian (%)
Armed forces status - Civilian - Veteran (%)
Armed forces status - Civilian - Nonveteran (%)
Fatal accidents locations in years 2005-2021
Fatal accidents locations in 2005
Fatal accidents locations in 2006
Fatal accidents locations in 2007
Fatal accidents locations in 2008
Fatal accidents locations in 2009
Fatal accidents locations in 2010
Fatal accidents locations in 2011
Fatal accidents locations in 2012
Fatal accidents locations in 2013
Fatal accidents locations in 2014
Fatal accidents locations in 2015
Fatal accidents locations in 2016
Fatal accidents locations in 2017
Fatal accidents locations in 2018
Fatal accidents locations in 2019
Fatal accidents locations in 2020
Fatal accidents locations in 2021
Alcohol use - People drinking some alcohol every month (%)
Alcohol use - People not drinking at all (%)
Alcohol use - Average days/month drinking alcohol
Alcohol use - Average drinks/week
Alcohol use - Average days/year people drink much
Audiometry - Average condition of hearing (%)
Audiometry - People that can hear a whisper from across a quiet room (%)
Audiometry - People that can hear normal voice from across a quiet room (%)
Audiometry - Ears ringing, roaring, buzzing (%)
Audiometry - Had a job exposure to loud noise (%)
Audiometry - Had off-work exposure to loud noise (%)
Blood Pressure & Cholesterol - Has high blood pressure (%)
Blood Pressure & Cholesterol - Checking blood pressure at home (%)
Blood Pressure & Cholesterol - Frequently checking blood cholesterol (%)
Blood Pressure & Cholesterol - Has high cholesterol level (%)
Consumer Behavior - Money monthly spent on food at supermarket/grocery store
Consumer Behavior - Money monthly spent on food at other stores
Consumer Behavior - Money monthly spent on eating out
Consumer Behavior - Money monthly spent on carryout/delivered foods
Consumer Behavior - Income spent on food at supermarket/grocery store (%)
Consumer Behavior - Income spent on food at other stores (%)
Consumer Behavior - Income spent on eating out (%)
Consumer Behavior - Income spent on carryout/delivered foods (%)
Current Health Status - General health condition (%)
Current Health Status - Blood donors (%)
Current Health Status - Has blood ever tested for HIV virus (%)
Current Health Status - Left-handed people (%)
Dermatology - People using sunscreen (%)
Diabetes - Diabetics (%)
Diabetes - Had a blood test for high blood sugar (%)
Diabetes - People taking insulin (%)
Diet Behavior & Nutrition - Diet health (%)
Diet Behavior & Nutrition - Milk product consumption (# of products/month)
Diet Behavior & Nutrition - Meals not home prepared (#/week)
Diet Behavior & Nutrition - Meals from fast food or pizza place (#/week)
Diet Behavior & Nutrition - Ready-to-eat foods (#/month)
Diet Behavior & Nutrition - Frozen meals/pizza (#/month)
Drug Use - People that ever used marijuana or hashish (%)
Drug Use - Ever used hard drugs (%)
Drug Use - Ever used any form of cocaine (%)
Drug Use - Ever used heroin (%)
Drug Use - Ever used methamphetamine (%)
Health Insurance - People covered by health insurance (%)
Kidney Conditions-Urology - Avg. # of times urinating at night
Medical Conditions - People with asthma (%)
Medical Conditions - People with anemia (%)
Medical Conditions - People with psoriasis (%)
Medical Conditions - People with overweight (%)
Medical Conditions - Elderly people having difficulties in thinking or remembering (%)
Medical Conditions - People who ever received blood transfusion (%)
Medical Conditions - People having trouble seeing even with glass/contacts (%)
Medical Conditions - People with arthritis (%)
Medical Conditions - People with gout (%)
Medical Conditions - People with congestive heart failure (%)
Medical Conditions - People with coronary heart disease (%)
Medical Conditions - People with angina pectoris (%)
Medical Conditions - People who ever had heart attack (%)
Medical Conditions - People who ever had stroke (%)
Medical Conditions - People with emphysema (%)
Medical Conditions - People with thyroid problem (%)
Medical Conditions - People with chronic bronchitis (%)
Medical Conditions - People with any liver condition (%)
Medical Conditions - People who ever had cancer or malignancy (%)
Mental Health - People who have little interest in doing things (%)
Mental Health - People feeling down, depressed, or hopeless (%)
Mental Health - People who have trouble sleeping or sleeping too much (%)
Mental Health - People feeling tired or having little energy (%)
Mental Health - People with poor appetite or overeating (%)
Mental Health - People feeling bad about themself (%)
Mental Health - People who have trouble concentrating on things (%)
Mental Health - People moving or speaking slowly or too fast (%)
Mental Health - People having thoughts they would be better off dead (%)
Oral Health - Average years since last visit a dentist
Oral Health - People embarrassed because of mouth (%)
Oral Health - People with gum disease (%)
Oral Health - General health of teeth and gums (%)
Oral Health - Average days a week using dental floss/device
Oral Health - Average days a week using mouthwash for dental problem
Oral Health - Average number of teeth
Pesticide Use - Households using pesticides to control insects (%)
Pesticide Use - Households using pesticides to kill weeds (%)
Physical Activity - People doing vigorous-intensity work activities (%)
Physical Activity - People doing moderate-intensity work activities (%)
Physical Activity - People walking or bicycling (%)
Physical Activity - People doing vigorous-intensity recreational activities (%)
Physical Activity - People doing moderate-intensity recreational activities (%)
Physical Activity - Average hours a day doing sedentary activities
Physical Activity - Average hours a day watching TV or videos
Physical Activity - Average hours a day using computer
Physical Functioning - People having limitations keeping them from working (%)
Physical Functioning - People limited in amount of work they can do (%)
Physical Functioning - People that need special equipment to walk (%)
Physical Functioning - People experiencing confusion/memory problems (%)
Physical Functioning - People requiring special healthcare equipment (%)
Prescription Medications - Average number of prescription medicines taking
Preventive Aspirin Use - Adults 40+ taking low-dose aspirin (%)
Reproductive Health - Vaginal deliveries (%)
Reproductive Health - Cesarean deliveries (%)
Reproductive Health - Deliveries resulted in a live birth (%)
Reproductive Health - Pregnancies resulted in a delivery (%)
Reproductive Health - Women breastfeeding newborns (%)
Reproductive Health - Women that had a hysterectomy (%)
Reproductive Health - Women that had both ovaries removed (%)
Reproductive Health - Women that have ever taken birth control pills (%)
Reproductive Health - Women taking birth control pills (%)
Reproductive Health - Women that have ever used Depo-Provera or injectables (%)
Reproductive Health - Women that have ever used female hormones (%)
Sexual Behavior - People 18+ that ever had sex (vaginal, anal, or oral) (%)
Sexual Behavior - Males 18+ that ever had vaginal sex with a woman (%)
Sexual Behavior - Males 18+ that ever performed oral sex on a woman (%)
Sexual Behavior - Males 18+ that ever had anal sex with a woman (%)
Sexual Behavior - Males 18+ that ever had any sex with a man (%)
Sexual Behavior - Females 18+ that ever had vaginal sex with a man (%)
Sexual Behavior - Females 18+ that ever performed oral sex on a man (%)
Sexual Behavior - Females 18+ that ever had anal sex with a man (%)
Sexual Behavior - Females 18+ that ever had any kind of sex with a woman (%)
Sexual Behavior - Average age people first had sex
Sexual Behavior - Average number of female sex partners in lifetime (males 18+)
Sexual Behavior - Average number of female vaginal sex partners in lifetime (males 18+)
Sexual Behavior - Average age people first performed oral sex on a woman (18+)
Sexual Behavior - Average number of woman performed oral sex on in lifetime (18+)
Sexual Behavior - Average number of male sex partners in lifetime (males 18+)
Sexual Behavior - Average number of male anal sex partners in lifetime (males 18+)
Sexual Behavior - Average age people first performed oral sex on a man (18+)
Sexual Behavior - Average number of male oral sex partners in lifetime (18+)
Sexual Behavior - People using protection when performing oral sex (%)
Sexual Behavior - Average number of times people have vaginal or anal sex a year
Sexual Behavior - People having sex without condom (%)
Sexual Behavior - Average number of male sex partners in lifetime (females 18+)
Sexual Behavior - Average number of male vaginal sex partners in lifetime (females 18+)
Sexual Behavior - Average number of female sex partners in lifetime (females 18+)
Sexual Behavior - Circumcised males 18+ (%)
Sleep Disorders - Average hours sleeping at night
Sleep Disorders - People that has trouble sleeping (%)
Smoking-Cigarette Use - People smoking cigarettes (%)
Taste & Smell - People 40+ having problems with smell (%)
Taste & Smell - People 40+ having problems with taste (%)
Taste & Smell - People 40+ that ever had wisdom teeth removed (%)
Taste & Smell - People 40+ that ever had tonsils teeth removed (%)
Taste & Smell - People 40+ that ever had a loss of consciousness because of a head injury (%)
Taste & Smell - People 40+ that ever had a broken nose or other serious injury to face or skull (%)
Taste & Smell - People 40+ that ever had two or more sinus infections (%)
Weight - Average height (inches)
Weight - Average weight (pounds)
Weight - Average BMI
Weight - People that are obese (%)
Weight - People that ever were obese (%)
Weight - People trying to lose weight (%)
100%
urban population.
Estimated median house/condo value in 2022: $268,400
19152:
$268,400Pennsylvania:
$245,500
According to our research of Pennsylvania and other state lists, there were 27 registered sex offenders living in 19152 zip code as of June 10, 2024 . The ratio of all residents to sex offenders in zip code 19152 is 1,311 to 1.The ratio of registered sex offenders to all residents in this zip code is lower than the state average.
Median resident age: This zip code:
40.7 yearsPennsylvania median age:
40.9 years
Average household size: This zip code:
2.5 peoplePennsylvania:
2.4 people
Averages for the 2020 tax year for zip code 19152, filed in 2021:
Average Adjusted Gross Income (AGI) in 2020: $46,571 (Individual Income Tax Returns) Here:
$46,571State:
$75,707
Salary/wage: $44,216 (reported on 74.9% of returns )Here:
$44,216State:
$62,806
(% of AGI for various income ranges: 987.7% for AGIs below $25k , 3278.0% for AGIs $25k-50k , 6490.9% for AGIs $50k-75k , 9618.3% for AGIs $75k-100k , 17299.5% for AGIs $100k-200k , 47486.7% for AGIs over 200k ) Taxable interest for individuals: $1,209 (reported on 26.0% of returns )This zip code:
$1,209Pennsylvania:
$1,633
(% of AGI for various income ranges: 20.8% for AGIs below $25k , 25.1% for AGIs $25k-50k , 50.3% for AGIs $50k-75k , 87.1% for AGIs $75k-100k , 163.1% for AGIs $100k-200k , 453.3% for AGIs over 200k ) Ordinary dividends: $2,605 (reported on 11.1% of returns )(% of AGI for various income ranges: 16.3% for AGIs below $25k , 20.0% for AGIs $25k-50k , 49.5% for AGIs $50k-75k , 70.8% for AGIs $75k-100k , 154.2% for AGIs $100k-200k , 750.0% for AGIs over 200k ) Net capital gain/loss in AGI: +$6,308 (reported on 10.1% of returns )Here:
+$6,308State:
+$23,522
(% of AGI for various income ranges: 8.4% for AGIs below $25k , 25.2% for AGIs $25k-50k , 68.7% for AGIs $50k-75k , 116.9% for AGIs $75k-100k , 449.8% for AGIs $100k-200k , 4855.0% for AGIs over 200k ) Profit/loss from business: +$9,947 (reported on 20.2% of returns )Here:
+$9,947State:
+$16,274
(% of AGI for various income ranges: 287.2% for AGIs below $25k , 313.0% for AGIs $25k-50k , 228.6% for AGIs $50k-75k , 240.9% for AGIs $75k-100k , 279.1% for AGIs $100k-200k , 2376.7% for AGIs over 200k ) Taxable individual retirement arrangement distribution: $12,633 (reported on 6.4% of returns )19152:
$12,633Pennsylvania:
$18,583
(% of AGI for various income ranges: 46.1% for AGIs below $25k , 50.7% for AGIs $25k-50k , 123.1% for AGIs $50k-75k , 202.5% for AGIs $75k-100k , 623.1% for AGIs $100k-200k ) Total itemized deductions: $25,849 (reported on 5.1% of returns )Here:
$25,849State:
$34,850
(% of AGI for various income ranges: 23.5% for AGIs below $25k , 86.1% for AGIs $25k-50k , 278.6% for AGIs $50k-75k , 465.8% for AGIs $75k-100k , 721.5% for AGIs $100k-200k , 2890.0% for AGIs over 200k ) Charity contributions: $6,498 (reported on 4.1% of returns )(% of AGI for various income ranges: 14.9% for AGIs $25k-50k , 50.9% for AGIs $50k-75k , 99.2% for AGIs $75k-100k , 180.2% for AGIs $100k-200k , 618.3% for AGIs over 200k ) Taxes paid: $7,341 (reported on 5.1% of returns )(% of AGI for various income ranges: 2.4% for AGIs below $25k , 20.1% for AGIs $25k-50k , 75.9% for AGIs $50k-75k , 157.2% for AGIs $75k-100k , 231.3% for AGIs $100k-200k , 683.3% for AGIs over 200k ) Earned income credit: $2,276 (reported on 20.5% of returns )(% of AGI for various income ranges: 109.4% for AGIs below $25k , 90.7% for AGIs $25k-50k , 1.3% for AGIs $50k-75k ) Percentage of individuals using paid preparers for their 2020 taxes: 90.2%(% for various income ranges: 88.6% for AGIs below $25k , 92.5% for AGIs $25k-50k , 90.7% for AGIs $50k-75k , 90.5% for AGIs $75k-100k , 89.6% for AGIs $100k-200k , 86.7% for AGIs over 200k )
Averages for the 2012 tax year for zip code 19152, filed in 2013:
Average Adjusted Gross Income (AGI) in 2012: $42,104 (Individual Income Tax Returns) Here:
$42,104State:
$61,346
Salary/wage: $41,157 (reported on 78.6% of returns )Here:
$41,157State:
$51,902
(% of AGI for various income ranges: 63.2% for AGIs below $25k , 77.3% for AGIs $25k-50k , 80.0% for AGIs $50k-75k , 80.6% for AGIs $75k-100k , 81.8% for AGIs $100k-200k , 55.6% for AGIs over 200k ) Taxable interest for individuals: $1,331 (reported on 33.6% of returns )This zip code:
$1,331Pennsylvania:
$1,588
(% of AGI for various income ranges: 1.9% for AGIs below $25k , 1.0% for AGIs $25k-50k , 0.9% for AGIs $50k-75k , 1.0% for AGIs $75k-100k , 0.9% for AGIs $100k-200k , 1.2% for AGIs over 200k ) Ordinary dividends: $2,921 (reported on 14.4% of returns )(% of AGI for various income ranges: 1.4% for AGIs below $25k , 0.7% for AGIs $25k-50k , 1.0% for AGIs $50k-75k , 0.8% for AGIs $75k-100k , 0.8% for AGIs $100k-200k , 3.3% for AGIs over 200k ) Net capital gain/loss in AGI: +$2,492 (reported on 9.1% of returns )Here:
+$2,492State:
+$14,495
(% of AGI for various income ranges: 0.2% for AGIs $25k-50k , 0.2% for AGIs $50k-75k , 0.4% for AGIs $75k-100k , 0.5% for AGIs $100k-200k , 7.4% for AGIs over 200k ) Profit/loss from business: +$11,421 (reported on 12.9% of returns )Here:
+$11,421State:
+$16,268
(% of AGI for various income ranges: 13.1% for AGIs below $25k , 4.2% for AGIs $25k-50k , 1.3% for AGIs $50k-75k , 1.2% for AGIs $75k-100k , 2.0% for AGIs $100k-200k ) Taxable individual retirement arrangement distribution: $9,791 (reported on 9.9% of returns )19152:
$9,791Pennsylvania:
$14,550
(% of AGI for various income ranges: 3.5% for AGIs below $25k , 1.8% for AGIs $25k-50k , 2.0% for AGIs $50k-75k , 2.2% for AGIs $75k-100k , 2.0% for AGIs $100k-200k , 5.1% for AGIs over 200k ) Total itemized deductions: $17,959 (24% of AGI, reported on 32.1% of returns )Here:
$17,959State:
$23,538
Here:
24.5% of AGIState:
18.4% of AGI
(% of AGI for various income ranges: 8.0% for AGIs below $25k , 12.3% for AGIs $25k-50k , 15.5% for AGIs $50k-75k , 15.3% for AGIs $75k-100k , 15.3% for AGIs $100k-200k , 13.1% for AGIs over 200k ) Charity contributions: $2,229 (reported on 26.4% of returns )(% of AGI for various income ranges: 0.4% for AGIs below $25k , 1.1% for AGIs $25k-50k , 1.6% for AGIs $50k-75k , 1.7% for AGIs $75k-100k , 1.9% for AGIs $100k-200k , 1.5% for AGIs over 200k ) Taxes paid: $7,185 (reported on 31.9% of returns )(% of AGI for various income ranges: 1.7% for AGIs below $25k , 3.5% for AGIs $25k-50k , 6.3% for AGIs $50k-75k , 6.6% for AGIs $75k-100k , 7.5% for AGIs $100k-200k , 6.6% for AGIs over 200k ) Earned income credit: $2,257 (reported on 20.4% of returns )(% of AGI for various income ranges: 6.8% for AGIs below $25k , 1.2% for AGIs $25k-50k ) Percentage of individuals using paid preparers for their 2012 taxes: 59.6%(% for various income ranges: 60.0% for AGIs below $25k , 57.8% for AGIs $25k-50k , 59.1% for AGIs $50k-75k , 60.8% for AGIs $75k-100k , 62.8% for AGIs $100k-200k , 66.7% for AGIs over 200k )
Averages for the 2004 tax year for zip code 19152, filed in 2005:
Average Adjusted Gross Income (AGI) in 2004: $38,377 (Individual Income Tax Returns) Here:
$38,377State:
$48,049
Salary/wage: $38,494 (reported on 77.7% of returns )Here:
$38,494State:
$42,646
(% of AGI for various income ranges: 76.0% for AGIs below $10k , 62.8% for AGIs $10k-25k , 79.4% for AGIs $25k-50k , 81.4% for AGIs $50k-75k , 84.4% for AGIs $75k-100k , 74.2% for AGIs over 100k ) Taxable interest for individuals: $2,068 (reported on 55.2% of returns )This zip code:
$2,068Pennsylvania:
$1,657
(% of AGI for various income ranges: 11.3% for AGIs below $10k , 5.4% for AGIs $10k-25k , 2.8% for AGIs $25k-50k , 2.3% for AGIs $50k-75k , 2.1% for AGIs $75k-100k , 2.6% for AGIs over 100k ) Taxable dividends: $2,027 (reported on 23.0% of returns )(% of AGI for various income ranges: 4.9% for AGIs below $10k , 2.2% for AGIs $10k-25k , 1.0% for AGIs $25k-50k , 1.0% for AGIs $50k-75k , 0.5% for AGIs $75k-100k , 1.4% for AGIs over 100k ) Net capital gain/loss: +$3,166 (reported on 16.0% of returns )Here:
+$3,166State:
+$9,716
(% of AGI for various income ranges: -3.1% for AGIs below $10k , -0.3% for AGIs $10k-25k , 0.4% for AGIs $25k-50k , 0.5% for AGIs $50k-75k , 0.6% for AGIs $75k-100k , 5.9% for AGIs over 100k ) Profit/loss from business: +$8,854 (reported on 10.2% of returns )Here:
+$8,854State:
+$14,267
(% of AGI for various income ranges: 12.4% for AGIs below $10k , 7.1% for AGIs $10k-25k , 2.1% for AGIs $25k-50k , 1.1% for AGIs $50k-75k , 1.1% for AGIs $75k-100k , 1.7% for AGIs over 100k ) IRA payment deduction: $2,839 (reported on 3.0% of returns )19152:
$2,839Pennsylvania:
$2,903
(% of AGI for various income ranges: 0.4% for AGIs below $10k , 0.4% for AGIs $10k-25k , 0.3% for AGIs $25k-50k , 0.2% for AGIs $50k-75k , 0.1% for AGIs $75k-100k , 0.1% for AGIs over 100k ) Self-employed pension: $7,094 (reported on 0.2% of returns )Here:
$7,094Pennsylvania:
$14,674
Total itemized deductions: $15,482 (24% of AGI, reported on 36.9% of returns )Here:
$15,482State:
$18,804
Here:
24.2% of AGIState:
19.5% of AGI
(% of AGI for various income ranges: 11.4% for AGIs below $10k , 10.3% for AGIs $10k-25k , 13.6% for AGIs $25k-50k , 16.6% for AGIs $50k-75k , 16.8% for AGIs $75k-100k , 15.6% for AGIs over 100k ) Charity contributions deductions: $2,284 (3% of AGI, reported on 33.8% of returns )Here:
3.5% of AGIState:
3.3% of AGI
(% of AGI for various income ranges: 0.7% for AGIs below $10k , 1.0% for AGIs $10k-25k , 1.7% for AGIs $25k-50k , 2.2% for AGIs $50k-75k , 2.4% for AGIs $75k-100k , 2.6% for AGIs over 100k ) Total tax: $4,688 (reported on 75.2% of returns )(% of AGI for various income ranges: 3.1% for AGIs below $10k , 4.2% for AGIs $10k-25k , 7.2% for AGIs $25k-50k , 9.0% for AGIs $50k-75k , 10.2% for AGIs $75k-100k , 14.8% for AGIs over 100k ) Earned income credit: $1,636 (reported on 12.6% of returns )Percentage of individuals using paid preparers for their 2004 taxes: 57.4%(% for various income ranges: 55.6% for AGIs below $10k , 58.6% for AGIs $10k-25k , 56.4% for AGIs $25k-50k , 58.5% for AGIs $50k-75k , 56.9% for AGIs $75k-100k , 61.9% for AGIs over 100k )
Estimated median household income in 2022: This zip code:
$59,930Pennsylvania:
$71,798
Nearest zip codes: 19149 ,
19115 ,
19111 ,
19136 ,
19135 ,
19114 .
Philadelphia Zip Code Map
Percentage of family households: This zip code:
41.5%Pennsylvania:
42.6%
Percentage of households with unmarried partners: This zip code:
4.4%Pennsylvania:
46.5%
Likely homosexual households (counted as self-reported same-sex unmarried-partner households)
Lesbian couples: 0.1% of all households Gay men: 0.2% of all households
Household received Food Stamps/SNAP in the past 12 months: 2,977Household did not receive Food Stamps/SNAP in the past 12 months: 10,667
Women who had a birth in the past 12 months: 416 (262 now married , 145 unmarried) Women who did not have a birth in the past 12 months: 7,155 (3,319 now married , 3,819 unmarried)
Housing units in zip code 19152 with a mortgage: 3,985 (619
second mortgage , 24
home equity loan , 413
both second mortgage and home equity loan )
Houses without a mortgage: 223
Median monthly owner costs for units with a mortgage: $1,560
Median monthly owner costs for units without a mortgage: $565
Residents with income below the poverty level in 2022:
This zip code:
18.2%Whole state:
11.8%
Residents with income below 50% of the poverty level in 2022:
This zip code:
11.6%Whole state:
6.1%
Median number of rooms in houses and condos: Median number of rooms in apartments:
Year house built (houses)
15 2020 or later225 2010 to 2019160 2000 to 2009398 1990 to 1999580 1980 to 19891,712 1970 to 19793,315 1960 to 19696,103 1950 to 1959755 1940 to 1949573 1939 or earlier
Zip code 19152 household income distribution in 2022 968 Less than $10,000691 $10,000 to $14,999615 $15,000 to $19,999506 $20,000 to $24,999901 $25,000 to $29,999392 $30,000 to $34,999331 $35,000 to $39,999538 $40,000 to $44,999602 $45,000 to $49,9991,213 $50,000 to $59,9991,272 $60,000 to $74,9991,411 $75,000 to $99,9991,275 $100,000 to $124,999786 $125,000 to $149,999911 $150,000 to $199,9991,154 $200,000 or moreEstimate of home value of owner-occupied houses/condos in 2022 in zip code 19152 89 Less than $10,00072 $20,000 to $24,99916 $25,000 to $29,99953 $30,000 to $34,99963 $50,000 to $59,99917 $80,000 to $89,99952 $90,000 to $99,99939 $100,000 to $124,99962 $125,000 to $149,999195 $150,000 to $174,999504 $175,000 to $199,9992,708 $200,000 to $249,9991,909 $250,000 to $299,9991,892 $300,000 to $399,999240 $400,000 to $499,99985 $500,000 to $749,99940 $750,000 to $999,99918 $2,000,000 or moreRent paid by renters in 2022 in zip code 19152 27 Less than $10057 $100 to $149188 $150 to $199220 $200 to $24950 $250 to $29933 $300 to $349141 $350 to $39944 $400 to $44918 $450 to $499127 $500 to $54993 $550 to $59963 $600 to $64952 $650 to $69948 $700 to $749117 $750 to $799437 $800 to $899964 $900 to $9991,249 $1,000 to $1,249670 $1,250 to $1,499721 $1,500 to $1,99929 $2,000 to $2,49913 $2,500 to $2,99910 $3,000 to $3,49992 No cash rent
Median gross rent in 2022: $1,173.
Median price asked for vacant for-sale houses and condos in 2022: $242,351.
Estimated median house (or condo) value in 2022 for: White Non-Hispanic householders: $268,400Black or African American householders: $259,013American Indian or Alaska Native householders: $228,506Asian householders: $272,800Some other race householders: $286,000Two or more races householders: $287,760Hispanic or Latino householders: $269,280Estimated median house or condo value in 2022: $268,400
19152:
$268,400Pennsylvania:
$245,500
Lower value quartile - upper value quartile: $234,412 - $321,165
Mean price in 2022: Detached houses: $382,521Here:
$382,521State:
$317,202
Townhouses or other attached units: $260,733Here:
$260,733State:
$254,369
In 2-unit structures: $270,436Here:
$270,436State:
$249,182
In 3-to-4-unit structures: $324,453Here:
$324,453State:
$297,446
In 5-or-more-unit structures: $444,254Here:
$444,254State:
$320,068
Mobile homes: $57,703Here:
$57,703State:
$92,414
Occupied boats, RVs, vans, etc.: $424,146Here:
$424,146State:
$563,750
Housing units in structures:
One, detached: 2,118One, attached: 7,016Two: 1,4963 or 4: 2505 to 9: 26810 to 19: 49520 to 49: 63450 or more: 1,726Mobile homes: 28Unemployment : 5.0%
Means of transportation to work in zip code 19152 61.2% 9,219 Drove a car alone13.5% 2,037 Carpooled3.2% 487 Bus or trolley bus2.5% 371 Streetcar or trolley car0.4% 57 Subway or elevated0.1% 21 Railroad0.1% 15 Taxi0.5% 78 Bicycle2.8% 426 Walked2.3% 342 Other means12.0% 1,803 Worked at homeTravel time to work (commute) in zip code 19152 164 Less than 5 minutes262 5 to 9 minutes1,374 10 to 14 minutes1,612 15 to 19 minutes1,472 20 to 24 minutes787 25 to 29 minutes2,130 30 to 34 minutes479 35 to 39 minutes630 40 to 44 minutes2,009 45 to 59 minutes1,904 60 to 89 minutes303 90 or more minutes
Neighborhoods in zip code 19152: Percentage of zip code residents living and working in this county: 68.7%
Household type by relationship:
Households: 35,164
Male householders: 7,081 (1,968 living alone ), Female householders: 6,486 (2,386 living alone )5,877 spouses (5,804 opposite-sex spouses ), 1,073 unmarried partners , (1,054 opposite-sex unmarried partners ), 9,908 children (9,536 natural , 127 adopted , 249 stepchildren ), 957 grandchildren , 460 brothers or sisters , 743 parents , 28 foster children , 788 other relatives , 655 non-relatives In group quarters: 991 (-1 institutionalized population )
Size of family households: 2,795 2-persons , 1,972 3-persons , 1,901 4-persons , 891 5-persons , 282 6-persons , 307 7-or-more-persons
Size of nonfamily households: 4,354 1-person , 873 2-persons , 174 3-persons
4,695 married couples with children. single-parent households (506 men , 1,254 women ).
56.8% of residents of 19152 zip code speak English at home. of residents speak Spanish at home (55% very well, 19% well, 17% not well, 8% not at all ).of residents speak other Indo-European language at home (43% very well, 31% well, 21% not well, 6% not at all ).of residents speak Asian or Pacific Island language at home (25% very well, 23% well, 36% not well, 16% not at all ).of residents speak other language at home (70% very well, 18% well, 12% not well ).
Foreign born population: 11,347 (32.3%)
(63.1%
of them are naturalized citizens )
This zip code:
32.3%Whole state:
7.5%
7% Serbia 7% Bhutan 6% Dominica 4% Sri Lanka 4% Nepal 3% Bolivia 3% North Macedonia (Macedonia) 6% Irish 5% German 4% Polish 4% Italian 4% Ukrainian 3% Albanian 3% Russian
Year of entry for the foreign-born population
5,081 2010 or later 3,257 2000 to 2009 2,196 1990 to 1999 1,940 Before 1990
There are
348 Other Medical Specialists in Zip Code 19152.
Facilities with environmental interests located in this zip code:
ADAMS FABRICARE CLNRS (8214 ROOSEVELT BLVD in PHILADELPHIA, PA)
AIR MINOR (AIRS/AFS) STATE MASTER (Pennsylvania database) - RCRIS-PAD981045065, HAZARDOUS WASTE PROGRAM Conditionally Exempt Small Quantity Generators, less than 100 kg/month of hazardous waste (Resource Conservation and Recovery Act (tracking hazardous waste)) - notification Business SIC classification: COIN-OPERATED LAUNDRIES AND DRYCLEANINGOrganizations: OPERNAME (CONTACT/OPERATOR)
, OWNERNAME (CONTACT/OWNER)
Alternative names: ADAMS FABRICARE CLEANERS
Housing units lacking complete plumbing facilities: 0.4%
Housing units lacking complete kitchen facilities: 1.3%
82.1% Utility gas 12.5% Electricity 2.5% Bottled, tank, or LP gas 1.8% Fuel oil, kerosene, etc. 0.6% No fuel used
Population in 1990: 31,225. Population change in the 1990s: +154 (+0.5%).
Place of birth for U.S.-born residents:
This state: 19,947Northeast: 1,880Midwest: 84South: 802West: 245
67% of the 19152 zip code residents lived in the same house 5 years ago.
Out of people who lived in different houses, 82% lived in this county.
Out of people who lived in different counties, 50% lived in Pennsylvania.
92% of the 19152 zip code residents lived in the same house 1 year ago.
Out of people who lived in different houses, 68% moved from this county.
Out of people who lived in different houses, 2% moved from different county within same state.
Out of people who lived in different houses, 18% moved from different state.
Out of people who lived in different houses, 13% moved from abroad.
Private vs. public school enrollment:
Students in private schools in grades 1 to 8 (elementary and middle school): 610
Here:
19.1%Pennsylvania:
15.7%
Students in private schools in grades 9 to 12 (high school): 420
Here:
24.1%Pennsylvania:
13.4%
Students in private undergraduate colleges: 320
Here:
21.0%Pennsylvania:
39.8%
Occupation by median earnings in the past 12 months ($)
112,340 Legal occupations 87,507 Architecture and engineering occupations 86,046 Law enforcement workers including supervisors 80,940 Health diagnosing and treating practitioners and other technical occupations 79,788 Computer and mathematical occupations 78,640 Management occupations
Companies with federal contracts located in this zip code:
INTELLIDRIVES INC (8510 BUSTLETON AVE in PHILADELPHIA, PA; small business)
$27,510 with Navy for Motors, Electrical. Signed on 2006-04-22. Completion date: 2006-06-29.
THE HACKNEY GROUP INC (8040 ROOSEVELT BLVD in PHILADELPHIA, PA; small business)
-$118,732 with Navy for Construction of Structures and Facilities -- Miscellaneous Buildings. Signed on 2001-10-01. Completion date: 1997-10-07.
Top industries in this zip code by the number of employees in 2005:
Health Care and Social Assistance: General Medical and Surgical Hospitals (over 1000 employees: 1 establishment)Health Care and Social Assistance: Nursing Care Facilities (250-499: 1, 100-249: 1)Health Care and Social Assistance: Continuing Care Retirement Communities (250-499: 1, 100-249: 1)Accommodation and Food Services: Full-Service Restaurants (100-249: 1, 20-49: 3, 10-19: 3, 5-9: 7, 1-4: 7)Health Care and Social Assistance: Services for the Elderly and Persons with Disabilities (250-499: 1)Health Care and Social Assistance: Offices of Physicians (except Mental Health Specialists) (50-99: 1, 20-49: 2, 10-19: 4, 5-9: 15, 1-4: 25)Accommodation and Food Services: Limited-Service Restaurants (50-99: 1, 20-49: 4, 5-9: 3, 1-4: 7)Health Care and Social Assistance: Offices of Dentists (20-49: 2, 10-19: 4, 5-9: 7, 1-4: 9)Accommodation and Food Services: Caterers (100-249: 1, 10-19: 1, 1-4: 1)
People in group quarters in 2010:
1,030 people in nursing facilities/skilled-nursing facilities
144 people in hospitals with patients who have no usual home elsewhere
61 people in other noninstitutional facilities
38 people in group homes intended for adults
12 people in in-patient hospice facilities
People in group quarters in 2000:
972 people in nursing homes
94 people in religious group quarters
59 people in homes for the mentally retarded
20 people in wards in general hospitals for patients who have no usual home elsewhere
11 people in homes for the mentally ill
10 people in homes or halfway houses for drug/alcohol abuse
6 people in other noninstitutional group quarters
Fatal accident statistics in 2014:
Fatal accident count: 5Vehicles involved in fatal accidents: 6Fatal accidents caused by drunken drivers: 1Fatalities: 6Persons involved in fatal accidents: 5Pedestrians involved in fatal accidents: 4
Fatal accident statistics in 2012:
Fatal accident count: 3Vehicles involved in fatal accidents: 3Fatal accidents caused by drunken drivers: 1Fatalities: 3Persons involved in fatal accidents: 3Pedestrians involved in fatal accidents: 4
Home Mortgage Disclosure Act Aggregated Statistics For Year 2009(Based on 5 full and 12 partial tracts) A) FHA, FSA/RHS & VA B) Conventional C) Refinancings D) Home Improvement Loans E) Loans on Dwellings For 5+ Families F) Non-occupant Loans on Number Average Value Number Average Value Number Average Value Number Average Value Number Average Value Number Average Value
LOANS ORIGINATED 307 $178,915 254 $132,271 1,006 $140,729 90 $44,178 2 $1,690,990 36 $130,428 APPLICATIONS APPROVED, NOT ACCEPTED 11 $196,142 33 $136,417 91 $148,624 2 $11,225 0 $0 5 $125,356 APPLICATIONS DENIED 31 $172,466 50 $130,917 393 $161,063 108 $29,787 0 $0 23 $130,741 APPLICATIONS WITHDRAWN 25 $165,322 41 $158,068 366 $167,887 12 $34,587 0 $0 19 $135,048 FILES CLOSED FOR INCOMPLETENESS 6 $128,853 7 $120,373 60 $144,888 2 $176,570 0 $0 2 $71,195
Aggregated Statistics For Year 2008(Based on 5 full and 12 partial tracts) A) FHA, FSA/RHS & VA B) Conventional C) Refinancings D) Home Improvement Loans E) Loans on Dwellings For 5+ Families F) Non-occupant Loans on G) Loans On Manufactured Number Average Value Number Average Value Number Average Value Number Average Value Number Average Value Number Average Value Number Average Value
LOANS ORIGINATED 197 $191,288 338 $149,301 731 $125,488 164 $52,232 9 $5,802,239 58 $146,556 2 $34,815 APPLICATIONS APPROVED, NOT ACCEPTED 9 $179,511 41 $152,008 205 $140,887 23 $21,090 2 $7,798,450 11 $138,228 0 $0 APPLICATIONS DENIED 26 $179,033 75 $164,645 555 $172,729 209 $39,395 1 $585,690 44 $139,564 3 $185,953 APPLICATIONS WITHDRAWN 20 $184,498 49 $146,510 229 $162,082 20 $43,932 0 $0 11 $167,195 1 $123,090 FILES CLOSED FOR INCOMPLETENESS 4 $226,482 24 $159,863 43 $175,186 5 $70,590 0 $0 7 $143,453 0 $0
Aggregated Statistics For Year 2007(Based on 5 full and 12 partial tracts) A) FHA, FSA/RHS & VA B) Conventional C) Refinancings D) Home Improvement Loans E) Loans on Dwellings For 5+ Families F) Non-occupant Loans on G) Loans On Manufactured Number Average Value Number Average Value Number Average Value Number Average Value Number Average Value Number Average Value Number Average Value
LOANS ORIGINATED 71 $201,768 651 $151,412 913 $119,694 310 $42,211 16 $2,351,036 108 $140,038 1 $5,760 APPLICATIONS APPROVED, NOT ACCEPTED 3 $168,743 55 $145,100 213 $123,537 52 $70,777 3 $7,890,020 23 $118,325 0 $0 APPLICATIONS DENIED 12 $191,182 132 $167,863 610 $153,950 272 $43,295 3 $1,757,707 74 $121,380 2 $24,775 APPLICATIONS WITHDRAWN 12 $176,106 68 $170,808 330 $167,375 30 $77,334 1 $399,730 20 $135,889 0 $0 FILES CLOSED FOR INCOMPLETENESS 0 $0 27 $182,047 69 $177,553 3 $55,647 0 $0 4 $204,975 0 $0
Aggregated Statistics For Year 2006(Based on 5 full and 12 partial tracts) A) FHA, FSA/RHS & VA B) Conventional C) Refinancings D) Home Improvement Loans E) Loans on Dwellings For 5+ Families F) Non-occupant Loans on G) Loans On Manufactured Number Average Value Number Average Value Number Average Value Number Average Value Number Average Value Number Average Value Number Average Value
LOANS ORIGINATED 42 $196,911 821 $143,613 1,103 $112,887 418 $48,206 9 $3,046,631 120 $134,540 4 $101,175 APPLICATIONS APPROVED, NOT ACCEPTED 1 $237,000 109 $133,116 216 $116,831 60 $68,941 0 $0 19 $93,452 4 $62,885 APPLICATIONS DENIED 4 $187,500 160 $143,233 579 $145,349 299 $48,578 2 $148,025 64 $100,971 8 $84,395 APPLICATIONS WITHDRAWN 10 $211,684 120 $163,528 408 $137,621 57 $60,309 2 $181,030 16 $143,637 5 $113,930 FILES CLOSED FOR INCOMPLETENESS 0 $0 26 $165,075 120 $141,712 13 $96,584 0 $0 2 $182,940 0 $0
Aggregated Statistics For Year 2005(Based on 5 full and 12 partial tracts) A) FHA, FSA/RHS & VA B) Conventional C) Refinancings D) Home Improvement Loans E) Loans on Dwellings For 5+ Families F) Non-occupant Loans on G) Loans On Manufactured Number Average Value Number Average Value Number Average Value Number Average Value Number Average Value Number Average Value Number Average Value
LOANS ORIGINATED 11 $166,521 1,069 $141,296 1,512 $116,559 470 $45,279 7 $519,731 230 $128,193 7 $56,241 APPLICATIONS APPROVED, NOT ACCEPTED 1 $98,310 84 $138,672 260 $113,813 60 $51,131 0 $0 25 $109,526 0 $0 APPLICATIONS DENIED 11 $180,875 156 $134,647 631 $129,206 363 $35,701 1 $156,000 155 $59,849 1 $2,370 APPLICATIONS WITHDRAWN 7 $187,121 160 $144,830 554 $126,332 88 $88,561 2 $428,760 21 $124,315 0 $0 FILES CLOSED FOR INCOMPLETENESS 0 $0 47 $153,824 155 $136,543 12 $71,530 0 $0 6 $146,430 0 $0
Aggregated Statistics For Year 2004(Based on 5 full and 12 partial tracts) A) FHA, FSA/RHS & VA B) Conventional C) Refinancings D) Home Improvement Loans E) Loans on Dwellings For 5+ Families F) Non-occupant Loans on G) Loans On Manufactured Number Average Value Number Average Value Number Average Value Number Average Value Number Average Value Number Average Value Number Average Value
LOANS ORIGINATED 22 $139,693 983 $125,949 1,426 $96,352 420 $36,850 5 $1,916,786 189 $97,289 0 $0 APPLICATIONS APPROVED, NOT ACCEPTED 6 $144,683 89 $125,607 300 $95,910 59 $40,539 0 $0 29 $101,642 0 $0 APPLICATIONS DENIED 4 $172,682 103 $121,738 725 $107,952 262 $32,830 0 $0 86 $57,298 2 $144,825 APPLICATIONS WITHDRAWN 1 $91,670 98 $128,815 455 $103,270 69 $62,471 3 $188,870 20 $89,174 0 $0 FILES CLOSED FOR INCOMPLETENESS 0 $0 30 $154,442 235 $112,593 14 $84,676 0 $0 14 $111,820 0 $0
Aggregated Statistics For Year 2003(Based on 5 full and 12 partial tracts) A) FHA, FSA/RHS & VA B) Conventional C) Refinancings D) Home Improvement Loans E) Loans on Dwellings For 5+ Families F) Non-occupant Loans on Number Average Value Number Average Value Number Average Value Number Average Value Number Average Value Number Average Value
LOANS ORIGINATED 70 $132,680 886 $106,811 2,393 $84,626 481 $44,647 6 $1,892,220 167 $87,231 APPLICATIONS APPROVED, NOT ACCEPTED 6 $139,035 96 $104,795 451 $82,583 41 $42,217 0 $0 44 $77,446 APPLICATIONS DENIED 7 $131,021 76 $104,324 813 $91,220 181 $33,375 1 $213,190 63 $63,007 APPLICATIONS WITHDRAWN 4 $115,002 64 $110,633 475 $92,682 52 $46,413 1 $266,490 16 $97,675 FILES CLOSED FOR INCOMPLETENESS 2 $106,715 23 $102,323 114 $91,496 11 $38,753 0 $0 3 $97,233
Aggregated Statistics For Year 2002(Based on 3 full and 10 partial tracts) A) FHA, FSA/RHS & VA B) Conventional C) Refinancings D) Home Improvement Loans E) Loans on Dwellings For 5+ Families F) Non-occupant Loans on Number Average Value Number Average Value Number Average Value Number Average Value Number Average Value Number Average Value
LOANS ORIGINATED 130 $154,016 571 $607,674 838 $364,131 131 $36,145 3 $196,167 91 $85,657 APPLICATIONS APPROVED, NOT ACCEPTED 4 $109,572 45 $80,775 178 $72,097 25 $31,989 0 $0 19 $64,667 APPLICATIONS DENIED 1 $106,000 44 $88,923 313 $80,992 65 $36,008 1 $1,201,680 29 $93,702 APPLICATIONS WITHDRAWN 3 $109,890 31 $89,632 180 $808,274 25 $29,500 1 $11,840 12 $90,453 FILES CLOSED FOR INCOMPLETENESS 3 $118,190 21 $95,285 81 $88,997 11 $76,389 0 $0 3 $89,343
Aggregated Statistics For Year 2001(Based on 3 full and 10 partial tracts) A) FHA, FSA/RHS & VA B) Conventional C) Refinancings D) Home Improvement Loans E) Loans on Dwellings For 5+ Families F) Non-occupant Loans on Number Average Value Number Average Value Number Average Value Number Average Value Number Average Value Number Average Value
LOANS ORIGINATED 106 $95,208 474 $81,426 525 $70,340 183 $28,937 1 $118,440 54 $77,381 APPLICATIONS APPROVED, NOT ACCEPTED 4 $96,030 30 $62,252 115 $62,599 31 $21,618 0 $0 7 $68,811 APPLICATIONS DENIED 2 $101,950 43 $77,171 280 $59,649 83 $21,284 1 $160,220 23 $61,260 APPLICATIONS WITHDRAWN 6 $73,155 29 $85,133 161 $73,497 30 $34,278 0 $0 8 $88,739 FILES CLOSED FOR INCOMPLETENESS 2 $72,415 2 $69,095 48 $79,875 10 $42,965 0 $0 2 $55,940
Aggregated Statistics For Year 2000(Based on 3 full and 10 partial tracts) A) FHA, FSA/RHS & VA B) Conventional C) Refinancings D) Home Improvement Loans E) Loans on Dwellings For 5+ Families F) Non-occupant Loans on Number Average Value Number Average Value Number Average Value Number Average Value Number Average Value Number Average Value
LOANS ORIGINATED 143 $90,449 452 $74,910 149 $50,426 172 $20,582 2 $333,620 42 $60,089 APPLICATIONS APPROVED, NOT ACCEPTED 5 $89,596 48 $81,208 74 $65,951 37 $24,475 0 $0 10 $55,451 APPLICATIONS DENIED 4 $107,512 70 $72,087 192 $46,865 74 $18,481 0 $0 17 $67,792 APPLICATIONS WITHDRAWN 12 $83,683 46 $79,792 115 $56,520 21 $31,636 0 $0 11 $59,742 FILES CLOSED FOR INCOMPLETENESS 0 $0 12 $91,528 42 $71,549 3 $25,003 0 $0 2 $38,110
Aggregated Statistics For Year 1999(Based on 1 full and 7 partial tracts) A) FHA, FSA/RHS & VA B) Conventional C) Refinancings D) Home Improvement Loans E) Loans on Dwellings For 5+ Families F) Non-occupant Loans on Number Average Value Number Average Value Number Average Value Number Average Value Number Average Value Number Average Value
LOANS ORIGINATED 89 $88,824 269 $70,912 244 $59,737 108 $21,100 1 $182,520 26 $61,211 APPLICATIONS APPROVED, NOT ACCEPTED 1 $66,460 24 $72,140 88 $64,713 29 $24,490 0 $0 4 $52,170 APPLICATIONS DENIED 3 $87,850 33 $67,925 168 $59,744 61 $21,513 0 $0 12 $64,788 APPLICATIONS WITHDRAWN 9 $88,364 24 $68,285 138 $60,235 19 $35,368 0 $0 7 $53,779 FILES CLOSED FOR INCOMPLETENESS 0 $0 5 $69,340 33 $66,231 1 $19,740 0 $0 2 $97,710
Private Mortgage Insurance Companies Aggregated Statistics For Year 2009(Based on 5 full and 10 partial tracts) A) Conventional B) Refinancings Number Average Value Number Average Value
LOANS ORIGINATED 33 $175,938 21 $169,971 APPLICATIONS APPROVED, NOT ACCEPTED 6 $204,413 7 $161,560 APPLICATIONS DENIED 4 $162,480 6 $134,518 APPLICATIONS WITHDRAWN 1 $113,140 3 $190,473 FILES CLOSED FOR INCOMPLETENESS 0 $0 2 $189,265
Aggregated Statistics For Year 2008(Based on 5 full and 12 partial tracts) A) Conventional B) Refinancings C) Non-occupant Loans on Number Average Value Number Average Value Number Average Value
LOANS ORIGINATED 117 $179,898 36 $194,048 6 $147,747 APPLICATIONS APPROVED, NOT ACCEPTED 39 $180,664 35 $213,197 4 $152,925 APPLICATIONS DENIED 8 $176,760 3 $179,347 1 $92,190 APPLICATIONS WITHDRAWN 8 $178,811 1 $213,290 0 $0 FILES CLOSED FOR INCOMPLETENESS 2 $116,075 0 $0 0 $0
Aggregated Statistics For Year 2007(Based on 5 full and 12 partial tracts) A) Conventional B) Refinancings C) Non-occupant Loans on Number Average Value Number Average Value Number Average Value
LOANS ORIGINATED 224 $188,169 56 $197,083 13 $155,515 APPLICATIONS APPROVED, NOT ACCEPTED 36 $201,872 8 $175,494 1 $213,000 APPLICATIONS DENIED 4 $187,162 0 $0 0 $0 APPLICATIONS WITHDRAWN 10 $216,935 5 $173,014 1 $96,320 FILES CLOSED FOR INCOMPLETENESS 0 $0 0 $0 0 $0
Aggregated Statistics For Year 2006(Based on 5 full and 12 partial tracts) A) Conventional B) Refinancings C) Non-occupant Loans on Number Average Value Number Average Value Number Average Value
LOANS ORIGINATED 185 $176,598 34 $204,845 9 $160,197 APPLICATIONS APPROVED, NOT ACCEPTED 19 $178,496 15 $174,400 6 $162,393 APPLICATIONS DENIED 2 $245,845 0 $0 1 $229,320 APPLICATIONS WITHDRAWN 6 $191,313 6 $167,803 0 $0 FILES CLOSED FOR INCOMPLETENESS 1 $136,190 0 $0 0 $0
Aggregated Statistics For Year 2005(Based on 5 full and 12 partial tracts) A) Conventional B) Refinancings C) Non-occupant Loans on Number Average Value Number Average Value Number Average Value
LOANS ORIGINATED 193 $177,049 60 $164,813 19 $144,486 APPLICATIONS APPROVED, NOT ACCEPTED 32 $161,118 11 $153,305 9 $164,564 APPLICATIONS DENIED 7 $162,447 0 $0 2 $106,150 APPLICATIONS WITHDRAWN 10 $138,896 3 $125,140 4 $108,752 FILES CLOSED FOR INCOMPLETENESS 3 $152,903 1 $141,930 0 $0
Aggregated Statistics For Year 2004(Based on 5 full and 10 partial tracts) A) Conventional B) Refinancings C) Non-occupant Loans on Number Average Value Number Average Value Number Average Value
LOANS ORIGINATED 260 $150,814 54 $131,533 13 $152,875 APPLICATIONS APPROVED, NOT ACCEPTED 35 $137,705 35 $130,180 4 $99,955 APPLICATIONS DENIED 4 $160,360 0 $0 0 $0 APPLICATIONS WITHDRAWN 8 $131,985 5 $131,494 2 $113,140 FILES CLOSED FOR INCOMPLETENESS 1 $82,910 2 $125,330 1 $82,910
Aggregated Statistics For Year 2003(Based on 5 full and 12 partial tracts) A) Conventional B) Refinancings C) Non-occupant Loans on Number Average Value Number Average Value Number Average Value
LOANS ORIGINATED 308 $123,870 130 $113,153 17 $111,925 APPLICATIONS APPROVED, NOT ACCEPTED 45 $110,494 48 $116,999 5 $86,540 APPLICATIONS DENIED 5 $133,284 0 $0 0 $0 APPLICATIONS WITHDRAWN 14 $124,463 13 $117,658 2 $121,960 FILES CLOSED FOR INCOMPLETENESS 0 $0 0 $0 0 $0
Aggregated Statistics For Year 2002(Based on 3 full and 10 partial tracts) A) Conventional B) Refinancings C) Non-occupant Loans on Number Average Value Number Average Value Number Average Value
LOANS ORIGINATED 213 $104,356 66 $95,310 13 $102,120 APPLICATIONS APPROVED, NOT ACCEPTED 25 $105,651 13 $101,278 4 $95,758 APPLICATIONS DENIED 6 $105,433 0 $0 0 $0 APPLICATIONS WITHDRAWN 7 $94,587 2 $62,885 3 $100,690 FILES CLOSED FOR INCOMPLETENESS 0 $0 0 $0 0 $0
Aggregated Statistics For Year 2001(Based on 3 full and 10 partial tracts) A) Conventional B) Refinancings C) Non-occupant Loans on Number Average Value Number Average Value Number Average Value
LOANS ORIGINATED 197 $91,445 45 $89,477 13 $83,722 APPLICATIONS APPROVED, NOT ACCEPTED 18 $96,474 10 $82,774 0 $0 APPLICATIONS DENIED 5 $99,896 2 $89,500 0 $0 APPLICATIONS WITHDRAWN 3 $118,240 0 $0 0 $0 FILES CLOSED FOR INCOMPLETENESS 3 $113,600 0 $0 0 $0
Aggregated Statistics For Year 2000(Based on 3 full and 10 partial tracts) A) Conventional B) Refinancings C) Non-occupant Loans on Number Average Value Number Average Value Number Average Value
LOANS ORIGINATED 119 $83,627 6 $90,780 6 $73,967 APPLICATIONS APPROVED, NOT ACCEPTED 15 $100,680 0 $0 0 $0 APPLICATIONS DENIED 5 $84,784 0 $0 1 $87,120 APPLICATIONS WITHDRAWN 4 $81,148 0 $0 0 $0 FILES CLOSED FOR INCOMPLETENESS 2 $71,460 0 $0 0 $0
Aggregated Statistics For Year 1999(Based on 1 full and 6 partial tracts) A) Conventional B) Refinancings C) Non-occupant Loans on Number Average Value Number Average Value Number Average Value
LOANS ORIGINATED 71 $80,513 22 $83,661 2 $45,075 APPLICATIONS APPROVED, NOT ACCEPTED 6 $76,018 7 $84,160 0 $0 APPLICATIONS DENIED 1 $51,990 0 $0 0 $0 APPLICATIONS WITHDRAWN 1 $42,120 2 $73,850 0 $0 FILES CLOSED FOR INCOMPLETENESS 1 $70,210 1 $40,250 0 $0
2010 - 2018 National Fire Incident Reporting System (NFIRS) incidents See full 2006 National Fire Incident Reporting System statistics for zip code 19152, Pennsylvania
Most common first names in zip code 19152 among deceased individuals Name Count Lived (average)
Mary 506 82.9 years Anna 503 84.2 years Joseph 476 75.8 years John 438 75.0 years Rose 335 82.9 years William 322 77.1 years Samuel 287 80.2 years Harry 282 78.5 years Helen 256 82.6 years Margaret 224 82.0 years
Most common last names in zip code 19152 among deceased individuals Last name Count Lived (average)
Cohen 149 80.3 years Miller 95 79.4 years Smith 95 79.2 years Schwartz 79 78.6 years Levin 65 77.6 years Goldberg 62 79.8 years Brown 58 79.8 years Goldstein 56 80.5 years Stein 53 80.4 years Snyder 51 81.6 years
Businesses in zip code 19152
Name Count Name Count
7-Eleven 2 McDonald's 1 AMF Bowling 1 Payless 1 AT&T 1 PetSmart 1 Burger King 1 Pizza Hut 1 CVS 1 Quiznos 1 Cricket Wireless 1 Rite Aid 2 DHL 1 Sears 1 Dunkin Donuts 3 Sprint Nextel 2 FedEx 3 Starbucks 1 GNC 1 Target 1 H&R Block 1 U-Haul 1 MasterBrand Cabinets 1 UPS 5

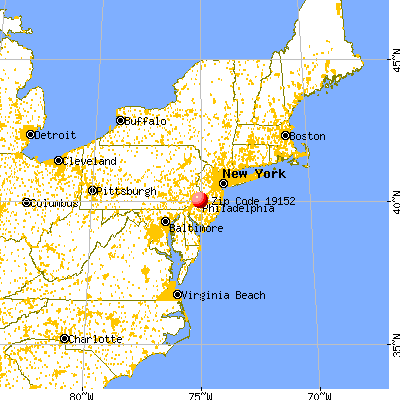


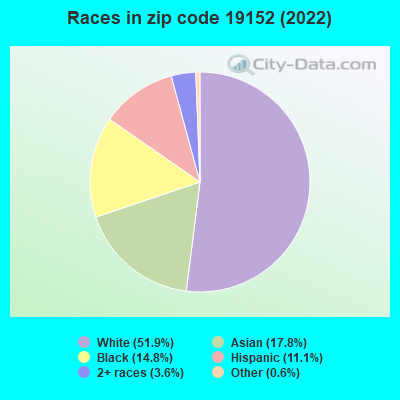


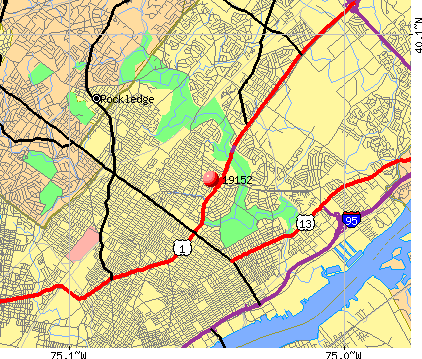 Nearest zip codes: 19149, 19115, 19111, 19136, 19135, 19114.
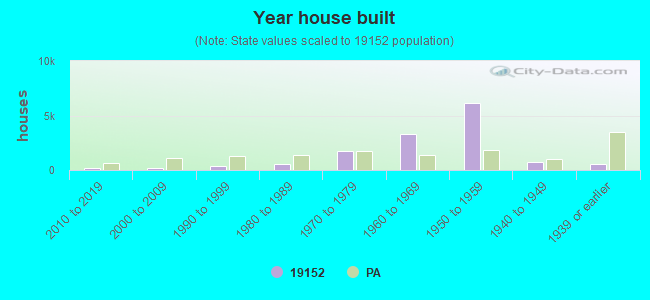


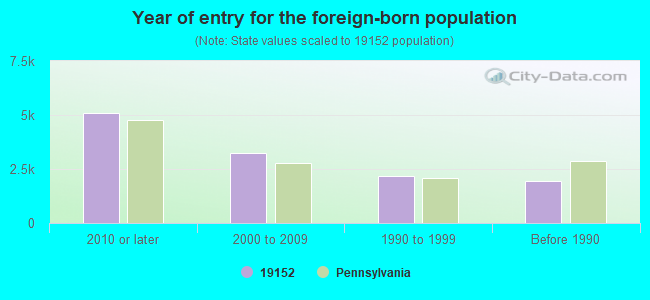

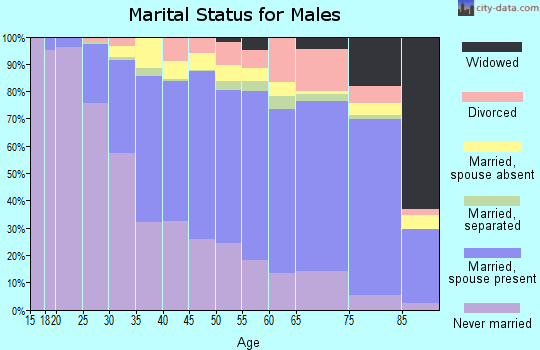
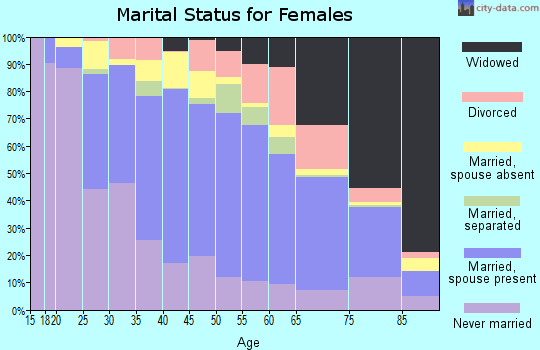
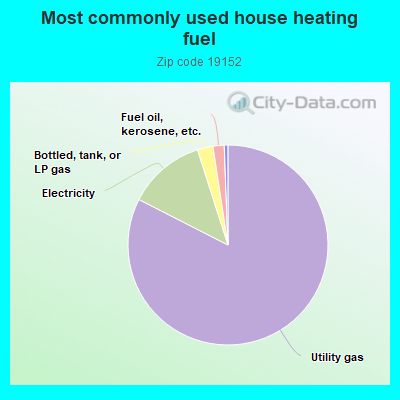
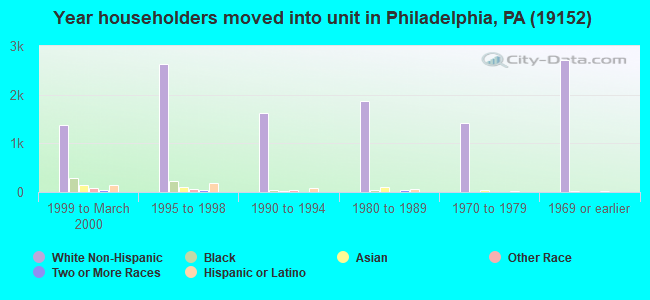
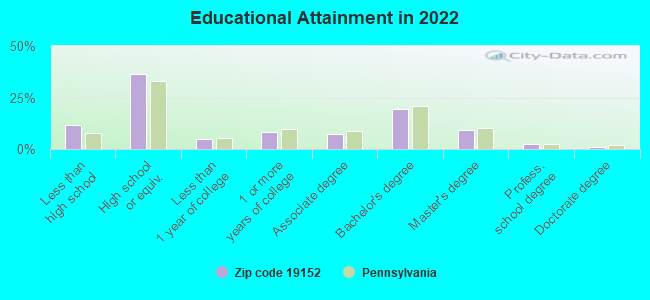
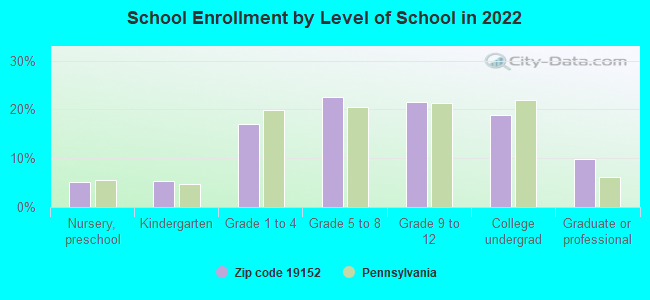
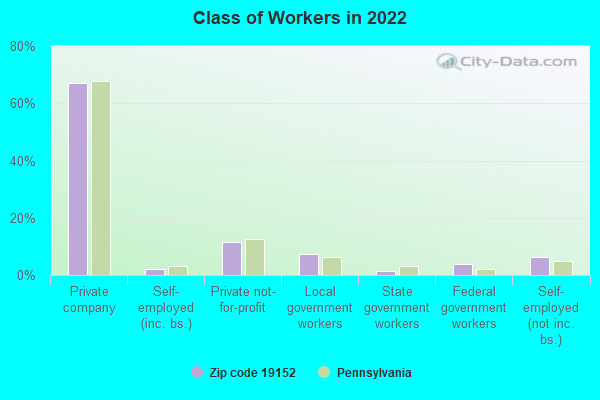
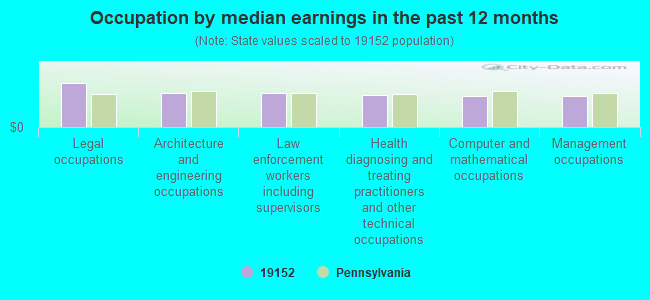
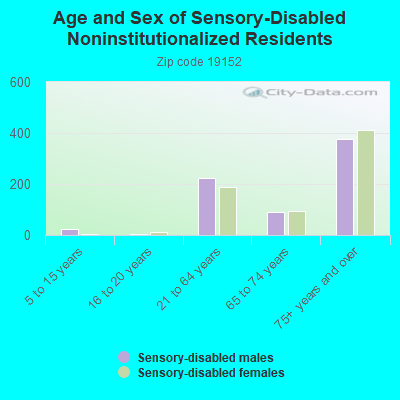
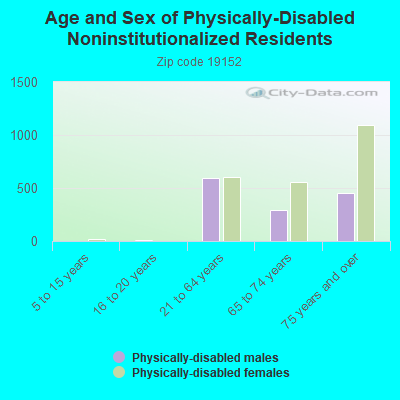
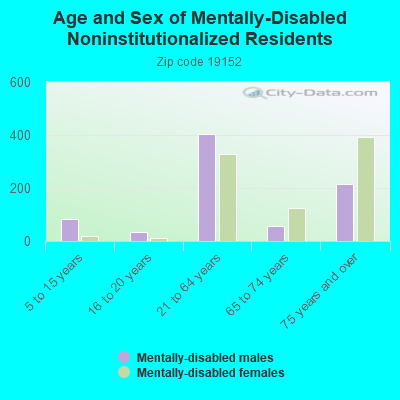
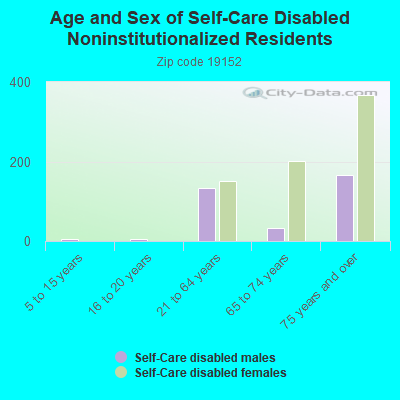
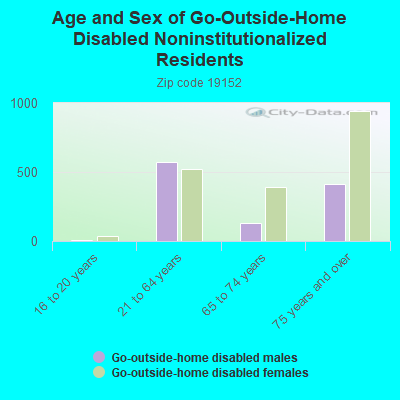
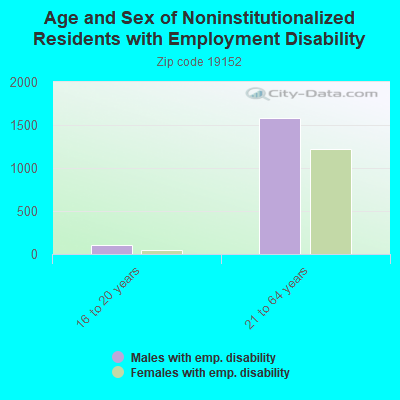
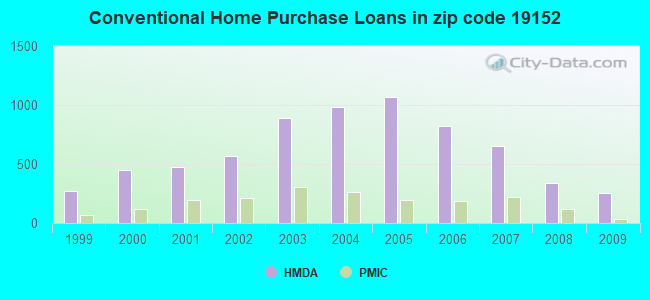
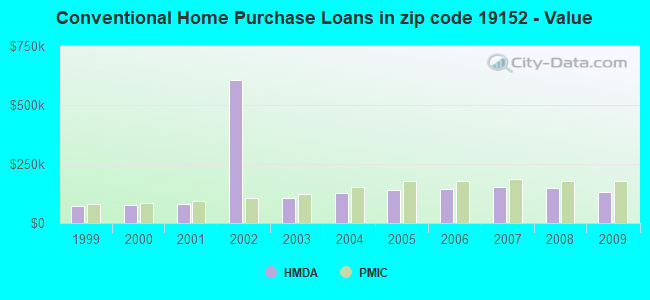
 Based on the data from the years 2010 - 2018 the average number of fire incidents per year is 84. The highest number of fire incidents - 109 took place in 2012, and the least - 0 in 2016. The data has a rising trend.
 When looking into fire subcategories, the most reports belonged to: Outside Fires (47.6%), and Structure Fires (38.7%).