Estimated zip code population in 2022: 6,974 Zip code population in 2010: 7,372 Zip code population in 2000: 7,919
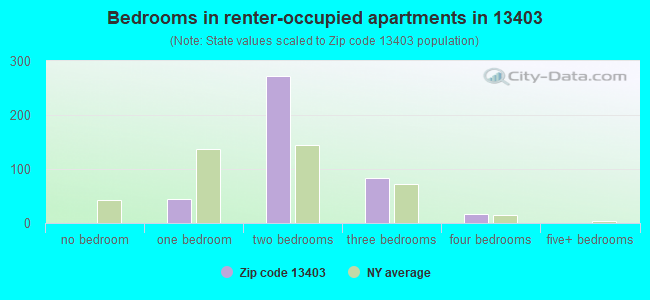
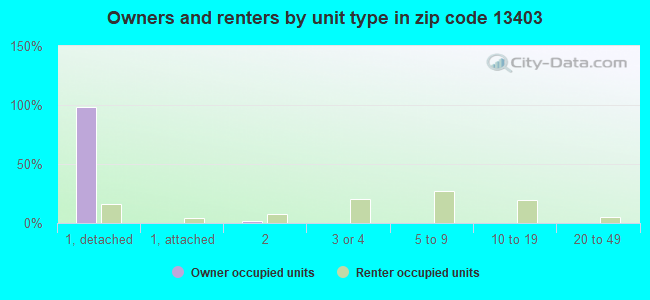
Houses and condos: 1,983 Renter-occupied apartments: 423
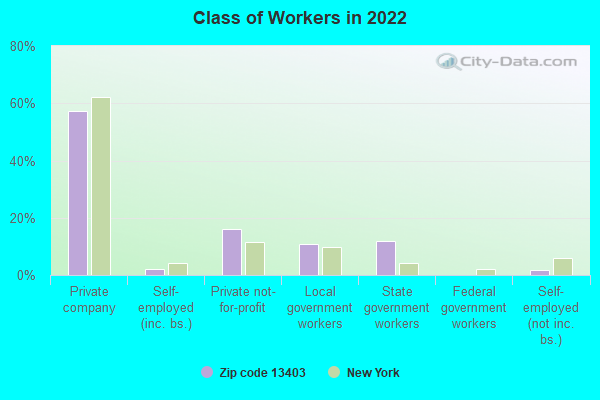
% of renters here:
22%
State:
46%
March 2022 cost of living index in zip code 13403: 99.7 (near average, U.S. average is 100)
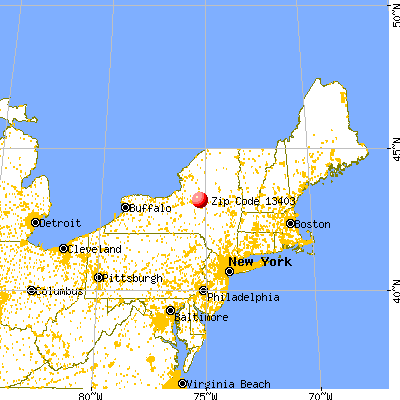
Land area: 26.7 sq. mi. Water area: 0.4 sq. mi.
Population density: 261 people per square mile
(very low).
OSM Map
General Map
Google Map
MSN Map
OSM Map
General Map
Google Map
MSN Map
OSM Map
General Map
Google Map
MSN Map
OSM Map
General Map
Google Map
MSN Map
Please wait while loading the map...
Real estate property taxes paid for housing units in 2022:
This zip code:
2.5% ($5,132)
New York:
1.5% ($6,180)
Median real estate property taxes paid for housing units with mortgages in 2022: $5,898 (2.1%) Median real estate property taxes paid for housing units with no mortgage in 2022: $4,153 (2.4%)
Business Search- 14 Million verified businesses
Males: 4,547
(65.2%)
Females: 2,428
(34.8%)
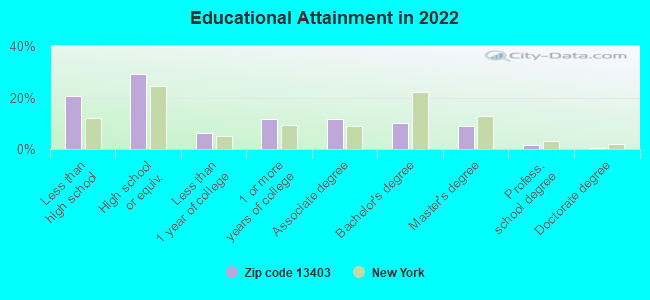
For population 25 years and over in 13403:
High school or higher: 78.8%
Bachelor's degree or higher: 20.9%
Graduate or professional degree: 10.9%
Unemployed: 2.3%
Mean travel time to work (commute): 18.6 minutes
For population 15 years and over in 13403:
Never married: 45.4%
Now married: 40.4%
Separated: 1.8%
Widowed: 3.9%
Divorced: 8.5%
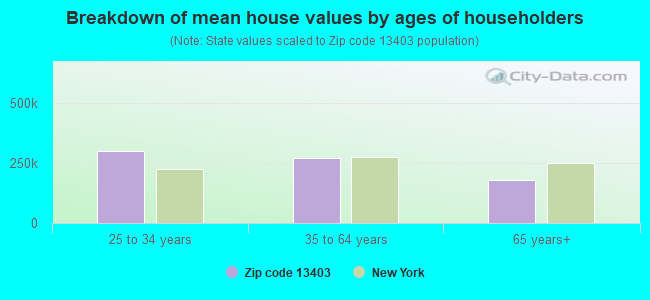
Zip code 13403 compared to state average:
Median house value below state average.
Unemployed percentage below state average.
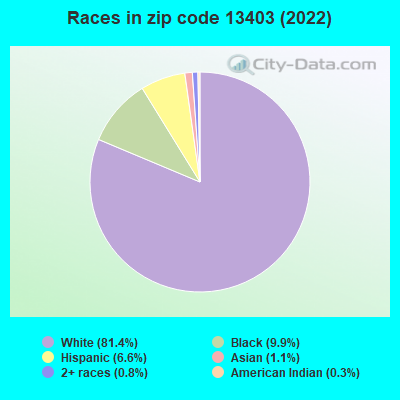
Hispanic race population percentage significantly below state average.
Median age below state average.
Foreign-born population percentage significantly below state average.
Renting percentage below state average.
Length of stay since moving in significantly above state average.
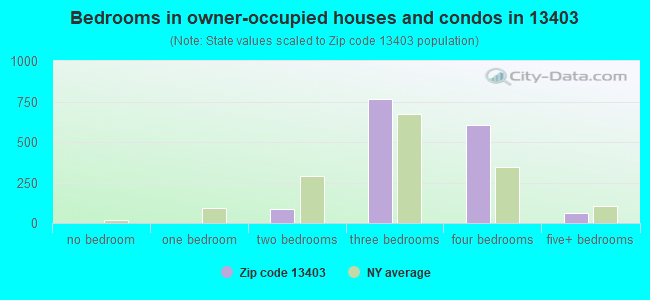
Number of rooms per house above state average.
House age below state average.
Percentage of population with a bachelor's degree or higher below state average.
Averages for the 2020 tax year for zip code 13403, filed in 2021:
Average Adjusted Gross Income (AGI) in 2020: $69,188 (Individual Income Tax Returns)
Here:
$69,188
State:
$90,930
Salary/wage: $61,268 (reported on 73.2% of returns)
Here:
$61,268
State:
$72,104
(% of AGI for various income ranges: 943.5% for AGIs below $25k, 3330.2% for AGIs $25k-50k, 5945.2% for AGIs $50k-75k, 9151.2% for AGIs $75k-100k, 16768.9% for AGIs $100k-200k, 61200.0% for AGIs over 200k)
Taxable interest for individuals: $974 (reported on 49.4% of returns)
This zip code:
$974
New York:
$3,075
(% of AGI for various income ranges: 26.5% for AGIs below $25k, 27.4% for AGIs $25k-50k, 71.6% for AGIs $50k-75k, 93.1% for AGIs $75k-100k, 160.7% for AGIs $100k-200k, 685.0% for AGIs over 200k)
Ordinary dividends: $3,860 (reported on 24.1% of returns)
Here:
$3,860
State:
$11,095
(% of AGI for various income ranges: 37.2% for AGIs below $25k, 41.0% for AGIs $25k-50k, 83.6% for AGIs $50k-75k, 136.9% for AGIs $75k-100k, 223.3% for AGIs $100k-200k, 2700.0% for AGIs over 200k)
Net capital gain/loss in AGI: +$11,763 (reported on 18.8% of returns)
Here:
+$11,763
State:
+$44,925
(% of AGI for various income ranges: 19.0% for AGIs below $25k, 16.9% for AGIs $25k-50k, 128.4% for AGIs $50k-75k, 190.6% for AGIs $75k-100k, 480.4% for AGIs $100k-200k, 9235.0% for AGIs over 200k)
Profit/loss from business: +$14,140 (reported on 11.5% of returns)
Here:
+$14,140
State:
+$14,940
(% of AGI for various income ranges: 86.8% for AGIs below $25k, 125.2% for AGIs $25k-50k, 148.4% for AGIs $50k-75k, 90.0% for AGIs $75k-100k, 556.7% for AGIs $100k-200k, 3377.5% for AGIs over 200k)
Taxable individual retirement arrangement distribution: $15,480 (reported on 11.5% of returns)
13403:
$15,480
New York:
$19,609
(% of AGI for various income ranges: 67.5% for AGIs below $25k, 128.6% for AGIs $25k-50k, 283.2% for AGIs $50k-75k, 297.5% for AGIs $75k-100k, 981.5% for AGIs $100k-200k)
Total itemized deductions: $25,231 (reported on 5.0% of returns)
Here:
$25,231
State:
$39,326
(% of AGI for various income ranges: 354.0% for AGIs $50k-75k, 366.9% for AGIs $75k-100k, 348.9% for AGIs $100k-200k, 2165.0% for AGIs over 200k)
Charity contributions: $5,733 (reported on 3.4% of returns)
Here:
$5,733
State:
$15,420
(% of AGI for various income ranges: 16.8% for AGIs below $25k, 59.4% for AGIs $75k-100k, 47.4% for AGIs $100k-200k, 565.0% for AGIs over 200k)
Taxes paid: $8,423 (reported on 5.0% of returns)
13403:
$8,423
State:
$9,183
(% of AGI for various income ranges: 92.8% for AGIs $50k-75k, 151.2% for AGIs $75k-100k, 146.3% for AGIs $100k-200k, 565.0% for AGIs over 200k)
Earned income credit: $1,162 (reported on 10.0% of returns)
Here:
$1,162
State:
$2,138
(% of AGI for various income ranges: 42.2% for AGIs below $25k, 31.7% for AGIs $25k-50k)
Percentage of individuals using paid preparers for their 2020 taxes: 85.1%
Here:
85%
State:
95%
(% for various income ranges: 65.4% for AGIs below $25k, 94.5% for AGIs $25k-50k, 94.7% for AGIs $50k-75k, 96.3% for AGIs $75k-100k, 91.7% for AGIs $100k-200k, 91.7% for AGIs over 200k)
Averages for the 2012 tax year for zip code 13403, filed in 2013:
Average Adjusted Gross Income (AGI) in 2012: $62,597 (Individual Income Tax Returns)
Here:
$62,597
State:
$77,088
Salary/wage: $54,839 (reported on 81.9% of returns)
Here:
$54,839
State:
$60,593
(% of AGI for various income ranges: 67.8% for AGIs below $25k, 71.9% for AGIs $25k-50k, 71.3% for AGIs $50k-75k, 75.1% for AGIs $75k-100k, 79.6% for AGIs $100k-200k, 54.3% for AGIs over 200k)
Taxable interest for individuals: $740 (reported on 52.4% of returns)
This zip code:
$740
New York:
$3,125
(% of AGI for various income ranges: 1.9% for AGIs below $25k, 0.9% for AGIs $25k-50k, 0.9% for AGIs $50k-75k, 0.4% for AGIs $75k-100k, 0.5% for AGIs $100k-200k, 0.2% for AGIs over 200k)
Ordinary dividends: $2,274 (reported on 29.1% of returns)
Here:
$2,274
State:
$10,299
(% of AGI for various income ranges: 2.1% for AGIs below $25k, 1.1% for AGIs $25k-50k, 1.2% for AGIs $50k-75k, 0.9% for AGIs $75k-100k, 1.0% for AGIs $100k-200k, 0.9% for AGIs over 200k)
Net capital gain/loss in AGI: +$9,720 (reported on 19.4% of returns)
Here:
+$9,720
State:
+$42,474
(% of AGI for various income ranges: 0.4% for AGIs $50k-75k, 0.9% for AGIs $75k-100k, 1.1% for AGIs $100k-200k, 15.0% for AGIs over 200k)
Profit/loss from business: +$10,409 (reported on 14.1% of returns)
Here:
+$10,409
State:
+$16,168
(% of AGI for various income ranges: 4.4% for AGIs below $25k, 2.7% for AGIs $25k-50k, 1.4% for AGIs $50k-75k, 2.1% for AGIs $75k-100k, 3.5% for AGIs $100k-200k)
Taxable individual retirement arrangement distribution: $9,304 (reported on 11.0% of returns)
13403:
$9,304
New York:
$17,621
(% of AGI for various income ranges: 3.3% for AGIs below $25k, 2.0% for AGIs $25k-50k, 2.4% for AGIs $50k-75k, 1.4% for AGIs $75k-100k, 1.7% for AGIs $100k-200k)
Self-employment retirement plans: $20,800 (reported on 0.9% of returns)
13403:
$20,800
New York:
$27,330
Total itemized deductions: $20,629 (19% of AGI, reported on 36.1% of returns)
Here:
$20,629
State:
$34,985
Here:
18.5% of AGI
State:
21.3% of AGI
(% of AGI for various income ranges: 7.8% for AGIs below $25k, 7.4% for AGIs $25k-50k, 11.5% for AGIs $50k-75k, 11.1% for AGIs $75k-100k, 15.3% for AGIs $100k-200k, 11.0% for AGIs over 200k)
Charity contributions: $2,291 (reported on 30.4% of returns)
Here:
$2,291
State:
$5,572
(% of AGI for various income ranges: 0.5% for AGIs below $25k, 0.5% for AGIs $25k-50k, 1.2% for AGIs $50k-75k, 1.2% for AGIs $75k-100k, 1.5% for AGIs $100k-200k, 0.9% for AGIs over 200k)
Taxes paid: $10,760 (reported on 36.1% of returns)
13403:
$10,760
State:
$18,656
(% of AGI for various income ranges: 3.3% for AGIs below $25k, 3.2% for AGIs $25k-50k, 4.8% for AGIs $50k-75k, 5.7% for AGIs $75k-100k, 8.2% for AGIs $100k-200k, 7.3% for AGIs over 200k)
Earned income credit: $1,829 (reported on 9.3% of returns)
Here:
$1,829
State:
$2,230
(% of AGI for various income ranges: 3.1% for AGIs below $25k, 0.7% for AGIs $25k-50k)
Percentage of individuals using paid preparers for their 2012 taxes: 58.6%
Here:
59%
State:
66%
(% for various income ranges: 52.0% for AGIs below $25k, 53.1% for AGIs $25k-50k, 61.1% for AGIs $50k-75k, 64.0% for AGIs $75k-100k, 67.6% for AGIs $100k-200k, 100.0% for AGIs over 200k)
Averages for the 2004 tax year for zip code 13403, filed in 2005:
Average Adjusted Gross Income (AGI) in 2004: $47,196 (Individual Income Tax Returns)
Here:
$47,196
State:
$59,519
Salary/wage: $44,392 (reported on 82.0% of returns)
Here:
$44,392
State:
$50,673
(% of AGI for various income ranges: 90.3% for AGIs below $10k, 64.5% for AGIs $10k-25k, 73.9% for AGIs $25k-50k, 79.7% for AGIs $50k-75k, 83.9% for AGIs $75k-100k, 75.7% for AGIs over 100k)
Taxable interest for individuals: $1,078 (reported on 64.2% of returns)
This zip code:
$1,078
New York:
$2,377
(% of AGI for various income ranges: 6.6% for AGIs below $10k, 3.8% for AGIs $10k-25k, 1.4% for AGIs $25k-50k, 1.0% for AGIs $50k-75k, 0.9% for AGIs $75k-100k, 1.4% for AGIs over 100k)
Taxable dividends: $1,414 (reported on 36.4% of returns)
Here:
$1,414
State:
$5,394
(% of AGI for various income ranges: 4.4% for AGIs below $10k, 1.8% for AGIs $10k-25k, 1.2% for AGIs $25k-50k, 1.2% for AGIs $50k-75k, 0.5% for AGIs $75k-100k, 1.0% for AGIs over 100k)
Net capital gain/loss: +$2,194 (reported on 24.0% of returns)
Here:
+$2,194
State:
+$23,581
(% of AGI for various income ranges: 4.8% for AGIs below $10k, 0.4% for AGIs $10k-25k, 0.5% for AGIs $25k-50k, 1.1% for AGIs $50k-75k, 1.2% for AGIs $75k-100k, 1.5% for AGIs over 100k)
Profit/loss from business: +$8,361 (reported on 13.0% of returns)
Here:
+$8,361
State:
+$13,809
(% of AGI for various income ranges: 4.9% for AGIs below $10k, 1.1% for AGIs $10k-25k, 1.9% for AGIs $25k-50k, 3.1% for AGIs $50k-75k, 0.8% for AGIs $75k-100k, 3.1% for AGIs over 100k)
IRA payment deduction: $2,942 (reported on 2.6% of returns)
13403:
$2,942
New York:
$3,115
Self-employed pension: $10,952 (reported on 1.0% of returns)
Here:
$10,952
New York:
$19,016
Total itemized deductions: $16,457 (20% of AGI, reported on 35.5% of returns)
Here:
$16,457
State:
$25,864
Here:
19.5% of AGI
State:
21.9% of AGI
(% of AGI for various income ranges: 8.7% for AGIs $10k-25k, 8.6% for AGIs $25k-50k, 12.2% for AGIs $50k-75k, 14.5% for AGIs $75k-100k, 14.9% for AGIs over 100k)
Charity contributions deductions: $2,542 (3% of AGI, reported on 33.2% of returns)
Here:
$2,542
State:
$4,439
Here:
2.9% of AGI
State:
3.6% of AGI
(% of AGI for various income ranges: 0.8% for AGIs $10k-25k, 1.0% for AGIs $25k-50k, 1.6% for AGIs $50k-75k, 2.1% for AGIs $75k-100k, 2.5% for AGIs over 100k)
Total tax: $6,139 (reported on 81.0% of returns)
13403:
$6,139
State:
$11,730
(% of AGI for various income ranges: 3.2% for AGIs below $10k, 4.5% for AGIs $10k-25k, 6.8% for AGIs $25k-50k, 9.1% for AGIs $50k-75k, 9.9% for AGIs $75k-100k, 15.9% for AGIs over 100k)
Earned income credit: $1,453 (reported on 6.3% of returns)
Here:
$1,453
State:
$1,757
Percentage of individuals using paid preparers for their 2004 taxes: 59.7%
Here:
60%
State:
67%
(% for various income ranges: 50.0% for AGIs below $10k, 57.7% for AGIs $10k-25k, 62.1% for AGIs $25k-50k, 65.3% for AGIs $50k-75k, 62.3% for AGIs $75k-100k, 63.4% for AGIs over 100k)
Notable locations in zip code 13403: Crestwood Golf Club (A), Candellas Greenhouse And Vegetable Farm (B), Camp Healthmore (C), Maynard Fire Department Headquarters (D), Maynard Fire Department Station 2 (E). Display/hide their locations on the map
Churches in zip code 13403 include: First Assembly of God Church (A), Pilgrim Holiness Church (B), Marcy Community Church (C), Maynard United Methodist Church (D). Display/hide their locations on the map
In group quarters: 2,442 (-1 institutionalized population)
Size of family households: 552 2-persons, 242 3-persons, 130 4-persons, 242 5-persons, 34 6-persons
Size of nonfamily households: 651 1-person, 110 2-persons
948 married couples with children.
187 single-parent households (121 men, 66 women).
87.1% of residents of 13403 zip code speak English at home.
5.0% of residents speak Spanish at home (67% very well, 26% well, 7% not well, 1% not at all).
5.7% of residents speak other Indo-European language at home (99% very well, 1% well).
1.2% of residents speak Asian or Pacific Island language at home (100% very well).
0.2% of residents speak other language at home (38% very well, 62% well).
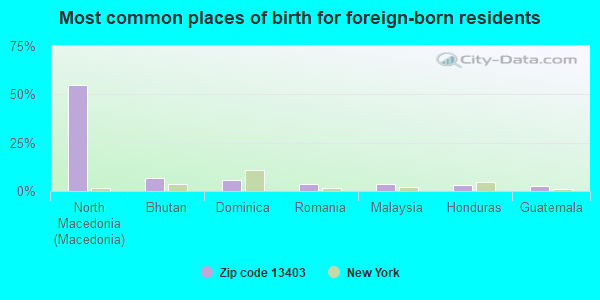
Foreign born population: 313 (4.5%) (75.0% of them are naturalized citizens)
This zip code:
4.5%
Whole state:
22.7%
55%North Macedonia (Macedonia)
7%Bhutan
6%Dominica
4%Romania
4%Malaysia
3%Honduras
3%Guatemala
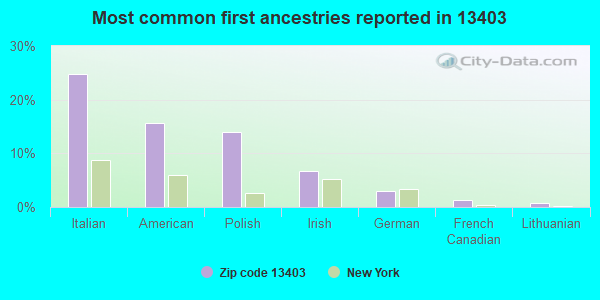
25%Italian
16%American
14%Polish
7%Irish
3%German
1%French Canadian
1%Lithuanian
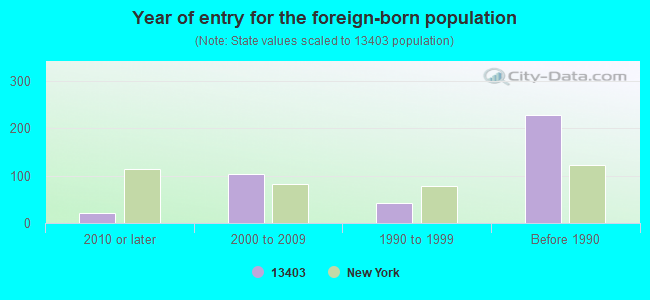
Year of entry for the foreign-born population
212010 or later
1042000 to 2009
421990 to 1999
228Before 1990
Facilities with environmental interests located in this zip code:
HESS CORP MARCY TERMINAL (9570 RIVER ROAD in MARCY, NY)
AIR SYNTHETIC MINOR (AIRS/AFS) CRITERIA AND HAZARDOUS AIR POLLUTANT INVENTORY (Inventory of air pollution sources) National Pollutant Discharge Elimination System NON-MAJOR (Tracking pollutant discharge elimination systems) - permit National Pollutant Discharge Elimination System NON-MAJOR (Tracking pollutant discharge elimination systems) - permit (Resource Conservation and Recovery Act (tracking hazardous waste)) TRI REPORTER (Tracking of toxic chemicals releasing facilities) Business SIC classification: PETROLEUM BULK STATIONS AND TERMINALS Organizations: BRAY TERMINALS, INC (CONTACT/OWNER)
, AMERADA HESS CORP (CONTACT/OWNER)
Alternative names: AMERADA HESS CORP, AMERADA HESS CORP. MARCY TERMINAL, BRAY - MARCY TERMINAL, BRAY TERMINALS, INC, HESS TERMINAL - MARCY (T)
CON WAY CENTRAL EXPRESS-XUC (9634 STATE RTE 49 in MARCY, NY)
STATE MASTER (New York facility tracking) - National Pollutant Discharge Elimination System Permit Conditionally Exempt Small Quantity Generators, less than 100 kg/month of hazardous waste (Resource Conservation and Recovery Act (tracking hazardous waste)) - notification Business SIC classification: TRUCKING, EXCEPT LOCAL Organizations: C F PROPERTIES (CONTACT/OWNER)
, CNF TRANSPORTATION INC (LEGALLY RESPONSIBLE PARTY)
Alternative names: CON-WAY CENTRAL EXPRESS
GYPSUM WHOLESALERS (RTE 49 in MARCY, NY)
(Resource Conservation and Recovery Act (tracking hazardous waste))
COCA COLA BOTTLING CO OF NY (MOHAWK ST in MARCY, NY)
(Resource Conservation and Recovery Act (tracking hazardous waste))
COMESKEY STRIPPING INC (RTE 49 BOX 250 in MARCY, NY)
(Resource Conservation and Recovery Act (tracking hazardous waste))
(Resource Conservation and Recovery Act (tracking hazardous waste))
Housing units lacking complete kitchen facilities: 0.7%
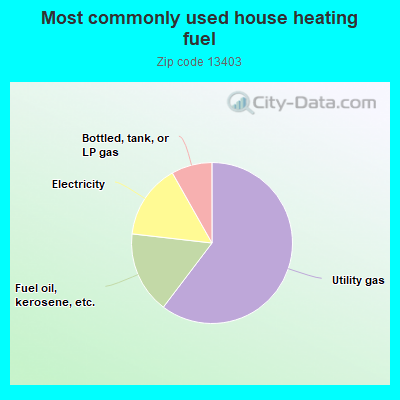
60.4%Utility gas
16.5%Fuel oil, kerosene, etc.
15.0%Electricity
8.2%Bottled, tank, or LP gas
Population in 1990: 7,937.
Place of birth for U.S.-born residents:
This state: 5,861
Northeast: 394
Midwest: 62
South: 124
West: 99
69% of the 13403 zip code residents lived in the same house 5 years ago. Out of people who lived in different houses, 62% lived in this county. Out of people who lived in different counties, 50% lived in New York.
93% of the 13403 zip code residents lived in the same house 1 year ago. Out of people who lived in different houses, 8% moved from this county. Out of people who lived in different houses, 93% moved from different county within same state.
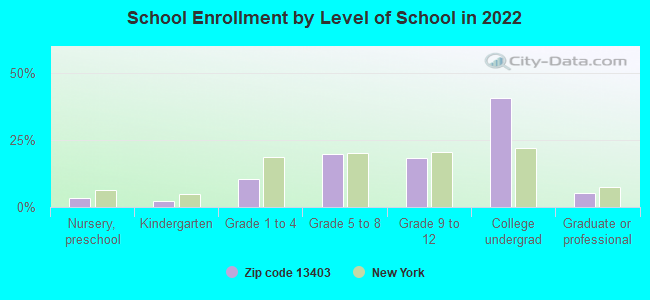
Private vs. public school enrollment:
Students in private schools in grades 1 to 8 (elementary and middle school):
Here:
0.0%
New York:
15.6%
Students in private schools in grades 9 to 12 (high school): 14
Here:
5.9%
New York:
15.0%
Students in private undergraduate colleges: 137
Here:
25.2%
New York:
39.2%
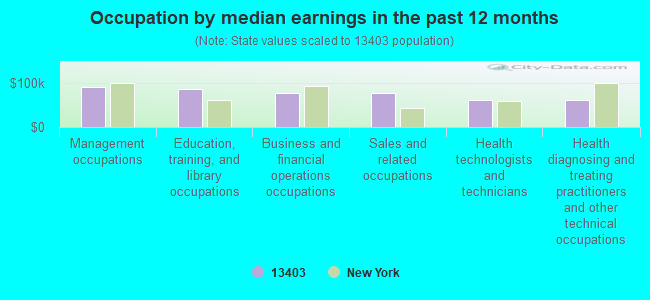
Occupation by median earnings in the past 12 months ($)
90,354Management occupations
84,950Education, training, and library occupations
76,779Business and financial operations occupations
75,784Sales and related occupations
61,214Health technologists and technicians
61,080Health diagnosing and treating practitioners and other technical occupations
Companies with federal contracts located in this zip code (MARCY, NY):
RESEARCH ASSC DFNS CNVRSN INC (10002 HILLSIDE TER) : $11,220,238 in 78 contractsfrom 1999 to 2006
Contracts for Other Defense -- Applied Research and Exploratory Development (R&D), Other Defense -- Operational Systems Development (R&D), Other Defense -- Advanced Development (R&D), Engineering and Technical Services, and moreby Air Force Signed by year:2000: $1,364,011; 2001: $1,203,788; 2002: $1,466,794; 2003: $2,198,853; 2004: $1,079,094; 2005: $1,899,995; 2006: $1,839,703.
Biggest contracts:
$1,028,000 with Air Force for Other Defense -- Applied Research and Exploratory Development (R&D). Signed on 2005-02-11. Completion date: 2008-05-13.
$573,382 with Air Force for Other Defense -- Operational Systems Development (R&D). Signed on 2003-11-25. Completion date: 2005-02-16.
$494,000, same as above.Signed on 2002-09-13. Completion date: 2004-05-16.
$470,000 with Air Force for Other Defense -- Advanced Development (R&D). Signed on 2003-03-18. Completion date: 2005-06-07.
STIEFVATER CONSULTANTS (10002 HILLSIDE TER; small business) : $4,653,595 in 22 contractsfrom 1999 to 2006
Contracts for Defense Missile and Space Systems -- Advanced Development (R&D), Defense Electronics and Communication Equipment -- Applied Research and Exploratory Development (R&D), Other Defense -- Basic Research (R&D), Other Defense -- Applied Research and Exploratory Development (R&D), and moreby Army, Navy, Air Force Signed by year:2000: $397,036; 2001: $99,916; 2002: $444,847; 2003: $620,027; 2004: $1,094,921; 2005: $1,391,887; 2006: $235,033.
Biggest contracts:
$650,000 with Army for Defense Missile and Space Systems -- Advanced Development (R&D). Signed on 2004-07-28. Completion date: 2006-07-28.
$496,855 with Navy for Defense Electronics and Communication Equipment -- Applied Research and Exploratory Development (R&D). Signed on 2005-09-20. Completion date: 2007-03-19.
$375,000 with Air Force for Other Defense -- Basic Research (R&D). Signed on 2004-08-27. Completion date: 2006-08-23.
$375,000 with Air Force for Other Defense -- Applied Research and Exploratory Development (R&D). Signed on 2002-08-01. Completion date: 2004-10-31.
SUNOCO, INC (R&M) (9754 RIVER RD) : $167,354 in 8 contractsfrom 2004 to 2006
Contracts for Fuel Oils, Liquid Propellants and Fuels, Petroleum Base by Department of Veterans Affairs, Defense Logistics Agency, Army, Air Force, and others Signed by year:2000: $0; 2001: $0; 2002: $0; 2003: $0; 2004: $3,000; 2005: $100,162; 2006: $64,192.
Biggest contracts:
$40,213 with Department of Veterans Affairs for Fuel Oils. Signed on 2005-05-03. Completion date: 2005-05-13.
$30,650, same as above.Signed on 2006-01-04. Completion date: 2006-01-14.
$30,563, same as above.Signed on 2005-01-04. Completion date: 2005-01-14.
$29,386, same as above.Signed on 2005-01-19. Completion date: 2005-01-21.
TOTAL OFFICE SYSTEMS OF NY, IN (9206 RT 49; small business) 5 employees, $1100000 revenue. : $138,030 in 2 contractsfrom 2001 to 2002
$75,000 with Office of Assistant Secretary for Health except national centers (disused code) for Paper and Paperboard. Signed on 2002-01-15. Completion date: 2002-02-15.
$63,030 with Army for Paper and Paperboard. Taking place in ME. Signed on 2001-09-27. Completion date: 2001-10-12.
Top industries in this zip code by the number of employees in 2005:
Health Care and Social Assistance: Psychiatric and Substance Abuse Hospitals (over 1000 employees: 1 establishment)
Administrative and Support and Waste Management and Remediation Services: Janitorial Services (50-99: 1)
Information: Radio Stations (50-99: 1)
Other Services (except Public Administration): Industrial Launderers (50-99: 1)
Construction: Commercial and Institutional Building Construction (20-49: 1, 10-19: 1, 5-9: 1, 1-4: 1)
Other Services (except Public Administration): General Automotive Repair (20-49: 1, 5-9: 1, 1-4: 3)
People in group quarters in 2010:
2,608 people in state prisons
358 people in college/university student housing
292 people in mental (psychiatric) hospitals and psychiatric units in other hospitals
25 people in group homes intended for adults
People in group quarters in 2000:
3,604 people in state prisons
196 people in mental (psychiatric) hospitals or wards
42 people in college dormitories (includes college quarters off campus)
14 people in homes for the mentally retarded
4 people in other noninstitutional group quarters
Fatal accident statistics in 2010:
Fatal accident count: 2
Vehicles involved in fatal accidents: 3
Fatal accidents caused by drunken drivers: 1
Fatalities: 2
Persons involved in fatal accidents: 2
Pedestrians involved in fatal accidents: 0
Home Mortgage Disclosure Act Aggregated Statistics For Year 2009 (Based on 1 full and 2 partial tracts)
A) FHA, FSA/RHS & VA Home Purchase Loans
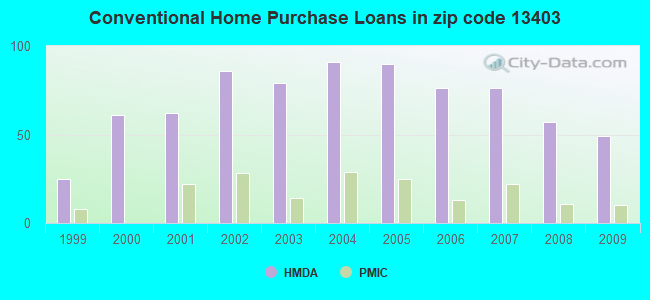
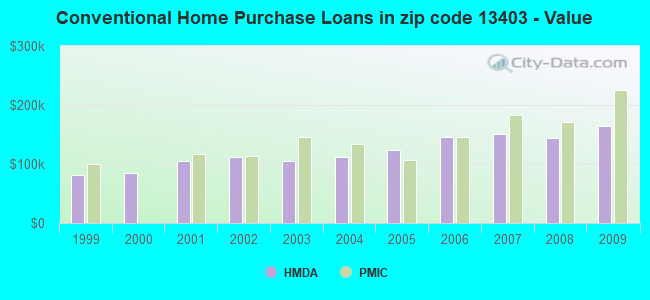
B) Conventional Home Purchase Loans
C) Refinancings
D) Home Improvement Loans
E) Loans on Dwellings For 5+ Families
F) Non-occupant Loans on < 5 Family Dwellings (A B C & D)
G) Loans On Manufactured Home Dwelling (A B C & D)
Number
Average Value
Number
Average Value
Number
Average Value
Number
Average Value
Number
Average Value
Number
Average Value
Number
Average Value
LOANS ORIGINATED
25
$135,969
49
$164,809
155
$136,742
33
$29,561
2
$230,000
2
$242,690
3
$83,010
APPLICATIONS APPROVED, NOT ACCEPTED
0
$0
5
$154,178
19
$114,791
0
$0
0
$0
0
$0
0
$0
APPLICATIONS DENIED
0
$0
6
$224,183
43
$134,237
24
$29,279
0
$0
3
$154,920
0
$0
APPLICATIONS WITHDRAWN
2
$120,550
0
$0
41
$144,654
0
$0
0
$0
0
$0
0
$0
FILES CLOSED FOR INCOMPLETENESS
2
$85,655
0
$0
6
$169,723
0
$0
0
$0
0
$0
0
$0
Aggregated Statistics For Year 2008 (Based on 2 partial tracts)
A) FHA, FSA/RHS & VA Home Purchase Loans
B) Conventional Home Purchase Loans
C) Refinancings
D) Home Improvement Loans
F) Non-occupant Loans on < 5 Family Dwellings (A B C & D)
G) Loans On Manufactured Home Dwelling (A B C & D)
Number
Average Value
Number
Average Value
Number
Average Value
Number
Average Value
Number
Average Value
Number
Average Value
LOANS ORIGINATED
19
$131,988
57
$144,595
124
$112,352
38
$34,437
3
$35,953
3
$72,437
APPLICATIONS APPROVED, NOT ACCEPTED
0
$0
11
$159,629
10
$113,572
3
$18,507
0
$0
0
$0
APPLICATIONS DENIED
5
$78,992
6
$131,918
71
$129,510
41
$32,150
0
$0
2
$34,895
APPLICATIONS WITHDRAWN
3
$69,793
0
$0
14
$158,394
6
$86,712
0
$0
0
$0
FILES CLOSED FOR INCOMPLETENESS
0
$0
2
$92,000
3
$198,277
0
$0
2
$92,000
0
$0
Aggregated Statistics For Year 2007 (Based on 1 full and 2 partial tracts)
A) FHA, FSA/RHS & VA Home Purchase Loans
B) Conventional Home Purchase Loans
C) Refinancings
D) Home Improvement Loans
F) Non-occupant Loans on < 5 Family Dwellings (A B C & D)
G) Loans On Manufactured Home Dwelling (A B C & D)
Number
Average Value
Number
Average Value
Number
Average Value
Number
Average Value
Number
Average Value
Number
Average Value
LOANS ORIGINATED
18
$116,174
76
$150,292
111
$113,821
73
$33,419
5
$134,510
6
$90,148
APPLICATIONS APPROVED, NOT ACCEPTED
0
$0
10
$112,779
10
$100,089
8
$23,396
0
$0
0
$0
APPLICATIONS DENIED
2
$103,895
14
$175,288
76
$154,592
25
$23,495
10
$215,789
5
$63,766
APPLICATIONS WITHDRAWN
0
$0
5
$97,710
49
$147,387
6
$86,448
0
$0
0
$0
FILES CLOSED FOR INCOMPLETENESS
2
$57,895
0
$0
6
$159,942
0
$0
0
$0
0
$0
Aggregated Statistics For Year 2006 (Based on 1 full and 2 partial tracts)
A) FHA, FSA/RHS & VA Home Purchase Loans
B) Conventional Home Purchase Loans
C) Refinancings
D) Home Improvement Loans
F) Non-occupant Loans on < 5 Family Dwellings (A B C & D)
G) Loans On Manufactured Home Dwelling (A B C & D)
Number
Average Value
Number
Average Value
Number
Average Value
Number
Average Value
Number
Average Value
Number
Average Value
LOANS ORIGINATED
17
$135,760
76
$146,264
108
$96,318
46
$50,793
6
$199,068
0
$0
APPLICATIONS APPROVED, NOT ACCEPTED
0
$0
14
$106,729
27
$121,021
6
$15,333
2
$72,965
3
$25,380
APPLICATIONS DENIED
5
$60,592
23
$172,259
97
$115,956
31
$38,076
9
$292,523
6
$81,160
APPLICATIONS WITHDRAWN
2
$161,000
8
$81,491
76
$122,096
3
$175,540
2
$89,620
2
$54,725
FILES CLOSED FOR INCOMPLETENESS
0
$0
3
$71,380
22
$109,304
2
$19,830
0
$0
0
$0
Aggregated Statistics For Year 2005 (Based on 1 full and 2 partial tracts)
A) FHA, FSA/RHS & VA Home Purchase Loans
B) Conventional Home Purchase Loans
C) Refinancings
D) Home Improvement Loans
E) Loans on Dwellings For 5+ Families
F) Non-occupant Loans on < 5 Family Dwellings (A B C & D)
G) Loans On Manufactured Home Dwelling (A B C & D)
Number
Average Value
Number
Average Value
Number
Average Value
Number
Average Value
Number
Average Value
Number
Average Value
Number
Average Value
LOANS ORIGINATED
13
$90,658
90
$123,547
128
$96,758
63
$33,889
3
$315,127
10
$87,558
5
$54,882
APPLICATIONS APPROVED, NOT ACCEPTED
0
$0
8
$72,172
19
$115,709
10
$52,820
0
$0
2
$35,690
2
$50,760
APPLICATIONS DENIED
0
$0
24
$85,324
143
$123,990
32
$57,896
0
$0
5
$73,600
3
$48,643
APPLICATIONS WITHDRAWN
0
$0
2
$57,105
107
$109,862
11
$175,924
0
$0
2
$63,450
0
$0
FILES CLOSED FOR INCOMPLETENESS
0
$0
5
$125,944
9
$66,310
2
$59,485
0
$0
0
$0
0
$0
Aggregated Statistics For Year 2004 (Based on 1 full and 2 partial tracts)
A) FHA, FSA/RHS & VA Home Purchase Loans
B) Conventional Home Purchase Loans
C) Refinancings
D) Home Improvement Loans
F) Non-occupant Loans on < 5 Family Dwellings (A B C & D)
G) Loans On Manufactured Home Dwelling (A B C & D)
Number
Average Value
Number
Average Value
Number
Average Value
Number
Average Value
Number
Average Value
Number
Average Value
LOANS ORIGINATED
8
$94,379
91
$111,679
140
$95,523
45
$36,000
5
$58,372
3
$80,367
APPLICATIONS APPROVED, NOT ACCEPTED
2
$93,585
10
$98,820
24
$160,933
2
$31,725
2
$18,240
2
$25,380
APPLICATIONS DENIED
2
$49,170
14
$84,975
111
$114,392
24
$37,011
2
$57,895
8
$20,224
APPLICATIONS WITHDRAWN
2
$64,240
10
$103,262
103
$115,623
6
$47,322
0
$0
2
$67,415
FILES CLOSED FOR INCOMPLETENESS
0
$0
6
$126,632
27
$113,266
3
$26,967
0
$0
0
$0
Aggregated Statistics For Year 2003 (Based on 1 full and 2 partial tracts)
A) FHA, FSA/RHS & VA Home Purchase Loans
B) Conventional Home Purchase Loans
C) Refinancings
D) Home Improvement Loans
E) Loans on Dwellings For 5+ Families
F) Non-occupant Loans on < 5 Family Dwellings (A B C & D)
Number
Average Value
Number
Average Value
Number
Average Value
Number
Average Value
Number
Average Value
Number
Average Value
LOANS ORIGINATED
22
$83,203
79
$105,512
271
$93,183
24
$30,402
2
$103,895
8
$69,198
APPLICATIONS APPROVED, NOT ACCEPTED
0
$0
3
$118,437
40
$105,680
3
$18,507
0
$0
0
$0
APPLICATIONS DENIED
0
$0
2
$57,105
115
$108,618
14
$38,296
0
$0
0
$0
APPLICATIONS WITHDRAWN
2
$101,515
5
$87,876
87
$97,105
0
$0
0
$0
0
$0
FILES CLOSED FOR INCOMPLETENESS
0
$0
2
$47,585
5
$61,544
0
$0
0
$0
0
$0
Aggregated Statistics For Year 2002 (Based on 1 full and 2 partial tracts)
A) FHA, FSA/RHS & VA Home Purchase Loans
B) Conventional Home Purchase Loans
C) Refinancings
D) Home Improvement Loans
F) Non-occupant Loans on < 5 Family Dwellings (A B C & D)
Number
Average Value
Number
Average Value
Number
Average Value
Number
Average Value
Number
Average Value
LOANS ORIGINATED
18
$90,072
86
$111,200
184
$81,478
49
$31,446
6
$64,242
APPLICATIONS APPROVED, NOT ACCEPTED
0
$0
11
$96,182
25
$73,917
3
$44,943
2
$99,140
APPLICATIONS DENIED
0
$0
14
$58,123
95
$101,767
17
$38,442
3
$319,353
APPLICATIONS WITHDRAWN
3
$54,460
5
$112,654
87
$80,257
8
$25,578
3
$81,423
FILES CLOSED FOR INCOMPLETENESS
0
$0
0
$0
10
$76,613
0
$0
0
$0
Aggregated Statistics For Year 2001 (Based on 1 full and 2 partial tracts)
A) FHA, FSA/RHS & VA Home Purchase Loans
B) Conventional Home Purchase Loans
C) Refinancings
D) Home Improvement Loans
F) Non-occupant Loans on < 5 Family Dwellings (A B C & D)
Number
Average Value
Number
Average Value
Number
Average Value
Number
Average Value
Number
Average Value
LOANS ORIGINATED
19
$74,406
62
$105,099
151
$81,516
64
$22,604
3
$66,620
APPLICATIONS APPROVED, NOT ACCEPTED
2
$33,310
8
$79,905
24
$120,683
6
$34,368
0
$0
APPLICATIONS DENIED
2
$60,275
6
$102,310
72
$78,284
20
$13,466
0
$0
APPLICATIONS WITHDRAWN
2
$68,205
6
$109,183
68
$75,958
13
$42,828
2
$33,310
FILES CLOSED FOR INCOMPLETENESS
0
$0
0
$0
17
$63,635
0
$0
0
$0
Aggregated Statistics For Year 2000 (Based on 1 full and 2 partial tracts)
A) FHA, FSA/RHS & VA Home Purchase Loans
B) Conventional Home Purchase Loans
C) Refinancings
D) Home Improvement Loans
F) Non-occupant Loans on < 5 Family Dwellings (A B C & D)
Number
Average Value
Number
Average Value
Number
Average Value
Number
Average Value
Number
Average Value
LOANS ORIGINATED
12
$83,298
61
$85,476
62
$65,577
37
$16,506
2
$106,275
APPLICATIONS APPROVED, NOT ACCEPTED
0
$0
14
$39,541
6
$88,298
8
$27,759
0
$0
APPLICATIONS DENIED
2
$66,620
22
$35,185
54
$50,376
21
$14,578
2
$59,485
APPLICATIONS WITHDRAWN
2
$38,070
8
$30,931
35
$56,242
6
$44,942
0
$0
FILES CLOSED FOR INCOMPLETENESS
0
$0
0
$0
14
$79,650
0
$0
0
$0
Aggregated Statistics For Year 1999 (Based on 1 full and 2 partial tracts)
A) FHA, FSA/RHS & VA Home Purchase Loans
B) Conventional Home Purchase Loans
C) Refinancings
D) Home Improvement Loans
F) Non-occupant Loans on < 5 Family Dwellings (A B C & D)
Detailed PMIC statistics for the following Tracts:0237.01
, 0238.00
2002 - 2018 National Fire Incident Reporting System (NFIRS) incidents
Based on the data from the years 2002 - 2018 the average number of fires per year is 23. The highest number of fire incidents - 35 took place in 2009, and the least - 13 in 2005. The data has a rising trend.
When looking into fire subcategories, the most incidents belonged to: Structure Fires (55.3%), and Mobile Property/Vehicle Fires (23.8%).
Fire incident types reported to NFIRS in Zip Code 13403


 Nearest zip codes: 13495, 13469, 13417, 13492, 13501, 13424.
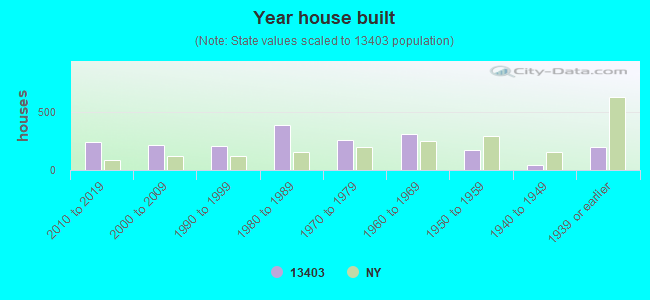


 Based on the data from the years 2002 - 2018 the average number of fires per year is 23. The highest number of fire incidents - 35 took place in 2009, and the least - 13 in 2005. The data has a rising trend.
 When looking into fire subcategories, the most incidents belonged to: Structure Fires (55.3%), and Mobile Property/Vehicle Fires (23.8%).