Estimated zip code population in 2022: 6,454 Zip code population in 2010: 6,344 Zip code population in 2000: 5,883
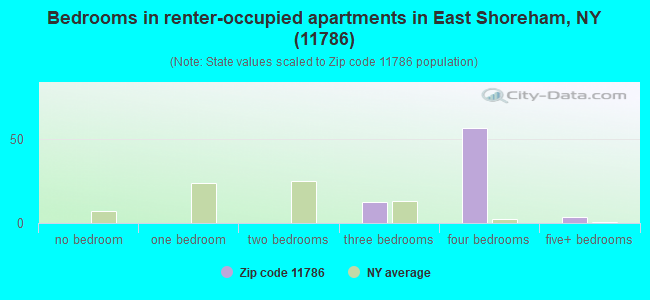
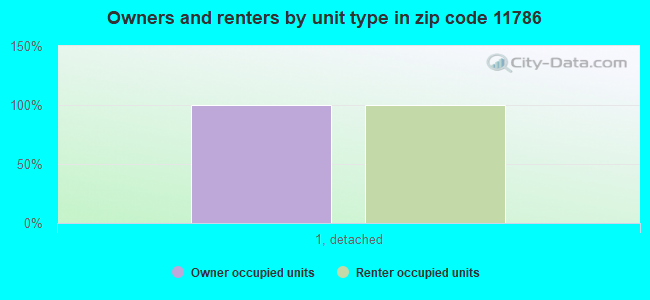
Houses and condos: 1,980 Renter-occupied apartments: 74
% of renters here:
4%
State:
46%
March 2022 cost of living index in zip code 11786: 149.9 (very high, U.S. average is 100)
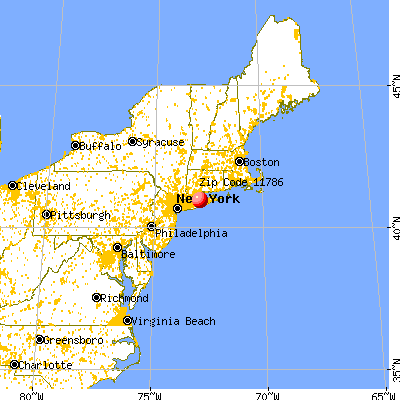
Land area: 5.8 sq. mi. Water area: 1.7 sq. mi.
Population density: 1,121 people per square mile
(low).
OSM Map
General Map
Google Map
MSN Map
OSM Map
General Map
Google Map
MSN Map
OSM Map
General Map
Google Map
MSN Map
OSM Map
General Map
Google Map
MSN Map
Please wait while loading the map...
Real estate property taxes paid for housing units in 2022:
This zip code:
1.9% ($9,805)
New York:
1.5% ($6,180)
Median real estate property taxes paid for housing units with mortgages in 2022: $9,858 (1.9%) Median real estate property taxes paid for housing units with no mortgage in 2022: $9,755 (2.0%)
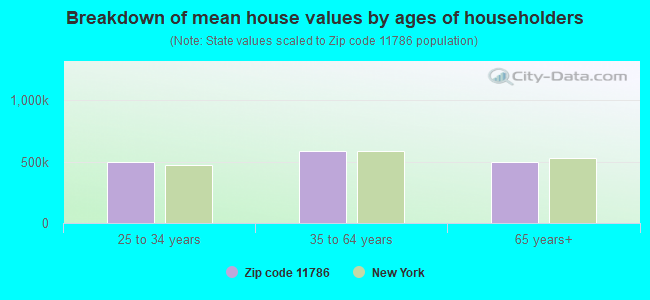
Estimated median house/condo value in 2022: $507,875
11786:
$507,875
New York:
$400,400
Median resident age:
This zip code:
39.4 years
New York median age:
40.0 years
Average household size:
This zip code:
3.2 people
New York:
2.5 people
Averages for the 2020 tax year for zip code 11786, filed in 2021:
Average Adjusted Gross Income (AGI) in 2020: $111,978 (Individual Income Tax Returns)
Here:
$111,978
State:
$90,930
Salary/wage: $93,987 (reported on 82.6% of returns)
Here:
$93,987
State:
$72,104
(% of AGI for various income ranges: 1312.1% for AGIs below $25k, 3983.5% for AGIs $25k-50k, 6936.0% for AGIs $50k-75k, 10052.9% for AGIs $75k-100k, 17523.6% for AGIs $100k-200k, 62771.6% for AGIs over 200k)
Taxable interest for individuals: $1,310 (reported on 53.4% of returns)
This zip code:
$1,310
New York:
$3,075
(% of AGI for various income ranges: 29.6% for AGIs below $25k, 44.2% for AGIs $25k-50k, 38.4% for AGIs $50k-75k, 96.5% for AGIs $75k-100k, 174.0% for AGIs $100k-200k, 492.1% for AGIs over 200k)
Ordinary dividends: $4,602 (reported on 31.1% of returns)
Here:
$4,602
State:
$11,095
(% of AGI for various income ranges: 45.4% for AGIs below $25k, 87.4% for AGIs $25k-50k, 110.4% for AGIs $50k-75k, 103.5% for AGIs $75k-100k, 318.1% for AGIs $100k-200k, 1188.4% for AGIs over 200k)
Net capital gain/loss in AGI: +$13,457 (reported on 28.4% of returns)
Here:
+$13,457
State:
+$44,925
(% of AGI for various income ranges: 26.0% for AGIs below $25k, 78.7% for AGIs $25k-50k, 166.4% for AGIs $50k-75k, 184.7% for AGIs $75k-100k, 400.0% for AGIs $100k-200k, 5018.9% for AGIs over 200k)
Profit/loss from business: +$17,707 (reported on 13.7% of returns)
Here:
+$17,707
State:
+$14,940
(% of AGI for various income ranges: 88.8% for AGIs below $25k, 111.9% for AGIs $25k-50k, 266.4% for AGIs $50k-75k, 381.2% for AGIs $75k-100k, 323.4% for AGIs $100k-200k, 2295.3% for AGIs over 200k)
Taxable individual retirement arrangement distribution: $19,312 (reported on 9.8% of returns)
11786:
$19,312
New York:
$19,609
(% of AGI for various income ranges: 36.0% for AGIs below $25k, 184.2% for AGIs $25k-50k, 222.8% for AGIs $50k-75k, 247.6% for AGIs $75k-100k, 464.3% for AGIs $100k-200k, 1197.9% for AGIs over 200k)
Self-employed (Keogh) retirement plans: $20,000 (reported on 0.9% of returns)
11786:
$20,000
New York:
$32,497
(% of AGI for various income ranges: 127.7% for AGIs $100k-200k)
Total itemized deductions: $29,338 (reported on 19.5% of returns)
Here:
$29,338
State:
$39,326
(% of AGI for various income ranges: 508.4% for AGIs $25k-50k, 660.8% for AGIs $50k-75k, 1003.5% for AGIs $75k-100k, 1183.8% for AGIs $100k-200k, 4356.8% for AGIs over 200k)
Charity contributions: $4,746 (reported on 18.0% of returns)
Here:
$4,746
State:
$15,420
(% of AGI for various income ranges: 22.6% for AGIs $25k-50k, 80.0% for AGIs $50k-75k, 102.4% for AGIs $75k-100k, 123.0% for AGIs $100k-200k, 935.8% for AGIs over 200k)
Taxes paid: $9,655 (reported on 19.5% of returns)
11786:
$9,655
State:
$9,183
(% of AGI for various income ranges: 158.7% for AGIs $25k-50k, 270.4% for AGIs $50k-75k, 400.0% for AGIs $75k-100k, 425.7% for AGIs $100k-200k, 1226.3% for AGIs over 200k)
Earned income credit: $1,719 (reported on 4.9% of returns)
Here:
$1,719
State:
$2,138
(% of AGI for various income ranges: 32.3% for AGIs below $25k, 38.7% for AGIs $25k-50k)
Percentage of individuals using paid preparers for their 2020 taxes: 96.0%
Here:
96%
State:
95%
(% for various income ranges: 93.9% for AGIs below $25k, 93.3% for AGIs $25k-50k, 97.4% for AGIs $50k-75k, 96.6% for AGIs $75k-100k, 97.5% for AGIs $100k-200k, 98.1% for AGIs over 200k)
Averages for the 2012 tax year for zip code 11786, filed in 2013:
Average Adjusted Gross Income (AGI) in 2012: $94,665 (Individual Income Tax Returns)
Here:
$94,665
State:
$77,088
Salary/wage: $80,356 (reported on 86.5% of returns)
Here:
$80,356
State:
$60,593
(% of AGI for various income ranges: 74.7% for AGIs below $25k, 78.6% for AGIs $25k-50k, 71.4% for AGIs $50k-75k, 72.5% for AGIs $75k-100k, 75.6% for AGIs $100k-200k, 70.4% for AGIs over 200k)
Taxable interest for individuals: $1,571 (reported on 59.0% of returns)
This zip code:
$1,571
New York:
$3,125
(% of AGI for various income ranges: 1.2% for AGIs below $25k, 0.7% for AGIs $25k-50k, 1.0% for AGIs $50k-75k, 0.9% for AGIs $75k-100k, 0.7% for AGIs $100k-200k, 1.4% for AGIs over 200k)
Ordinary dividends: $2,874 (reported on 31.0% of returns)
Here:
$2,874
State:
$10,299
(% of AGI for various income ranges: 3.5% for AGIs below $25k, 1.5% for AGIs $25k-50k, 1.1% for AGIs $50k-75k, 1.1% for AGIs $75k-100k, 0.7% for AGIs $100k-200k, 0.9% for AGIs over 200k)
Net capital gain/loss in AGI: +$6,976 (reported on 24.2% of returns)
Here:
+$6,976
State:
+$42,474
(% of AGI for various income ranges: 0.1% for AGIs $50k-75k, 0.5% for AGIs $100k-200k, 4.6% for AGIs over 200k)
Profit/loss from business: +$18,789 (reported on 14.8% of returns)
Here:
+$18,789
State:
+$16,168
(% of AGI for various income ranges: 6.1% for AGIs below $25k, 4.3% for AGIs $25k-50k, 1.8% for AGIs $50k-75k, 1.8% for AGIs $75k-100k, 2.2% for AGIs $100k-200k, 3.9% for AGIs over 200k)
Taxable individual retirement arrangement distribution: $19,391 (reported on 11.3% of returns)
11786:
$19,391
New York:
$17,621
(% of AGI for various income ranges: 2.1% for AGIs below $25k, 2.9% for AGIs $25k-50k, 3.2% for AGIs $50k-75k, 2.8% for AGIs $75k-100k, 2.5% for AGIs $100k-200k, 1.7% for AGIs over 200k)
Self-employment retirement plans: $23,450 (reported on 1.3% of returns)
11786:
$23,450
New York:
$27,330
(% of AGI for various income ranges: 0.8% for AGIs $100k-200k)
Total itemized deductions: $34,363 (24% of AGI, reported on 60.6% of returns)
Here:
$34,363
State:
$34,985
Here:
24.5% of AGI
State:
21.3% of AGI
(% of AGI for various income ranges: 15.0% for AGIs below $25k, 22.4% for AGIs $25k-50k, 23.2% for AGIs $50k-75k, 25.2% for AGIs $75k-100k, 22.6% for AGIs $100k-200k, 20.8% for AGIs over 200k)
Charity contributions: $2,663 (reported on 55.2% of returns)
Here:
$2,663
State:
$5,572
(% of AGI for various income ranges: 0.6% for AGIs below $25k, 1.3% for AGIs $25k-50k, 1.7% for AGIs $50k-75k, 1.7% for AGIs $75k-100k, 1.7% for AGIs $100k-200k, 1.5% for AGIs over 200k)
Taxes paid: $17,982 (reported on 60.6% of returns)
11786:
$17,982
State:
$18,656
(% of AGI for various income ranges: 6.9% for AGIs below $25k, 10.2% for AGIs $25k-50k, 11.7% for AGIs $50k-75k, 12.4% for AGIs $75k-100k, 12.2% for AGIs $100k-200k, 11.0% for AGIs over 200k)
Earned income credit: $1,679 (reported on 6.1% of returns)
Here:
$1,679
State:
$2,230
(% of AGI for various income ranges: 2.8% for AGIs below $25k, 0.5% for AGIs $25k-50k)
Percentage of individuals using paid preparers for their 2012 taxes: 71.3%
Here:
71%
State:
66%
(% for various income ranges: 62.9% for AGIs below $25k, 66.7% for AGIs $25k-50k, 70.0% for AGIs $50k-75k, 76.7% for AGIs $75k-100k, 77.9% for AGIs $100k-200k, 78.8% for AGIs over 200k)
Averages for the 2004 tax year for zip code 11786, filed in 2005:
Average Adjusted Gross Income (AGI) in 2004: $79,182 (Individual Income Tax Returns)
Here:
$79,182
State:
$59,519
Salary/wage: $68,093 (reported on 86.9% of returns)
Here:
$68,093
State:
$50,673
(% of AGI for various income ranges: 108.3% for AGIs below $10k, 71.6% for AGIs $10k-25k, 76.7% for AGIs $25k-50k, 74.4% for AGIs $50k-75k, 79.8% for AGIs $75k-100k, 73.4% for AGIs over 100k)
Taxable interest for individuals: $2,152 (reported on 70.9% of returns)
This zip code:
$2,152
New York:
$2,377
(% of AGI for various income ranges: 4.0% for AGIs below $10k, 3.4% for AGIs $10k-25k, 1.6% for AGIs $25k-50k, 1.8% for AGIs $50k-75k, 1.1% for AGIs $75k-100k, 2.0% for AGIs over 100k)
Taxable dividends: $1,985 (reported on 36.3% of returns)
Here:
$1,985
State:
$5,394
(% of AGI for various income ranges: 6.2% for AGIs below $10k, 3.1% for AGIs $10k-25k, 1.2% for AGIs $25k-50k, 1.2% for AGIs $50k-75k, 0.7% for AGIs $75k-100k, 0.7% for AGIs over 100k)
Net capital gain/loss: +$5,903 (reported on 29.9% of returns)
Here:
+$5,903
State:
+$23,581
(% of AGI for various income ranges: -1.4% for AGIs below $10k, -0.4% for AGIs $10k-25k, -0.5% for AGIs $25k-50k, 0.3% for AGIs $50k-75k, -0.1% for AGIs $75k-100k, 3.3% for AGIs over 100k)
Profit/loss from business: +$20,509 (reported on 16.9% of returns)
Here:
+$20,509
State:
+$13,809
(% of AGI for various income ranges: 6.7% for AGIs below $10k, 9.2% for AGIs $10k-25k, 4.8% for AGIs $25k-50k, 5.3% for AGIs $50k-75k, 3.6% for AGIs $75k-100k, 4.1% for AGIs over 100k)
IRA payment deduction: $3,422 (reported on 3.9% of returns)
11786:
$3,422
New York:
$3,115
(% of AGI for various income ranges: 1.6% for AGIs below $10k, 0.4% for AGIs $25k-50k, 0.3% for AGIs $50k-75k, 0.2% for AGIs $75k-100k, 0.1% for AGIs over 100k)
Self-employed pension: $13,061 (reported on 1.7% of returns)
Here:
$13,061
New York:
$19,016
Total itemized deductions: $28,081 (24% of AGI, reported on 61.1% of returns)
Here:
$28,081
State:
$25,864
Here:
23.9% of AGI
State:
21.9% of AGI
(% of AGI for various income ranges: 10.3% for AGIs below $10k, 21.2% for AGIs $10k-25k, 23.0% for AGIs $25k-50k, 28.3% for AGIs $50k-75k, 26.8% for AGIs $75k-100k, 19.8% for AGIs over 100k)
Charity contributions deductions: $2,917 (2% of AGI, reported on 58.1% of returns)
Here:
$2,917
State:
$4,439
Here:
2.4% of AGI
State:
3.6% of AGI
(% of AGI for various income ranges: 1.4% for AGIs $10k-25k, 2.1% for AGIs $25k-50k, 2.7% for AGIs $50k-75k, 2.4% for AGIs $75k-100k, 2.1% for AGIs over 100k)
Total tax: $13,534 (reported on 80.8% of returns)
11786:
$13,534
State:
$11,730
(% of AGI for various income ranges: 2.5% for AGIs below $10k, 5.0% for AGIs $10k-25k, 7.1% for AGIs $25k-50k, 8.3% for AGIs $50k-75k, 8.5% for AGIs $75k-100k, 16.7% for AGIs over 100k)
Earned income credit: $1,290 (reported on 5.2% of returns)
Here:
$1,290
State:
$1,757
Percentage of individuals using paid preparers for their 2004 taxes: 68.5%
Here:
69%
State:
67%
(% for various income ranges: 53.8% for AGIs below $10k, 62.4% for AGIs $10k-25k, 68.3% for AGIs $25k-50k, 75.6% for AGIs $50k-75k, 74.4% for AGIs $75k-100k, 75.2% for AGIs over 100k)
Household received Food Stamps/SNAP in the past 12 months: 78 Household did not receive Food Stamps/SNAP in the past 12 months: 1,860
Women who had a birth in the past 12 months: 48 (3 now married, 47 unmarried) Women who did not have a birth in the past 12 months: 1,115 (603 now married, 502 unmarried)
Housing units in zip code 11786 with a mortgage: 1,413 (218 second mortgage, 220 both second mortgage and home equity loan) Houses without a mortgage: 37
Median monthly owner costs for units with a mortgage: $3,444 Median monthly owner costs for units without a mortgage: $1,487
Residents with income below the poverty level in 2022:
This zip code:
4.8%
Whole state:
14.3%
Residents with income below 50% of the poverty level in 2022:
This zip code:
1.7%
Whole state:
6.8%
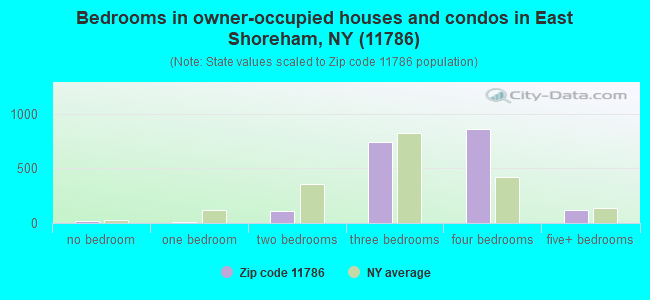
Median number of rooms in houses and condos:
Here:
7.2
State:
6.3
Median number of rooms in apartments:
Here:
7.9
State:
3.8
Notable locations in this zip code not listed on our city pages
Notable locations in zip code 11786: Tallgrass at Shoreham Golf Course (A), West Landing (B), North Shore Public Library (C). Display/hide their locations on the map
In group quarters: 178 (-1 institutionalized population)
Size of family households: 595 2-persons, 281 3-persons, 337 4-persons, 157 5-persons, 179 6-persons, 54 7-or-more-persons
Size of nonfamily households: 283 1-person, 41 2-persons, 7 3-persons
1,289 married couples with children.
177 single-parent households (33 men, 144 women).
91.1% of residents of 11786 zip code speak English at home.
4.8% of residents speak Spanish at home (74% very well, 10% well, 4% not well, 11% not at all).
1.9% of residents speak other Indo-European language at home (70% very well, 30% well).
0.3% of residents speak Asian or Pacific Island language at home (57% very well, 29% well, 14% not well).
1.3% of residents speak other language at home (82% very well, 18% not well).
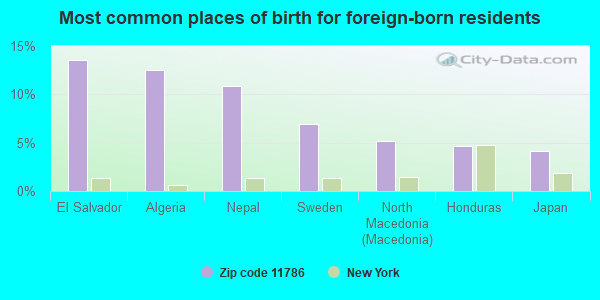
Foreign born population: 408 (6.3%) (68.0% of them are naturalized citizens)
This zip code:
6.3%
Whole state:
22.7%
14%El Salvador
13%Algeria
11%Nepal
7%Sweden
5%North Macedonia (Macedonia)
5%Honduras
4%Japan
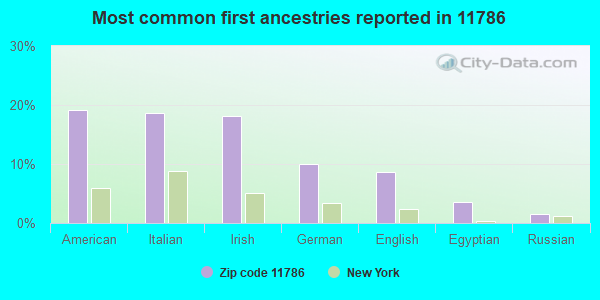
19%American
19%Italian
18%Irish
10%German
9%English
4%Egyptian
2%Russian
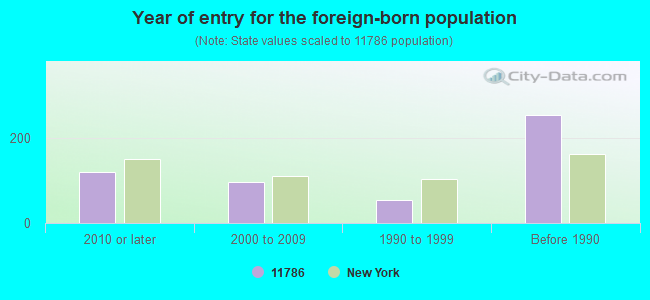
Year of entry for the foreign-born population
1202010 or later
962000 to 2009
531990 to 1999
253Before 1990
Facilities with environmental interests located in this zip code:
HENDRICKSON BROS INC (W TURBINE DR in SHOREHAM, NY)
(Resource Conservation and Recovery Act (tracking hazardous waste))
Housing units lacking complete kitchen facilities: 0.4%
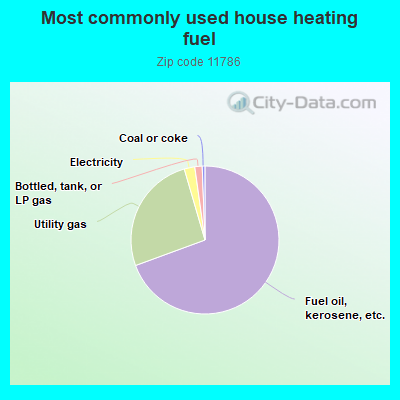
69.2%Fuel oil, kerosene, etc.
26.0%Utility gas
2.3%Electricity
1.6%Bottled, tank, or LP gas
0.6%Coal or coke
Population in 1990: 5,114. Population change in the 1990s: +769 (+15.0%).
Place of birth for U.S.-born residents:
This state: 5,359
Northeast: 144
Midwest: 93
South: 190
West: 124
75% of the 11786 zip code residents lived in the same house 5 years ago. Out of people who lived in different houses, 73% lived in this county. Out of people who lived in different counties, 50% lived in New York.
92% of the 11786 zip code residents lived in the same house 1 year ago. Out of people who lived in different houses, 57% moved from this county. Out of people who lived in different houses, 32% moved from different county within same state. Out of people who lived in different houses, 3% moved from different state. Out of people who lived in different houses, 7% moved from abroad.
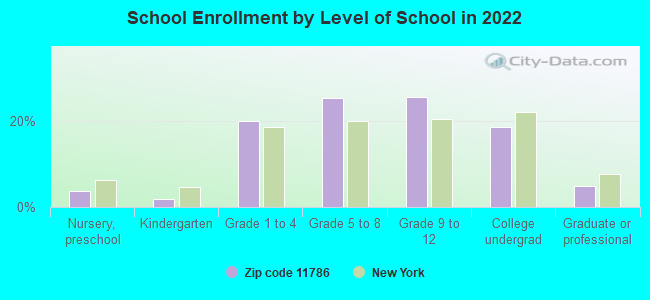
Private vs. public school enrollment:
Students in private schools in grades 1 to 8 (elementary and middle school): 6
Here:
0.8%
New York:
15.6%
Students in private schools in grades 9 to 12 (high school):
Here:
0.0%
New York:
15.0%
Students in private undergraduate colleges: 90
Here:
25.3%
New York:
39.2%
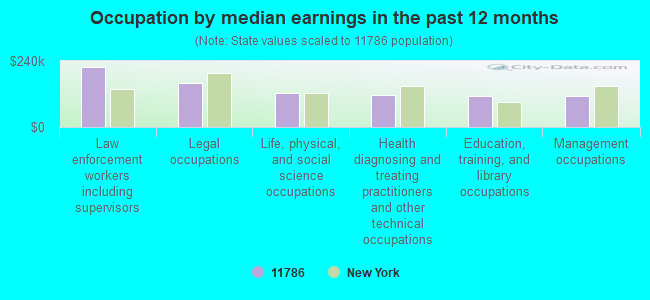
Occupation by median earnings in the past 12 months ($)
218,556Law enforcement workers including supervisors
161,619Legal occupations
123,680Life, physical, and social science occupations
116,603Health diagnosing and treating practitioners and other technical occupations
113,408Education, training, and library occupations
112,960Management occupations
Top industries in this zip code by the number of employees in 2005:
Health Care and Social Assistance: Residential Mental Retardation Facilities (100-249 employees: 1 establishment)
Other Services (except Public Administration): Religious Organizations (50-99: 1, 10-19: 1, 5-9: 1, 1-4: 1)
Construction: Highway, Street, and Bridge Construction (50-99: 1)
Health Care and Social Assistance: Offices of Dentists (10-19: 2, 5-9: 2)
Accommodation and Food Services: Caterers (20-49: 1)
Health Care and Social Assistance: Residential Mental Health and Substance Abuse Facilities (20-49: 1)
Administrative and Support and Waste Management and Remediation Services: Landscaping Services (10-19: 1, 1-4: 8)
Construction: New Single-Family Housing Construction (except Operative Builders) (10-19: 1, 1-4: 4)
Health Care and Social Assistance: Offices of Physicians (except Mental Health Specialists) (10-19: 1, 1-4: 2)
People in group quarters in 2010:
96 people in group homes intended for adults
6 people in residential treatment centers for adults
3 people in other noninstitutional facilities
People in group quarters in 2000:
84 people in homes for the mentally retarded
5 people in agriculture workers' dormitories on farms
2 people in religious group quarters
Fatal accident statistics in 2013:
Fatal accident count: 2
Vehicles involved in fatal accidents: 4
Fatal accidents caused by drunken drivers: 0
Fatalities: 2
Persons involved in fatal accidents: 8
Pedestrians involved in fatal accidents: 1
Fatal accident statistics in 2012:
Fatal accident count: 1
Vehicles involved in fatal accidents: 1
Fatal accidents caused by drunken drivers: 0
Fatalities: 1
Persons involved in fatal accidents: 1
Pedestrians involved in fatal accidents: 0
Home Mortgage Disclosure Act Aggregated Statistics For Year 2009 (Based on 6 partial tracts)
A) FHA, FSA/RHS & VA Home Purchase Loans
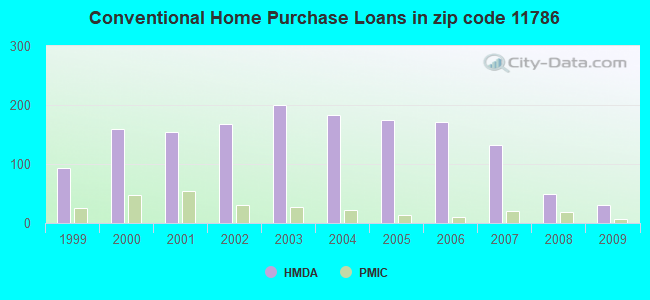
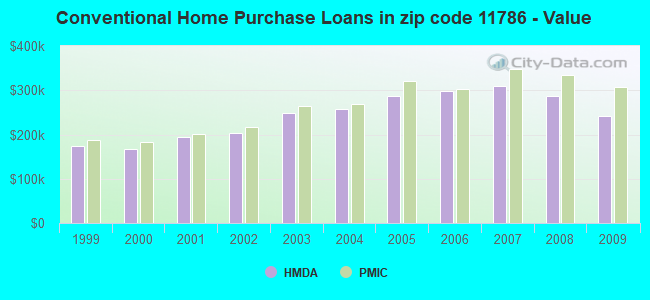
B) Conventional Home Purchase Loans
C) Refinancings
D) Home Improvement Loans
F) Non-occupant Loans on < 5 Family Dwellings (A B C & D)
Number
Average Value
Number
Average Value
Number
Average Value
Number
Average Value
Number
Average Value
LOANS ORIGINATED
27
$295,733
30
$242,861
188
$256,403
21
$99,952
8
$201,915
APPLICATIONS APPROVED, NOT ACCEPTED
2
$212,085
5
$289,264
30
$281,287
5
$163,932
3
$229,003
APPLICATIONS DENIED
1
$240,910
6
$235,228
73
$333,342
9
$134,680
4
$240,992
APPLICATIONS WITHDRAWN
5
$348,820
5
$265,454
78
$324,361
1
$41,980
0
$0
FILES CLOSED FOR INCOMPLETENESS
0
$0
2
$318,920
16
$278,984
0
$0
1
$489,720
Aggregated Statistics For Year 2008 (Based on 6 partial tracts)
A) FHA, FSA/RHS & VA Home Purchase Loans
B) Conventional Home Purchase Loans
C) Refinancings
D) Home Improvement Loans
F) Non-occupant Loans on < 5 Family Dwellings (A B C & D)
Number
Average Value
Number
Average Value
Number
Average Value
Number
Average Value
Number
Average Value
LOANS ORIGINATED
12
$335,312
49
$287,006
80
$254,901
30
$86,389
4
$271,158
APPLICATIONS APPROVED, NOT ACCEPTED
0
$0
6
$234,832
22
$198,222
6
$62,088
0
$0
APPLICATIONS DENIED
1
$452,230
6
$329,568
65
$310,542
20
$64,277
3
$201,270
APPLICATIONS WITHDRAWN
3
$312,913
9
$260,628
37
$312,198
5
$72,168
2
$194,220
FILES CLOSED FOR INCOMPLETENESS
1
$496,720
4
$371,358
15
$248,727
3
$47,150
0
$0
Aggregated Statistics For Year 2007 (Based on 6 partial tracts)
A) FHA, FSA/RHS & VA Home Purchase Loans
B) Conventional Home Purchase Loans
C) Refinancings
D) Home Improvement Loans
F) Non-occupant Loans on < 5 Family Dwellings (A B C & D)
Number
Average Value
Number
Average Value
Number
Average Value
Number
Average Value
Number
Average Value
LOANS ORIGINATED
4
$321,228
133
$309,051
162
$242,950
65
$88,424
11
$248,924
APPLICATIONS APPROVED, NOT ACCEPTED
0
$0
15
$330,195
32
$250,490
10
$158,906
1
$295,290
APPLICATIONS DENIED
1
$514,910
31
$363,544
94
$314,738
22
$236,563
4
$288,948
APPLICATIONS WITHDRAWN
2
$213,815
16
$169,503
37
$283,489
6
$163,810
1
$194,370
FILES CLOSED FOR INCOMPLETENESS
0
$0
4
$446,695
20
$274,426
2
$94,805
0
$0
Aggregated Statistics For Year 2006 (Based on 6 partial tracts)
A) FHA, FSA/RHS & VA Home Purchase Loans
B) Conventional Home Purchase Loans
C) Refinancings
D) Home Improvement Loans
E) Loans on Dwellings For 5+ Families
F) Non-occupant Loans on < 5 Family Dwellings (A B C & D)
Number
Average Value
Number
Average Value
Number
Average Value
Number
Average Value
Number
Average Value
Number
Average Value
LOANS ORIGINATED
2
$305,975
172
$299,297
223
$244,635
59
$151,027
0
$0
13
$319,649
APPLICATIONS APPROVED, NOT ACCEPTED
0
$0
21
$326,170
45
$229,808
14
$65,334
0
$0
1
$42,650
APPLICATIONS DENIED
0
$0
33
$361,868
119
$290,207
28
$86,997
1
$2,620
3
$309,137
APPLICATIONS WITHDRAWN
1
$237,540
28
$381,319
105
$294,528
9
$178,090
0
$0
3
$501,403
FILES CLOSED FOR INCOMPLETENESS
0
$0
4
$341,740
46
$265,603
3
$46,820
0
$0
1
$744,370
Aggregated Statistics For Year 2005 (Based on 6 partial tracts)
A) FHA, FSA/RHS & VA Home Purchase Loans
B) Conventional Home Purchase Loans
C) Refinancings
D) Home Improvement Loans
F) Non-occupant Loans on < 5 Family Dwellings (A B C & D)
G) Loans On Manufactured Home Dwelling (A B C & D)
Number
Average Value
Number
Average Value
Number
Average Value
Number
Average Value
Number
Average Value
Number
Average Value
LOANS ORIGINATED
1
$219,970
175
$286,565
241
$233,020
65
$109,304
14
$250,212
0
$0
APPLICATIONS APPROVED, NOT ACCEPTED
0
$0
32
$342,562
53
$260,434
14
$87,373
4
$371,885
1
$46,170
APPLICATIONS DENIED
0
$0
41
$309,963
114
$252,685
18
$100,728
3
$435,840
0
$0
APPLICATIONS WITHDRAWN
0
$0
27
$262,388
108
$245,056
9
$267,530
3
$589,957
0
$0
FILES CLOSED FOR INCOMPLETENESS
0
$0
7
$325,523
55
$272,690
2
$72,260
0
$0
1
$183,740
Aggregated Statistics For Year 2004 (Based on 6 partial tracts)
A) FHA, FSA/RHS & VA Home Purchase Loans
B) Conventional Home Purchase Loans
C) Refinancings
D) Home Improvement Loans
F) Non-occupant Loans on < 5 Family Dwellings (A B C & D)
G) Loans On Manufactured Home Dwelling (A B C & D)
Number
Average Value
Number
Average Value
Number
Average Value
Number
Average Value
Number
Average Value
Number
Average Value
LOANS ORIGINATED
3
$224,507
183
$257,483
326
$212,615
62
$73,590
16
$248,810
3
$25,153
APPLICATIONS APPROVED, NOT ACCEPTED
0
$0
29
$299,493
43
$199,981
16
$95,904
1
$72,110
0
$0
APPLICATIONS DENIED
0
$0
28
$245,765
101
$248,239
35
$127,598
5
$134,106
3
$17,460
APPLICATIONS WITHDRAWN
0
$0
32
$293,484
107
$213,271
12
$81,014
5
$293,750
0
$0
FILES CLOSED FOR INCOMPLETENESS
1
$397,370
8
$323,388
50
$230,775
3
$75,903
1
$150,970
0
$0
Aggregated Statistics For Year 2003 (Based on 6 partial tracts)
A) FHA, FSA/RHS & VA Home Purchase Loans
B) Conventional Home Purchase Loans
C) Refinancings
D) Home Improvement Loans
F) Non-occupant Loans on < 5 Family Dwellings (A B C & D)
Number
Average Value
Number
Average Value
Number
Average Value
Number
Average Value
Number
Average Value
LOANS ORIGINATED
6
$237,603
200
$248,110
720
$182,090
41
$34,238
16
$172,964
APPLICATIONS APPROVED, NOT ACCEPTED
0
$0
14
$254,594
93
$176,365
27
$53,155
1
$408,570
APPLICATIONS DENIED
1
$313,010
30
$249,996
138
$217,866
29
$39,522
6
$212,188
APPLICATIONS WITHDRAWN
2
$214,250
23
$270,879
166
$204,818
11
$35,105
5
$98,552
FILES CLOSED FOR INCOMPLETENESS
1
$122,710
8
$319,839
36
$247,771
1
$38,640
0
$0
Aggregated Statistics For Year 2002 (Based on 6 partial tracts)
A) FHA, FSA/RHS & VA Home Purchase Loans
B) Conventional Home Purchase Loans
C) Refinancings
D) Home Improvement Loans
F) Non-occupant Loans on < 5 Family Dwellings (A B C & D)
Number
Average Value
Number
Average Value
Number
Average Value
Number
Average Value
Number
Average Value
LOANS ORIGINATED
10
$159,962
167
$203,374
496
$174,768
67
$48,539
12
$167,062
APPLICATIONS APPROVED, NOT ACCEPTED
1
$164,710
19
$187,388
86
$163,850
19
$54,710
1
$76,880
APPLICATIONS DENIED
2
$190,230
16
$175,209
126
$160,953
32
$75,661
2
$82,565
APPLICATIONS WITHDRAWN
1
$241,480
16
$166,599
122
$157,921
9
$33,942
2
$108,480
FILES CLOSED FOR INCOMPLETENESS
0
$0
4
$204,380
38
$166,130
1
$55,970
1
$190,300
Aggregated Statistics For Year 2001 (Based on 6 partial tracts)
A) FHA, FSA/RHS & VA Home Purchase Loans
B) Conventional Home Purchase Loans
C) Refinancings
D) Home Improvement Loans
F) Non-occupant Loans on < 5 Family Dwellings (A B C & D)
Number
Average Value
Number
Average Value
Number
Average Value
Number
Average Value
Number
Average Value
LOANS ORIGINATED
21
$161,547
155
$193,817
347
$153,182
58
$34,176
7
$110,963
APPLICATIONS APPROVED, NOT ACCEPTED
4
$172,972
23
$216,068
51
$126,515
21
$48,692
0
$0
APPLICATIONS DENIED
3
$164,423
25
$206,984
113
$131,762
27
$29,804
3
$202,163
APPLICATIONS WITHDRAWN
2
$145,370
12
$163,208
95
$142,291
13
$64,008
3
$97,477
FILES CLOSED FOR INCOMPLETENESS
0
$0
1
$138,190
31
$130,891
3
$26,403
0
$0
Aggregated Statistics For Year 2000 (Based on 6 partial tracts)
A) FHA, FSA/RHS & VA Home Purchase Loans
B) Conventional Home Purchase Loans
C) Refinancings
D) Home Improvement Loans
F) Non-occupant Loans on < 5 Family Dwellings (A B C & D)
Number
Average Value
Number
Average Value
Number
Average Value
Number
Average Value
Number
Average Value
LOANS ORIGINATED
26
$143,829
159
$167,221
120
$109,644
63
$28,931
5
$110,784
APPLICATIONS APPROVED, NOT ACCEPTED
0
$0
21
$153,735
19
$114,377
18
$23,912
1
$151,110
APPLICATIONS DENIED
3
$104,337
27
$161,788
64
$108,807
31
$34,456
8
$67,156
APPLICATIONS WITHDRAWN
3
$141,957
14
$143,878
56
$92,179
9
$36,277
2
$63,985
FILES CLOSED FOR INCOMPLETENESS
0
$0
4
$209,608
11
$102,056
2
$40,825
0
$0
Aggregated Statistics For Year 1999 (Based on 2 partial tracts)
A) FHA, FSA/RHS & VA Home Purchase Loans
B) Conventional Home Purchase Loans
C) Refinancings
D) Home Improvement Loans
F) Non-occupant Loans on < 5 Family Dwellings (A B C & D)
2002 - 2018 National Fire Incident Reporting System (NFIRS) incidents
According to the data from the years 2002 - 2018 the average number of fire incidents per year is 6. The highest number of reported fires - 20 took place in 2013, and the least - 0 in 2005. The data has a constant trend.
When looking into fire subcategories, the most incidents belonged to: Structure Fires (63.8%), and Outside Fires (28.6%).
Fire incident types reported to NFIRS in Zip Code 11786


 Nearest zip codes: 11961, 11778, 11792, 11973, 11789, 11953.


 According to the data from the years 2002 - 2018 the average number of fire incidents per year is 6. The highest number of reported fires - 20 took place in 2013, and the least - 0 in 2005. The data has a constant trend.
 When looking into fire subcategories, the most incidents belonged to: Structure Fires (63.8%), and Outside Fires (28.6%).