Estimated zip code population in 2022: 19,830
Zip code population in 2010: 17,141
Zip code population in 2000: 16,566
Houses and condos: 7,598
Renter-occupied apartments: 4,041
% of renters here:
57%State:
34%
March 2022 cost of living index in zip code 06515: 127.4
(high, U.S. average is 100)
Land area: 4.6
sq. mi.
Water area: 0.0
sq. mi.
Population density: 4,350 people per square mile (average).
OSM Map
Google Map
MSN Map
OSM Map
General Map
Google Map
MSN Map
OSM Map
Google Map
MSN Map
OSM Map
Google Map
MSN Map
Please wait while loading the map...
Real estate property taxes paid for housing units in 2022:
This zip code:
2.1% ($6,089)Connecticut:
1.8% ($6,189)
Median real estate property taxes paid for housing units with mortgages in 2022: $5,863 (2.1%)
Median real estate property taxes paid for housing units with no mortgage in 2022: $6,786 (2.2%)
Profiles of local businesses
Business Search - 14 Million verified businesses
Males: 8,928 Females: 10,901
For population 25 years and over in 06515:
High school or higher: 92.8%Bachelor's degree or higher: 51.4%Graduate or professional degree: 30.1%Unemployed: 7.3%Mean travel time to work (commute): 20.9 minutes
For population 15 years and over in 06515:
Never married: 57.9%Now married: 28.2%Separated: 1.4%Widowed: 4.6%Divorced: 7.8%
Zip code 06515 compared to state average:
Black race population percentage significantly above state average. Median age significantly below state average. Renting percentage above state average. Length of stay since moving in significantly above state average. Number of college students above state average. 8,454 42.6% White 6,132 30.9% Black 4,048 20.4% Hispanic or Latino 529 2.7% Asian 456 2.3% Two or more races 199 1.0% Some other race 9 0.05% American Indian
Data:
Median household income ($)
Median household income (% change since 2000)
Household income diversity
Ratio of average income to average house value (%)
Ratio of average income to average rent
Median household income ($) - White
Median household income ($) - Black or African American
Median household income ($) - Asian
Median household income ($) - Hispanic or Latino
Median household income ($) - American Indian and Alaska Native
Median household income ($) - Multirace
Median household income ($) - Other Race
Median household income for houses/condos with a mortgage ($)
Median household income for apartments without a mortgage ($)
Races - White alone (%)
Races - White alone (% change since 2000)
Races - Black alone (%)
Races - Black alone (% change since 2000)
Races - American Indian alone (%)
Races - American Indian alone (% change since 2000)
Races - Asian alone (%)
Races - Asian alone (% change since 2000)
Races - Hispanic (%)
Races - Hispanic (% change since 2000)
Races - Native Hawaiian and Other Pacific Islander alone (%)
Races - Native Hawaiian and Other Pacific Islander alone (% change since 2000)
Races - Two or more races (%)
Races - Two or more races (% change since 2000)
Races - Other race alone (%)
Races - Other race alone (% change since 2000)
Racial diversity
Unemployment (%)
Unemployment (% change since 2000)
Unemployment (%) - White
Unemployment (%) - Black or African American
Unemployment (%) - Asian
Unemployment (%) - Hispanic or Latino
Unemployment (%) - American Indian and Alaska Native
Unemployment (%) - Multirace
Unemployment (%) - Other Race
Population density (people per square mile)
Population - Males (%)
Population - Females (%)
Population - Males (%) - White
Population - Males (%) - Black or African American
Population - Males (%) - Asian
Population - Males (%) - Hispanic or Latino
Population - Males (%) - American Indian and Alaska Native
Population - Males (%) - Multirace
Population - Males (%) - Other Race
Population - Females (%) - White
Population - Females (%) - Black or African American
Population - Females (%) - Asian
Population - Females (%) - Hispanic or Latino
Population - Females (%) - American Indian and Alaska Native
Population - Females (%) - Multirace
Population - Females (%) - Other Race
Coronavirus confirmed cases (Jun 10, 2024)
Deaths caused by coronavirus (Jun 10, 2024)
Coronavirus confirmed cases (per 100k population) (Jun 10, 2024)
Deaths caused by coronavirus (per 100k population) (Jun 10, 2024)
Daily increase in number of cases (Jun 10, 2024)
Weekly increase in number of cases (Jun 10, 2024)
Cases doubled (in days) (Jun 10, 2024)
Hospitalized patients (Apr 18, 2022)
Negative test results (Apr 18, 2022)
Total test results (Apr 18, 2022)
COVID Vaccine doses distributed (per 100k population) (Sep 19, 2023)
COVID Vaccine doses administered (per 100k population) (Sep 19, 2023)
COVID Vaccine doses distributed (Sep 19, 2023)
COVID Vaccine doses administered (Sep 19, 2023)
Likely homosexual households (%)
Likely homosexual households (% change since 2000)
Likely homosexual households - Lesbian couples (%)
Likely homosexual households - Lesbian couples (% change since 2000)
Likely homosexual households - Gay men (%)
Likely homosexual households - Gay men (% change since 2000)
Cost of living index
Median gross rent ($)
Median contract rent ($)
Median monthly housing costs ($)
Median house or condo value ($)
Median house or condo value ($ change since 2000)
Mean house or condo value by units in structure - 1, detached ($)
Mean house or condo value by units in structure - 1, attached ($)
Mean house or condo value by units in structure - 2 ($)
Mean house or condo value by units in structure by units in structure - 3 or 4 ($)
Mean house or condo value by units in structure - 5 or more ($)
Mean house or condo value by units in structure - Boat, RV, van, etc. ($)
Mean house or condo value by units in structure - Mobile home ($)
Median house or condo value ($) - White
Median house or condo value ($) - Black or African American
Median house or condo value ($) - Asian
Median house or condo value ($) - Hispanic or Latino
Median house or condo value ($) - American Indian and Alaska Native
Median house or condo value ($) - Multirace
Median house or condo value ($) - Other Race
Median resident age
Resident age diversity
Median resident age - Males
Median resident age - Females
Median resident age - White
Median resident age - Black or African American
Median resident age - Asian
Median resident age - Hispanic or Latino
Median resident age - American Indian and Alaska Native
Median resident age - Multirace
Median resident age - Other Race
Median resident age - Males - White
Median resident age - Males - Black or African American
Median resident age - Males - Asian
Median resident age - Males - Hispanic or Latino
Median resident age - Males - American Indian and Alaska Native
Median resident age - Males - Multirace
Median resident age - Males - Other Race
Median resident age - Females - White
Median resident age - Females - Black or African American
Median resident age - Females - Asian
Median resident age - Females - Hispanic or Latino
Median resident age - Females - American Indian and Alaska Native
Median resident age - Females - Multirace
Median resident age - Females - Other Race
Commute - mean travel time to work (minutes)
Travel time to work - Less than 5 minutes (%)
Travel time to work - Less than 5 minutes (% change since 2000)
Travel time to work - 5 to 9 minutes (%)
Travel time to work - 5 to 9 minutes (% change since 2000)
Travel time to work - 10 to 19 minutes (%)
Travel time to work - 10 to 19 minutes (% change since 2000)
Travel time to work - 20 to 29 minutes (%)
Travel time to work - 20 to 29 minutes (% change since 2000)
Travel time to work - 30 to 39 minutes (%)
Travel time to work - 30 to 39 minutes (% change since 2000)
Travel time to work - 40 to 59 minutes (%)
Travel time to work - 40 to 59 minutes (% change since 2000)
Travel time to work - 60 to 89 minutes (%)
Travel time to work - 60 to 89 minutes (% change since 2000)
Travel time to work - 90 or more minutes (%)
Travel time to work - 90 or more minutes (% change since 2000)
Marital status - Never married (%)
Marital status - Now married (%)
Marital status - Separated (%)
Marital status - Widowed (%)
Marital status - Divorced (%)
Median family income ($)
Median family income (% change since 2000)
Median non-family income ($)
Median non-family income (% change since 2000)
Median per capita income ($)
Median per capita income (% change since 2000)
Median family income ($) - White
Median family income ($) - Black or African American
Median family income ($) - Asian
Median family income ($) - Hispanic or Latino
Median family income ($) - American Indian and Alaska Native
Median family income ($) - Multirace
Median family income ($) - Other Race
Median year house/condo built
Median year apartment built
Year house built - Built 2005 or later (%)
Year house built - Built 2000 to 2004 (%)
Year house built - Built 1990 to 1999 (%)
Year house built - Built 1980 to 1989 (%)
Year house built - Built 1970 to 1979 (%)
Year house built - Built 1960 to 1969 (%)
Year house built - Built 1950 to 1959 (%)
Year house built - Built 1940 to 1949 (%)
Year house built - Built 1939 or earlier (%)
Average household size
Household density (households per square mile)
Average household size - White
Average household size - Black or African American
Average household size - Asian
Average household size - Hispanic or Latino
Average household size - American Indian and Alaska Native
Average household size - Multirace
Average household size - Other Race
Occupied housing units (%)
Vacant housing units (%)
Owner occupied housing units (%)
Renter occupied housing units (%)
Vacancy status - For rent (%)
Vacancy status - For sale only (%)
Vacancy status - Rented or sold, not occupied (%)
Vacancy status - For seasonal, recreational, or occasional use (%)
Vacancy status - For migrant workers (%)
Vacancy status - Other vacant (%)
Residents with income below the poverty level (%)
Residents with income below 50% of the poverty level (%)
Children below poverty level (%)
Poor families by family type - Married-couple family (%)
Poor families by family type - Male, no wife present (%)
Poor families by family type - Female, no husband present (%)
Poverty status for native-born residents (%)
Poverty status for foreign-born residents (%)
Poverty among high school graduates not in families (%)
Poverty among people who did not graduate high school not in families (%)
Residents with income below the poverty level (%) - White
Residents with income below the poverty level (%) - Black or African American
Residents with income below the poverty level (%) - Asian
Residents with income below the poverty level (%) - Hispanic or Latino
Residents with income below the poverty level (%) - American Indian and Alaska Native
Residents with income below the poverty level (%) - Multirace
Residents with income below the poverty level (%) - Other Race
Air pollution - Air Quality Index (AQI)
Air pollution - CO
Air pollution - NO2
Air pollution - SO2
Air pollution - Ozone
Air pollution - PM10
Air pollution - PM25
Air pollution - Pb
Crime - Murders per 100,000 population
Crime - Rapes per 100,000 population
Crime - Robberies per 100,000 population
Crime - Assaults per 100,000 population
Crime - Burglaries per 100,000 population
Crime - Thefts per 100,000 population
Crime - Auto thefts per 100,000 population
Crime - Arson per 100,000 population
Crime - City-data.com crime index
Crime - Violent crime index
Crime - Property crime index
Crime - Murders per 100,000 population (5 year average)
Crime - Rapes per 100,000 population (5 year average)
Crime - Robberies per 100,000 population (5 year average)
Crime - Assaults per 100,000 population (5 year average)
Crime - Burglaries per 100,000 population (5 year average)
Crime - Thefts per 100,000 population (5 year average)
Crime - Auto thefts per 100,000 population (5 year average)
Crime - Arson per 100,000 population (5 year average)
Crime - City-data.com crime index (5 year average)
Crime - Violent crime index (5 year average)
Crime - Property crime index (5 year average)
1996 Presidential Elections Results (%) - Democratic Party (Clinton)
1996 Presidential Elections Results (%) - Republican Party (Dole)
1996 Presidential Elections Results (%) - Other
2000 Presidential Elections Results (%) - Democratic Party (Gore)
2000 Presidential Elections Results (%) - Republican Party (Bush)
2000 Presidential Elections Results (%) - Other
2004 Presidential Elections Results (%) - Democratic Party (Kerry)
2004 Presidential Elections Results (%) - Republican Party (Bush)
2004 Presidential Elections Results (%) - Other
2008 Presidential Elections Results (%) - Democratic Party (Obama)
2008 Presidential Elections Results (%) - Republican Party (McCain)
2008 Presidential Elections Results (%) - Other
2012 Presidential Elections Results (%) - Democratic Party (Obama)
2012 Presidential Elections Results (%) - Republican Party (Romney)
2012 Presidential Elections Results (%) - Other
2016 Presidential Elections Results (%) - Democratic Party (Clinton)
2016 Presidential Elections Results (%) - Republican Party (Trump)
2016 Presidential Elections Results (%) - Other
2020 Presidential Elections Results (%) - Democratic Party (Biden)
2020 Presidential Elections Results (%) - Republican Party (Trump)
2020 Presidential Elections Results (%) - Other
Ancestries Reported - Arab (%)
Ancestries Reported - Czech (%)
Ancestries Reported - Danish (%)
Ancestries Reported - Dutch (%)
Ancestries Reported - English (%)
Ancestries Reported - French (%)
Ancestries Reported - French Canadian (%)
Ancestries Reported - German (%)
Ancestries Reported - Greek (%)
Ancestries Reported - Hungarian (%)
Ancestries Reported - Irish (%)
Ancestries Reported - Italian (%)
Ancestries Reported - Lithuanian (%)
Ancestries Reported - Norwegian (%)
Ancestries Reported - Polish (%)
Ancestries Reported - Portuguese (%)
Ancestries Reported - Russian (%)
Ancestries Reported - Scotch-Irish (%)
Ancestries Reported - Scottish (%)
Ancestries Reported - Slovak (%)
Ancestries Reported - Subsaharan African (%)
Ancestries Reported - Swedish (%)
Ancestries Reported - Swiss (%)
Ancestries Reported - Ukrainian (%)
Ancestries Reported - United States (%)
Ancestries Reported - Welsh (%)
Ancestries Reported - West Indian (%)
Ancestries Reported - Other (%)
Educational Attainment - No schooling completed (%)
Educational Attainment - Less than high school (%)
Educational Attainment - High school or equivalent (%)
Educational Attainment - Less than 1 year of college (%)
Educational Attainment - 1 or more years of college (%)
Educational Attainment - Associate degree (%)
Educational Attainment - Bachelor's degree (%)
Educational Attainment - Master's degree (%)
Educational Attainment - Professional school degree (%)
Educational Attainment - Doctorate degree (%)
School Enrollment - Nursery, preschool (%)
School Enrollment - Kindergarten (%)
School Enrollment - Grade 1 to 4 (%)
School Enrollment - Grade 5 to 8 (%)
School Enrollment - Grade 9 to 12 (%)
School Enrollment - College undergrad (%)
School Enrollment - Graduate or professional (%)
School Enrollment - Not enrolled in school (%)
School enrollment - Public schools (%)
School enrollment - Private schools (%)
School enrollment - Not enrolled (%)
Median number of rooms in houses and condos
Median number of rooms in apartments
Housing units lacking complete plumbing facilities (%)
Housing units lacking complete kitchen facilities (%)
Density of houses
Urban houses (%)
Rural houses (%)
Households with people 60 years and over (%)
Households with people 65 years and over (%)
Households with people 75 years and over (%)
Households with one or more nonrelatives (%)
Households with no nonrelatives (%)
Population in households (%)
Family households (%)
Nonfamily households (%)
Population in families (%)
Family households with own children (%)
Median number of bedrooms in owner occupied houses
Mean number of bedrooms in owner occupied houses
Median number of bedrooms in renter occupied houses
Mean number of bedrooms in renter occupied houses
Median number of vehichles in owner occupied houses
Mean number of vehichles in owner occupied houses
Median number of vehichles in renter occupied houses
Mean number of vehichles in renter occupied houses
Mortgage status - with mortgage (%)
Mortgage status - with second mortgage (%)
Mortgage status - with home equity loan (%)
Mortgage status - with both second mortgage and home equity loan (%)
Mortgage status - without a mortgage (%)
Average family size
Average family size - White
Average family size - Black or African American
Average family size - Asian
Average family size - Hispanic or Latino
Average family size - American Indian and Alaska Native
Average family size - Multirace
Average family size - Other Race
Geographical mobility - Same house 1 year ago (%)
Geographical mobility - Moved within same county (%)
Geographical mobility - Moved from different county within same state (%)
Geographical mobility - Moved from different state (%)
Geographical mobility - Moved from abroad (%)
Place of birth - Born in state of residence (%)
Place of birth - Born in other state (%)
Place of birth - Native, outside of US (%)
Place of birth - Foreign born (%)
Housing units in structures - 1, detached (%)
Housing units in structures - 1, attached (%)
Housing units in structures - 2 (%)
Housing units in structures - 3 or 4 (%)
Housing units in structures - 5 to 9 (%)
Housing units in structures - 10 to 19 (%)
Housing units in structures - 20 to 49 (%)
Housing units in structures - 50 or more (%)
Housing units in structures - Mobile home (%)
Housing units in structures - Boat, RV, van, etc. (%)
House/condo owner moved in on average (years ago)
Renter moved in on average (years ago)
Year householder moved into unit - Moved in 1999 to March 2000 (%)
Year householder moved into unit - Moved in 1995 to 1998 (%)
Year householder moved into unit - Moved in 1990 to 1994 (%)
Year householder moved into unit - Moved in 1980 to 1989 (%)
Year householder moved into unit - Moved in 1970 to 1979 (%)
Year householder moved into unit - Moved in 1969 or earlier (%)
Means of transportation to work - Drove car alone (%)
Means of transportation to work - Carpooled (%)
Means of transportation to work - Public transportation (%)
Means of transportation to work - Bus or trolley bus (%)
Means of transportation to work - Streetcar or trolley car (%)
Means of transportation to work - Subway or elevated (%)
Means of transportation to work - Railroad (%)
Means of transportation to work - Ferryboat (%)
Means of transportation to work - Taxicab (%)
Means of transportation to work - Motorcycle (%)
Means of transportation to work - Bicycle (%)
Means of transportation to work - Walked (%)
Means of transportation to work - Other means (%)
Working at home (%)
Industry diversity
Most Common Industries - Agriculture, forestry, fishing and hunting, and mining (%)
Most Common Industries - Agriculture, forestry, fishing and hunting (%)
Most Common Industries - Mining, quarrying, and oil and gas extraction (%)
Most Common Industries - Construction (%)
Most Common Industries - Manufacturing (%)
Most Common Industries - Wholesale trade (%)
Most Common Industries - Retail trade (%)
Most Common Industries - Transportation and warehousing, and utilities (%)
Most Common Industries - Transportation and warehousing (%)
Most Common Industries - Utilities (%)
Most Common Industries - Information (%)
Most Common Industries - Finance and insurance, and real estate and rental and leasing (%)
Most Common Industries - Finance and insurance (%)
Most Common Industries - Real estate and rental and leasing (%)
Most Common Industries - Professional, scientific, and management, and administrative and waste management services (%)
Most Common Industries - Professional, scientific, and technical services (%)
Most Common Industries - Management of companies and enterprises (%)
Most Common Industries - Administrative and support and waste management services (%)
Most Common Industries - Educational services, and health care and social assistance (%)
Most Common Industries - Educational services (%)
Most Common Industries - Health care and social assistance (%)
Most Common Industries - Arts, entertainment, and recreation, and accommodation and food services (%)
Most Common Industries - Arts, entertainment, and recreation (%)
Most Common Industries - Accommodation and food services (%)
Most Common Industries - Other services, except public administration (%)
Most Common Industries - Public administration (%)
Occupation diversity
Most Common Occupations - Management, business, science, and arts occupations (%)
Most Common Occupations - Management, business, and financial occupations (%)
Most Common Occupations - Management occupations (%)
Most Common Occupations - Business and financial operations occupations (%)
Most Common Occupations - Computer, engineering, and science occupations (%)
Most Common Occupations - Computer and mathematical occupations (%)
Most Common Occupations - Architecture and engineering occupations (%)
Most Common Occupations - Life, physical, and social science occupations (%)
Most Common Occupations - Education, legal, community service, arts, and media occupations (%)
Most Common Occupations - Community and social service occupations (%)
Most Common Occupations - Legal occupations (%)
Most Common Occupations - Education, training, and library occupations (%)
Most Common Occupations - Arts, design, entertainment, sports, and media occupations (%)
Most Common Occupations - Healthcare practitioners and technical occupations (%)
Most Common Occupations - Health diagnosing and treating practitioners and other technical occupations (%)
Most Common Occupations - Health technologists and technicians (%)
Most Common Occupations - Service occupations (%)
Most Common Occupations - Healthcare support occupations (%)
Most Common Occupations - Protective service occupations (%)
Most Common Occupations - Fire fighting and prevention, and other protective service workers including supervisors (%)
Most Common Occupations - Law enforcement workers including supervisors (%)
Most Common Occupations - Food preparation and serving related occupations (%)
Most Common Occupations - Building and grounds cleaning and maintenance occupations (%)
Most Common Occupations - Personal care and service occupations (%)
Most Common Occupations - Sales and office occupations (%)
Most Common Occupations - Sales and related occupations (%)
Most Common Occupations - Office and administrative support occupations (%)
Most Common Occupations - Natural resources, construction, and maintenance occupations (%)
Most Common Occupations - Farming, fishing, and forestry occupations (%)
Most Common Occupations - Construction and extraction occupations (%)
Most Common Occupations - Installation, maintenance, and repair occupations (%)
Most Common Occupations - Production, transportation, and material moving occupations (%)
Most Common Occupations - Production occupations (%)
Most Common Occupations - Transportation occupations (%)
Most Common Occupations - Material moving occupations (%)
People in Group quarters - Institutionalized population (%)
People in Group quarters - Correctional institutions (%)
People in Group quarters - Federal prisons and detention centers (%)
People in Group quarters - Halfway houses (%)
People in Group quarters - Local jails and other confinement facilities (including police lockups) (%)
People in Group quarters - Military disciplinary barracks (%)
People in Group quarters - State prisons (%)
People in Group quarters - Other types of correctional institutions (%)
People in Group quarters - Nursing homes (%)
People in Group quarters - Hospitals/wards, hospices, and schools for the handicapped (%)
People in Group quarters - Hospitals/wards and hospices for chronically ill (%)
People in Group quarters - Hospices or homes for chronically ill (%)
People in Group quarters - Military hospitals or wards for chronically ill (%)
People in Group quarters - Other hospitals or wards for chronically ill (%)
People in Group quarters - Hospitals or wards for drug/alcohol abuse (%)
People in Group quarters - Mental (Psychiatric) hospitals or wards (%)
People in Group quarters - Schools, hospitals, or wards for the mentally retarded (%)
People in Group quarters - Schools, hospitals, or wards for the physically handicapped (%)
People in Group quarters - Institutions for the deaf (%)
People in Group quarters - Institutions for the blind (%)
People in Group quarters - Orthopedic wards and institutions for the physically handicapped (%)
People in Group quarters - Wards in general hospitals for patients who have no usual home elsewhere (%)
People in Group quarters - Wards in military hospitals for patients who have no usual home elsewhere (%)
People in Group quarters - Juvenile institutions (%)
People in Group quarters - Long-term care (%)
People in Group quarters - Homes for abused, dependent, and neglected children (%)
People in Group quarters - Residential treatment centers for emotionally disturbed children (%)
People in Group quarters - Training schools for juvenile delinquents (%)
People in Group quarters - Short-term care, detention or diagnostic centers for delinquent children (%)
People in Group quarters - Type of juvenile institution unknown (%)
People in Group quarters - Noninstitutionalized population (%)
People in Group quarters - College dormitories (includes college quarters off campus) (%)
People in Group quarters - Military quarters (%)
People in Group quarters - On base (%)
People in Group quarters - Barracks, unaccompanied personnel housing (UPH), (Enlisted/Officer), ;and similar group living quarters for military personnel (%)
People in Group quarters - Transient quarters for temporary residents (%)
People in Group quarters - Military ships (%)
People in Group quarters - Group homes (%)
People in Group quarters - Homes or halfway houses for drug/alcohol abuse (%)
People in Group quarters - Homes for the mentally ill (%)
People in Group quarters - Homes for the mentally retarded (%)
People in Group quarters - Homes for the physically handicapped (%)
People in Group quarters - Other group homes (%)
People in Group quarters - Religious group quarters (%)
People in Group quarters - Dormitories (%)
People in Group quarters - Agriculture workers' dormitories on farms (%)
People in Group quarters - Job Corps and vocational training facilities (%)
People in Group quarters - Other workers' dormitories (%)
People in Group quarters - Crews of maritime vessels (%)
People in Group quarters - Other nonhousehold living situations (%)
People in Group quarters - Other noninstitutional group quarters (%)
Residents speaking English at home (%)
Residents speaking English at home - Born in the United States (%)
Residents speaking English at home - Native, born elsewhere (%)
Residents speaking English at home - Foreign born (%)
Residents speaking Spanish at home (%)
Residents speaking Spanish at home - Born in the United States (%)
Residents speaking Spanish at home - Native, born elsewhere (%)
Residents speaking Spanish at home - Foreign born (%)
Residents speaking other language at home (%)
Residents speaking other language at home - Born in the United States (%)
Residents speaking other language at home - Native, born elsewhere (%)
Residents speaking other language at home - Foreign born (%)
Class of Workers - Employee of private company (%)
Class of Workers - Self-employed in own incorporated business (%)
Class of Workers - Private not-for-profit wage and salary workers (%)
Class of Workers - Local government workers (%)
Class of Workers - State government workers (%)
Class of Workers - Federal government workers (%)
Class of Workers - Self-employed workers in own not incorporated business and Unpaid family workers (%)
House heating fuel used in houses and condos - Utility gas (%)
House heating fuel used in houses and condos - Bottled, tank, or LP gas (%)
House heating fuel used in houses and condos - Electricity (%)
House heating fuel used in houses and condos - Fuel oil, kerosene, etc. (%)
House heating fuel used in houses and condos - Coal or coke (%)
House heating fuel used in houses and condos - Wood (%)
House heating fuel used in houses and condos - Solar energy (%)
House heating fuel used in houses and condos - Other fuel (%)
House heating fuel used in houses and condos - No fuel used (%)
House heating fuel used in apartments - Utility gas (%)
House heating fuel used in apartments - Bottled, tank, or LP gas (%)
House heating fuel used in apartments - Electricity (%)
House heating fuel used in apartments - Fuel oil, kerosene, etc. (%)
House heating fuel used in apartments - Coal or coke (%)
House heating fuel used in apartments - Wood (%)
House heating fuel used in apartments - Solar energy (%)
House heating fuel used in apartments - Other fuel (%)
House heating fuel used in apartments - No fuel used (%)
Armed forces status - In Armed Forces (%)
Armed forces status - Civilian (%)
Armed forces status - Civilian - Veteran (%)
Armed forces status - Civilian - Nonveteran (%)
Fatal accidents locations in years 2005-2021
Fatal accidents locations in 2005
Fatal accidents locations in 2006
Fatal accidents locations in 2007
Fatal accidents locations in 2008
Fatal accidents locations in 2009
Fatal accidents locations in 2010
Fatal accidents locations in 2011
Fatal accidents locations in 2012
Fatal accidents locations in 2013
Fatal accidents locations in 2014
Fatal accidents locations in 2015
Fatal accidents locations in 2016
Fatal accidents locations in 2017
Fatal accidents locations in 2018
Fatal accidents locations in 2019
Fatal accidents locations in 2020
Fatal accidents locations in 2021
Alcohol use - People drinking some alcohol every month (%)
Alcohol use - People not drinking at all (%)
Alcohol use - Average days/month drinking alcohol
Alcohol use - Average drinks/week
Alcohol use - Average days/year people drink much
Audiometry - Average condition of hearing (%)
Audiometry - People that can hear a whisper from across a quiet room (%)
Audiometry - People that can hear normal voice from across a quiet room (%)
Audiometry - Ears ringing, roaring, buzzing (%)
Audiometry - Had a job exposure to loud noise (%)
Audiometry - Had off-work exposure to loud noise (%)
Blood Pressure & Cholesterol - Has high blood pressure (%)
Blood Pressure & Cholesterol - Checking blood pressure at home (%)
Blood Pressure & Cholesterol - Frequently checking blood cholesterol (%)
Blood Pressure & Cholesterol - Has high cholesterol level (%)
Consumer Behavior - Money monthly spent on food at supermarket/grocery store
Consumer Behavior - Money monthly spent on food at other stores
Consumer Behavior - Money monthly spent on eating out
Consumer Behavior - Money monthly spent on carryout/delivered foods
Consumer Behavior - Income spent on food at supermarket/grocery store (%)
Consumer Behavior - Income spent on food at other stores (%)
Consumer Behavior - Income spent on eating out (%)
Consumer Behavior - Income spent on carryout/delivered foods (%)
Current Health Status - General health condition (%)
Current Health Status - Blood donors (%)
Current Health Status - Has blood ever tested for HIV virus (%)
Current Health Status - Left-handed people (%)
Dermatology - People using sunscreen (%)
Diabetes - Diabetics (%)
Diabetes - Had a blood test for high blood sugar (%)
Diabetes - People taking insulin (%)
Diet Behavior & Nutrition - Diet health (%)
Diet Behavior & Nutrition - Milk product consumption (# of products/month)
Diet Behavior & Nutrition - Meals not home prepared (#/week)
Diet Behavior & Nutrition - Meals from fast food or pizza place (#/week)
Diet Behavior & Nutrition - Ready-to-eat foods (#/month)
Diet Behavior & Nutrition - Frozen meals/pizza (#/month)
Drug Use - People that ever used marijuana or hashish (%)
Drug Use - Ever used hard drugs (%)
Drug Use - Ever used any form of cocaine (%)
Drug Use - Ever used heroin (%)
Drug Use - Ever used methamphetamine (%)
Health Insurance - People covered by health insurance (%)
Kidney Conditions-Urology - Avg. # of times urinating at night
Medical Conditions - People with asthma (%)
Medical Conditions - People with anemia (%)
Medical Conditions - People with psoriasis (%)
Medical Conditions - People with overweight (%)
Medical Conditions - Elderly people having difficulties in thinking or remembering (%)
Medical Conditions - People who ever received blood transfusion (%)
Medical Conditions - People having trouble seeing even with glass/contacts (%)
Medical Conditions - People with arthritis (%)
Medical Conditions - People with gout (%)
Medical Conditions - People with congestive heart failure (%)
Medical Conditions - People with coronary heart disease (%)
Medical Conditions - People with angina pectoris (%)
Medical Conditions - People who ever had heart attack (%)
Medical Conditions - People who ever had stroke (%)
Medical Conditions - People with emphysema (%)
Medical Conditions - People with thyroid problem (%)
Medical Conditions - People with chronic bronchitis (%)
Medical Conditions - People with any liver condition (%)
Medical Conditions - People who ever had cancer or malignancy (%)
Mental Health - People who have little interest in doing things (%)
Mental Health - People feeling down, depressed, or hopeless (%)
Mental Health - People who have trouble sleeping or sleeping too much (%)
Mental Health - People feeling tired or having little energy (%)
Mental Health - People with poor appetite or overeating (%)
Mental Health - People feeling bad about themself (%)
Mental Health - People who have trouble concentrating on things (%)
Mental Health - People moving or speaking slowly or too fast (%)
Mental Health - People having thoughts they would be better off dead (%)
Oral Health - Average years since last visit a dentist
Oral Health - People embarrassed because of mouth (%)
Oral Health - People with gum disease (%)
Oral Health - General health of teeth and gums (%)
Oral Health - Average days a week using dental floss/device
Oral Health - Average days a week using mouthwash for dental problem
Oral Health - Average number of teeth
Pesticide Use - Households using pesticides to control insects (%)
Pesticide Use - Households using pesticides to kill weeds (%)
Physical Activity - People doing vigorous-intensity work activities (%)
Physical Activity - People doing moderate-intensity work activities (%)
Physical Activity - People walking or bicycling (%)
Physical Activity - People doing vigorous-intensity recreational activities (%)
Physical Activity - People doing moderate-intensity recreational activities (%)
Physical Activity - Average hours a day doing sedentary activities
Physical Activity - Average hours a day watching TV or videos
Physical Activity - Average hours a day using computer
Physical Functioning - People having limitations keeping them from working (%)
Physical Functioning - People limited in amount of work they can do (%)
Physical Functioning - People that need special equipment to walk (%)
Physical Functioning - People experiencing confusion/memory problems (%)
Physical Functioning - People requiring special healthcare equipment (%)
Prescription Medications - Average number of prescription medicines taking
Preventive Aspirin Use - Adults 40+ taking low-dose aspirin (%)
Reproductive Health - Vaginal deliveries (%)
Reproductive Health - Cesarean deliveries (%)
Reproductive Health - Deliveries resulted in a live birth (%)
Reproductive Health - Pregnancies resulted in a delivery (%)
Reproductive Health - Women breastfeeding newborns (%)
Reproductive Health - Women that had a hysterectomy (%)
Reproductive Health - Women that had both ovaries removed (%)
Reproductive Health - Women that have ever taken birth control pills (%)
Reproductive Health - Women taking birth control pills (%)
Reproductive Health - Women that have ever used Depo-Provera or injectables (%)
Reproductive Health - Women that have ever used female hormones (%)
Sexual Behavior - People 18+ that ever had sex (vaginal, anal, or oral) (%)
Sexual Behavior - Males 18+ that ever had vaginal sex with a woman (%)
Sexual Behavior - Males 18+ that ever performed oral sex on a woman (%)
Sexual Behavior - Males 18+ that ever had anal sex with a woman (%)
Sexual Behavior - Males 18+ that ever had any sex with a man (%)
Sexual Behavior - Females 18+ that ever had vaginal sex with a man (%)
Sexual Behavior - Females 18+ that ever performed oral sex on a man (%)
Sexual Behavior - Females 18+ that ever had anal sex with a man (%)
Sexual Behavior - Females 18+ that ever had any kind of sex with a woman (%)
Sexual Behavior - Average age people first had sex
Sexual Behavior - Average number of female sex partners in lifetime (males 18+)
Sexual Behavior - Average number of female vaginal sex partners in lifetime (males 18+)
Sexual Behavior - Average age people first performed oral sex on a woman (18+)
Sexual Behavior - Average number of woman performed oral sex on in lifetime (18+)
Sexual Behavior - Average number of male sex partners in lifetime (males 18+)
Sexual Behavior - Average number of male anal sex partners in lifetime (males 18+)
Sexual Behavior - Average age people first performed oral sex on a man (18+)
Sexual Behavior - Average number of male oral sex partners in lifetime (18+)
Sexual Behavior - People using protection when performing oral sex (%)
Sexual Behavior - Average number of times people have vaginal or anal sex a year
Sexual Behavior - People having sex without condom (%)
Sexual Behavior - Average number of male sex partners in lifetime (females 18+)
Sexual Behavior - Average number of male vaginal sex partners in lifetime (females 18+)
Sexual Behavior - Average number of female sex partners in lifetime (females 18+)
Sexual Behavior - Circumcised males 18+ (%)
Sleep Disorders - Average hours sleeping at night
Sleep Disorders - People that has trouble sleeping (%)
Smoking-Cigarette Use - People smoking cigarettes (%)
Taste & Smell - People 40+ having problems with smell (%)
Taste & Smell - People 40+ having problems with taste (%)
Taste & Smell - People 40+ that ever had wisdom teeth removed (%)
Taste & Smell - People 40+ that ever had tonsils teeth removed (%)
Taste & Smell - People 40+ that ever had a loss of consciousness because of a head injury (%)
Taste & Smell - People 40+ that ever had a broken nose or other serious injury to face or skull (%)
Taste & Smell - People 40+ that ever had two or more sinus infections (%)
Weight - Average height (inches)
Weight - Average weight (pounds)
Weight - Average BMI
Weight - People that are obese (%)
Weight - People that ever were obese (%)
Weight - People trying to lose weight (%)
100%
urban population.
Estimated median house/condo value in 2022: $286,705
06515:
$286,705Connecticut:
$347,200
Median resident age: This zip code:
29.8 yearsConnecticut median age:
40.9 years
Average household size: This zip code:
2.5 peopleConnecticut:
2.5 people
Averages for the 2020 tax year for zip code 06515, filed in 2021:
Average Adjusted Gross Income (AGI) in 2020: $63,089 (Individual Income Tax Returns) Here:
$63,089State:
$105,931
Salary/wage: $54,808 (reported on 86.0% of returns )Here:
$54,808State:
$83,540
(% of AGI for various income ranges: 1134.1% for AGIs below $25k , 3664.7% for AGIs $25k-50k , 6826.3% for AGIs $50k-75k , 10317.3% for AGIs $75k-100k , 18553.5% for AGIs $100k-200k , 79796.4% for AGIs over 200k ) Taxable interest for individuals: $1,139 (reported on 21.3% of returns )This zip code:
$1,139Connecticut:
$3,402
(% of AGI for various income ranges: 4.9% for AGIs below $25k , 7.9% for AGIs $25k-50k , 23.5% for AGIs $50k-75k , 38.9% for AGIs $75k-100k , 96.0% for AGIs $100k-200k , 733.6% for AGIs over 200k ) Ordinary dividends: $7,974 (reported on 15.3% of returns )(% of AGI for various income ranges: 11.7% for AGIs below $25k , 17.1% for AGIs $25k-50k , 66.9% for AGIs $50k-75k , 108.4% for AGIs $75k-100k , 448.3% for AGIs $100k-200k , 5172.7% for AGIs over 200k ) Net capital gain/loss in AGI: +$14,264 (reported on 13.6% of returns )Here:
+$14,264State:
+$44,158
(% of AGI for various income ranges: 5.3% for AGIs below $25k , 20.2% for AGIs $25k-50k , 58.2% for AGIs $50k-75k , 60.2% for AGIs $75k-100k , 439.4% for AGIs $100k-200k , 10612.7% for AGIs over 200k ) Profit/loss from business: +$12,290 (reported on 16.0% of returns )Here:
+$12,290State:
+$22,988
(% of AGI for various income ranges: 73.4% for AGIs below $25k , 42.1% for AGIs $25k-50k , 203.3% for AGIs $50k-75k , 292.7% for AGIs $75k-100k , 776.9% for AGIs $100k-200k , 5602.7% for AGIs over 200k ) Taxable individual retirement arrangement distribution: $19,904 (reported on 6.5% of returns )06515:
$19,904Connecticut:
$22,031
(% of AGI for various income ranges: 28.4% for AGIs below $25k , 31.6% for AGIs $25k-50k , 123.2% for AGIs $50k-75k , 216.2% for AGIs $75k-100k , 607.9% for AGIs $100k-200k , 3573.6% for AGIs over 200k ) Self-employed (Keogh) retirement plans: $20,486 (reported on 0.9% of returns )06515:
$20,486Connecticut:
$29,016
(% of AGI for various income ranges: 88.3% for AGIs $100k-200k , 918.2% for AGIs over 200k ) Total itemized deductions: $25,348 (reported on 9.5% of returns )Here:
$25,348State:
$37,613
(% of AGI for various income ranges: 34.7% for AGIs below $25k , 62.5% for AGIs $25k-50k , 345.4% for AGIs $50k-75k , 728.7% for AGIs $75k-100k , 1187.1% for AGIs $100k-200k , 4459.1% for AGIs over 200k ) Charity contributions: $8,280 (reported on 7.9% of returns )(% of AGI for various income ranges: 3.8% for AGIs below $25k , 11.1% for AGIs $25k-50k , 63.1% for AGIs $50k-75k , 181.6% for AGIs $75k-100k , 330.0% for AGIs $100k-200k , 1694.5% for AGIs over 200k ) Taxes paid: $8,646 (reported on 9.4% of returns )(% of AGI for various income ranges: 10.4% for AGIs below $25k , 21.1% for AGIs $25k-50k , 128.7% for AGIs $50k-75k , 293.6% for AGIs $75k-100k , 407.9% for AGIs $100k-200k , 1192.7% for AGIs over 200k ) Earned income credit: $2,215 (reported on 20.4% of returns )(% of AGI for various income ranges: 111.4% for AGIs below $25k , 72.6% for AGIs $25k-50k ) Percentage of individuals using paid preparers for their 2020 taxes: 93.5%(% for various income ranges: 93.2% for AGIs below $25k , 93.9% for AGIs $25k-50k , 93.2% for AGIs $50k-75k , 92.5% for AGIs $75k-100k , 94.3% for AGIs $100k-200k , 94.6% for AGIs over 200k )
Averages for the 2012 tax year for zip code 06515, filed in 2013:
Average Adjusted Gross Income (AGI) in 2012: $57,294 (Individual Income Tax Returns) Here:
$57,294State:
$93,290
Salary/wage: $50,138 (reported on 87.8% of returns )Here:
$50,138State:
$73,117
(% of AGI for various income ranges: 79.3% for AGIs below $25k , 85.1% for AGIs $25k-50k , 85.4% for AGIs $50k-75k , 80.9% for AGIs $75k-100k , 75.6% for AGIs $100k-200k , 63.2% for AGIs over 200k ) Taxable interest for individuals: $1,036 (reported on 34.0% of returns )This zip code:
$1,036Connecticut:
$2,530
(% of AGI for various income ranges: 0.6% for AGIs below $25k , 0.4% for AGIs $25k-50k , 0.3% for AGIs $50k-75k , 0.7% for AGIs $75k-100k , 0.7% for AGIs $100k-200k , 0.9% for AGIs over 200k ) Ordinary dividends: $6,398 (reported on 17.4% of returns )(% of AGI for various income ranges: 1.4% for AGIs below $25k , 0.7% for AGIs $25k-50k , 0.9% for AGIs $50k-75k , 1.1% for AGIs $75k-100k , 2.0% for AGIs $100k-200k , 4.2% for AGIs over 200k ) Net capital gain/loss in AGI: +$9,617 (reported on 12.4% of returns )Here:
+$9,617State:
+$34,090
(% of AGI for various income ranges: 0.5% for AGIs $75k-100k , 1.5% for AGIs $100k-200k , 7.5% for AGIs over 200k ) Profit/loss from business: +$14,338 (reported on 15.4% of returns )Here:
+$14,338State:
+$22,741
(% of AGI for various income ranges: 6.6% for AGIs below $25k , 3.1% for AGIs $25k-50k , 1.0% for AGIs $50k-75k , 1.4% for AGIs $75k-100k , 5.1% for AGIs $100k-200k , 5.4% for AGIs over 200k ) Taxable individual retirement arrangement distribution: $16,982 (reported on 7.9% of returns )06515:
$16,982Connecticut:
$19,976
(% of AGI for various income ranges: 1.3% for AGIs below $25k , 1.5% for AGIs $25k-50k , 1.6% for AGIs $50k-75k , 2.5% for AGIs $75k-100k , 3.2% for AGIs $100k-200k , 2.8% for AGIs over 200k ) Self-employment retirement plans: $21,038 (reported on 1.2% of returns )06515:
$21,038Connecticut:
$24,004
Total itemized deductions: $24,830 (22% of AGI, reported on 34.5% of returns )Here:
$24,830State:
$33,239
Here:
22.4% of AGIState:
18.9% of AGI
(% of AGI for various income ranges: 8.4% for AGIs below $25k , 10.1% for AGIs $25k-50k , 15.7% for AGIs $50k-75k , 17.1% for AGIs $75k-100k , 18.5% for AGIs $100k-200k , 15.0% for AGIs over 200k ) Charity contributions: $4,123 (reported on 29.2% of returns )(% of AGI for various income ranges: 0.7% for AGIs below $25k , 1.1% for AGIs $25k-50k , 2.0% for AGIs $50k-75k , 2.1% for AGIs $75k-100k , 2.6% for AGIs $100k-200k , 2.7% for AGIs over 200k ) Taxes paid: $11,931 (reported on 34.0% of returns )06515:
$11,931State:
$17,397
(% of AGI for various income ranges: 2.4% for AGIs below $25k , 3.2% for AGIs $25k-50k , 6.3% for AGIs $50k-75k , 8.0% for AGIs $75k-100k , 9.3% for AGIs $100k-200k , 9.0% for AGIs over 200k ) Earned income credit: $2,155 (reported on 21.3% of returns )(% of AGI for various income ranges: 8.2% for AGIs below $25k , 1.0% for AGIs $25k-50k ) Percentage of individuals using paid preparers for their 2012 taxes: 50.9%(% for various income ranges: 45.4% for AGIs below $25k , 47.2% for AGIs $25k-50k , 51.0% for AGIs $50k-75k , 62.1% for AGIs $75k-100k , 60.8% for AGIs $100k-200k , 80.0% for AGIs over 200k )
Averages for the 2004 tax year for zip code 06515, filed in 2005:
Average Adjusted Gross Income (AGI) in 2004: $48,113 (Individual Income Tax Returns) Here:
$48,113State:
$73,265
Salary/wage: $43,634 (reported on 86.9% of returns )Here:
$43,634State:
$62,030
(% of AGI for various income ranges: 128.1% for AGIs below $10k , 82.2% for AGIs $10k-25k , 87.9% for AGIs $25k-50k , 85.3% for AGIs $50k-75k , 82.6% for AGIs $75k-100k , 68.5% for AGIs over 100k ) Taxable interest for individuals: $1,463 (reported on 45.3% of returns )This zip code:
$1,463Connecticut:
$2,287
(% of AGI for various income ranges: 5.1% for AGIs below $10k , 1.5% for AGIs $10k-25k , 0.9% for AGIs $25k-50k , 0.9% for AGIs $50k-75k , 1.3% for AGIs $75k-100k , 1.7% for AGIs over 100k ) Taxable dividends: $3,458 (reported on 24.1% of returns )(% of AGI for various income ranges: 6.4% for AGIs below $10k , 1.6% for AGIs $10k-25k , 0.9% for AGIs $25k-50k , 0.9% for AGIs $50k-75k , 1.3% for AGIs $75k-100k , 2.5% for AGIs over 100k ) Net capital gain/loss: +$8,075 (reported on 18.3% of returns )Here:
+$8,075State:
+$23,694
(% of AGI for various income ranges: -4.1% for AGIs below $10k , 0.2% for AGIs $10k-25k , 0.5% for AGIs $25k-50k , 1.0% for AGIs $50k-75k , 1.7% for AGIs $75k-100k , 6.3% for AGIs over 100k ) Profit/loss from business: +$16,725 (reported on 13.5% of returns )Here:
+$16,725State:
+$20,783
(% of AGI for various income ranges: 1.5% for AGIs below $10k , 4.4% for AGIs $10k-25k , 2.2% for AGIs $25k-50k , 2.6% for AGIs $50k-75k , 3.1% for AGIs $75k-100k , 7.4% for AGIs over 100k ) IRA payment deduction: $2,994 (reported on 2.4% of returns )06515:
$2,994Connecticut:
$3,216
(% of AGI for various income ranges: 0.2% for AGIs $10k-25k , 0.2% for AGIs $25k-50k , 0.2% for AGIs $50k-75k , 0.1% for AGIs $75k-100k , 0.1% for AGIs over 100k ) Self-employed pension: $16,097 (reported on 1.5% of returns )Here:
$16,097Connecticut:
$17,335
Total itemized deductions: $20,094 (22% of AGI, reported on 35.3% of returns )Here:
$20,094State:
$24,919
Here:
21.6% of AGIState:
18.6% of AGI
(% of AGI for various income ranges: 16.9% for AGIs below $10k , 8.6% for AGIs $10k-25k , 11.2% for AGIs $25k-50k , 16.2% for AGIs $50k-75k , 18.2% for AGIs $75k-100k , 16.0% for AGIs over 100k ) Charity contributions deductions: $4,004 (4% of AGI, reported on 32.0% of returns )Here:
4.1% of AGIState:
2.7% of AGI
(% of AGI for various income ranges: 0.9% for AGIs below $10k , 0.9% for AGIs $10k-25k , 1.8% for AGIs $25k-50k , 2.5% for AGIs $50k-75k , 2.4% for AGIs $75k-100k , 3.6% for AGIs over 100k ) Total tax: $8,578 (reported on 73.0% of returns )06515:
$8,578State:
$15,148
(% of AGI for various income ranges: 3.4% for AGIs below $10k , 3.9% for AGIs $10k-25k , 7.8% for AGIs $25k-50k , 10.6% for AGIs $50k-75k , 11.5% for AGIs $75k-100k , 19.0% for AGIs over 100k ) Earned income credit: $1,657 (reported on 18.0% of returns )Percentage of individuals using paid preparers for their 2004 taxes: 62.4%(% for various income ranges: 58.5% for AGIs below $10k , 66.3% for AGIs $10k-25k , 59.5% for AGIs $25k-50k , 62.6% for AGIs $50k-75k , 62.5% for AGIs $75k-100k , 69.4% for AGIs over 100k )
Estimated median household income in 2022: This zip code:
$71,714Connecticut:
$88,429
Nearest zip codes: 06511 ,
06525 ,
06510 ,
06519 ,
06514 ,
06516 .
New Haven Zip Code Map
Percentage of family households: This zip code:
38.3%Connecticut:
43.6%
Percentage of households with unmarried partners: This zip code:
6.8%Connecticut:
46.0%
Likely homosexual households (counted as self-reported same-sex unmarried-partner households)
Lesbian couples: 0.9% of all households Gay men: 0.0% of all households
Household received Food Stamps/SNAP in the past 12 months: 1,389Household did not receive Food Stamps/SNAP in the past 12 months: 5,721
Women who had a birth in the past 12 months: 127 (123 now married , 0 unmarried) Women who did not have a birth in the past 12 months: 6,450 (993 now married , 5,570 unmarried)
Housing units in zip code 06515 with a mortgage: 2,047 (164
second mortgage , 124
both second mortgage and home equity loan )
Houses without a mortgage: 31
Median monthly owner costs for units with a mortgage: $2,175
Median monthly owner costs for units without a mortgage: $1,084
Residents with income below the poverty level in 2022:
This zip code:
20.3%Whole state:
9.8%
Residents with income below 50% of the poverty level in 2022:
This zip code:
9.7%Whole state:
4.8%
Median number of rooms in houses and condos: Median number of rooms in apartments: Notable locations in this zip code not listed on our city pages
Click to draw/clear zip code borders Notable locations in zip code 06515: (A) , Yale Golf Club (B) , Hamden City Recycling Center (C) , Lyman Center (D) , Lang Building (E) , John Lyman Performing Arts Center (F) , Jennings Building (G) , Hilton C Buley Library (H) , Hickerson Building (I) , Farnum House (J) , Farnham Building (K) , Engleman Building (L) , Earl Building (M) , Donald Mitchell Library (N) , Davis Building (O) , Connecticut Hall (P) , Chase Building (Q) , Buley Building (R) , Brownell Building (S) , Barnard Nature Center (T) . Display/hide their locations on the map
Shopping Centers: (1) , Beaver Hill Shopping Center (2) . Display/hide their locations on the map
Churches in zip code 06515 include: (A) , Saint Vincent DePauls Church (B) , United Church of Westville (C) , Congregation Beth El Keser Israel (D) . Display/hide their locations on the map
Cemeteries: (1) , City Cemetery (2) , Mishkan Israel Cemetery (3) , Westville Cemetery (4) , B'nail Jacob Memorial Park (5) . Display/hide their locations on the map
Reservoirs: (A) , Iris Pond (B) , Long Pond (C) . Display/hide their locations on the map
Streams, rivers, and creeks: (A) , Belden Brook (B) , Wilmot Brook (C) . Display/hide their locations on the map
Parks in zip code 06515 include: (1) , West Rock Playground (2) , West Rock Park (3) , Walter Camp Field (4) , Edgewood Park (5) , Moore Field (6) , Beecher Park (7) , Bowling Green (8) , Edgewood Park Historic District (9) . Display/hide their locations on the map
Tourist attraction (not listed on the city page) :
Year house built (houses)
0 2020 or later547 2010 to 2019582 2000 to 2009366 1990 to 1999483 1980 to 1989465 1970 to 1979639 1960 to 19691,256 1950 to 1959669 1940 to 19492,515 1939 or earlier
Zip code 06515 household income distribution in 2022 416 Less than $10,000428 $10,000 to $14,999204 $15,000 to $19,999248 $20,000 to $24,999201 $25,000 to $29,999306 $30,000 to $34,999304 $35,000 to $39,999233 $40,000 to $44,999198 $45,000 to $49,999487 $50,000 to $59,999617 $60,000 to $74,999736 $75,000 to $99,999711 $100,000 to $124,999608 $125,000 to $149,999603 $150,000 to $199,999772 $200,000 or moreEstimate of home value of owner-occupied houses/condos in 2022 in zip code 06515 8 Less than $10,0001 $30,000 to $34,99945 $40,000 to $49,9998 $50,000 to $59,99917 $70,000 to $79,99928 $90,000 to $99,99993 $100,000 to $124,99945 $125,000 to $149,999209 $150,000 to $174,999154 $175,000 to $199,999525 $200,000 to $249,999376 $250,000 to $299,999859 $300,000 to $399,999331 $400,000 to $499,999156 $500,000 to $749,9997 $750,000 to $999,99910 $1,000,000 to $1,499,9997 $2,000,000 or moreRent paid by renters in 2022 in zip code 06515 135 Less than $10019 $100 to $14914 $150 to $199121 $200 to $24992 $250 to $29922 $300 to $34949 $350 to $39986 $400 to $44973 $450 to $49968 $500 to $54923 $550 to $59956 $650 to $69949 $700 to $74946 $750 to $799229 $800 to $89998 $900 to $999762 $1,000 to $1,249852 $1,250 to $1,499661 $1,500 to $1,999310 $2,000 to $2,49948 $2,500 to $2,99967 No cash rent
Median gross rent in 2022: $1,387.
Median price asked for vacant for-sale houses and condos in 2022: $1,610,119.
Estimated median house (or condo) value in 2022 for: White Non-Hispanic householders: $312,643Black or African American householders: $262,157American Indian or Alaska Native householders: $227,187Asian householders: $2,315,878Two or more races householders: $162,111Hispanic or Latino householders: $270,262Estimated median house or condo value in 2022: $286,705
06515:
$286,705Connecticut:
$347,200
Lower value quartile - upper value quartile: $214,568 - $387,394
Mean price in 2022: Detached houses: $288,862Here:
$288,862State:
$503,946
Townhouses or other attached units: $114,904Here:
$114,904State:
$304,959
In 2-unit structures: $270,219Here:
$270,219State:
$304,133
In 3-to-4-unit structures: $50,487Here:
$50,487State:
$272,970
In 5-or-more-unit structures: $188,123Here:
$188,123State:
$249,308
Housing units in structures:
One, detached: 2,842One, attached: 643Two: 6573 or 4: 1,4745 to 9: 41510 to 19: 35220 to 49: 59950 or more: 623Mobile homes: 15Unemployment : 7.3%
Means of transportation to work in zip code 06515 66.5% 6,827 Drove a car alone6.2% 636 Carpooled2.8% 285 Bus or trolley bus0.2% 17 Streetcar or trolley car0.1% 13 Subway or elevated1.0% 99 Taxi0.1% 13 Motorcycle0.3% 32 Bicycle6.7% 693 Walked1.1% 112 Other means15.3% 1,570 Worked at homeTravel time to work (commute) in zip code 06515 242 Less than 5 minutes845 5 to 9 minutes1,947 10 to 14 minutes1,969 15 to 19 minutes1,276 20 to 24 minutes363 25 to 29 minutes790 30 to 34 minutes154 35 to 39 minutes212 40 to 44 minutes508 45 to 59 minutes310 60 to 89 minutes63 90 or more minutes
Neighborhoods in zip code 06515: Percentage of zip code residents living and working in this county: 81.9%
Household type by relationship:
Households: 19,830
Male householders: 2,916 (1,213 living alone ), Female householders: 4,179 (1,033 living alone )2,095 spouses (2,061 opposite-sex spouses ), 600 unmarried partners , (590 opposite-sex unmarried partners ), 4,766 children (4,549 natural , 37 adopted , 184 stepchildren ), 1,210 grandchildren , 134 brothers or sisters , 197 parents , 0 foster children , 263 other relatives , 978 non-relatives In group quarters: 2,512 (-1 institutionalized population )
Size of family households: 1,906 2-persons , 912 3-persons , 599 4-persons , 228 5-persons , 93 6-persons , 138 7-or-more-persons
Size of nonfamily households: 2,234 1-person , 804 2-persons , 35 3-persons , 152 4-persons
1,315 married couples with children. single-parent households (151 men , 1,182 women ).
79.0% of residents of 06515 zip code speak English at home. of residents speak Spanish at home (69% very well, 22% well, 9% not well ).of residents speak other Indo-European language at home (68% very well, 20% well, 3% not well, 8% not at all ).of residents speak Asian or Pacific Island language at home (84% very well, 16% well ).of residents speak other language at home (100% very well ).
Foreign born population: 2,082 (10.5%)
(70.9%
of them are naturalized citizens )
This zip code:
10.5%Whole state:
15.7%
21% Haiti 14% Honduras 6% Romania 4% Sweden 3% Malaysia 3% Chile 3% Bolivia 5% Italian 5% Jamaican 5% Irish 3% African 3% American 2% English 1% German
Year of entry for the foreign-born population
819 2010 or later 598 2000 to 2009 643 1990 to 1999 924 Before 1990
There are
85 Medical Specialists in Zip Code 06515 .
Major facilities with environmental interests located in this zip code:
COMMON GROUND HIGH SCHOOL (358 SPRINGSIDE AVE in NEW HAVEN, CT)
COMPLIANCE ACTIVITY (Tracking inspections of insecticide, fungicide, and rodenticide, and toxic substances) (National Center for Education Statistics) - STATE ID-61 Organizations: COMMON GROUND HIGH SCHOOL DISTRICT (SCHOOL DISTRICT)
DAVIS 21ST CENTURY MAGNET ELEMENTARY (35 DAVIS STREET in NEW HAVEN, CT)
(National Center for Education Statistics) - STATE ID-9 Organizations: NEW HAVEN SCHOOL DISTRICT (SCHOOL DISTRICT)
EARLY LEARNING CENTER (495 BLAKE STREET in NEW HAVEN, CT)
(National Center for Education Statistics) - STATE ID-81 Organizations: NEW HAVEN SCHOOL DISTRICT (SCHOOL DISTRICT)
EDGEWOOD SCHOOL (737 EDGEWOOD AVENUE in NEW HAVEN, CT)
(National Center for Education Statistics) - STATE ID-12 Organizations: NEW HAVEN SCHOOL DISTRICT (SCHOOL DISTRICT)
HEADSTART (54 MEADOW STREET in NEW HAVEN, CT)
(National Center for Education Statistics) - STATE ID-80 Organizations: NEW HAVEN SCHOOL DISTRICT (SCHOOL DISTRICT)
ALLIANCE ENERGY (1570 WHALLEY AVE in NEW HAVEN, CT)
Small Quantity Generators, between 100 kg and 1000 kg of hazardous waste/month (Resource Conservation and Recovery Act (tracking hazardous waste)) Organizations: OPERNAME (CONTACT/OPERATOR)
, ALLIANCE ENERGY CORP (CONTACT/OPERATOR)
, EXXONMOBIL CORP (CONTACT/OWNER)
Alternative names: EXXON CO USA 38670
ONE STOP CLEANERS (284 BLAKE ST in NEW HAVEN, CT)
AIR MINOR (AIRS/AFS) Small Quantity Generators, between 100 kg and 1000 kg of hazardous waste/month (Resource Conservation and Recovery Act (tracking hazardous waste)) - notification Business SIC classification: DRYCLEANING PLANTS, EXCEPT RUG CLEANINGOrganizations: HISUCK CHUNG (CONTACT/OWNER)
APPLES INC (781 WHALLEY AVE in NEW HAVEN, CT)
(Resource Conservation and Recovery Act (tracking hazardous waste)) Organizations: GOLDENBERG GERALD (CONTACT/OWNER)
APPLIED ENGINEERING PRODUCTS (1475 WHALLEY AVE in NEW HAVEN, CT)
(Resource Conservation and Recovery Act (tracking hazardous waste)) Organizations: BENJAMIN TRIVELLI (CONTACT/OWNER)
CIRCLE LITHO INC (66 AMITY RD in NEW HAVEN, CT)
(Resource Conservation and Recovery Act (tracking hazardous waste)) Organizations: OWNERNAME (CONTACT/OWNER)
AMERICANA CLEANERS (95 AMITY RD in NEW HAVEN, CT)
Small Quantity Generators, between 100 kg and 1000 kg of hazardous waste/month (Resource Conservation and Recovery Act (tracking hazardous waste)) - notification Organizations: OPERNAME (CONTACT/OPERATOR)
, VICTORIA BUCUR (CONTACT/OWNER)
A 1 TOYOTA DODGE (50 AMITY RD in NEW HAVEN, CT)
Conditionally Exempt Small Quantity Generators, less than 100 kg/month of hazardous waste (Resource Conservation and Recovery Act (tracking hazardous waste)) - notification Organizations: OWNERNAME (CONTACT/OWNER)
BEECHER SCHOOL (311 VALLEY STREET in NEW HAVEN, CT)
AIR MONITORING SITE (Airborne pollution emission tracking) (National Center for Education Statistics) Alternative names: WEST HILL ELEMENTARY MAGNET, WEST HILL ELEMENTARY MAGNET SCHOOL
Housing units lacking complete plumbing facilities: 0.8%
Housing units lacking complete kitchen facilities: 0.6%
59.4% Utility gas 21.7% Electricity 16.5% Fuel oil, kerosene, etc. 2.4% Bottled, tank, or LP gas
Population in 1990: 18,603.
Place of birth for U.S.-born residents:
This state: 10,901Northeast: 3,446Midwest: 613South: 1,374West: 390
56% of the 06515 zip code residents lived in the same house 5 years ago.
Out of people who lived in different houses, 72% lived in this county.
Out of people who lived in different counties, 50% lived in Connecticut.
84% of the 06515 zip code residents lived in the same house 1 year ago.
Out of people who lived in different houses, 53% moved from this county.
Out of people who lived in different houses, 17% moved from different county within same state.
Out of people who lived in different houses, 18% moved from different state.
Out of people who lived in different houses, 5% moved from abroad.
Private vs. public school enrollment:
Students in private schools in grades 1 to 8 (elementary and middle school): 299
Here:
16.8%Connecticut:
9.5%
Students in private schools in grades 9 to 12 (high school): 83
Here:
9.6%Connecticut:
12.9%
Students in private undergraduate colleges: 571
Here:
20.0%Connecticut:
35.5%
Occupation by median earnings in the past 12 months ($)
126,510 Health diagnosing and treating practitioners and other technical occupations 99,380 Architecture and engineering occupations 87,365 Computer and mathematical occupations 86,009 Management occupations 85,502 Business and financial operations occupations 60,815 Community and social service occupations
Companies with federal contracts located in this zip code:
WASTE MANAGEMENT OF CONNECTICU (495 BLAKE ST in NEW HAVEN, CT) in 44 contracts from 2003 to 2005
Contracts for Waste Treatment and Storage, Trash/Garbage Collection Services - Including Portable Sanitation Services, Facilities Operations Support Services by Department of Veterans Affairs, Army, NavySigned by year: 2000: $0; 2001: $0; 2002: $0; 2003: $93,540; 2004: $124,165; 2005: $63,087; 2006: $0.
Biggest contracts: with Department of Veterans Affairs for Waste Treatment and Storage. Signed on 2004-04-30. Completion date: 2005-04-29.
with Department of Veterans Affairs for Trash/Garbage Collection Services - Including Portable Sanitation Services. Signed on 2003-06-15. Completion date: 2004-05-15.
with Army for Trash/Garbage Collection Services - Including Portable Sanitation Services. Signed on 2005-12-06. Completion date: 2004-12-31.
, same as above. Signed on 2004-12-06. Completion date: 2004-12-31.
NEW HAVEN MANUFACTURING CO LL (446 BLAKE ST in NEW HAVEN, CT; small business)
$25,883 with Defense Logistics Agency for Valves, Nonpowered. Signed on 2001-11-30. Completion date: 2002-02-13.
Top industries in this zip code by the number of employees in 2005:
Health Care and Social Assistance: Vocational Rehabilitation Services (100-249 employees: 1 establishment, 50-99 employees: 1 establishment)Accommodation and Food Services: Full-Service Restaurants (50-99: 1, 20-49: 2, 10-19: 2, 5-9: 4, 1-4: 11)Educational Services: Elementary and Secondary Schools (100-249: 1)Health Care and Social Assistance: Residential Mental Retardation Facilities (50-99: 1, 10-19: 5)Health Care and Social Assistance: Other Individual and Family Services (50-99: 1, 20-49: 1)Other Services (except Public Administration): Religious Organizations (20-49: 2, 5-9: 1, 1-4: 5)Health Care and Social Assistance: Nursing Care Facilities (50-99: 1)Accommodation and Food Services: Limited-Service Restaurants (20-49: 1, 10-19: 1, 5-9: 1, 1-4: 7)
People in group quarters in 2010:
2,058 people in college/university student housing
151 people in workers' group living quarters and job corps centers
93 people in residential treatment centers for adults
85 people in nursing facilities/skilled-nursing facilities
31 people in residential schools for people with disabilities
30 people in group homes intended for adults
8 people in group homes for juveniles (non-correctional)
People in group quarters in 2000:
1,210 people in college dormitories (includes college quarters off campus)
91 people in homes or halfway houses for drug/alcohol abuse
86 people in nursing homes
28 people in homes for the mentally retarded
Fatal accident statistics in 2013:
Fatal accident count: 3Vehicles involved in fatal accidents: 5Fatal accidents caused by drunken drivers: 1Fatalities: 4Persons involved in fatal accidents: 7Pedestrians involved in fatal accidents: 0
Fatal accident statistics in 2012:
Fatal accident count: 1Vehicles involved in fatal accidents: 1Fatal accidents caused by drunken drivers: 1Fatalities: 1Persons involved in fatal accidents: 2Pedestrians involved in fatal accidents: 0
Home Mortgage Disclosure Act Aggregated Statistics For Year 2009(Based on 8 full and 2 partial tracts) A) FHA, FSA/RHS & VA B) Conventional C) Refinancings D) Home Improvement Loans E) Loans on Dwellings For 5+ Families F) Non-occupant Loans on Number Average Value Number Average Value Number Average Value Number Average Value Number Average Value Number Average Value
LOANS ORIGINATED 86 $208,864 127 $184,919 361 $190,751 17 $55,358 3 $1,438,103 18 $173,244 APPLICATIONS APPROVED, NOT ACCEPTED 11 $184,940 9 $145,327 25 $219,465 12 $32,421 1 $968,140 4 $182,012 APPLICATIONS DENIED 18 $183,832 30 $153,807 200 $193,838 20 $40,947 0 $0 14 $191,271 APPLICATIONS WITHDRAWN 9 $163,512 28 $209,220 131 $196,144 4 $124,632 0 $0 4 $203,425 FILES CLOSED FOR INCOMPLETENESS 2 $302,135 4 $85,070 30 $158,904 0 $0 0 $0 3 $151,833
Aggregated Statistics For Year 2008(Based on 8 full and 2 partial tracts) A) FHA, FSA/RHS & VA B) Conventional C) Refinancings D) Home Improvement Loans E) Loans on Dwellings For 5+ Families F) Non-occupant Loans on Number Average Value Number Average Value Number Average Value Number Average Value Number Average Value Number Average Value
LOANS ORIGINATED 73 $191,324 167 $194,703 286 $189,362 60 $92,286 5 $215,142 40 $162,314 APPLICATIONS APPROVED, NOT ACCEPTED 5 $242,948 21 $161,926 58 $192,242 22 $58,629 0 $0 7 $109,936 APPLICATIONS DENIED 16 $149,832 24 $161,955 246 $192,104 87 $44,813 4 $430,722 17 $143,654 APPLICATIONS WITHDRAWN 8 $240,690 20 $216,000 131 $207,670 22 $92,606 0 $0 7 $208,271 FILES CLOSED FOR INCOMPLETENESS 0 $0 3 $204,270 18 $188,784 3 $39,813 0 $0 1 $163,060
Aggregated Statistics For Year 2007(Based on 8 full and 2 partial tracts) A) FHA, FSA/RHS & VA B) Conventional C) Refinancings D) Home Improvement Loans E) Loans on Dwellings For 5+ Families F) Non-occupant Loans on Number Average Value Number Average Value Number Average Value Number Average Value Number Average Value Number Average Value
LOANS ORIGINATED 23 $233,409 313 $202,858 485 $181,979 106 $65,272 14 $670,184 66 $179,680 APPLICATIONS APPROVED, NOT ACCEPTED 7 $253,077 48 $193,389 148 $192,067 37 $76,439 2 $236,520 28 $203,907 APPLICATIONS DENIED 7 $189,273 119 $215,005 442 $198,510 125 $84,814 4 $313,605 61 $167,052 APPLICATIONS WITHDRAWN 7 $264,121 32 $239,041 187 $190,873 22 $73,970 2 $254,975 12 $182,355 FILES CLOSED FOR INCOMPLETENESS 2 $190,740 14 $230,840 50 $240,034 5 $41,252 0 $0 4 $251,820
Aggregated Statistics For Year 2006(Based on 8 full and 2 partial tracts) A) FHA, FSA/RHS & VA B) Conventional C) Refinancings D) Home Improvement Loans E) Loans on Dwellings For 5+ Families F) Non-occupant Loans on G) Loans On Manufactured Number Average Value Number Average Value Number Average Value Number Average Value Number Average Value Number Average Value Number Average Value
LOANS ORIGINATED 63 $224,552 526 $169,896 735 $169,943 153 $61,149 23 $1,731,145 157 $164,030 0 $0 APPLICATIONS APPROVED, NOT ACCEPTED 3 $208,067 89 $132,892 186 $180,067 40 $92,230 0 $0 32 $150,095 0 $0 APPLICATIONS DENIED 8 $235,538 211 $178,850 437 $178,957 138 $63,882 2 $786,805 76 $187,599 2 $380,840 APPLICATIONS WITHDRAWN 11 $175,605 78 $165,567 336 $181,289 13 $91,341 10 $385,187 29 $175,976 0 $0 FILES CLOSED FOR INCOMPLETENESS 0 $0 20 $143,456 87 $185,054 13 $43,894 2 $867,865 13 $154,436 0 $0
Aggregated Statistics For Year 2005(Based on 8 full and 2 partial tracts) A) FHA, FSA/RHS & VA B) Conventional C) Refinancings D) Home Improvement Loans E) Loans on Dwellings For 5+ Families F) Non-occupant Loans on G) Loans On Manufactured Number Average Value Number Average Value Number Average Value Number Average Value Number Average Value Number Average Value Number Average Value
LOANS ORIGINATED 50 $198,406 541 $162,174 773 $165,346 149 $71,723 10 $641,314 152 $177,331 0 $0 APPLICATIONS APPROVED, NOT ACCEPTED 6 $219,103 41 $180,317 165 $142,059 37 $61,110 0 $0 22 $185,073 0 $0 APPLICATIONS DENIED 9 $147,059 146 $150,128 521 $168,809 139 $54,238 4 $714,360 73 $153,409 8 $104,262 APPLICATIONS WITHDRAWN 5 $184,944 177 $157,403 448 $174,950 29 $68,491 2 $2,479,620 65 $165,323 1 $108,700 FILES CLOSED FOR INCOMPLETENESS 0 $0 32 $138,430 219 $169,194 6 $59,915 0 $0 9 $216,954 1 $212,650
Aggregated Statistics For Year 2004(Based on 8 full and 2 partial tracts) A) FHA, FSA/RHS & VA B) Conventional C) Refinancings D) Home Improvement Loans E) Loans on Dwellings For 5+ Families F) Non-occupant Loans on G) Loans On Manufactured Number Average Value Number Average Value Number Average Value Number Average Value Number Average Value Number Average Value Number Average Value
LOANS ORIGINATED 59 $169,812 512 $156,917 832 $148,348 144 $65,184 16 $709,708 170 $138,232 0 $0 APPLICATIONS APPROVED, NOT ACCEPTED 7 $239,916 96 $158,896 181 $140,527 29 $40,316 3 $272,907 36 $125,414 2 $59,260 APPLICATIONS DENIED 14 $145,182 175 $132,855 529 $143,019 114 $45,810 0 $0 64 $111,742 7 $50,049 APPLICATIONS WITHDRAWN 5 $130,440 59 $151,450 378 $141,842 24 $107,854 2 $1,144,440 29 $137,041 4 $239,642 FILES CLOSED FOR INCOMPLETENESS 1 $99,190 25 $160,120 137 $142,430 4 $89,092 0 $0 10 $138,814 0 $0
Aggregated Statistics For Year 2003(Based on 8 full and 2 partial tracts) A) FHA, FSA/RHS & VA B) Conventional C) Refinancings D) Home Improvement Loans E) Loans on Dwellings For 5+ Families F) Non-occupant Loans on Number Average Value Number Average Value Number Average Value Number Average Value Number Average Value Number Average Value
LOANS ORIGINATED 50 $148,275 383 $152,779 1,313 $137,237 62 $42,827 11 $1,529,445 117 $115,481 APPLICATIONS APPROVED, NOT ACCEPTED 0 $0 52 $139,598 284 $117,570 21 $24,790 4 $219,202 21 $117,517 APPLICATIONS DENIED 18 $166,202 88 $114,964 579 $129,037 64 $26,274 4 $188,020 39 $101,552 APPLICATIONS WITHDRAWN 4 $136,015 54 $111,254 385 $125,778 20 $59,103 4 $810,415 28 $116,368 FILES CLOSED FOR INCOMPLETENESS 4 $135,782 9 $159,039 39 $160,794 3 $21,293 0 $0 10 $85,522
Aggregated Statistics For Year 2002(Based on 8 full and 2 partial tracts) A) FHA, FSA/RHS & VA B) Conventional C) Refinancings D) Home Improvement Loans E) Loans on Dwellings For 5+ Families F) Non-occupant Loans on Number Average Value Number Average Value Number Average Value Number Average Value Number Average Value Number Average Value
LOANS ORIGINATED 105 $136,662 340 $128,644 727 $120,137 95 $36,421 4 $363,830 110 $94,767 APPLICATIONS APPROVED, NOT ACCEPTED 8 $167,840 45 $108,436 114 $101,186 47 $22,819 1 $135,880 14 $75,865 APPLICATIONS DENIED 15 $162,506 58 $96,862 334 $106,312 88 $33,961 4 $297,555 26 $93,217 APPLICATIONS WITHDRAWN 14 $137,037 31 $102,132 225 $124,855 20 $29,358 2 $262,265 18 $92,983 FILES CLOSED FOR INCOMPLETENESS 1 $130,440 15 $84,486 64 $127,186 0 $0 0 $0 2 $51,440
Aggregated Statistics For Year 2001(Based on 8 full and 2 partial tracts) A) FHA, FSA/RHS & VA B) Conventional C) Refinancings D) Home Improvement Loans E) Loans on Dwellings For 5+ Families F) Non-occupant Loans on Number Average Value Number Average Value Number Average Value Number Average Value Number Average Value Number Average Value
LOANS ORIGINATED 113 $122,250 294 $121,459 590 $117,528 92 $28,321 15 $1,725,259 83 $79,246 APPLICATIONS APPROVED, NOT ACCEPTED 7 $70,227 42 $100,775 107 $100,138 21 $43,829 2 $153,545 16 $74,511 APPLICATIONS DENIED 14 $119,348 71 $104,759 431 $84,716 168 $20,650 1 $76,770 33 $74,923 APPLICATIONS WITHDRAWN 8 $157,681 34 $130,559 222 $87,895 56 $27,593 3 $460,683 18 $94,661 FILES CLOSED FOR INCOMPLETENESS 4 $135,202 9 $108,464 54 $104,844 7 $21,334 0 $0 2 $69,245
Aggregated Statistics For Year 2000(Based on 8 full and 2 partial tracts) A) FHA, FSA/RHS & VA B) Conventional C) Refinancings D) Home Improvement Loans E) Loans on Dwellings For 5+ Families F) Non-occupant Loans on Number Average Value Number Average Value Number Average Value Number Average Value Number Average Value Number Average Value
LOANS ORIGINATED 133 $101,036 340 $112,668 279 $84,644 82 $22,391 4 $275,340 63 $71,146 APPLICATIONS APPROVED, NOT ACCEPTED 8 $89,292 46 $109,853 61 $81,901 52 $27,391 0 $0 9 $103,912 APPLICATIONS DENIED 23 $117,036 115 $94,491 324 $85,675 154 $23,108 1 $458,600 39 $74,346 APPLICATIONS WITHDRAWN 5 $89,208 51 $107,620 144 $79,411 12 $27,688 2 $4,281,300 22 $96,243 FILES CLOSED FOR INCOMPLETENESS 0 $0 10 $75,867 48 $95,713 5 $82,066 0 $0 5 $93,192
Aggregated Statistics For Year 1999(Based on 2 full and 3 partial tracts) A) FHA, FSA/RHS & VA B) Conventional C) Refinancings D) Home Improvement Loans E) Loans on Dwellings For 5+ Families F) Non-occupant Loans on Number Average Value Number Average Value Number Average Value Number Average Value Number Average Value Number Average Value
LOANS ORIGINATED 68 $88,517 133 $106,500 171 $87,234 52 $23,587 1 $215,080 22 $64,383 APPLICATIONS APPROVED, NOT ACCEPTED 1 $64,800 23 $89,513 65 $104,616 21 $26,574 0 $0 14 $125,841 APPLICATIONS DENIED 8 $71,598 37 $84,474 142 $80,864 70 $22,694 2 $158,875 23 $76,770 APPLICATIONS WITHDRAWN 2 $112,130 15 $94,835 69 $79,359 11 $26,145 0 $0 6 $70,902 FILES CLOSED FOR INCOMPLETENESS 1 $57,580 6 $106,893 16 $683,171 0 $0 0 $0 3 $165,937
Private Mortgage Insurance Companies Aggregated Statistics For Year 2009(Based on 8 full and 2 partial tracts) A) Conventional B) Refinancings Number Average Value Number Average Value
LOANS ORIGINATED 22 $176,557 6 $240,027 APPLICATIONS APPROVED, NOT ACCEPTED 8 $186,066 1 $158,300 APPLICATIONS DENIED 2 $198,185 3 $209,060 APPLICATIONS WITHDRAWN 1 $120,250 1 $158,300 FILES CLOSED FOR INCOMPLETENESS 0 $0 0 $0
Aggregated Statistics For Year 2008(Based on 8 full and 2 partial tracts) A) Conventional B) Refinancings C) Non-occupant Loans on Number Average Value Number Average Value Number Average Value
LOANS ORIGINATED 47 $227,264 29 $227,775 2 $275,905 APPLICATIONS APPROVED, NOT ACCEPTED 31 $240,509 31 $271,029 0 $0 APPLICATIONS DENIED 8 $213,232 8 $203,702 2 $187,950 APPLICATIONS WITHDRAWN 2 $239,960 4 $233,160 0 $0 FILES CLOSED FOR INCOMPLETENESS 0 $0 2 $240,330 0 $0
Aggregated Statistics For Year 2007(Based on 8 full and 2 partial tracts) A) Conventional B) Refinancings C) Non-occupant Loans on Number Average Value Number Average Value Number Average Value
LOANS ORIGINATED 62 $214,196 41 $245,687 14 $241,251 APPLICATIONS APPROVED, NOT ACCEPTED 15 $248,769 14 $259,257 2 $73,435 APPLICATIONS DENIED 1 $209,260 2 $470,945 1 $209,260 APPLICATIONS WITHDRAWN 8 $200,648 8 $342,789 1 $404,920 FILES CLOSED FOR INCOMPLETENESS 1 $349,890 2 $274,005 1 $349,890
Aggregated Statistics For Year 2006(Based on 8 full and 2 partial tracts) A) Conventional B) Refinancings C) Non-occupant Loans on Number Average Value Number Average Value Number Average Value
LOANS ORIGINATED 54 $201,287 28 $195,446 8 $241,571 APPLICATIONS APPROVED, NOT ACCEPTED 9 $209,272 9 $204,750 4 $196,408 APPLICATIONS DENIED 2 $185,020 6 $405,770 4 $255,210 APPLICATIONS WITHDRAWN 3 $208,007 8 $206,020 3 $192,417 FILES CLOSED FOR INCOMPLETENESS 2 $51,440 2 $706,890 2 $51,440
Aggregated Statistics For Year 2005(Based on 8 full and 2 partial tracts) A) Conventional B) Refinancings C) Non-occupant Loans on Number Average Value Number Average Value Number Average Value
LOANS ORIGINATED 89 $177,692 10 $220,398 12 $203,180 APPLICATIONS APPROVED, NOT ACCEPTED 18 $183,316 1 $78,130 5 $163,454 APPLICATIONS DENIED 4 $302,695 0 $0 4 $302,695 APPLICATIONS WITHDRAWN 4 $263,775 0 $0 2 $231,750 FILES CLOSED FOR INCOMPLETENESS 0 $0 0 $0 0 $0
Aggregated Statistics For Year 2004(Based on 8 full and 2 partial tracts) A) Conventional B) Refinancings C) Non-occupant Loans on Number Average Value Number Average Value Number Average Value
LOANS ORIGINATED 92 $189,602 18 $167,548 12 $195,467 APPLICATIONS APPROVED, NOT ACCEPTED 17 $120,455 16 $144,792 3 $151,987 APPLICATIONS DENIED 6 $198,242 0 $0 2 $119,215 APPLICATIONS WITHDRAWN 5 $176,914 2 $236,075 2 $119,215 FILES CLOSED FOR INCOMPLETENESS 0 $0 0 $0 0 $0
Aggregated Statistics For Year 2003(Based on 8 full and 2 partial tracts) A) Conventional B) Refinancings C) Non-occupant Loans on Number Average Value Number Average Value Number Average Value
LOANS ORIGINATED 111 $166,499 48 $150,048 16 $132,931 APPLICATIONS APPROVED, NOT ACCEPTED 8 $149,062 18 $141,229 2 $94,965 APPLICATIONS DENIED 3 $85,917 2 $182,640 0 $0 APPLICATIONS WITHDRAWN 6 $145,605 3 $191,440 4 $128,408 FILES CLOSED FOR INCOMPLETENESS 0 $0 0 $0 0 $0
Aggregated Statistics For Year 2002(Based on 8 full and 2 partial tracts) A) Conventional B) Refinancings C) Non-occupant Loans on Number Average Value Number Average Value Number Average Value
LOANS ORIGINATED 114 $148,362 33 $146,598 15 $105,628 APPLICATIONS APPROVED, NOT ACCEPTED 22 $123,372 20 $100,188 3 $72,273 APPLICATIONS DENIED 14 $171,913 2 $167,445 2 $42,535 APPLICATIONS WITHDRAWN 5 $170,694 4 $93,485 0 $0 FILES CLOSED FOR INCOMPLETENESS 0 $0 0 $0 0 $0
Aggregated Statistics For Year 2001(Based on 8 full and 2 partial tracts) A) Conventional B) Refinancings C) Non-occupant Loans on Number Average Value Number Average Value Number Average Value
LOANS ORIGINATED 123 $130,657 47 $158,167 18 $109,250 APPLICATIONS APPROVED, NOT ACCEPTED 12 $128,248 20 $141,993 4 $109,255 APPLICATIONS DENIED 7 $103,203 3 $80,850 3 $89,790 APPLICATIONS WITHDRAWN 2 $106,835 2 $80,125 0 $0 FILES CLOSED FOR INCOMPLETENESS 0 $0 0 $0 0 $0
Aggregated Statistics For Year 2000(Based on 8 full and 2 partial tracts) A) Conventional B) Refinancings C) Non-occupant Loans on Number Average Value Number Average Value Number Average Value
LOANS ORIGINATED 98 $114,967 18 $112,539 8 $97,744 APPLICATIONS APPROVED, NOT ACCEPTED 12 $117,545 5 $124,802 1 $61,150 APPLICATIONS DENIED 1 $93,080 0 $0 1 $93,080 APPLICATIONS WITHDRAWN 6 $88,078 0 $0 0 $0 FILES CLOSED FOR INCOMPLETENESS 0 $0 0 $0 0 $0
Aggregated Statistics For Year 1999(Based on 2 full and 3 partial tracts) A) Conventional B) Refinancings C) Non-occupant Loans on Number Average Value Number Average Value Number Average Value
LOANS ORIGINATED 52 $110,964 8 $120,186 5 $63,884 APPLICATIONS APPROVED, NOT ACCEPTED 6 $95,818 1 $145,070 2 $65,120 APPLICATIONS DENIED 4 $91,288 2 $138,910 1 $82,950 APPLICATIONS WITHDRAWN 1 $109,040 3 $132,170 0 $0 FILES CLOSED FOR INCOMPLETENESS 0 $0 0 $0 0 $0
2004 - 2018 National Fire Incident Reporting System (NFIRS) incidents See full 2006 National Fire Incident Reporting System statistics for zip code 06515, Connecticut
Most common first names in zip code 06515 among deceased individuals Name Count Lived (average)
Mary 127 81.7 years John 118 74.8 years William 97 74.8 years Joseph 91 76.5 years James 86 70.0 years Helen 78 79.0 years Anna 76 83.2 years Rose 72 82.5 years George 65 73.9 years Louis 64 78.9 years
Most common last names in zip code 06515 among deceased individuals Last name Count Lived (average)
Levine 38 76.7 years Johnson 35 79.5 years Smith 30 71.6 years Cohen 29 74.8 years Miller 25 75.6 years Williams 22 65.4 years Brown 18 74.5 years Anderson 17 75.0 years Harris 15 69.8 years Jones 14 74.9 years
Businesses in zip code 06515
Name Count Name Count
Blockbuster 1 Penske 1 Burger King 1 RadioShack 1 CVS 2 Stop & Shop 1 Dunkin Donuts 3 Subway 2 FedEx 1 T-Mobile 1 Jones New York 1 Toyota 1 MasterBrand Cabinets 1 UPS 1 McDonald's 1 Walgreens 1 Payless 1


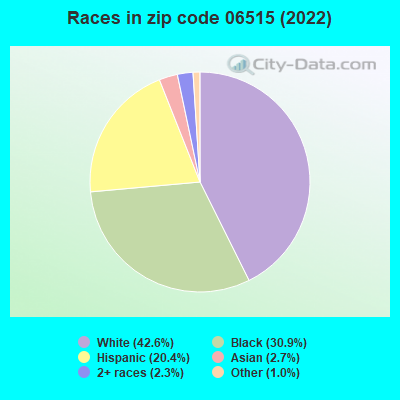


 Nearest zip codes: 06511, 06525, 06510, 06519, 06514, 06516.
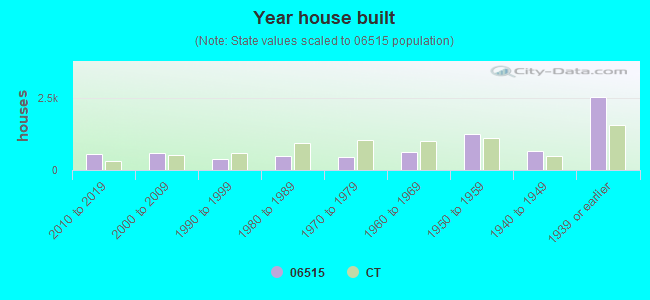

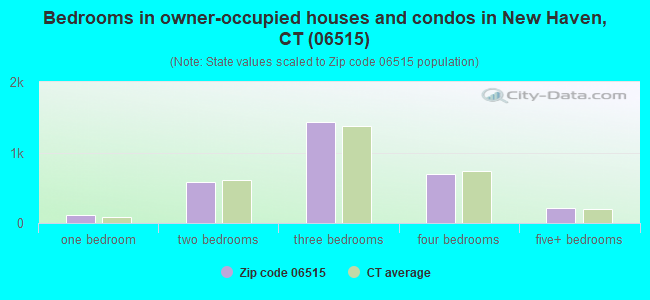
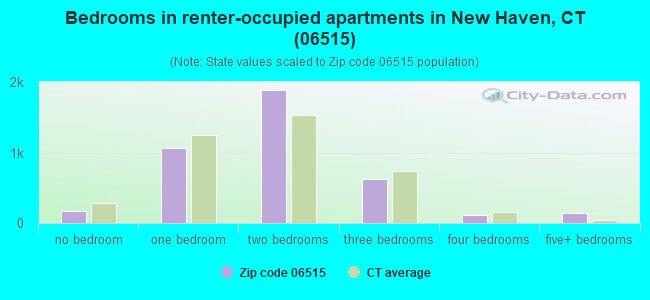
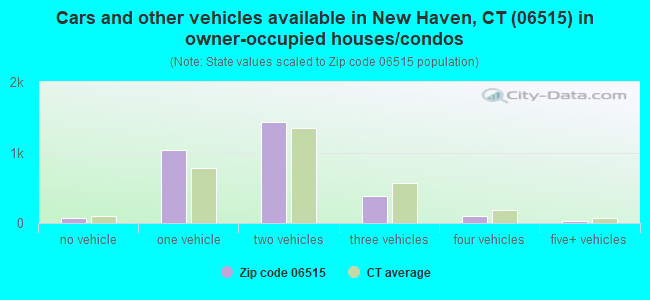
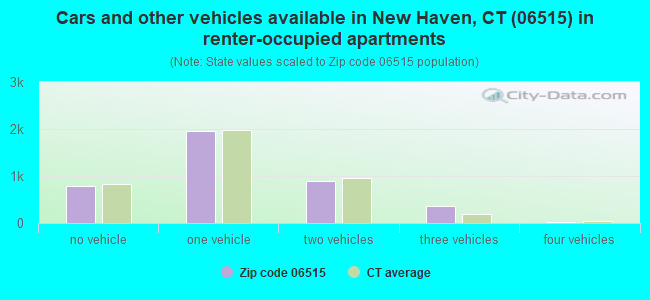


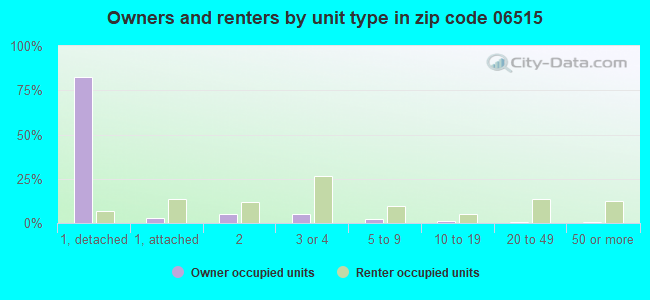
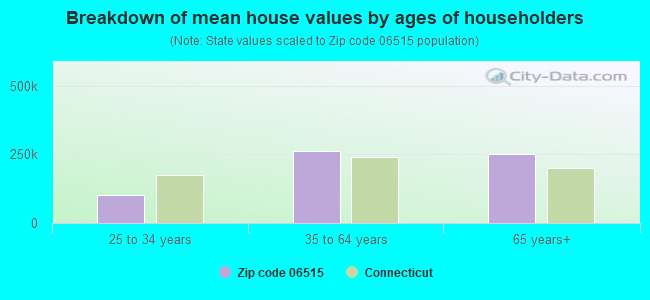


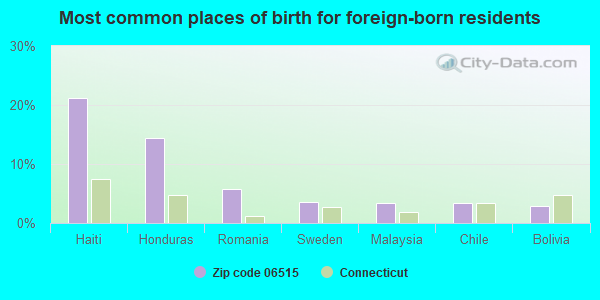
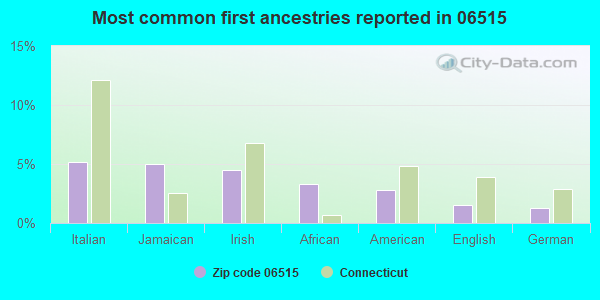
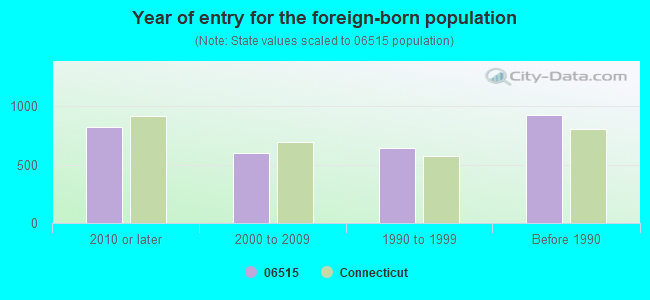


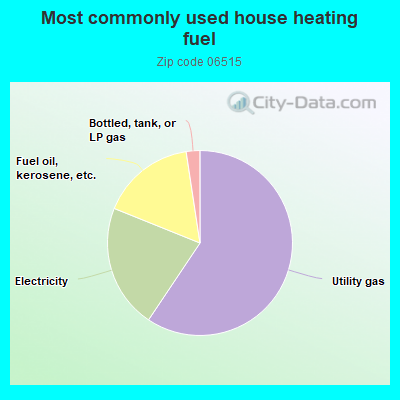
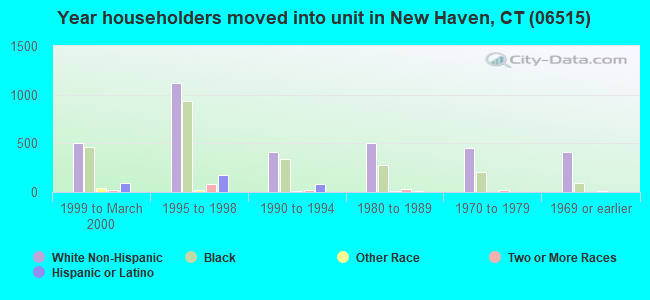
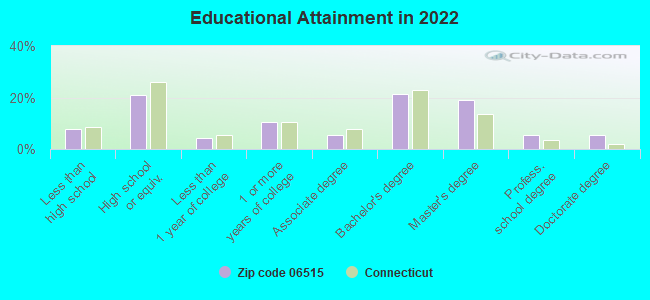
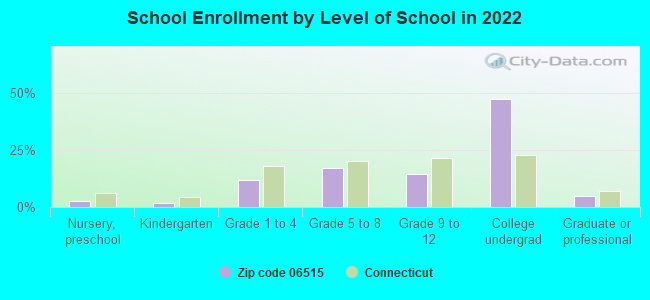
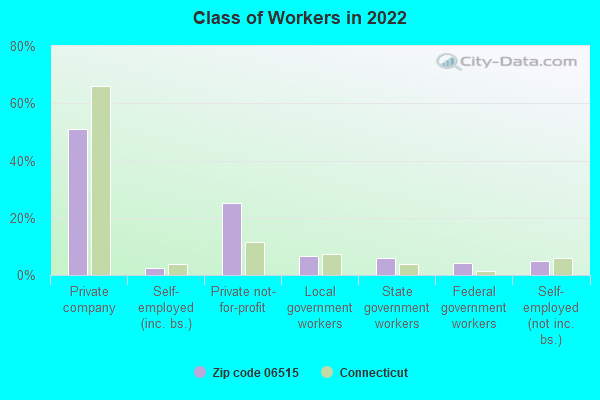
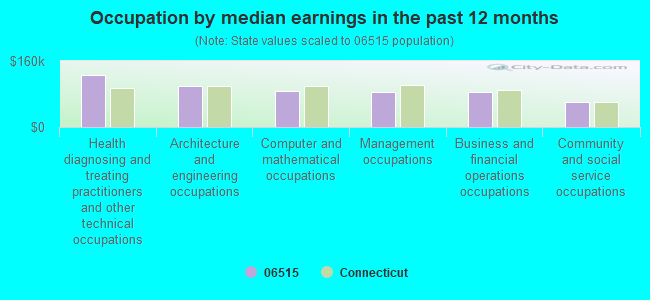
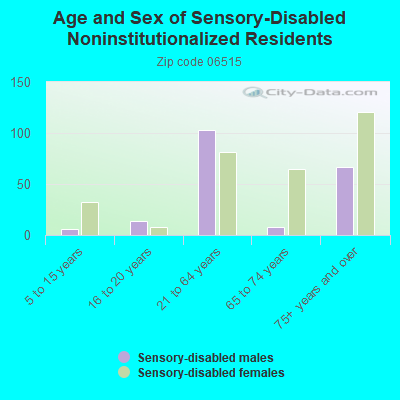
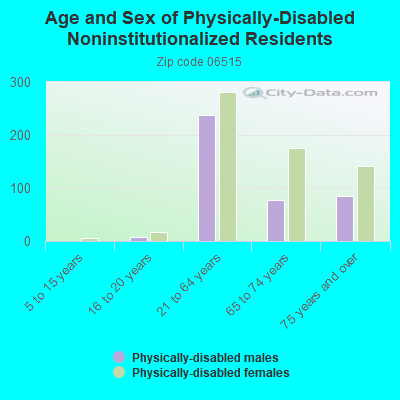
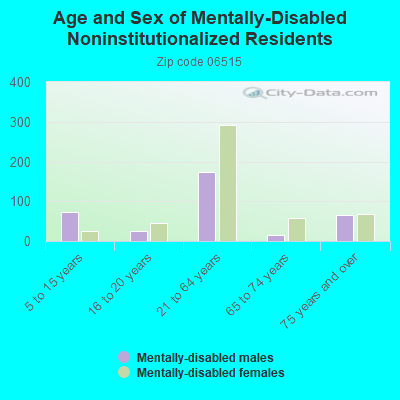
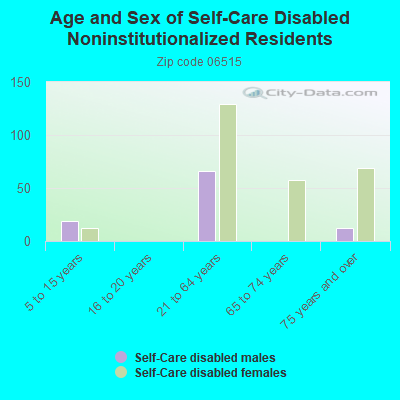
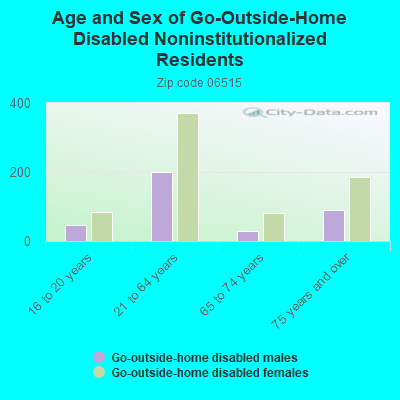
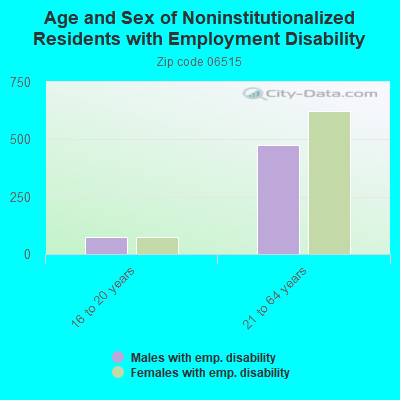
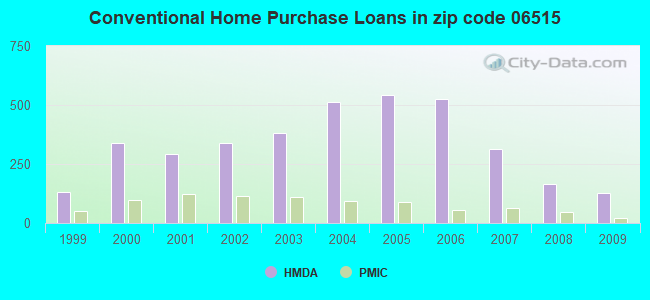
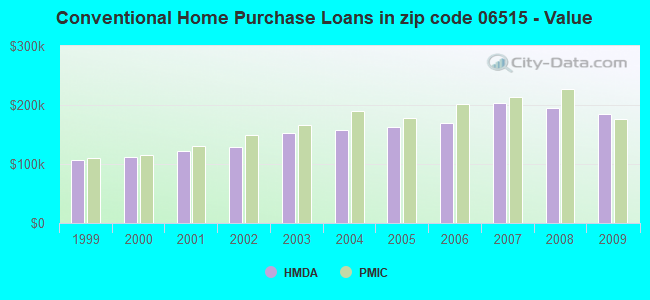
 According to the data from the years 2004 - 2018 the average number of fires per year is 34. The highest number of fires - 84 took place in 2006, and the least - 1 in 2014. The data has a growing trend.
 When looking into fire subcategories, the most reports belonged to: Structure Fires (41.5%), and Outside Fires (30.5%).