Estimated zip code population in 2022: 13,067 Zip code population in 2010: 12,108 Zip code population in 2000: 11,542
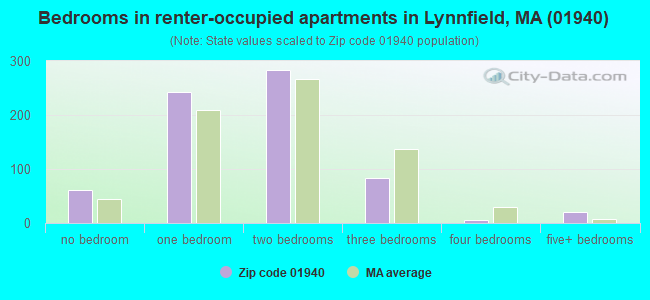
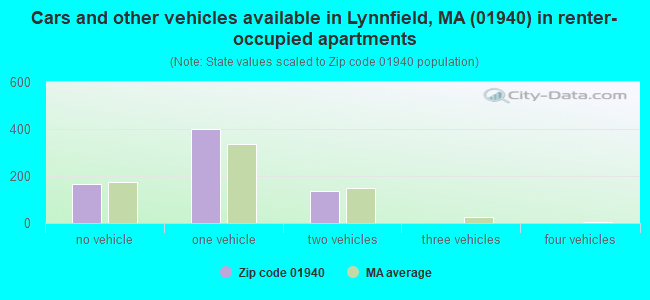
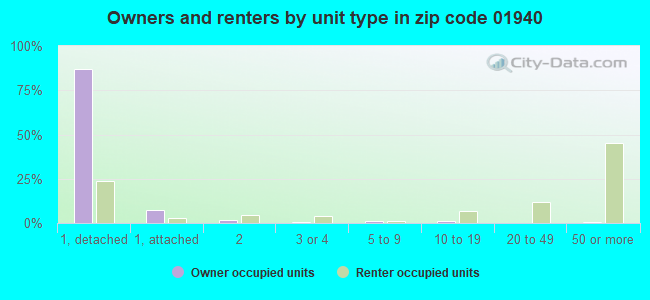
Houses and condos: 5,100 Renter-occupied apartments: 697
% of renters here:
14%
State:
38%
March 2022 cost of living index in zip code 01940: 135.3 (high, U.S. average is 100)
Land area: 10.5 sq. mi. Water area: 0.7 sq. mi.
Population density: 1,239 people per square mile
(low).
OSM Map
Google Map
MSN Map
OSM Map
General Map
Google Map
MSN Map
OSM Map
Google Map
MSN Map
OSM Map
Google Map
MSN Map
Please wait while loading the map...
Real estate property taxes paid for housing units in 2022:
This zip code:
1.0% ($9,510)
Massachusetts:
1.0% ($5,536)
Median real estate property taxes paid for housing units with mortgages in 2022: $9,472 (1.0%) Median real estate property taxes paid for housing units with no mortgage in 2022: $9,611 (1.1%)
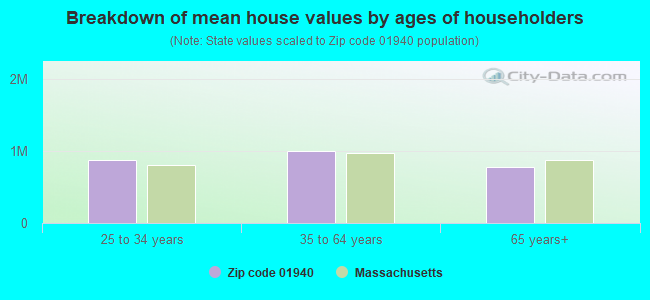
Estimated median house/condo value in 2022: $941,001
01940:
$941,001
Massachusetts:
$534,700
Median resident age:
This zip code:
41.7 years
Massachusetts median age:
40.3 years
Average household size:
This zip code:
2.7 people
Massachusetts:
2.4 people
Averages for the 2020 tax year for zip code 01940, filed in 2021:
Average Adjusted Gross Income (AGI) in 2020: $182,206 (Individual Income Tax Returns)
Here:
$182,206
State:
$105,130
Salary/wage: $132,811 (reported on 78.4% of returns)
Here:
$132,811
State:
$82,951
(% of AGI for various income ranges: 1130.3% for AGIs below $25k, 3646.4% for AGIs $25k-50k, 6362.1% for AGIs $50k-75k, 9601.8% for AGIs $75k-100k, 21296.9% for AGIs $100k-200k, 105010.0% for AGIs over 200k)
Taxable interest for individuals: $3,649 (reported on 57.1% of returns)
This zip code:
$3,649
Massachusetts:
$2,361
(% of AGI for various income ranges: 47.7% for AGIs below $25k, 96.2% for AGIs $25k-50k, 126.7% for AGIs $50k-75k, 175.3% for AGIs $75k-100k, 358.6% for AGIs $100k-200k, 2152.4% for AGIs over 200k)
Ordinary dividends: $8,909 (reported on 44.6% of returns)
Here:
$8,909
State:
$10,365
(% of AGI for various income ranges: 113.9% for AGIs below $25k, 152.2% for AGIs $25k-50k, 246.0% for AGIs $50k-75k, 411.5% for AGIs $75k-100k, 655.1% for AGIs $100k-200k, 4084.4% for AGIs over 200k)
Net capital gain/loss in AGI: +$56,057 (reported on 41.0% of returns)
Here:
+$56,057
State:
+$48,178
(% of AGI for various income ranges: 40.4% for AGIs below $25k, 135.0% for AGIs $25k-50k, 253.7% for AGIs $50k-75k, 392.4% for AGIs $75k-100k, 972.0% for AGIs $100k-200k, 32490.4% for AGIs over 200k)
Profit/loss from business: +$34,807 (reported on 17.5% of returns)
Here:
+$34,807
State:
+$20,792
(% of AGI for various income ranges: 115.2% for AGIs below $25k, 227.4% for AGIs $25k-50k, 553.0% for AGIs $50k-75k, 482.1% for AGIs $75k-100k, 1106.4% for AGIs $100k-200k, 6156.2% for AGIs over 200k)
Taxable individual retirement arrangement distribution: $27,596 (reported on 14.3% of returns)
01940:
$27,596
Massachusetts:
$22,790
(% of AGI for various income ranges: 98.9% for AGIs below $25k, 213.2% for AGIs $25k-50k, 445.1% for AGIs $50k-75k, 681.5% for AGIs $75k-100k, 1260.0% for AGIs $100k-200k, 2655.3% for AGIs over 200k)
Self-employed (Keogh) retirement plans: $27,047 (reported on 2.2% of returns)
01940:
$27,047
Massachusetts:
$26,868
(% of AGI for various income ranges: 81.3% for AGIs $100k-200k, 775.1% for AGIs over 200k)
Total itemized deductions: $35,372 (reported on 25.4% of returns)
Here:
$35,372
State:
$36,722
(% of AGI for various income ranges: 338.7% for AGIs below $25k, 482.4% for AGIs $25k-50k, 879.8% for AGIs $50k-75k, 1212.9% for AGIs $75k-100k, 2084.9% for AGIs $100k-200k, 7528.0% for AGIs over 200k)
Charity contributions: $6,447 (reported on 21.5% of returns)
Here:
$6,447
State:
$12,529
(% of AGI for various income ranges: 9.9% for AGIs below $25k, 28.2% for AGIs $25k-50k, 49.5% for AGIs $50k-75k, 100.6% for AGIs $75k-100k, 206.9% for AGIs $100k-200k, 1599.6% for AGIs over 200k)
Taxes paid: $9,439 (reported on 25.4% of returns)
01940:
$9,439
State:
$8,782
(% of AGI for various income ranges: 68.5% for AGIs below $25k, 122.2% for AGIs $25k-50k, 226.5% for AGIs $50k-75k, 402.1% for AGIs $75k-100k, 658.4% for AGIs $100k-200k, 1840.7% for AGIs over 200k)
Earned income credit: $1,317 (reported on 3.4% of returns)
Here:
$1,317
State:
$1,909
(% of AGI for various income ranges: 26.2% for AGIs below $25k, 23.4% for AGIs $25k-50k)
Percentage of individuals using paid preparers for their 2020 taxes: 92.2%
Here:
92%
State:
92%
(% for various income ranges: 91.4% for AGIs below $25k, 91.1% for AGIs $25k-50k, 93.2% for AGIs $50k-75k, 90.2% for AGIs $75k-100k, 92.0% for AGIs $100k-200k, 94.0% for AGIs over 200k)
Averages for the 2012 tax year for zip code 01940, filed in 2013:
Average Adjusted Gross Income (AGI) in 2012: $128,955 (Individual Income Tax Returns)
Here:
$128,955
State:
$81,425
Salary/wage: $102,579 (reported on 78.5% of returns)
Here:
$102,579
State:
$64,752
(% of AGI for various income ranges: 62.1% for AGIs below $25k, 64.1% for AGIs $25k-50k, 60.7% for AGIs $50k-75k, 61.7% for AGIs $75k-100k, 74.0% for AGIs $100k-200k, 57.3% for AGIs over 200k)
Taxable interest for individuals: $2,760 (reported on 60.3% of returns)
This zip code:
$2,760
Massachusetts:
$2,136
(% of AGI for various income ranges: 3.0% for AGIs below $25k, 1.7% for AGIs $25k-50k, 1.6% for AGIs $50k-75k, 1.5% for AGIs $75k-100k, 1.0% for AGIs $100k-200k, 1.3% for AGIs over 200k)
Ordinary dividends: $7,670 (reported on 44.2% of returns)
Here:
$7,670
State:
$9,473
(% of AGI for various income ranges: 5.2% for AGIs below $25k, 2.7% for AGIs $25k-50k, 2.8% for AGIs $50k-75k, 2.5% for AGIs $75k-100k, 2.4% for AGIs $100k-200k, 2.6% for AGIs over 200k)
Net capital gain/loss in AGI: +$16,405 (reported on 35.0% of returns)
Here:
+$16,405
State:
+$31,437
(% of AGI for various income ranges: 1.3% for AGIs $25k-50k, 0.6% for AGIs $50k-75k, 1.3% for AGIs $75k-100k, 1.3% for AGIs $100k-200k, 7.0% for AGIs over 200k)
Profit/loss from business: +$35,783 (reported on 17.7% of returns)
Here:
+$35,783
State:
+$20,662
(% of AGI for various income ranges: 10.1% for AGIs below $25k, 6.7% for AGIs $25k-50k, 5.9% for AGIs $50k-75k, 5.4% for AGIs $75k-100k, 5.0% for AGIs $100k-200k, 4.4% for AGIs over 200k)
Taxable individual retirement arrangement distribution: $26,739 (reported on 16.7% of returns)
01940:
$26,739
Massachusetts:
$18,892
(% of AGI for various income ranges: 7.1% for AGIs below $25k, 4.3% for AGIs $25k-50k, 5.7% for AGIs $50k-75k, 4.9% for AGIs $75k-100k, 3.6% for AGIs $100k-200k, 2.8% for AGIs over 200k)
Self-employment retirement plans: $21,460 (reported on 2.4% of returns)
01940:
$21,460
Massachusetts:
$20,669
(% of AGI for various income ranges: 0.9% for AGIs $25k-50k, 0.3% for AGIs $100k-200k, 0.5% for AGIs over 200k)
Total itemized deductions: $33,979 (17% of AGI, reported on 59.6% of returns)
Here:
$33,979
State:
$28,907
Here:
17.4% of AGI
State:
18.2% of AGI
(% of AGI for various income ranges: 28.4% for AGIs below $25k, 19.8% for AGIs $25k-50k, 20.9% for AGIs $50k-75k, 20.4% for AGIs $75k-100k, 19.6% for AGIs $100k-200k, 12.2% for AGIs over 200k)
Charity contributions: $3,209 (reported on 53.5% of returns)
Here:
$3,209
State:
$4,208
(% of AGI for various income ranges: 1.1% for AGIs below $25k, 1.2% for AGIs $25k-50k, 1.5% for AGIs $50k-75k, 1.4% for AGIs $75k-100k, 1.4% for AGIs $100k-200k, 1.3% for AGIs over 200k)
Taxes paid: $17,738 (reported on 59.6% of returns)
01940:
$17,738
State:
$13,303
(% of AGI for various income ranges: 9.2% for AGIs below $25k, 7.2% for AGIs $25k-50k, 8.9% for AGIs $50k-75k, 9.2% for AGIs $75k-100k, 9.8% for AGIs $100k-200k, 7.4% for AGIs over 200k)
Earned income credit: $1,568 (reported on 4.5% of returns)
Here:
$1,568
State:
$1,971
(% of AGI for various income ranges: 1.9% for AGIs below $25k, 0.4% for AGIs $25k-50k)
Percentage of individuals using paid preparers for their 2012 taxes: 66.1%
Here:
66%
State:
56%
(% for various income ranges: 60.5% for AGIs below $25k, 60.9% for AGIs $25k-50k, 69.6% for AGIs $50k-75k, 67.2% for AGIs $75k-100k, 66.7% for AGIs $100k-200k, 76.6% for AGIs over 200k)
Averages for the 2004 tax year for zip code 01940, filed in 2005:
Average Adjusted Gross Income (AGI) in 2004: $95,841 (Individual Income Tax Returns)
Here:
$95,841
State:
$62,877
Salary/wage: $78,683 (reported on 77.3% of returns)
Here:
$78,683
State:
$52,969
(% of AGI for various income ranges: 166.0% for AGIs below $10k, 52.3% for AGIs $10k-25k, 61.7% for AGIs $25k-50k, 62.6% for AGIs $50k-75k, 73.1% for AGIs $75k-100k, 62.2% for AGIs over 100k)
Taxable interest for individuals: $2,776 (reported on 77.2% of returns)
This zip code:
$2,776
Massachusetts:
$1,945
(% of AGI for various income ranges: 25.0% for AGIs below $10k, 7.4% for AGIs $10k-25k, 3.6% for AGIs $25k-50k, 3.1% for AGIs $50k-75k, 2.2% for AGIs $75k-100k, 1.8% for AGIs over 100k)
Taxable dividends: $4,708 (reported on 53.2% of returns)
Here:
$4,708
State:
$5,323
(% of AGI for various income ranges: 16.5% for AGIs below $10k, 5.0% for AGIs $10k-25k, 3.4% for AGIs $25k-50k, 3.3% for AGIs $50k-75k, 2.7% for AGIs $75k-100k, 2.3% for AGIs over 100k)
Net capital gain/loss: +$16,743 (reported on 45.1% of returns)
Here:
+$16,743
State:
+$20,377
(% of AGI for various income ranges: -7.9% for AGIs below $10k, -0.1% for AGIs $10k-25k, 1.0% for AGIs $25k-50k, 2.2% for AGIs $50k-75k, 1.8% for AGIs $75k-100k, 10.2% for AGIs over 100k)
Profit/loss from business: +$27,226 (reported on 20.1% of returns)
Here:
+$27,226
State:
+$17,837
(% of AGI for various income ranges: 7.6% for AGIs below $10k, 9.6% for AGIs $10k-25k, 9.7% for AGIs $25k-50k, 6.7% for AGIs $50k-75k, 4.8% for AGIs $75k-100k, 5.3% for AGIs over 100k)
IRA payment deduction: $3,752 (reported on 4.4% of returns)
01940:
$3,752
Massachusetts:
$3,100
(% of AGI for various income ranges: 0.6% for AGIs $10k-25k, 0.5% for AGIs $25k-50k, 0.3% for AGIs $50k-75k, 0.2% for AGIs $75k-100k, 0.1% for AGIs over 100k)
Self-employed pension: $17,120 (reported on 3.3% of returns)
Here:
$17,120
Massachusetts:
$14,516
(% of AGI for various income ranges: 0.3% for AGIs $25k-50k, 0.3% for AGIs $50k-75k, 0.4% for AGIs $75k-100k, 0.7% for AGIs over 100k)
Total itemized deductions: $27,358 (19% of AGI, reported on 59.7% of returns)
Here:
$27,358
State:
$22,573
Here:
18.7% of AGI
State:
19.5% of AGI
(% of AGI for various income ranges: 47.8% for AGIs below $10k, 27.9% for AGIs $10k-25k, 22.5% for AGIs $25k-50k, 23.8% for AGIs $50k-75k, 23.5% for AGIs $75k-100k, 14.5% for AGIs over 100k)
Charity contributions deductions: $2,866 (2% of AGI, reported on 56.9% of returns)
Here:
$2,866
State:
$3,295
Here:
1.9% of AGI
State:
2.7% of AGI
(% of AGI for various income ranges: 1.8% for AGIs below $10k, 1.7% for AGIs $10k-25k, 2.1% for AGIs $25k-50k, 2.1% for AGIs $50k-75k, 2.0% for AGIs $75k-100k, 1.6% for AGIs over 100k)
Total tax: $20,005 (reported on 83.0% of returns)
01940:
$20,005
State:
$11,494
(% of AGI for various income ranges: 7.9% for AGIs below $10k, 4.9% for AGIs $10k-25k, 8.5% for AGIs $25k-50k, 9.5% for AGIs $50k-75k, 9.8% for AGIs $75k-100k, 20.3% for AGIs over 100k)
Earned income credit: $1,181 (reported on 3.4% of returns)
Here:
$1,181
State:
$1,518
Percentage of individuals using paid preparers for their 2004 taxes: 67.7%
Here:
68%
State:
58%
(% for various income ranges: 58.5% for AGIs below $10k, 68.4% for AGIs $10k-25k, 66.6% for AGIs $25k-50k, 67.0% for AGIs $50k-75k, 72.3% for AGIs $75k-100k, 72.7% for AGIs over 100k)
Likely homosexual households (counted as self-reported same-sex unmarried-partner households)
Lesbian couples: 0.4% of all households
Gay men: 0.5% of all households
Household received Food Stamps/SNAP in the past 12 months: 79 Household did not receive Food Stamps/SNAP in the past 12 months: 4,646
Women who had a birth in the past 12 months: 144 (151 now married, 0 unmarried) Women who did not have a birth in the past 12 months: 2,597 (1,443 now married, 1,122 unmarried)
Housing units in zip code 01940 with a mortgage: 2,922 (576 second mortgage, 552 both second mortgage and home equity loan) Houses without a mortgage: 188
Median monthly owner costs for units with a mortgage: $3,426 Median monthly owner costs for units without a mortgage: $1,279
Residents with income below the poverty level in 2022:
This zip code:
6.7%
Whole state:
10.4%
Residents with income below 50% of the poverty level in 2022:
This zip code:
1.6%
Whole state:
5.1%
Median number of rooms in houses and condos:
Here:
7.8
State:
6.5
Median number of rooms in apartments:
Here:
3.6
State:
4.0
Notable locations in this zip code not listed on our city pages
Notable locations in zip code 01940: Colonial Golf and Country Club (A), Lynnfield Center Golf Club (B), Sagamore Springs Golf Club (C), Wakefield Industrial Center (D), Lynnfield Fire Department Station 2 (E), Summer Street School Library (F), Lynnfield Fire Department Station 1 Headquarters (G). Display/hide their locations on the map
In group quarters: 34 (-1 institutionalized population)
Size of family households: 1,429 2-persons, 1,019 3-persons, 763 4-persons, 485 5-persons, 28 6-persons, 8 7-or-more-persons
Size of nonfamily households: 948 1-person, 111 2-persons, 13 3-persons
2,825 married couples with children.
288 single-parent households (58 men, 230 women).
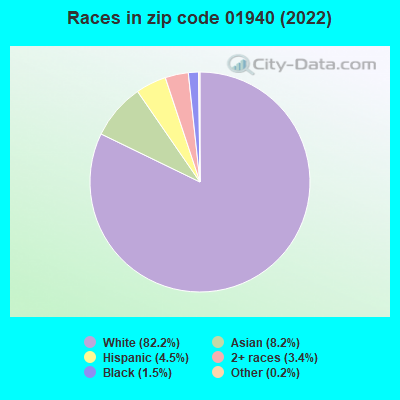
83.6% of residents of 01940 zip code speak English at home.
3.9% of residents speak Spanish at home (77% very well, 12% well, 11% not well).
6.1% of residents speak other Indo-European language at home (79% very well, 17% well, 4% not well).
6.2% of residents speak Asian or Pacific Island language at home (51% very well, 11% well, 39% not well).
0.2% of residents speak other language at home (54% well, 46% not well).
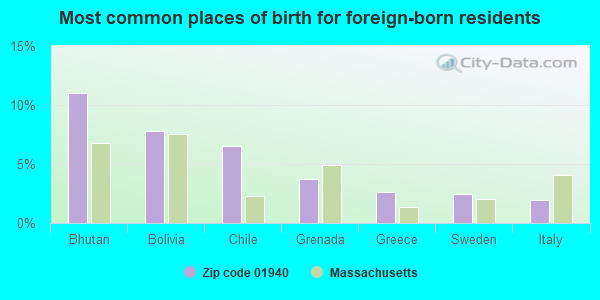
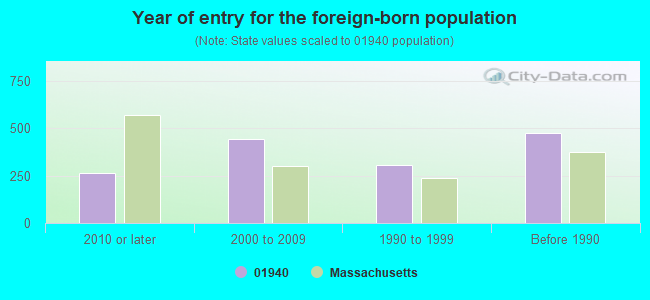
Foreign born population: 1,528 (11.7%) (76.1% of them are naturalized citizens)
This zip code:
11.7%
Whole state:
18.0%
11%Bhutan
8%Bolivia
7%Chile
4%Grenada
3%Greece
2%Sweden
2%Italy
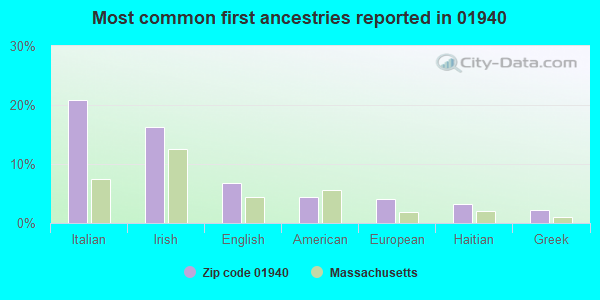
21%Italian
16%Irish
7%English
4%American
4%European
3%Haitian
2%Greek
Year of entry for the foreign-born population
2612010 or later
4432000 to 2009
3051990 to 1999
472Before 1990
Facilities with environmental interests located in this zip code:
LYNNFIELD HIGH SCHOOL (275 ESSEX STREET in LYNNFIELD, MA)
STATE MASTER (MA-EPICS) - NEI-1192010, AIR PROGRAM (National Center for Education Statistics) - STATE ID-164505
LYNNFIELD MIDDLE SCHOOL (505 MAIN ST in LYNNFIELD, MA)
AIR MINOR (AIRS/AFS) (Geographic Names Information System) COMPLIANCE ACTIVITY (Tracking inspections of insecticide, fungicide, and rodenticide, and toxic substances) (National Center for Education Statistics) - STATE ID-164405 CRITERIA AND HAZARDOUS AIR POLLUTANT INVENTORY (Inventory of air pollution sources) Business SIC classification: ELEMENTARY AND SECONDARY SCHOOLS Alternative names: LYNNFIELD PUBLIC SCHOOLS
LYNNFIELD (CITY OF LYNNFIELD in LYNNFIELD, MA)
AIR MINOR (AIRS/AFS) (Integrated Compliance Information System) - ICIS-01-1996-0096, FORMAL ENFORCEMENT ACTION, ICIS-01-1996-0097, Business SIC classification: GENERAL GOVERNMENT
MOBIL OIL CORP SS 311 (596 SALEM ST in LYNNFIELD, MA)
Conditionally Exempt Small Quantity Generators, less than 100 kg/month of hazardous waste (Resource Conservation and Recovery Act (tracking hazardous waste)) - notification Conditionally Exempt Small Quantity Generators, less than 100 kg/month of hazardous waste (Resource Conservation and Recovery Act (tracking hazardous waste)) - notification Organizations: EXXONMOBIL OIL CORPORATION (CONTACT/OPERATOR)
, MOBIL OIL INC (CONTACT/OWNER)
Alternative names: EXXONMOBIL OIL CORP, EXXONMOBIL OIL CORPORATION 13228, PO SQUARE MOBIL, POST OFFICE SQUARE MOBIL
LYNNFIELD CENTER WD - PS3 (83 PHILLIPS ROAD in LYNNFIELD, MA)
National Pollutant Discharge Elimination System NON-MAJOR (Tracking pollutant discharge elimination systems) - permit Business SIC classification: WATER SUPPLY Organizations: LYNNFIELD CENTER WATER DIST. (CONTACT/OPERATOR)
Alternative names: LYNNFIELD CENTER WATER DIST., LYNNFIELD CENTER WD -PUMP STA
BRAUN NORTH AMERICA (66 BROADWAY RTE 1 in LYNNFIELD, MA)
(Resource Conservation and Recovery Act (tracking hazardous waste)) Organizations: GILLETTE COMPANY (CONTACT/OWNER)
ADTECH INC (UNITED DR in LYNNFIELD, MA)
(Resource Conservation and Recovery Act (tracking hazardous waste))
ANTON CLEANERS INC (BROADWAY ST in LYNNFIELD, MA)
(Resource Conservation and Recovery Act (tracking hazardous waste))
JOHNSON CONTROLS INC (39 SALEM ST in LYNNFIELD, MA)
Small Quantity Generators, between 100 kg and 1000 kg of hazardous waste/month (Resource Conservation and Recovery Act (tracking hazardous waste)) - notification
KELLY JEEP EAGLE INC (353 BROADWAY RTE 1 in LYNNFIELD, MA)
Conditionally Exempt Small Quantity Generators, less than 100 kg/month of hazardous waste (Resource Conservation and Recovery Act (tracking hazardous waste)) - notification Organizations: BRIAN KELLY (CONTACT/OWNER)
Alternative names: COURTESY AMC JEEP RENAULT INC
KELLY NISSAN OF LYNNFIELD INC (275 BROADWAY RTE 1 in LYNNFIELD, MA)
Conditionally Exempt Small Quantity Generators, less than 100 kg/month of hazardous waste (Resource Conservation and Recovery Act (tracking hazardous waste)) - notification Organizations: K N L REALTY TRUSTS (CONTACT/OWNER)
MARDEN WILD CORP (40 SALEM STREET in LYNNFIELD, MA)
AIR MINOR (AIRS/AFS) Business SIC classification: SURFACE ACTIVE AGENTS, FINISHING AGENTS, SULFONATED OILS, AND ASSISTANTS
WORLD EXPRESS INC. (210 BRADFIELD ST. in LYNNFIELD, MA)
ENFORCEMENT/COMPLIANCE ACTIVITY (Integrated Compliance Information System)
Housing units lacking complete plumbing facilities: 1.9% Housing units lacking complete kitchen facilities: 3.1%
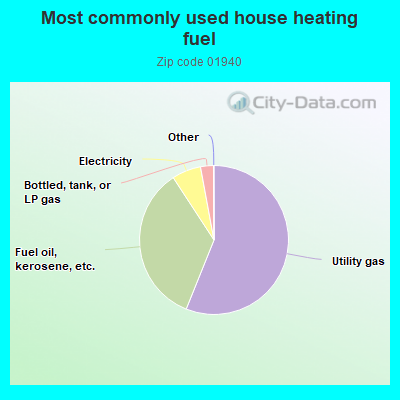
56.1%Utility gas
34.7%Fuel oil, kerosene, etc.
6.3%Electricity
2.8%Bottled, tank, or LP gas
Population in 1990: 11,274. Population change in the 1990s: +268 (+2.4%).
Place of birth for U.S.-born residents:
This state: 9,359
Northeast: 1,467
Midwest: 239
South: 341
West: 44
75% of the 01940 zip code residents lived in the same house 5 years ago. Out of people who lived in different houses, 49% lived in this county. Out of people who lived in different counties, 50% lived in Massachusetts.
91% of the 01940 zip code residents lived in the same house 1 year ago. Out of people who lived in different houses, 27% moved from this county. Out of people who lived in different houses, 42% moved from different county within same state. Out of people who lived in different houses, 32% moved from different state. Out of people who lived in different houses, 3% moved from abroad.
Private vs. public school enrollment:
Students in private schools in grades 1 to 8 (elementary and middle school): 227
Here:
14.3%
Massachusetts:
10.3%
Students in private schools in grades 9 to 12 (high school): 103
Here:
17.7%
Massachusetts:
12.3%
Students in private undergraduate colleges: 234
Here:
53.3%
Massachusetts:
51.2%
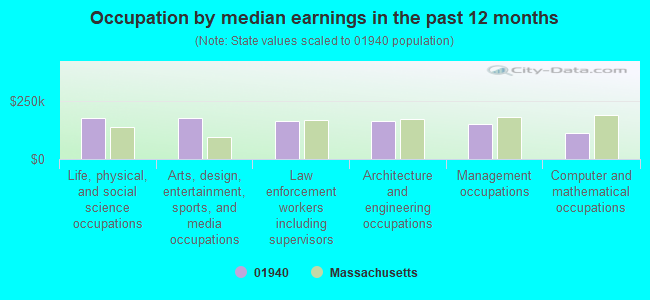
Occupation by median earnings in the past 12 months ($)
177,007Life, physical, and social science occupations
174,860Arts, design, entertainment, sports, and media occupations
164,303Law enforcement workers including supervisors
163,379Architecture and engineering occupations
151,080Management occupations
112,564Computer and mathematical occupations
Companies with federal contracts located in this zip code:
EDGE TECHNOLOGY INC (40 SALEM ST in LYNNFIELD, MA; small business) : $294,500 in 7 contractsfrom 2002 to 2006
Contracts for Electrical and Electronic assemblies, Boards, Cards, and Associated Hardware by Air Force Signed by year:2000: $0; 2001: $0; 2002: $50,000; 2003: $0; 2004: $90,225; 2005: $82,175; 2006: $72,100.
Biggest contracts:
$90,225 with Air Force for Electrical and Electronic assemblies, Boards, Cards, and Associated Hardware. Signed on 2004-04-30. Completion date: 2004-06-25.
$50,000, same as above.Signed on 2002-04-15. Completion date: 2002-05-31.
$48,000, same as above.Signed on 2006-04-27. Completion date: 2006-06-30.
$42,090, same as above.Signed on 2005-04-04. Completion date: 2005-05-16.
BUA, KATHLEEN M (4 IVANHOE DR in LYNNFIELD, MA; small business) : $33,000 in 2 contractsfrom 2003 to 2004
$26,000 with Army for Miscellaneous Items. Taking place in MD. Signed on 2004-09-24. Completion date: 2005-04-01.
$7,000 with Army for Laboratory Equipment and Supplies. Signed on 2003-09-17. Completion date: 2003-10-30.
BAYSIDE ENGINEERING ASSOCIATES (705 LOWELL ST in LYNNFIELD, MA; small business) : $635 in 9 contractsin 2002
Contracts for Architect - Engineer Services (including landscaping, interior layout, and designing) by Navy Signed by year:2000: $0; 2001: $0; 2002: $635; 2003: $0; 2004: $0; 2005: $0; 2006: $0.
Biggest contracts:
$636 with Navy for Architect - Engineer Services (including landscaping, interior layout, and designing). Taking place in RI. Signed on 2002-03-14. Completion date: 1999-06-01.
$636, same as above.Signed on 2002-03-14. Completion date: 1999-06-01.
$636, same as above.Signed on 2002-03-14. Completion date: 1999-06-01.
$635, same as above.Signed on 2002-03-14. Completion date: 1999-06-01.
Top industries in this zip code by the number of employees in 2005:
Administrative and Support and Waste Management and Remediation Services: Temporary Help Services (500-999 employees: 1 establishment, 50-99 employees: 1 establishment, 1-4 employees: 1 establishment)
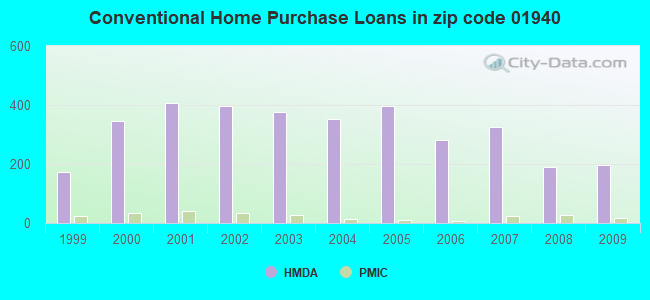
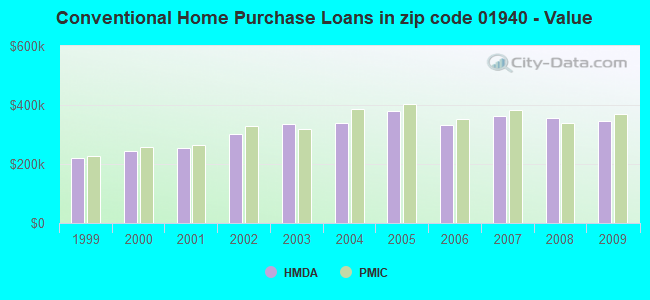
Detailed PMIC statistics for the following Tracts:2091.00
, 2092.00
2002 - 2018 National Fire Incident Reporting System (NFIRS) incidents
According to the data from the years 2002 - 2018 the average number of fires per year is 93. The highest number of reported fires - 138 took place in 2003, and the least - 58 in 2008. The data has a decreasing trend.
When looking into fire subcategories, the most incidents belonged to: Structure Fires (65.7%), and Outside Fires (26.2%).
Fire incident types reported to NFIRS in Zip Code 01940


 Nearest zip codes: 01880, 01864, 01867, 01960, 01906, 01937.
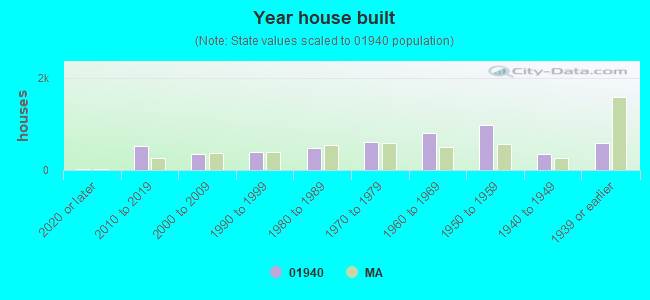


 According to the data from the years 2002 - 2018 the average number of fires per year is 93. The highest number of reported fires - 138 took place in 2003, and the least - 58 in 2008. The data has a decreasing trend.
 When looking into fire subcategories, the most incidents belonged to: Structure Fires (65.7%), and Outside Fires (26.2%).