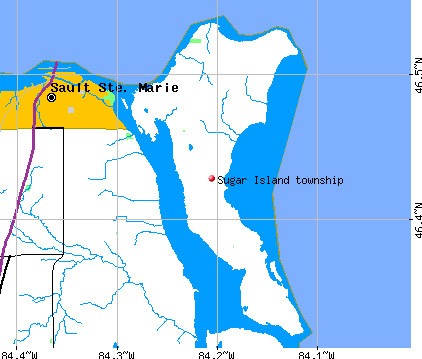
Sugar Island township, Chippewa County, Michigan (MI) detailed profile
Number of foreign born residents: 2 (88% naturalized citizens)
| Sugar Island township: | 2.3% |
| Whole state: | 5.3% |
62% of Sugar Island township residents lived in the same house 5 years ago.
Out of people who lived in different houses, 47% lived in this county.
Out of people who lived in different counties, 70% lived in Michigan.
Place of birth for U.S.-born residents:
- This state: 497
- Northeast: 14
- Midwest: 96
- South: 39
- West: 9
Median price asked for vacant for-sale houses in 2000: $18,800
Percentage of households with unmarried partners: 3.4%
Likely homosexual households (counted as self-reported same-sex unmarried-partner households)
- Lesbian couples: 0.3% of all households
- Gay men: 0.0% of all households
Housing units in structures:
- One, detached: 553
- One, attached: 3
- Mobile homes: 91
- Boats, RVs, vans, etc.: 4
Median worth of mobile homes: $30,000
Housing units in Sugar Island township with a mortgage: 55 (2 second mortgage, 8 home equity loan, 0 both second mortgage and home equity loan)
Houses without a mortgage: 82
- Construction (19%)
- Arts, entertainment, and recreation (14%)
- Accommodation and food services (11%)
- Public administration (9%)
- Other transportation, and support activities, and couriers (7%)
- Educational services (7%)
- Water transportation (5%)
- Accommodation and food services (14%)
- Public administration (14%)
- Health care (13%)
- Arts, entertainment, and recreation (12%)
- Educational services (8%)
- Professional, scientific, and technical services (5%)
- Real estate and rental and leasing (4%)
- Other management occupations except farmers and farm managers (11%)
- Rail and water transportation workers (8%)
- Electrical equipment mechanics and other installation, maintenance, and repair occupations including supervisors (8%)
- Material recording, scheduling, dispatching, and distributing workers (7%)
- Law enforcement workers including supervisors (5%)
- Material moving workers except supervisors and laborers and material movers, hand (5%)
- Bus drivers (5%)
- Other sales and related workers including supervisors (8%)
- Information and record clerks except customer service representatives (7%)
- Other office and administrative support workers including supervisors (7%)
- Secretaries and administrative assistants (6%)
- Building and grounds cleaning and maintenance occupations (5%)
- Supervisors and other personal care and service workers except personal appearance, transportation, and child care workers (5%)
- Postsecondary teachers (4%)
Most common first ancestries reported in Sugar Island township:
- German (14.1%)
- English (9.0%)
- French (except Basque) (7.4%)
- United States or American (6.0%)
- Irish (5.2%)
- Polish (4.9%)
- Scottish (3.2%)
Most common places of birth for the foreign-born residents:
- Canada (81%)
- Other Southern Europe (13%)
Means of transportation to work:
- Drove a car alone: 205 (77%)
- Carpooled: 43 (16%)
- Bus or trolley bus: 8 (3%)
- Ferryboat: 2 (1%)
- Other means: 2 (1%)
- Worked at home: 7 (3%)
Most commonly used house heating fuel:
- Bottled, tank, or LP gas (57%)
- Wood (21%)
- Electricity (11%)
- Fuel oil, kerosene, etc. (8%)
- Utility gas (2%)
- No fuel used (1%)
97.4% of residents of Sugar Island township speak English at home.
0.2% of residents speak Spanish at home (100% speak English very well).
0.5% of residents speak other Indo-European language at home (67% speak English very well, 33% speak English not well).
2.0% of residents speak other language at home (85% speak English very well, 15% speak English not well).
Household type by relationship:
Households: 682- In family households: 610 (181 male householders, 37 female householders)
193 spouses, 175 children (150 natural, 7 adopted, 18 stepchildren), 4 grandchildren, 4 brothers or sisters, 8 parents, 5 other relatives, 3 non-relatives
- In nonfamily households: 72 (36 male householders (28 living alone)), 26 female householders (25 living alone)), 10 nonrelatives
Size of family households: 123 2-persons, 52 3-persons, 30 4-persons, 10 5-persons, 3 6-persons,
Size of nonfamily households: 53 1-person, 9 2-persons,
108 married couples with children.
25 single-parent households (9 men, 16 women).
Private vs. public school enrollment:
Students in private schools in grades 1 to 8 (elementary and middle school): 6
| Here: | 9.0% |
| Michigan: | 11.2% |
Students in private schools in grades 9 to 12 (high school): 0
| Here: | 0.0% |
| Michigan: | 8.7% |
Students in private undergraduate colleges: 0
| Here: | 0.0% |
| Michigan: | 16.5% |