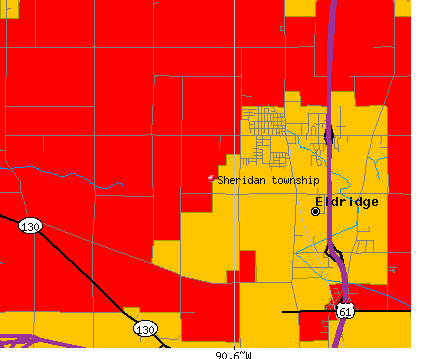
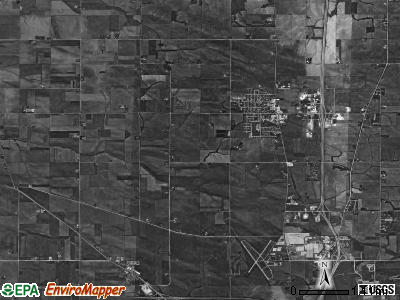
Sheridan township, Scott County, Iowa (IA) detailed profile
Number of foreign born residents: 2 (28% naturalized citizens)
| Sheridan township: | 1.7% |
| Whole state: | 3.1% |
59% of Sheridan township residents lived in the same house 5 years ago.
Out of people who lived in different houses, 55% lived in this county.
Out of people who lived in different counties, 25% lived in Iowa.
Place of birth for U.S.-born residents:
- This state: 534
- Northeast: 5
- Midwest: 47
- South: 235
- West: 52
Percentage of households with unmarried partners: 4.1%
Likely homosexual households (counted as self-reported same-sex unmarried-partner households)
- Lesbian couples: 0.0% of all households
- Gay men: 0.2% of all households
16 people in religious group quarters
Housing units in structures:
- One, detached: 305
- One, attached: 5
- 5 to 9: 2
- Mobile homes: 106
- Boats, RVs, vans, etc.: 6
Median worth of mobile homes: $19,500
Housing units in Sheridan township with a mortgage: 67 (3 second mortgage, 0 home equity loan, 0 both second mortgage and home equity loan)
Houses without a mortgage: 71
- Agriculture, forestry, fishing and hunting (16%)
- Construction (12%)
- Food (11%)
- Plastics and rubber products (8%)
- Wood products (7%)
- Metal and metal products (7%)
- Machinery (5%)
- Educational services (16%)
- Accommodation and food services (14%)
- Finance and insurance (10%)
- Health care (8%)
- Agriculture, forestry, fishing and hunting (5%)
- Food and beverage stores (5%)
- Food (4%)
- Other production occupations including supervisors (18%)
- Driver/sales workers and truck drivers (11%)
- Farmers and farm managers (8%)
- Electrical equipment mechanics and other installation, maintenance, and repair occupations including supervisors (6%)
- Agricultural workers including supervisors (4%)
- Religious workers (4%)
- Other sales and related workers including supervisors (4%)
- Other production occupations including supervisors (16%)
- Preschool, kindergarten, elementary and middle school teachers (13%)
- Cooks and food preparation workers (9%)
- Secretaries and administrative assistants (8%)
- Cashiers (7%)
- Building and grounds cleaning and maintenance occupations (7%)
- Information and record clerks except customer service representatives (5%)
Most common first ancestries reported in Sheridan township:
- United States or American (36.7%)
- Irish (9.3%)
- English (8.1%)
- German (7.5%)
- European (1.4%)
- British (1.1%)
- Scottish (0.8%)
Most common places of birth for the foreign-born residents:
- Mexico (88%)
- Vietnam (10%)
- France (3%)
Means of transportation to work:
- Drove a car alone: 299 (74%)
- Carpooled: 64 (16%)
- Bus or trolley bus: 2 (0%)
- Walked: 2 (0%)
- Other means: 2 (0%)
- Worked at home: 34 (8%)
Most commonly used house heating fuel:
- Utility gas (41%)
- Electricity (26%)
- Bottled, tank, or LP gas (23%)
- Wood (11%)
16 people in religious group quarters
87.3% of residents of Sheridan township speak English at home.
10.6% of residents speak Spanish at home (43% speak English very well, 11% speak English well, 32% speak English not well, 15% don't speak English at all).
0.6% of residents speak other Indo-European language at home (100% speak English very well).
1.5% of residents speak Asian or Pacific Island language at home (38% speak English very well, 38% speak English well, 23% speak English not well).
Household type by relationship:
Households: 956- In family households: 864 (212 male householders, 35 female householders)
224 spouses, 327 children (274 natural, 8 adopted, 45 stepchildren), 14 grandchildren, 11 brothers or sisters, 8 parents, 26 other relatives, 7 non-relatives
- In nonfamily households: 92 (32 male householders (26 living alone)), 36 female householders (36 living alone)), 24 nonrelatives
Size of family households: 80 2-persons, 65 3-persons, 57 4-persons, 26 5-persons, 7 6-persons, 12 7-or-more-persons,
Size of nonfamily households: 62 1-person, 2 2-persons, 4 6-persons,
1,109 married couples with children.
282 single-parent households (47 men, 235 women).
Private vs. public school enrollment:
Students in private schools in grades 1 to 8 (elementary and middle school): 3
| Here: | 2.5% |
| Iowa: | 10.8% |
Students in private schools in grades 9 to 12 (high school): 0
| Here: | 0.0% |
| Iowa: | 7.1% |
Students in private undergraduate colleges: 4
| Here: | 10.5% |
| Iowa: | 25.4% |