Races in Williamsburg, Virginia (VA) Detailed Stats
Data:
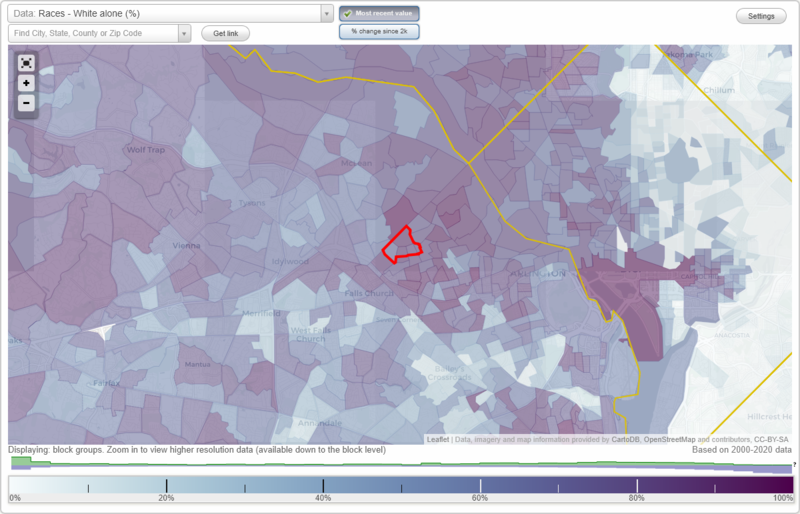
Races - White alone (%)
Races - White alone (% change since 2000)
Races - Black alone (%)
Races - Black alone (% change since 2000)
Races - American Indian alone (%)
Races - American Indian alone (% change since 2000)
Races - Asian alone (%)
Races - Asian alone (% change since 2000)
Races - Hispanic (%)
Races - Hispanic (% change since 2000)
Races - Native Hawaiian and Other Pacific Islander alone (%)
Races - Native Hawaiian and Other Pacific Islander alone (% change since 2000)
Races - Two or more races(%)
Races - Two or more races(% change since 2000)
Races - Other race alone (%)
Races - Other race alone (% change since 2000)
Racial diversity
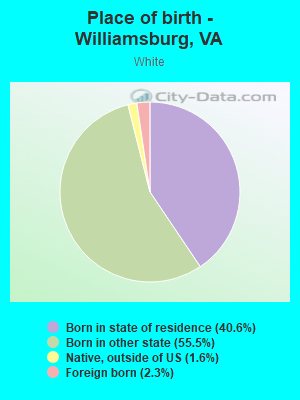
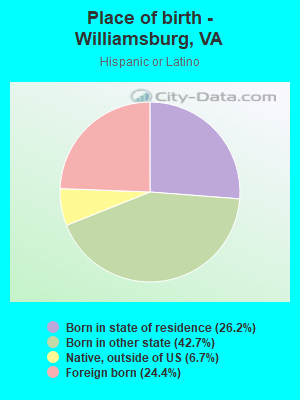
Place of birth - Born in state of residence (%)
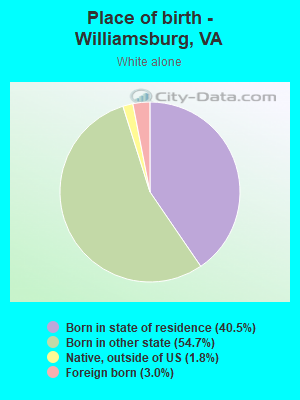
Place of birth - Born in state of residence (%) - White
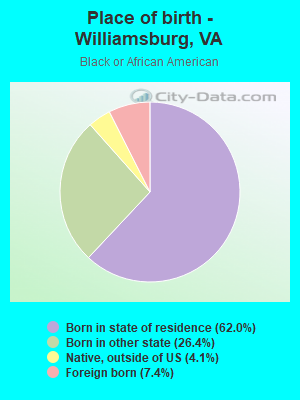
Place of birth - Born in state of residence (%) - Black or African American
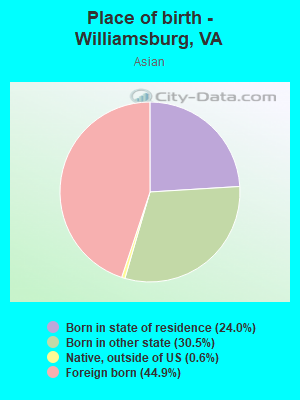
Place of birth - Born in state of residence (%) - Asian
Place of birth - Born in state of residence (%) - Hispanic or Latino
Place of birth - Born in state of residence (%) - American Indian and Alaska Native
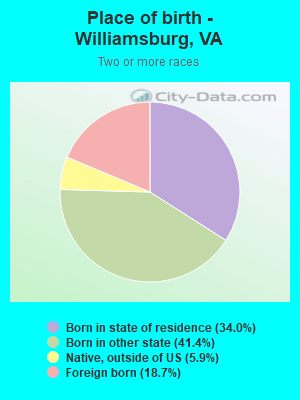
Place of birth - Born in state of residence (%) - Multirace
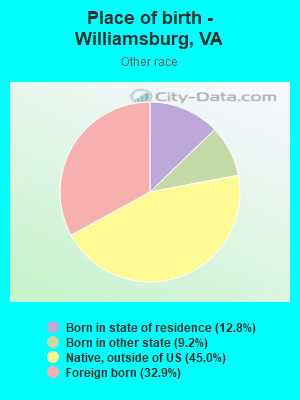
Place of birth - Born in state of residence (%) - Other Race
Place of birth - Born in other state (%)
Place of birth - Born in other state (%) - White
Place of birth - Born in other state (%) - Black or African American
Place of birth - Born in other state (%) - Asian
Place of birth - Born in other state (%) - Hispanic or Latino
Place of birth - Born in other state (%) - American Indian and Alaska Native
Place of birth - Born in other state (%) - Multirace
Place of birth - Born in other state (%) - Other Race
Place of birth - Native, outside of US (%)
Place of birth - Native, outside of US (%) - White
Place of birth - Native, outside of US (%) - Black or African American
Place of birth - Native, outside of US (%) - Asian
Place of birth - Native, outside of US (%) - Hispanic or Latino
Place of birth - Native, outside of US (%) - American Indian and Alaska Native
Place of birth - Native, outside of US (%) - Multirace
Place of birth - Native, outside of US (%) - Other Race
Place of birth - Foreign born (%)
Place of birth - Foreign born (%) - White
Place of birth - Foreign born (%) - Black or African American
Place of birth - Foreign born (%) - Asian
Place of birth - Foreign born (%) - Hispanic or Latino
Place of birth - Foreign born (%) - American Indian and Alaska Native
Place of birth - Foreign born (%) - Multirace
Place of birth - Foreign born (%) - Other Race
Residents speaking English at home (%)
Residents speaking English at home - Born in the United States (%)
Residents speaking English at home - Native, born elsewhere (%)
Residents speaking English at home - Foreign born (%)
Residents speaking Spanish at home (%)
Residents speaking Spanish at home - Born in the United States (%)
Residents speaking Spanish at home - Native, born elsewhere (%)
Residents speaking Spanish at home - Foreign born (%)
Residents speaking other language at home (%)
Residents speaking other language at home - Born in the United States (%)
Residents speaking other language at home - Native, born elsewhere (%)
Residents speaking other language at home - Foreign born (%)
Marital status - Never married (%)
Marital status - Now married (%)
Marital status - Separated (%)
Marital status - Widowed (%)
Marital status - Divorced (%)
Ancestries Reported - Arab (%)
Ancestries Reported - Czech (%)
Ancestries Reported - Danish (%)
Ancestries Reported - Dutch (%)
Ancestries Reported - English (%)
Ancestries Reported - French (%)
Ancestries Reported - French Canadian (%)
Ancestries Reported - German (%)
Ancestries Reported - Greek (%)
Ancestries Reported - Hungarian (%)
Ancestries Reported - Irish (%)
Ancestries Reported - Italian (%)
Ancestries Reported - Lithuanian (%)
Ancestries Reported - Norwegian (%)
Ancestries Reported - Polish (%)
Ancestries Reported - Portuguese (%)
Ancestries Reported - Russian (%)
Ancestries Reported - Scotch-Irish (%)
Ancestries Reported - Scottish (%)
Ancestries Reported - Slovak (%)
Ancestries Reported - Subsaharan African (%)
Ancestries Reported - Swedish (%)
Ancestries Reported - Swiss (%)
Ancestries Reported - Ukrainian (%)
Ancestries Reported - United States (%)
Ancestries Reported - Welsh (%)
Ancestries Reported - West Indian (%)
Ancestries Reported - Other (%)
Geographical mobility - Same house 1 year ago (%)
Geographical mobility - Same house 1 year ago (%) - White
Geographical mobility - Same house 1 year ago (%) - Black or African American
Geographical mobility - Same house 1 year ago (%) - Asian
Geographical mobility - Same house 1 year ago (%) - Hispanic or Latino
Geographical mobility - Same house 1 year ago (%) - American Indian and Alaska Native
Geographical mobility - Same house 1 year ago (%) - Multirace
Geographical mobility - Same house 1 year ago (%) - Other Race
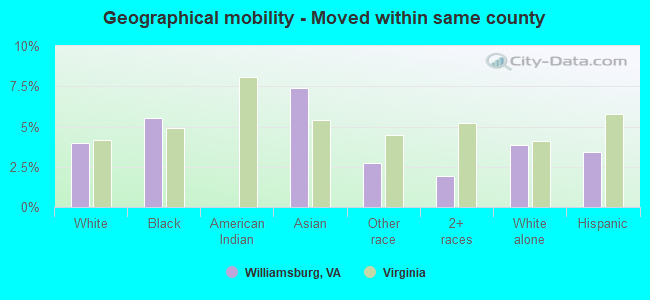
Geographical mobility - Moved within same county (%)
Geographical mobility - Moved within same county (%) - White
Geographical mobility - Moved within same county (%) - Black or African American
Geographical mobility - Moved within same county (%) - Asian
Geographical mobility - Moved within same county (%) - Hispanic or Latino
Geographical mobility - Moved within same county (%) - American Indian and Alaska Native
Geographical mobility - Moved within same county (%) - Multirace
Geographical mobility - Moved within same county (%) - Other Race
Geographical mobility - Moved from different county within same state (%)
Geographical mobility - Moved from different county within same state (%) - White
Geographical mobility - Moved from different county within same state (%) - Black or African American
Geographical mobility - Moved from different county within same state (%) - Asian
Geographical mobility - Moved from different county within same state (%) - Hispanic or Latino
Geographical mobility - Moved from different county within same state (%) - American Indian and Alaska Native
Geographical mobility - Moved from different county within same state (%) - Multirace
Geographical mobility - Moved from different county within same state (%) - Other Race
Geographical mobility - Moved from different state (%)
Geographical mobility - Moved from different state (%) - White
Geographical mobility - Moved from different state (%) - Black or African American
Geographical mobility - Moved from different state (%) - Asian
Geographical mobility - Moved from different state (%) - Hispanic or Latino
Geographical mobility - Moved from different state (%) - American Indian and Alaska Native
Geographical mobility - Moved from different state (%) - Multirace
Geographical mobility - Moved from different state (%) - Other Race
Geographical mobility - Moved from abroad (%)
Geographical mobility - Moved from abroad (%) - White
Geographical mobility - Moved from abroad (%) - Black or African American
Geographical mobility - Moved from abroad (%) - Asian
Geographical mobility - Moved from abroad (%) - Hispanic or Latino
Geographical mobility - Moved from abroad (%) - American Indian and Alaska Native
Geographical mobility - Moved from abroad (%) - Multirace
Geographical mobility - Moved from abroad (%) - Other Race
Place of birth for the foreign-born population - Ireland (%)
Place of birth for the foreign-born population - Denmark (%)
Place of birth for the foreign-born population - Norway (%)
Place of birth for the foreign-born population - Sweden (%)
Place of birth for the foreign-born population - United Kingdom (%)
Place of birth for the foreign-born population - England (%)
Place of birth for the foreign-born population - Scotland (%)
Place of birth for the foreign-born population - Other Northern Europe (%)
Place of birth for the foreign-born population - Austria (%)
Place of birth for the foreign-born population - Belgium (%)
Place of birth for the foreign-born population - France (%)
Place of birth for the foreign-born population - Germany (%)
Place of birth for the foreign-born population - Netherlands (%)
Place of birth for the foreign-born population - Switzerland (%)
Place of birth for the foreign-born population - Other Western Europe (%)
Place of birth for the foreign-born population - Greece (%)
Place of birth for the foreign-born population - Italy (%)
Place of birth for the foreign-born population - Portugal (%)
Place of birth for the foreign-born population - Spain (%)
Place of birth for the foreign-born population - Other Southern Europe (%)
Place of birth for the foreign-born population - Albania (%)
Place of birth for the foreign-born population - Belarus (%)
Place of birth for the foreign-born population - Bosnia and Herzegovina (%)
Place of birth for the foreign-born population - Bulgaria (%)
Place of birth for the foreign-born population - Croatia (%)
Place of birth for the foreign-born population - Czechoslovakia (%)
Place of birth for the foreign-born population - Hungary (%)
Place of birth for the foreign-born population - Latvia (%)
Place of birth for the foreign-born population - Lithuania (%)
Place of birth for the foreign-born population - North Macedonia (Macedonia) (%)
Place of birth for the foreign-born population - Moldova (%)
Place of birth for the foreign-born population - Poland (%)
Place of birth for the foreign-born population - Romania (%)
Place of birth for the foreign-born population - Russia (%)
Place of birth for the foreign-born population - Serbia (%)
Place of birth for the foreign-born population - Ukraine (%)
Place of birth for the foreign-born population - Other Eastern Europe (%)
Place of birth for the foreign-born population - China (%)
Place of birth for the foreign-born population - Hong Kong (%)
Place of birth for the foreign-born population - Taiwan (%)
Place of birth for the foreign-born population - Japan (%)
Place of birth for the foreign-born population - Korea (%)
Place of birth for the foreign-born population - Other Eastern Asia (%)
Place of birth for the foreign-born population - Afghanistan (%)
Place of birth for the foreign-born population - Bangladesh (%)
Place of birth for the foreign-born population - India (%)
Place of birth for the foreign-born population - Iran (%)
Place of birth for the foreign-born population - Kazakhstan (%)
Place of birth for the foreign-born population - Nepal (%)
Place of birth for the foreign-born population - Pakistan (%)
Place of birth for the foreign-born population - Sri Lanka (%)
Place of birth for the foreign-born population - Uzbekistan (%)
Place of birth for the foreign-born population - Other South Central Asia (%)
Place of birth for the foreign-born population - Burma (%)
Place of birth for the foreign-born population - Cambodia (%)
Place of birth for the foreign-born population - Indonesia (%)
Place of birth for the foreign-born population - Laos (%)
Place of birth for the foreign-born population - Malaysia (%)
Place of birth for the foreign-born population - Philippines (%)
Place of birth for the foreign-born population - Singapore (%)
Place of birth for the foreign-born population - Thailand (%)
Place of birth for the foreign-born population - Vietnam (%)
Place of birth for the foreign-born population - Other South Eastern Asia (%)
Place of birth for the foreign-born population - Armenia (%)
Place of birth for the foreign-born population - Iraq (%)
Place of birth for the foreign-born population - Israel (%)
Place of birth for the foreign-born population - Jordan (%)
Place of birth for the foreign-born population - Kuwait (%)
Place of birth for the foreign-born population - Lebanon (%)
Place of birth for the foreign-born population - Saudi Arabia (%)
Place of birth for the foreign-born population - Syria (%)
Place of birth for the foreign-born population - Turkey (%)
Place of birth for the foreign-born population - Yemen (%)
Place of birth for the foreign-born population - Other Western Asia (%)
Place of birth for the foreign-born population - Eritrea (%)
Place of birth for the foreign-born population - Ethiopia (%)
Place of birth for the foreign-born population - Kenya (%)
Place of birth for the foreign-born population - Somalia (%)
Place of birth for the foreign-born population - Uganda (%)
Place of birth for the foreign-born population - Zimbabwe (%)
Place of birth for the foreign-born population - Other Eastern Africa (%)
Place of birth for the foreign-born population - Cameroon (%)
Place of birth for the foreign-born population - Congo (%)
Place of birth for the foreign-born population - Democratic Republic of Congo (Zaire) (%)
Place of birth for the foreign-born population - Other Middle Africa (%)
Place of birth for the foreign-born population - Egypt (%)
Place of birth for the foreign-born population - Morocco (%)
Place of birth for the foreign-born population - Sudan (%)
Place of birth for the foreign-born population - Other Northern Africa (%)
Place of birth for the foreign-born population - South Africa (%)
Place of birth for the foreign-born population - Other Southern Africa (%)
Place of birth for the foreign-born population - Cabo Verde (%)
Place of birth for the foreign-born population - Ghana (%)
Place of birth for the foreign-born population - Liberia (%)
Place of birth for the foreign-born population - Nigeria (%)
Place of birth for the foreign-born population - Senegal (%)
Place of birth for the foreign-born population - Sierra Leone (%)
Place of birth for the foreign-born population - Other Western Africa (%)
Place of birth for the foreign-born population - Australia (%)
Place of birth for the foreign-born population - New Zealand (%)
Place of birth for the foreign-born population - Fiji (%)
Place of birth for the foreign-born population - Micronesia (%)
Place of birth for the foreign-born population - Bahamas (%)
Place of birth for the foreign-born population - Barbados (%)
Place of birth for the foreign-born population - Cuba (%)
Place of birth for the foreign-born population - Dominica (%)
Place of birth for the foreign-born population - Dominican Republic (%)
Place of birth for the foreign-born population - Grenada (%)
Place of birth for the foreign-born population - Haiti (%)
Place of birth for the foreign-born population - Jamaica (%)
Place of birth for the foreign-born population - St. Vincent and the Grenadines (%)
Place of birth for the foreign-born population - Trinidad and Tobago (%)
Place of birth for the foreign-born population - West Indies (%)
Place of birth for the foreign-born population - Other Caribbean (%)
Place of birth for the foreign-born population - Belize (%)
Place of birth for the foreign-born population - Costa Rica (%)
Place of birth for the foreign-born population - El Salvador (%)
Place of birth for the foreign-born population - Guatemala (%)
Place of birth for the foreign-born population - Honduras (%)
Place of birth for the foreign-born population - Mexico (%)
Place of birth for the foreign-born population - Nicaragua (%)
Place of birth for the foreign-born population - Panama (%)
Place of birth for the foreign-born population - Other Central America (%)
Place of birth for the foreign-born population - Argentina (%)
Place of birth for the foreign-born population - Bolivia (%)
Place of birth for the foreign-born population - Brazil (%)
Place of birth for the foreign-born population - Chile (%)
Place of birth for the foreign-born population - Colombia (%)
Place of birth for the foreign-born population - Ecuador (%)
Place of birth for the foreign-born population - Guyana (%)
Place of birth for the foreign-born population - Peru (%)
Place of birth for the foreign-born population - Uruguay (%)
Place of birth for the foreign-born population - Venezuela (%)
Place of birth for the foreign-born population - Other South America (%)
Place of birth for the foreign-born population - Canada (%)
Place of birth for the foreign-born population - Other Northern America (%)
Place of birth for the foreign-born population - Other (%)
Latest news about races in Williamsburg, VA collected exclusively by city-data.com from local newspapers, TV, and radio stations
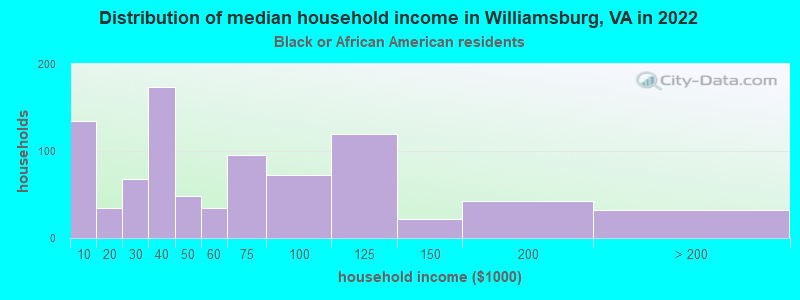
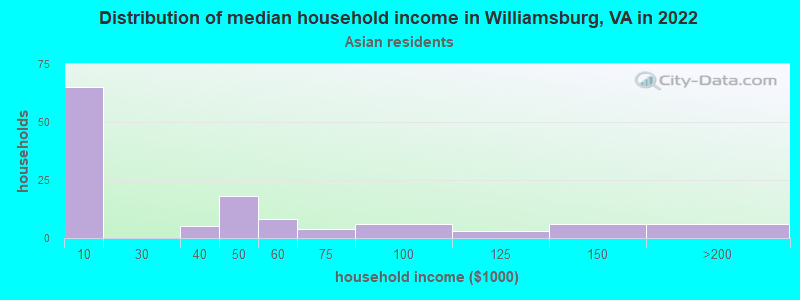
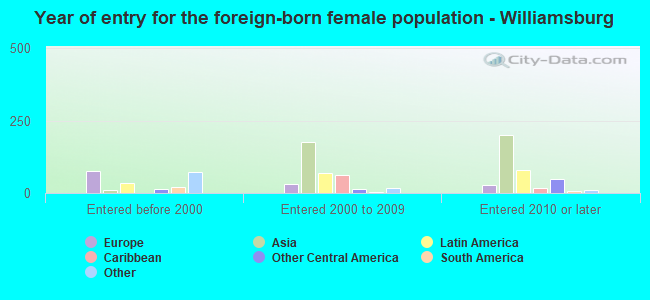
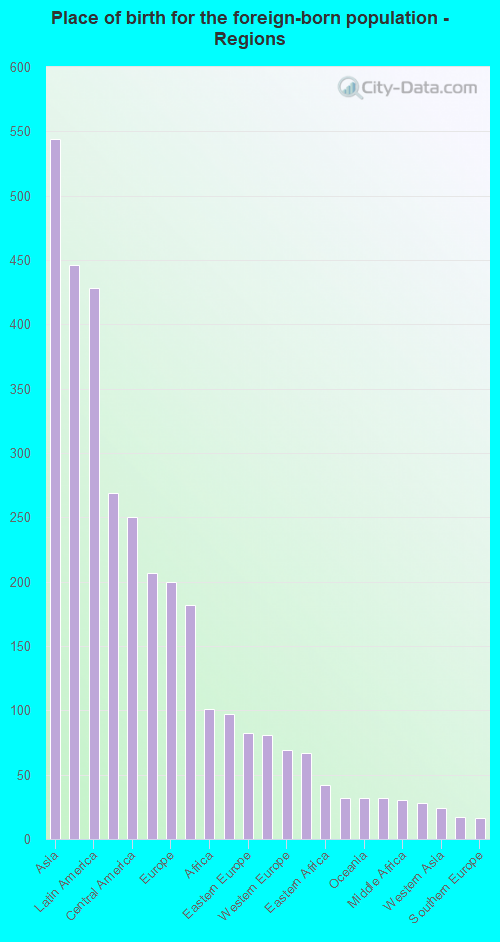
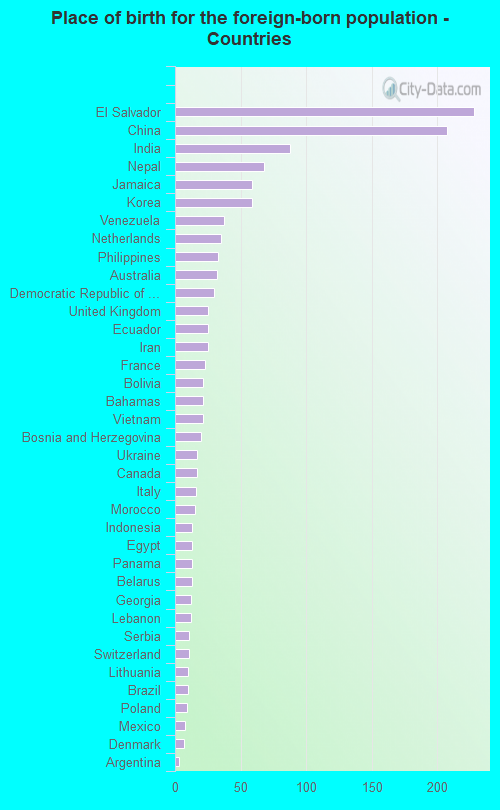
According to 2022 data, the most numerous races in Williamsburg, VA are White alone (10,332 residents), Black alone (2,337 residents), and Hispanic (1,244 residents). 85.2% of Williamsburg residents speak English at home. 8.5% of Williamsburg, VA residents are foreign-born (3.5% born in Asia, 2.7% born in Latin America, 1.3% born in Europe), which is 41.2% less than the foreign-born rate of 12.0% across the entire state of Virginia.
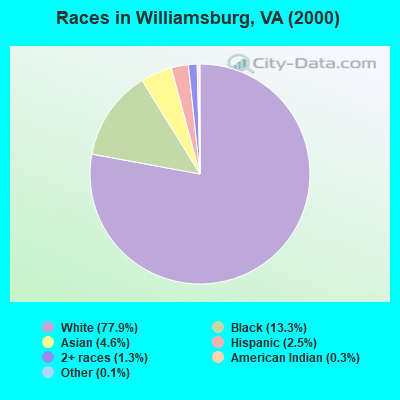
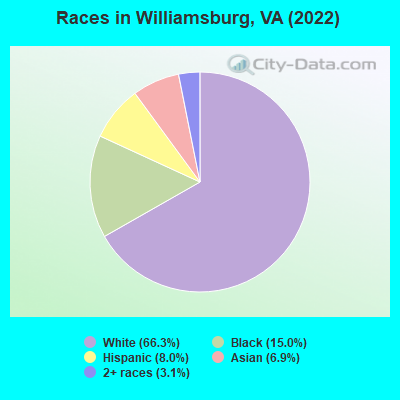
Race distribution in Williamsburg
2000 2022
4,965,637 70.2% White alone 1,376,378 19.4% Black alone 329,540 4.7% Hispanic 259,277 3.7% Asian alone 114,022 1.6% Two or more races 18,596 0.3% American Indian alone 11,685 0.2% Other race alone 3,380 0.05% Native Hawaiian and Other
5,095,130 58.7% White alone 1,594,785 18.4% Black alone 905,750 10.4% Hispanic 602,881 6.9% Asian alone 406,047 4.7% Two or more races 60,419 0.7% Other race alone 11,738 0.1% American Indian alone 6,869 0.08% Native Hawaiian and Other
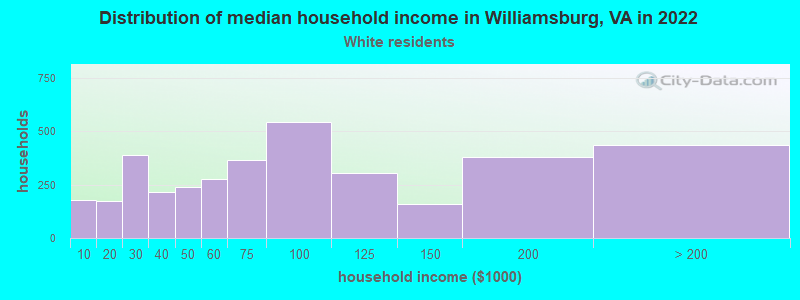
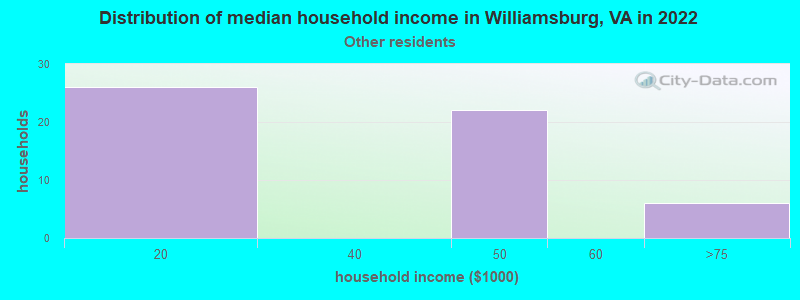
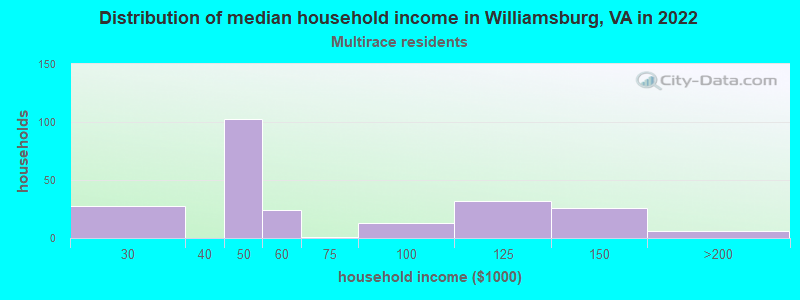
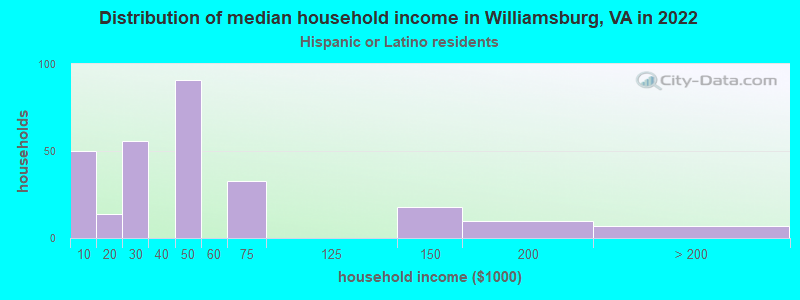
Income and house value in Williamsburg Median household income in 2022 $74,813 White non-Hispanic householders$49,013 Black householders$48,905 Two or more races householders$46,260 Hispanic or Latino race householdersMedian 2022 house value $536,295 White Non-Hispanic householders$158,927 Black or African American householders $468,802 Asian householders$601,052 Some other race householders$327,888 Hispanic or Latino householders
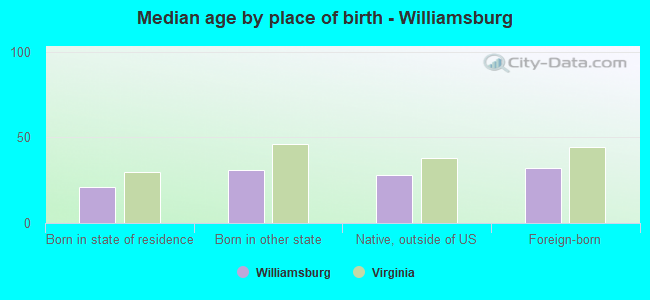
Median age by race in Williamsburg
27.7 Median age for White residents27.7 27.7 33.6 Median age for Black or African American residents32.0 35.0 -682,215,742.8 Median age for American Indian / Alaska Native residents-682,352,940.5 -687,861,271.0 20.2 Median age for Asian residents20.5 20.2 -611,955,419.9 Median age for Native Hawaiian / Pacific Islander residents-541,531,822.5 -714,150,046.8 25.2 Median age for Other race residents24.5 35.5 21.3 Median age for Two or more races residents19.7 21.9 28.3 Median age for White alone residents28.4 28.5 20.4 Median age for Hispanic or Latino residents20.1 20.5
Owner/renter occupied households by race in Williamsburg
House owners and renters - White residents 2,172 60.0% Owner occupied1,447 40.0% Renter occupiedHouse owners and renters - Black or African American residents 253 29.6% Owner occupied603 70.4% Renter occupiedHouse owners and renters - American Indian / Alaska Native residents 30 100.0% Renter occupiedHouse owners and renters - Asian residents 16 13.6% Owner occupied101 86.4% Renter occupiedHouse owners and renters - Other race residents 15 32.1% Owner occupied31 67.9% Renter occupiedHouse owners and renters - Two or more races residents 70 27.9% Owner occupied179 72.1% Renter occupiedHouse owners and renters - White alone residents 2,198 60.9% Owner occupied1,414 39.1% Renter occupiedHouse owners and renters - Hispanic or Latino residents 35 12.3% Owner occupied248 87.7% Renter occupied
Language usage in Williamsburg
English speakers - Total 85.2% of residents of Williamsburg speak English at home.
4.2% of residents speak Spanish at home 417 64.5% Speak English very well230 35.5% Speak English less than very well10.4% of residents speak other language at home 1,432 89.8% Speak English very well163 10.2% Speak English less than very well
English speakers - Born in the United States 92.1% of residents of Williamsburg speak English at home.
1.6% of residents speak Spanish at home 88 74.6% Speak English very well30 25.4% Speak English less than very well6.3% of residents speak other language at home 442 95.3% Speak English very well22 4.7% Speak English less than very well
English speakers - Native, born elsewhere 51.2% of residents of Williamsburg speak English at home.
20.4% of residents speak Spanish at home 90 100.0% Speak English very well29.0% of residents speak other language at home 128 100.0% Speak English very well
English speakers - Foreign-born 20.7% of residents of Williamsburg speak English at home.
24.9% of residents speak Spanish at home 159 48.0% Speak English very well172 52.0% Speak English less than very well53.6% of residents speak other language at home 602 84.7% Speak English very well109 15.3% Speak English less than very well
White (Caucasian) - Speak only English Native:
96.3% (9,589)Foreign-born:
54.1% (130)
White (Caucasian) - Speak another language Native:
3.5% (353)Foreign-born:
51.7% (124)
Black or African American - Speak only English Native:
95.2% (1,958)Foreign-born:
42.6% (75)
Black or African American - Speak another language Native:
4.9% (101)Foreign-born:
54.5% (96)
Asian - Speak only English Native:
45.6% (288)Foreign-born:
8.7% (44)
Asian - Speak another language Native:
55.4% (350)Foreign-born:
90.9% (461)
Other race - Speak another language Native:
81.0% (112)Foreign-born:
98.4% (68)
Two or more races - Speak another language Native:
26.7% (295)Foreign-born:
100.0% (279)
White alone - Speak only English Native:
95.7% (9,463)Foreign-born:
44.1% (139)
White alone - Speak another language Native:
4.3% (423)Foreign-born:
54.9% (172)
Hispanic or Latino - Speak another language Native:
33.8% (309)Foreign-born:
99.6% (308)
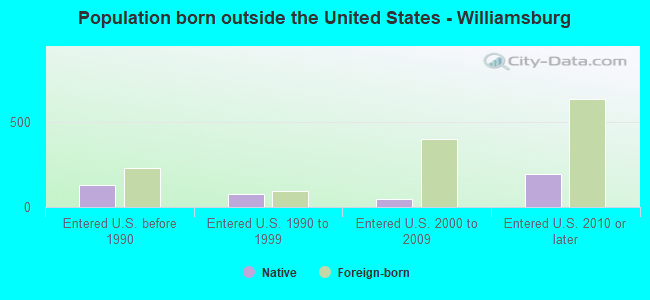
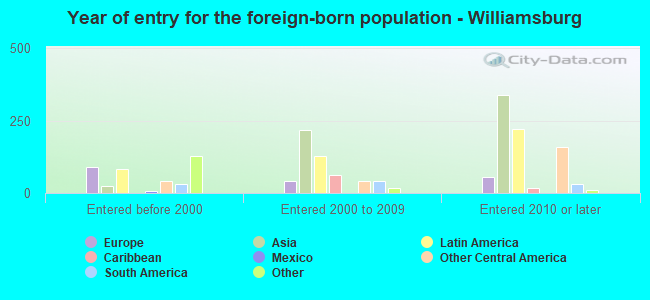
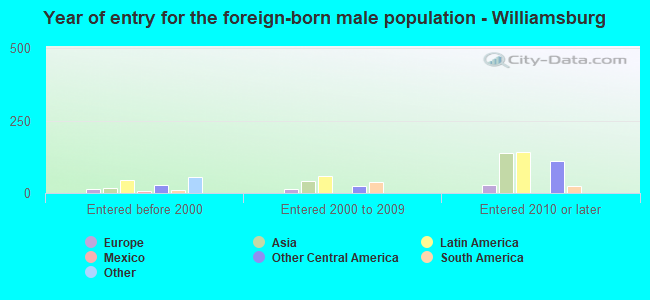
Foreign-born residents in Williamsburg 1,325 residents are foreign born (3.5% Asia , 2.7% Latin America , 1.3% Europe ).
This city:
8.5%Virginia:
12.6%
Marital status for residents in Williamsburg Marital status - White (Caucasian) population 15 years and over
Males 57.2% Never married35.2% Now married0.5% Separated3.2% Widowed4.0% DivorcedFemales 57.3% Never married28.7% Now married0.4% Separated7.1% Widowed6.5% DivorcedWomen who gave birth in the past 12 months Now married:
18.8% (15)Unmarried:
81.2% (65)
Women who did not give birth in the past 12 months Now married:
14.8% (460)Unmarried:
85.2% (2,646)
Marital status - Black or African American population 15 years and over
Males 51.0% Never married30.4% Now married0.5% Separated4.2% Widowed14.0% DivorcedFemales 64.2% Never married19.7% Now married0.6% Separated4.7% Widowed10.8% DivorcedWomen who gave birth in the past 12 months Now married:
0.0% (0)Unmarried:
100.0% (3)
Women who did not give birth in the past 12 months Now married:
8.1% (59)Unmarried:
91.9% (677)
Marital status - Asian population 15 years and over
Males 91.8% Never married8.2% Now married0.0% Separated0.0% Widowed0.0% DivorcedFemales 94.0% Never married6.0% Now married0.0% Separated0.0% Widowed0.0% DivorcedWomen who did not give birth in the past 12 months Now married:
2.4% (16)Unmarried:
97.6% (637)
Marital status - Other race population 15 years and over
Males 26.5% Never married73.5% Now married0.0% Separated0.0% Widowed0.0% DivorcedFemales 22.2% Never married48.9% Now married28.9% Separated0.0% Widowed0.0% DivorcedWomen who did not give birth in the past 12 months Now married:
52.4% (14)Unmarried:
47.6% (13)
Marital status - Two or more races population 15 years and over
Males 77.9% Never married22.1% Now married0.0% Separated0.0% Widowed0.0% DivorcedFemales 81.0% Never married16.9% Now married0.0% Separated0.0% Widowed2.1% DivorcedWomen who gave birth in the past 12 months Now married:
75.0% (16)Unmarried:
25.0% (5)
Women who did not give birth in the past 12 months Now married:
18.4% (94)Unmarried:
81.6% (417)
Marital status - White alone, not Hispanic / Latino population 15 years and over
Males 56.3% Never married35.8% Now married0.5% Separated3.3% Widowed4.1% DivorcedFemales 56.7% Never married29.1% Now married0.4% Separated7.2% Widowed6.6% DivorcedWomen who gave birth in the past 12 months Now married:
18.8% (16)Unmarried:
81.2% (67)
Women who did not give birth in the past 12 months Now married:
15.0% (472)Unmarried:
85.0% (2,672)
Marital status - Hispanic or Latino population 15 years and over
Males 63.2% Never married36.8% Now married0.0% Separated0.0% Widowed0.0% DivorcedFemales 85.9% Never married11.1% Now married3.0% Separated0.0% Widowed0.0% DivorcedWomen who gave birth in the past 12 months Now married:
0.0% (0)Unmarried:
100.0% (4)
Women who did not give birth in the past 12 months Now married:
12.2% (50)Unmarried:
87.8% (358)
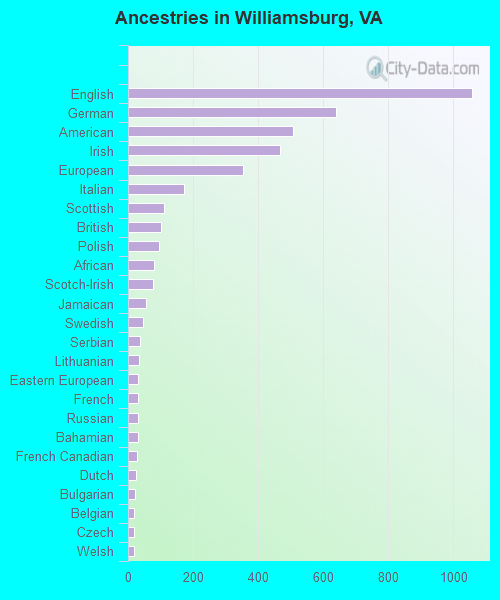
Ancestries in Williamsburg
1,057 13.8% English640 8.3% German508 6.6% American468 6.1% Irish353 4.6% European171 2.2% Italian111 1.4% Scottish101 1.3% British94 1.2% Polish81 1.1% African76 1.0% Scotch-Irish56 0.7% Jamaican45 0.6% Swedish36 0.5% Serbian33 0.4% Lithuanian32 0.4% Eastern European32 0.4% French30 0.4% Russian30 0.4% Bahamian28 0.4% French Canadian24 0.3% Dutch21 0.3% Bulgarian19 0.2% Belgian19 0.2% Czech18 0.2% Welsh17 0.2% Lebanese16 0.2% Greek16 0.2% Ukrainian14 0.2% Australian14 0.2% Hungarian13 0.2% Sudanese9 0.1% Norwegian8 0.1% Danish7 0.09% Scandinavian6 0.08% New Zealander5 0.07% Finnish
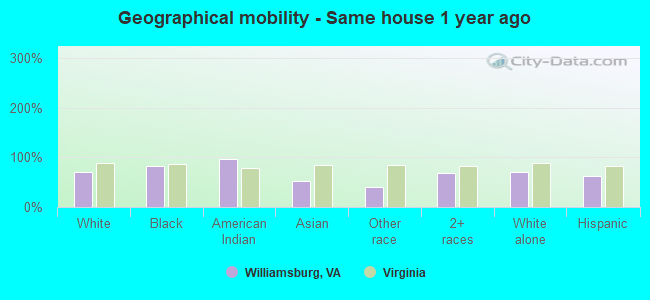
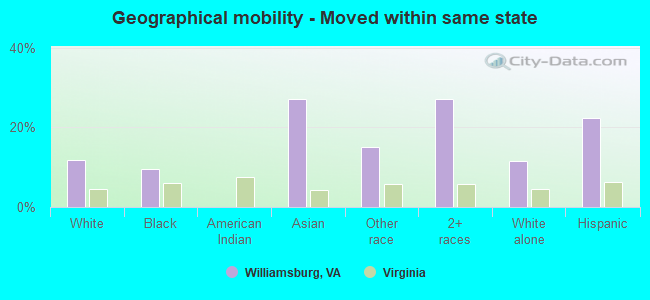
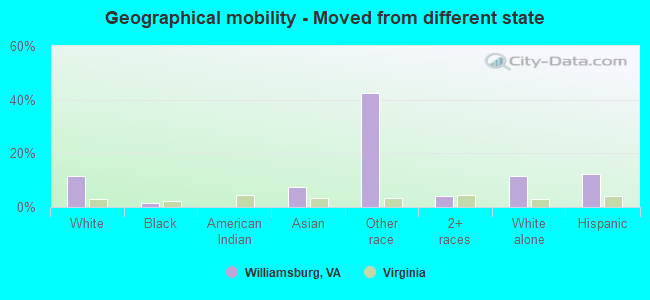
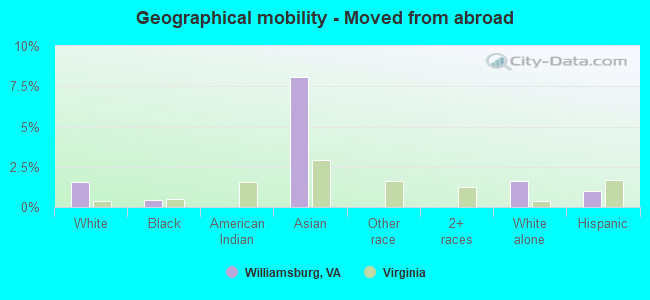
Geographical mobility in Williamsburg Same house 1 year ago 7,205 70.5% White (Caucasian)1,944 82.9% Black or African American62 96.1% American Indian / Alaska Native597 53.1% Asian80 39.4% Other race987 67.6% Two or more races7,334 71.1% White alone, not Hispanic / Latino771 62.0% Hispanic or LatinoMoved within same county 406 4.0% White / Caucasian130 5.5% Black or African American83 7.4% Asian6 2.7% Other race28 2.0% Two or more races396 3.8% White alone, not Hispanic / Latino43 3.4% Hispanic or LatinoMoved within same state 1,201 11.8% White / Caucasian223 9.5% Black or African American304 27.1% Asian30 15.0% Other race397 27.2% Two or more races1,185 11.5% White alone, not Hispanic / Latino279 22.4% Hispanic or LatinoMoved from different state 1,181 11.6% White / Caucasian39 1.7% Black or African American86 7.6% Asian86 42.4% Other race59 4.0% Two or more races1,186 11.5% White alone, not Hispanic / Latino152 12.2% Hispanic or LatinoMoved from abroad 160 1.6% White10 0.4% Black or African American90 8.0% Asian168 1.6% White alone, not Hispanic / Latino12 1.0% Hispanic or Latino
Children Nativity (place of birth) in Williamsburg
Children under 6 years - Living with two parents Both parents native 279 100.0% NativeBoth parents foreign-born 6 100.0% NativeOne native, one foreign-born parent 34 100.0% NativeChildren under 6 years - Living with one parent Native parent 122 100.0% NativeChildren 6 to 17 years - Living with two parents Both parents native 417 99.6% Native2 0.4% Foreign-bornBoth parents foreign-born 103 60.9% Native66 39.1% Foreign-bornOne native, one foreign-born parent 68 100.0% NativeChildren 6 to 17 years - Living with one parent Native parent 232 100.0% NativeForeign-born parent 90 57.6% Native67 42.4% Foreign-born
Grandparents responsible for own grandchildren in Williamsburg
Grandparents (30 to 59 years) Black or African American 40 100.0% Responsible for grandchildrenTwo or more races 31 100.0% Responsible for grandchildrenHispanic or Latino 24 100.0% Responsible for grandchildren
Grandparents (60 years and over) Black or African American 18 100.0% Responsible for grandchildren