Races in White Oak, Maryland (MD) Detailed Stats
Data:
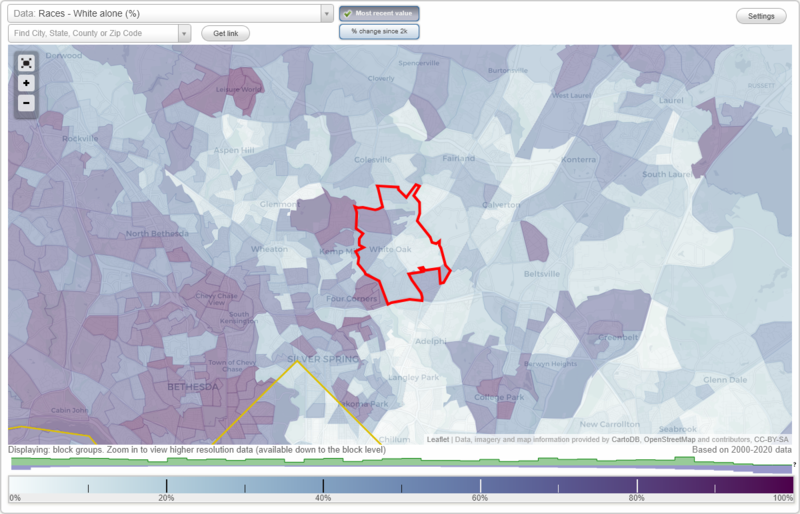
Races - White alone (%)
Races - White alone (% change since 2000)
Races - Black alone (%)
Races - Black alone (% change since 2000)
Races - American Indian alone (%)
Races - American Indian alone (% change since 2000)
Races - Asian alone (%)
Races - Asian alone (% change since 2000)
Races - Hispanic (%)
Races - Hispanic (% change since 2000)
Races - Native Hawaiian and Other Pacific Islander alone (%)
Races - Native Hawaiian and Other Pacific Islander alone (% change since 2000)
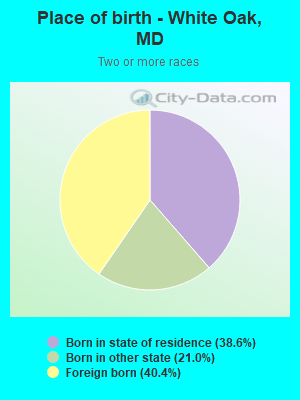
Races - Two or more races(%)
Races - Two or more races(% change since 2000)
Races - Other race alone (%)
Races - Other race alone (% change since 2000)
Racial diversity
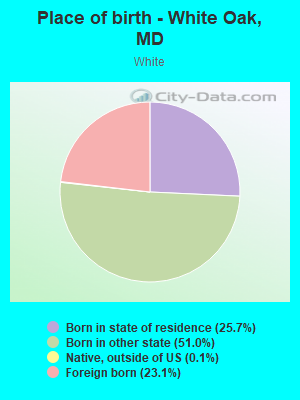
Place of birth - Born in state of residence (%)
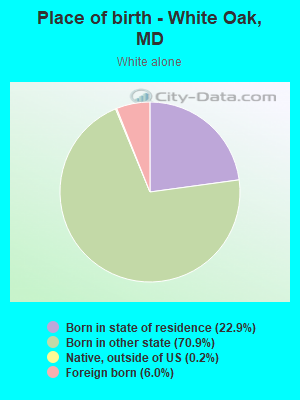
Place of birth - Born in state of residence (%) - White
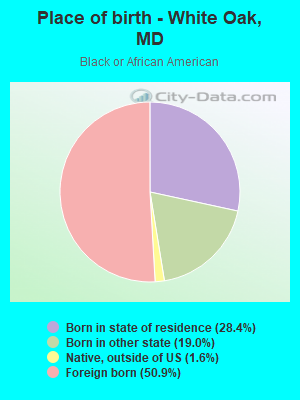
Place of birth - Born in state of residence (%) - Black or African American
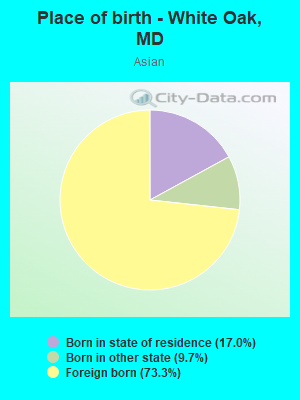
Place of birth - Born in state of residence (%) - Asian
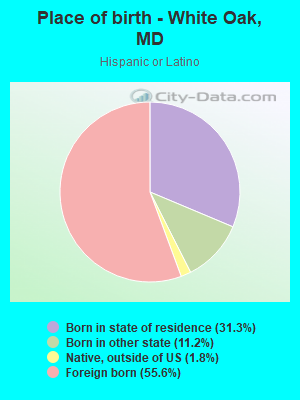
Place of birth - Born in state of residence (%) - Hispanic or Latino
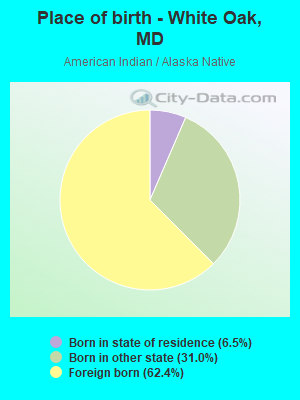
Place of birth - Born in state of residence (%) - American Indian and Alaska Native
Place of birth - Born in state of residence (%) - Multirace
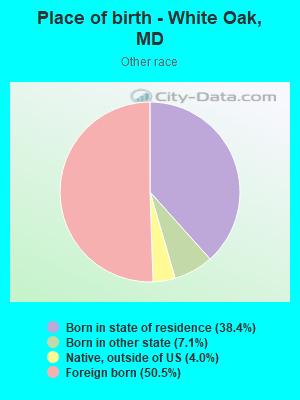
Place of birth - Born in state of residence (%) - Other Race
Place of birth - Born in other state (%)
Place of birth - Born in other state (%) - White
Place of birth - Born in other state (%) - Black or African American
Place of birth - Born in other state (%) - Asian
Place of birth - Born in other state (%) - Hispanic or Latino
Place of birth - Born in other state (%) - American Indian and Alaska Native
Place of birth - Born in other state (%) - Multirace
Place of birth - Born in other state (%) - Other Race
Place of birth - Native, outside of US (%)
Place of birth - Native, outside of US (%) - White
Place of birth - Native, outside of US (%) - Black or African American
Place of birth - Native, outside of US (%) - Asian
Place of birth - Native, outside of US (%) - Hispanic or Latino
Place of birth - Native, outside of US (%) - American Indian and Alaska Native
Place of birth - Native, outside of US (%) - Multirace
Place of birth - Native, outside of US (%) - Other Race
Place of birth - Foreign born (%)
Place of birth - Foreign born (%) - White
Place of birth - Foreign born (%) - Black or African American
Place of birth - Foreign born (%) - Asian
Place of birth - Foreign born (%) - Hispanic or Latino
Place of birth - Foreign born (%) - American Indian and Alaska Native
Place of birth - Foreign born (%) - Multirace
Place of birth - Foreign born (%) - Other Race
Residents speaking English at home (%)
Residents speaking English at home - Born in the United States (%)
Residents speaking English at home - Native, born elsewhere (%)
Residents speaking English at home - Foreign born (%)
Residents speaking Spanish at home (%)
Residents speaking Spanish at home - Born in the United States (%)
Residents speaking Spanish at home - Native, born elsewhere (%)
Residents speaking Spanish at home - Foreign born (%)
Residents speaking other language at home (%)
Residents speaking other language at home - Born in the United States (%)
Residents speaking other language at home - Native, born elsewhere (%)
Residents speaking other language at home - Foreign born (%)
Marital status - Never married (%)
Marital status - Now married (%)
Marital status - Separated (%)
Marital status - Widowed (%)
Marital status - Divorced (%)
Ancestries Reported - Arab (%)
Ancestries Reported - Czech (%)
Ancestries Reported - Danish (%)
Ancestries Reported - Dutch (%)
Ancestries Reported - English (%)
Ancestries Reported - French (%)
Ancestries Reported - French Canadian (%)
Ancestries Reported - German (%)
Ancestries Reported - Greek (%)
Ancestries Reported - Hungarian (%)
Ancestries Reported - Irish (%)
Ancestries Reported - Italian (%)
Ancestries Reported - Lithuanian (%)
Ancestries Reported - Norwegian (%)
Ancestries Reported - Polish (%)
Ancestries Reported - Portuguese (%)
Ancestries Reported - Russian (%)
Ancestries Reported - Scotch-Irish (%)
Ancestries Reported - Scottish (%)
Ancestries Reported - Slovak (%)
Ancestries Reported - Subsaharan African (%)
Ancestries Reported - Swedish (%)
Ancestries Reported - Swiss (%)
Ancestries Reported - Ukrainian (%)
Ancestries Reported - United States (%)
Ancestries Reported - Welsh (%)
Ancestries Reported - West Indian (%)
Ancestries Reported - Other (%)
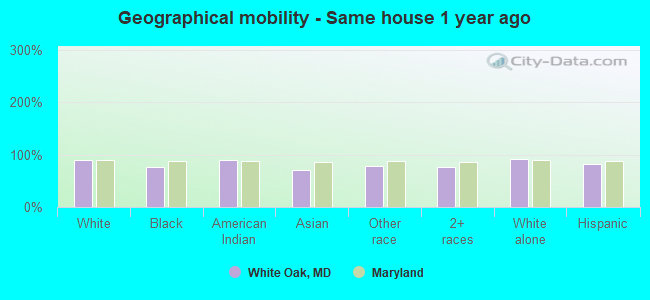
Geographical mobility - Same house 1 year ago (%)
Geographical mobility - Same house 1 year ago (%) - White
Geographical mobility - Same house 1 year ago (%) - Black or African American
Geographical mobility - Same house 1 year ago (%) - Asian
Geographical mobility - Same house 1 year ago (%) - Hispanic or Latino
Geographical mobility - Same house 1 year ago (%) - American Indian and Alaska Native
Geographical mobility - Same house 1 year ago (%) - Multirace
Geographical mobility - Same house 1 year ago (%) - Other Race
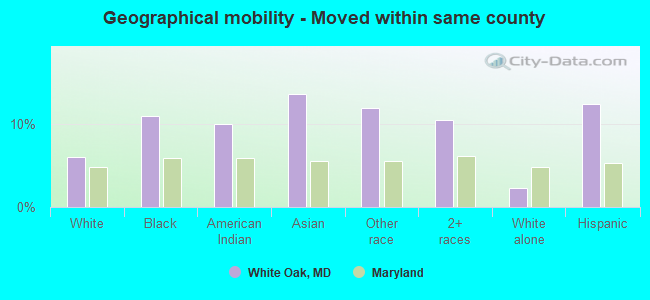
Geographical mobility - Moved within same county (%)
Geographical mobility - Moved within same county (%) - White
Geographical mobility - Moved within same county (%) - Black or African American
Geographical mobility - Moved within same county (%) - Asian
Geographical mobility - Moved within same county (%) - Hispanic or Latino
Geographical mobility - Moved within same county (%) - American Indian and Alaska Native
Geographical mobility - Moved within same county (%) - Multirace
Geographical mobility - Moved within same county (%) - Other Race
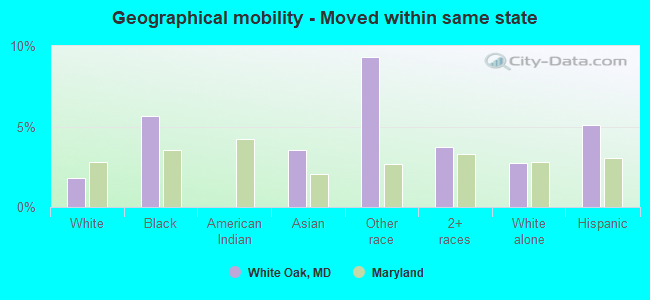
Geographical mobility - Moved from different county within same state (%)
Geographical mobility - Moved from different county within same state (%) - White
Geographical mobility - Moved from different county within same state (%) - Black or African American
Geographical mobility - Moved from different county within same state (%) - Asian
Geographical mobility - Moved from different county within same state (%) - Hispanic or Latino
Geographical mobility - Moved from different county within same state (%) - American Indian and Alaska Native
Geographical mobility - Moved from different county within same state (%) - Multirace
Geographical mobility - Moved from different county within same state (%) - Other Race
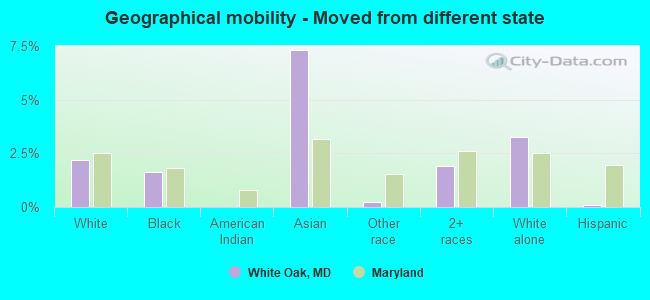
Geographical mobility - Moved from different state (%)
Geographical mobility - Moved from different state (%) - White
Geographical mobility - Moved from different state (%) - Black or African American
Geographical mobility - Moved from different state (%) - Asian
Geographical mobility - Moved from different state (%) - Hispanic or Latino
Geographical mobility - Moved from different state (%) - American Indian and Alaska Native
Geographical mobility - Moved from different state (%) - Multirace
Geographical mobility - Moved from different state (%) - Other Race
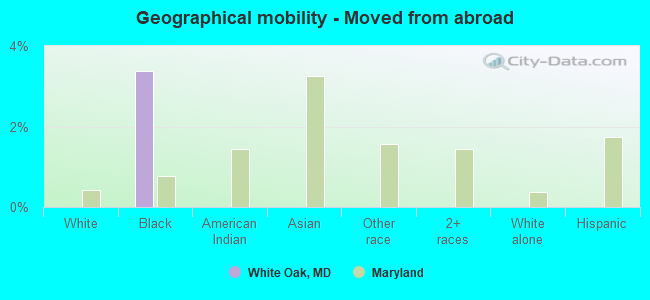
Geographical mobility - Moved from abroad (%)
Geographical mobility - Moved from abroad (%) - White
Geographical mobility - Moved from abroad (%) - Black or African American
Geographical mobility - Moved from abroad (%) - Asian
Geographical mobility - Moved from abroad (%) - Hispanic or Latino
Geographical mobility - Moved from abroad (%) - American Indian and Alaska Native
Geographical mobility - Moved from abroad (%) - Multirace
Geographical mobility - Moved from abroad (%) - Other Race
Place of birth for the foreign-born population - Ireland (%)
Place of birth for the foreign-born population - Denmark (%)
Place of birth for the foreign-born population - Norway (%)
Place of birth for the foreign-born population - Sweden (%)
Place of birth for the foreign-born population - United Kingdom (%)
Place of birth for the foreign-born population - England (%)
Place of birth for the foreign-born population - Scotland (%)
Place of birth for the foreign-born population - Other Northern Europe (%)
Place of birth for the foreign-born population - Austria (%)
Place of birth for the foreign-born population - Belgium (%)
Place of birth for the foreign-born population - France (%)
Place of birth for the foreign-born population - Germany (%)
Place of birth for the foreign-born population - Netherlands (%)
Place of birth for the foreign-born population - Switzerland (%)
Place of birth for the foreign-born population - Other Western Europe (%)
Place of birth for the foreign-born population - Greece (%)
Place of birth for the foreign-born population - Italy (%)
Place of birth for the foreign-born population - Portugal (%)
Place of birth for the foreign-born population - Spain (%)
Place of birth for the foreign-born population - Other Southern Europe (%)
Place of birth for the foreign-born population - Albania (%)
Place of birth for the foreign-born population - Belarus (%)
Place of birth for the foreign-born population - Bosnia and Herzegovina (%)
Place of birth for the foreign-born population - Bulgaria (%)
Place of birth for the foreign-born population - Croatia (%)
Place of birth for the foreign-born population - Czechoslovakia (%)
Place of birth for the foreign-born population - Hungary (%)
Place of birth for the foreign-born population - Latvia (%)
Place of birth for the foreign-born population - Lithuania (%)
Place of birth for the foreign-born population - North Macedonia (Macedonia) (%)
Place of birth for the foreign-born population - Moldova (%)
Place of birth for the foreign-born population - Poland (%)
Place of birth for the foreign-born population - Romania (%)
Place of birth for the foreign-born population - Russia (%)
Place of birth for the foreign-born population - Serbia (%)
Place of birth for the foreign-born population - Ukraine (%)
Place of birth for the foreign-born population - Other Eastern Europe (%)
Place of birth for the foreign-born population - China (%)
Place of birth for the foreign-born population - Hong Kong (%)
Place of birth for the foreign-born population - Taiwan (%)
Place of birth for the foreign-born population - Japan (%)
Place of birth for the foreign-born population - Korea (%)
Place of birth for the foreign-born population - Other Eastern Asia (%)
Place of birth for the foreign-born population - Afghanistan (%)
Place of birth for the foreign-born population - Bangladesh (%)
Place of birth for the foreign-born population - India (%)
Place of birth for the foreign-born population - Iran (%)
Place of birth for the foreign-born population - Kazakhstan (%)
Place of birth for the foreign-born population - Nepal (%)
Place of birth for the foreign-born population - Pakistan (%)
Place of birth for the foreign-born population - Sri Lanka (%)
Place of birth for the foreign-born population - Uzbekistan (%)
Place of birth for the foreign-born population - Other South Central Asia (%)
Place of birth for the foreign-born population - Burma (%)
Place of birth for the foreign-born population - Cambodia (%)
Place of birth for the foreign-born population - Indonesia (%)
Place of birth for the foreign-born population - Laos (%)
Place of birth for the foreign-born population - Malaysia (%)
Place of birth for the foreign-born population - Philippines (%)
Place of birth for the foreign-born population - Singapore (%)
Place of birth for the foreign-born population - Thailand (%)
Place of birth for the foreign-born population - Vietnam (%)
Place of birth for the foreign-born population - Other South Eastern Asia (%)
Place of birth for the foreign-born population - Armenia (%)
Place of birth for the foreign-born population - Iraq (%)
Place of birth for the foreign-born population - Israel (%)
Place of birth for the foreign-born population - Jordan (%)
Place of birth for the foreign-born population - Kuwait (%)
Place of birth for the foreign-born population - Lebanon (%)
Place of birth for the foreign-born population - Saudi Arabia (%)
Place of birth for the foreign-born population - Syria (%)
Place of birth for the foreign-born population - Turkey (%)
Place of birth for the foreign-born population - Yemen (%)
Place of birth for the foreign-born population - Other Western Asia (%)
Place of birth for the foreign-born population - Eritrea (%)
Place of birth for the foreign-born population - Ethiopia (%)
Place of birth for the foreign-born population - Kenya (%)
Place of birth for the foreign-born population - Somalia (%)
Place of birth for the foreign-born population - Uganda (%)
Place of birth for the foreign-born population - Zimbabwe (%)
Place of birth for the foreign-born population - Other Eastern Africa (%)
Place of birth for the foreign-born population - Cameroon (%)
Place of birth for the foreign-born population - Congo (%)
Place of birth for the foreign-born population - Democratic Republic of Congo (Zaire) (%)
Place of birth for the foreign-born population - Other Middle Africa (%)
Place of birth for the foreign-born population - Egypt (%)
Place of birth for the foreign-born population - Morocco (%)
Place of birth for the foreign-born population - Sudan (%)
Place of birth for the foreign-born population - Other Northern Africa (%)
Place of birth for the foreign-born population - South Africa (%)
Place of birth for the foreign-born population - Other Southern Africa (%)
Place of birth for the foreign-born population - Cabo Verde (%)
Place of birth for the foreign-born population - Ghana (%)
Place of birth for the foreign-born population - Liberia (%)
Place of birth for the foreign-born population - Nigeria (%)
Place of birth for the foreign-born population - Senegal (%)
Place of birth for the foreign-born population - Sierra Leone (%)
Place of birth for the foreign-born population - Other Western Africa (%)
Place of birth for the foreign-born population - Australia (%)
Place of birth for the foreign-born population - New Zealand (%)
Place of birth for the foreign-born population - Fiji (%)
Place of birth for the foreign-born population - Micronesia (%)
Place of birth for the foreign-born population - Bahamas (%)
Place of birth for the foreign-born population - Barbados (%)
Place of birth for the foreign-born population - Cuba (%)
Place of birth for the foreign-born population - Dominica (%)
Place of birth for the foreign-born population - Dominican Republic (%)
Place of birth for the foreign-born population - Grenada (%)
Place of birth for the foreign-born population - Haiti (%)
Place of birth for the foreign-born population - Jamaica (%)
Place of birth for the foreign-born population - St. Vincent and the Grenadines (%)
Place of birth for the foreign-born population - Trinidad and Tobago (%)
Place of birth for the foreign-born population - West Indies (%)
Place of birth for the foreign-born population - Other Caribbean (%)
Place of birth for the foreign-born population - Belize (%)
Place of birth for the foreign-born population - Costa Rica (%)
Place of birth for the foreign-born population - El Salvador (%)
Place of birth for the foreign-born population - Guatemala (%)
Place of birth for the foreign-born population - Honduras (%)
Place of birth for the foreign-born population - Mexico (%)
Place of birth for the foreign-born population - Nicaragua (%)
Place of birth for the foreign-born population - Panama (%)
Place of birth for the foreign-born population - Other Central America (%)
Place of birth for the foreign-born population - Argentina (%)
Place of birth for the foreign-born population - Bolivia (%)
Place of birth for the foreign-born population - Brazil (%)
Place of birth for the foreign-born population - Chile (%)
Place of birth for the foreign-born population - Colombia (%)
Place of birth for the foreign-born population - Ecuador (%)
Place of birth for the foreign-born population - Guyana (%)
Place of birth for the foreign-born population - Peru (%)
Place of birth for the foreign-born population - Uruguay (%)
Place of birth for the foreign-born population - Venezuela (%)
Place of birth for the foreign-born population - Other South America (%)
Place of birth for the foreign-born population - Canada (%)
Place of birth for the foreign-born population - Other Northern America (%)
Place of birth for the foreign-born population - Other (%)
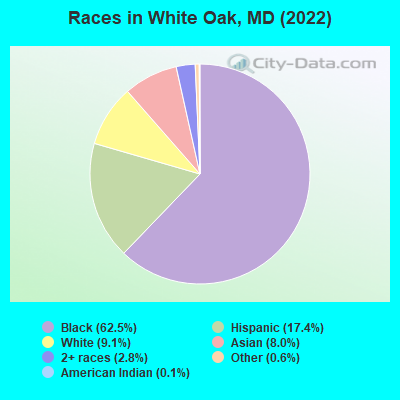
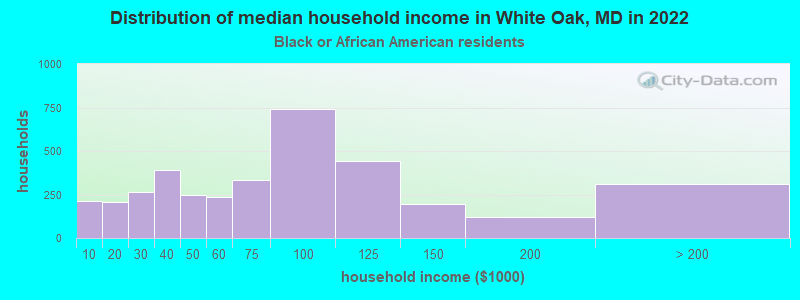
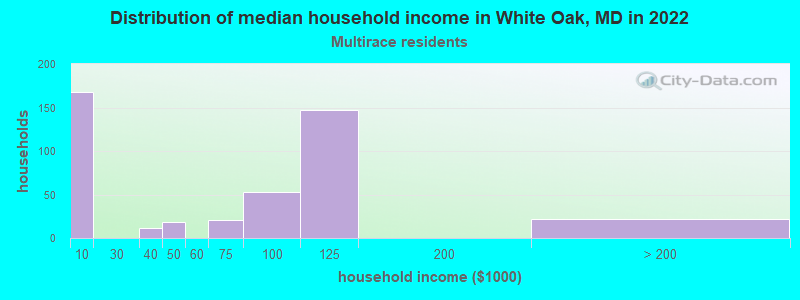
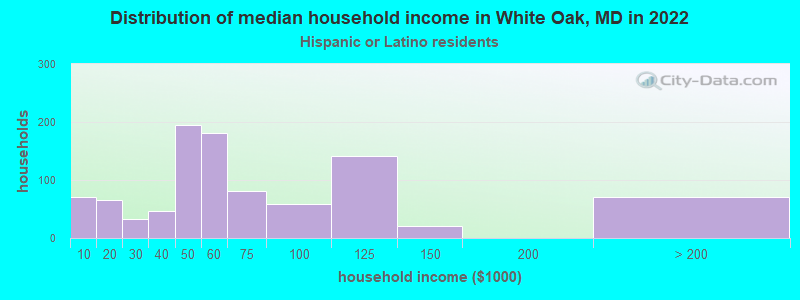
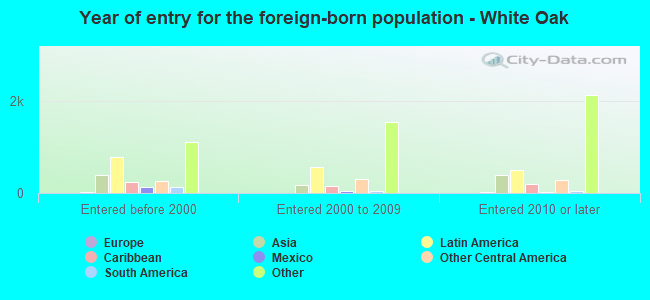
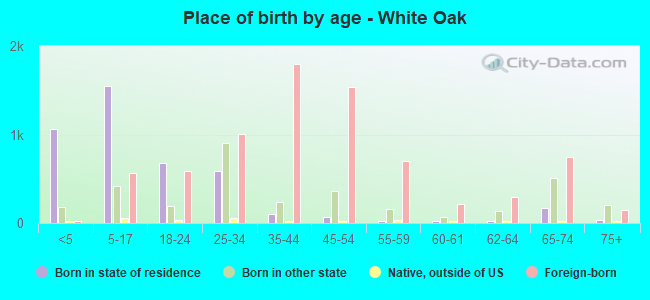
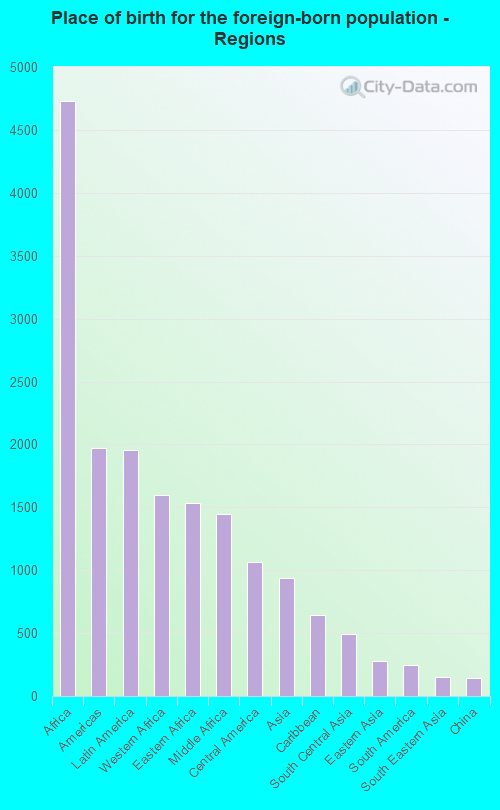
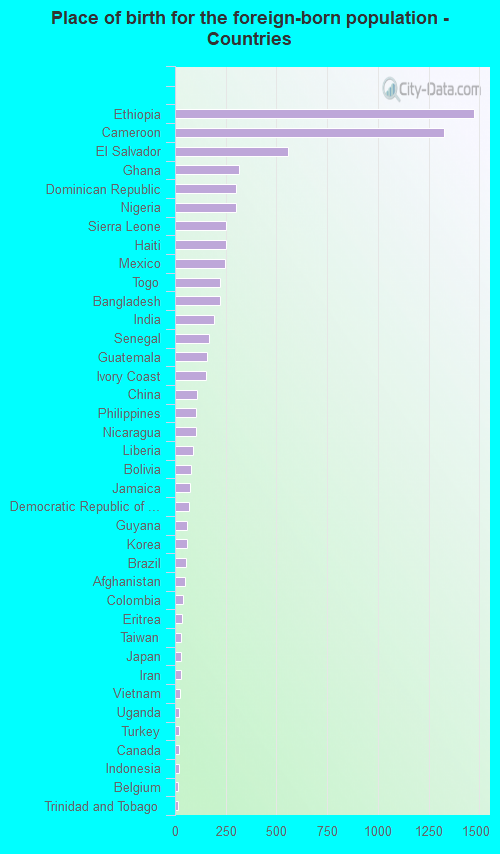
According to 2022 data, the most numerous races in White Oak, MD are White alone (1,403 residents), Black alone (9,640 residents), and Hispanic (2,677 residents). 40.5% of White Oak residents speak English at home. 49.8% of White Oak, MD residents are foreign-born (29.4% born in Africa, 12.2% born in Latin America, 5.8% born in Asia), which is 67.9% greater than the foreign-born rate of 16.0% across the entire state of Maryland.
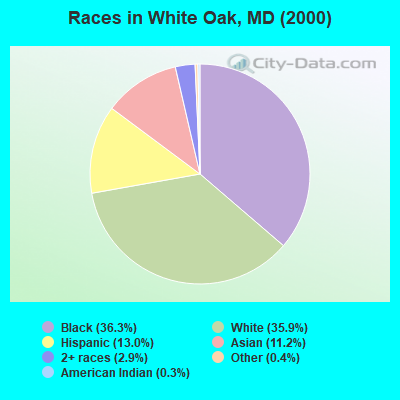
Race distribution in White Oak
2000 2022
3,286,547 62.1% White alone 1,464,735 27.7% Black alone 227,916 4.3% Hispanic 209,738 4.0% Asian alone 82,946 1.6% Two or more races 13,312 0.3% American Indian alone 9,379 0.2% Other race alone 1,913 0.04% Native Hawaiian and Other
2,906,492 47.1% White alone 1,800,914 29.2% Black alone 705,842 11.4% Hispanic 401,818 6.5% Asian alone 291,317 4.7% Two or more races 46,930 0.8% Other race alone 8,930 0.1% American Indian alone 2,417 0.04% Native Hawaiian and Other
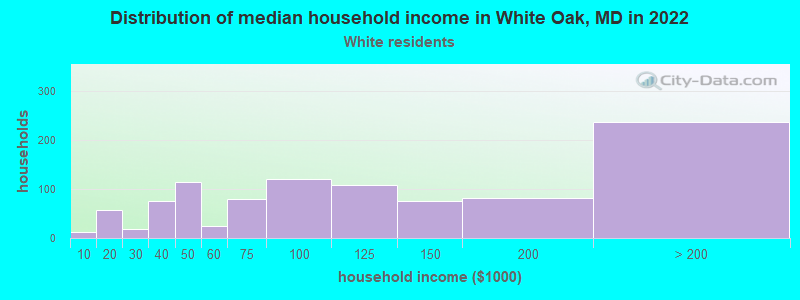
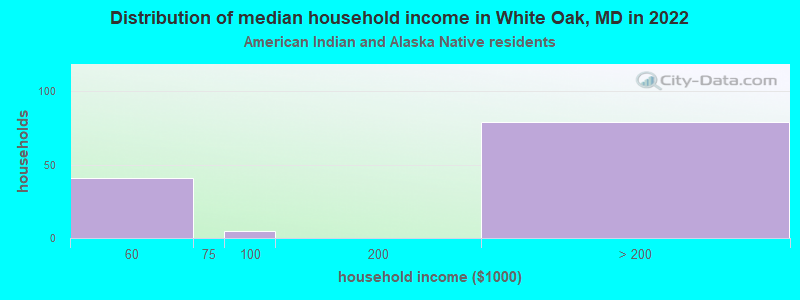
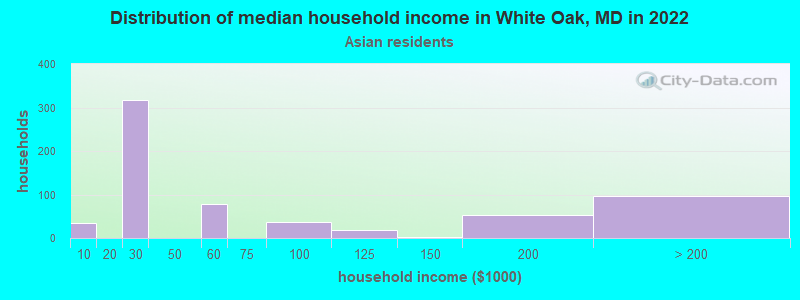
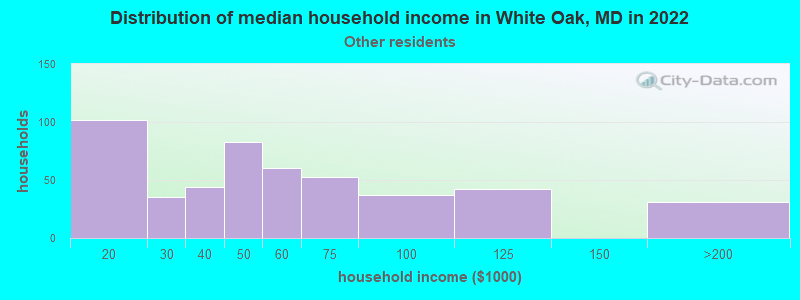
Income and house value in White Oak Median household income in 2022 $102,429 White non-Hispanic householders$73,036 Black householdersover $200,000 American Indian and Alaska Native householders$53,789 Asian householders$46,421 Some other race householders$77,854 Two or more races householders$53,238 Hispanic or Latino race householdersMedian 2022 house value $515,389 White Non-Hispanic householders$503,106 Black or African American householders$552,729 American Indian or Alaska Native householders $466,749 Asian householders$470,188 Some other race householders$330,163 Two or more races householders$461,344 Hispanic or Latino householders
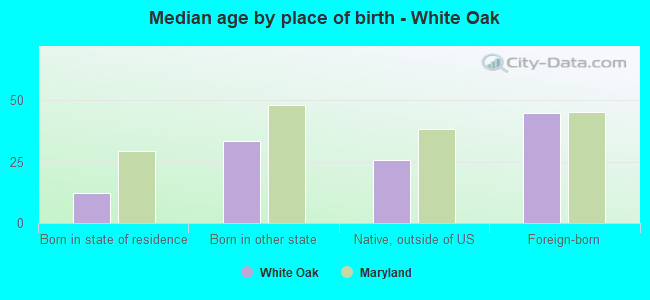
Median age by race in White Oak
43.1 Median age for White residents42.7 44.2 33.3 Median age for Black or African American residents34.4 32.1 41.7 Median age for American Indian / Alaska Native residents22.2 -671,704,449.4 40.2 Median age for Asian residents30.2 43.3 -763,333,332.6 Median age for Native Hawaiian / Pacific Islander residents-720,061,021.4 -760,942,760.2 24.4 Median age for Other race residents24.2 25.8 45.1 Median age for Two or more races residents30.5 52.3 54.8 Median age for White alone residents53.6 57.3 32.4 Median age for Hispanic or Latino residents29.2 37.9
Owner/renter occupied households by race in White Oak
House owners and renters - White residents 532 53.7% Owner occupied458 46.3% Renter occupiedHouse owners and renters - Black or African American residents 688 19.0% Owner occupied2,933 81.0% Renter occupiedHouse owners and renters - American Indian / Alaska Native residents 70 67.5% Owner occupied34 32.5% Renter occupiedHouse owners and renters - Asian residents 254 52.6% Owner occupied229 47.4% Renter occupiedHouse owners and renters - Other race residents 82 17.5% Owner occupied388 82.5% Renter occupiedHouse owners and renters - Two or more races residents 53 13.2% Owner occupied348 86.8% Renter occupiedHouse owners and renters - White alone residents 460 54.6% Owner occupied382 45.4% Renter occupiedHouse owners and renters - Hispanic or Latino residents 215 22.3% Owner occupied750 77.7% Renter occupied
Language usage in White Oak
English speakers - Total 40.5% of residents of White Oak speak English at home.
16.3% of residents speak Spanish at home 1,083 47.0% Speak English very well1,223 53.0% Speak English less than very well44.5% of residents speak other language at home 4,188 66.6% Speak English very well2,098 33.4% Speak English less than very well
English speakers - Born in the United States 79.1% of residents of White Oak speak English at home.
6.9% of residents speak Spanish at home 205 92.8% Speak English very well16 7.2% Speak English less than very well14.2% of residents speak other language at home 230 50.3% Speak English very well227 49.7% Speak English less than very well
English speakers - Native, born elsewhere 57.3% of residents of White Oak speak English at home.
23.3% of residents speak Spanish at home 23 43.4% Speak English very well30 56.6% Speak English less than very well31.7% of residents speak other language at home 72 100.0% Speak English less than very well
English speakers - Foreign-born 15.1% of residents of White Oak speak English at home.
19.6% of residents speak Spanish at home 446 29.7% Speak English very well1,056 70.3% Speak English less than very well65.7% of residents speak other language at home 3,424 67.9% Speak English very well1,617 32.1% Speak English less than very well
White (Caucasian) - Speak only English Native:
87.2% (1,262)Foreign-born:
5.2% (24)
White (Caucasian) - Speak another language Native:
11.2% (163)Foreign-born:
91.1% (413)
Black or African American - Speak only English Native:
71.4% (2,825)Foreign-born:
14.2% (713)
Black or African American - Speak another language Native:
30.2% (1,196)Foreign-born:
87.6% (4,413)
American Indian / Alaska Native - Speak another language Native:
100.0% (145)Foreign-born:
100.0% (198)
Asian - Speak only English Native:
30.9% (61)Foreign-born:
25.6% (229)
Asian - Speak another language Native:
72.3% (143)Foreign-born:
75.2% (674)
Other race - Speak only English Native:
9.8% (45)Foreign-born:
10.4% (75)
Other race - Speak another language Native:
86.4% (400)Foreign-born:
88.5% (638)
Two or more races - Speak only English Native:
78.4% (400)Foreign-born:
10.5% (41)
Two or more races - Speak another language Native:
18.4% (94)Foreign-born:
89.3% (344)
White alone - Speak only English Native:
96.1% (1,232)Foreign-born:
28.3% (24)
White alone - Speak another language Native:
4.0% (51)Foreign-born:
71.2% (60)
Hispanic or Latino - Speak only English Native:
18.1% (171)Foreign-born:
0.8% (12)
Hispanic or Latino - Speak another language Native:
80.6% (761)Foreign-born:
99.4% (1,484)
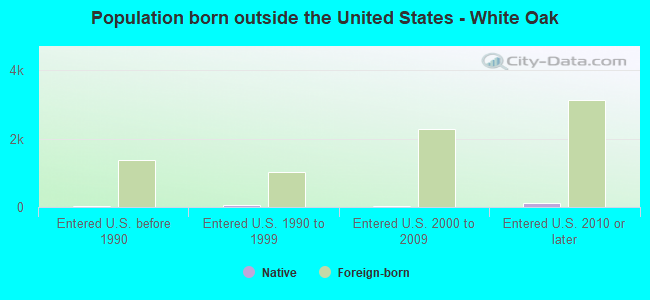
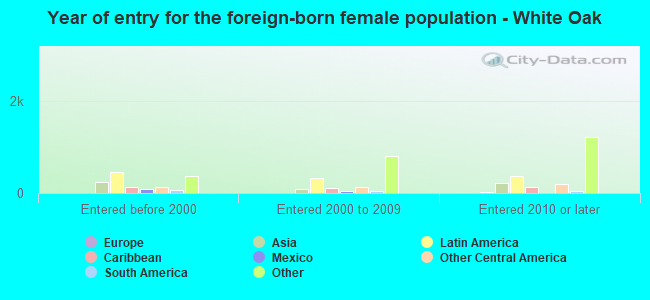
Foreign-born residents in White Oak 7,682 residents are foreign born (29.4% Africa , 12.2% Latin America , 5.8% Asia ).
This city:
49.8%Maryland:
15.7%
Marital status for residents in White Oak Marital status - White (Caucasian) population 15 years and over
Males 37.9% Never married55.0% Now married0.0% Separated2.1% Widowed5.1% DivorcedFemales 37.2% Never married48.5% Now married3.3% Separated8.0% Widowed3.0% DivorcedWomen who did not give birth in the past 12 months Now married:
53.1% (236)Unmarried:
46.9% (208)
Marital status - Black or African American population 15 years and over
Males 43.6% Never married47.4% Now married0.5% Separated1.1% Widowed7.4% DivorcedFemales 46.5% Never married33.8% Now married6.2% Separated5.6% Widowed7.8% DivorcedWomen who gave birth in the past 12 months Now married:
85.4% (216)Unmarried:
14.6% (37)
Women who did not give birth in the past 12 months Now married:
29.7% (750)Unmarried:
70.3% (1,772)
Marital status - American Indian / Alaska Native population 15 years and over
Males 55.6% Never married30.6% Now married0.0% Separated0.0% Widowed13.8% DivorcedFemales 0.0% Never married100.0% Now married0.0% Separated0.0% Widowed0.0% DivorcedMarital status - Asian population 15 years and over
Males 33.6% Never married52.3% Now married0.0% Separated3.1% Widowed11.0% DivorcedFemales 18.2% Never married50.9% Now married0.0% Separated30.3% Widowed0.6% DivorcedWomen who gave birth in the past 12 months Now married:
100.0% (50)Unmarried:
0.0% (0)
Women who did not give birth in the past 12 months Now married:
59.0% (167)Unmarried:
41.0% (116)
Marital status - Other race population 15 years and over
Males 17.0% Never married64.3% Now married0.0% Separated0.0% Widowed18.7% DivorcedFemales 20.3% Never married57.6% Now married0.0% Separated0.0% Widowed22.1% DivorcedWomen who gave birth in the past 12 months Now married:
100.0% (34)Unmarried:
0.0% (0)
Women who did not give birth in the past 12 months Now married:
65.5% (179)Unmarried:
34.5% (94)
Marital status - Two or more races population 15 years and over
Males 48.0% Never married39.8% Now married0.0% Separated3.1% Widowed9.1% DivorcedFemales 31.1% Never married25.7% Now married0.0% Separated14.5% Widowed28.7% DivorcedWomen who did not give birth in the past 12 months Now married:
45.0% (89)Unmarried:
55.0% (109)
Marital status - White alone, not Hispanic / Latino population 15 years and over
Males 40.2% Never married54.3% Now married0.0% Separated2.7% Widowed2.9% DivorcedFemales 35.4% Never married44.5% Now married5.0% Separated12.1% Widowed2.9% DivorcedWomen who did not give birth in the past 12 months Now married:
47.2% (110)Unmarried:
52.8% (123)
Marital status - Hispanic or Latino population 15 years and over
Males 32.6% Never married56.6% Now married0.0% Separated0.8% Widowed10.0% DivorcedFemales 21.7% Never married52.6% Now married0.0% Separated5.9% Widowed19.7% DivorcedWomen who gave birth in the past 12 months Now married:
100.0% (28)Unmarried:
0.0% (0)
Women who did not give birth in the past 12 months Now married:
56.9% (319)Unmarried:
43.1% (241)
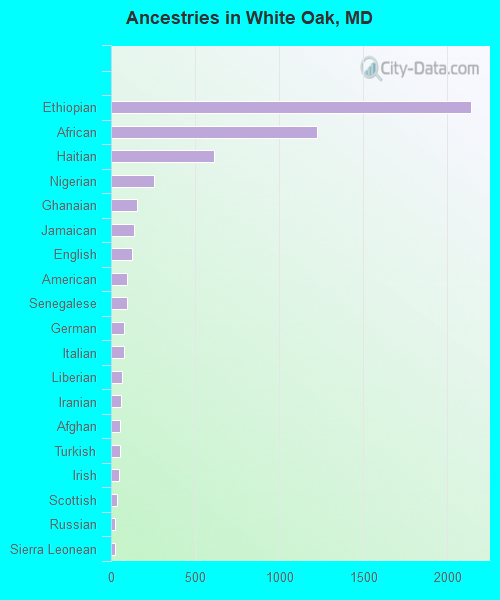
Ancestries in White Oak
2,142 17.7% Ethiopian1,225 10.1% African610 5.0% Haitian256 2.1% Nigerian152 1.3% Ghanaian134 1.1% Jamaican126 1.0% English96 0.8% American96 0.8% Senegalese76 0.6% German75 0.6% Italian65 0.5% Liberian60 0.5% Iranian53 0.4% Afghan53 0.4% Turkish46 0.4% Irish36 0.3% Scottish26 0.2% Russian26 0.2% Sierra Leonean16 0.1% Latvian14 0.1% Brazilian13 0.1% Lebanese13 0.1% Macedonian9 0.07% Greek9 0.07% Northern European8 0.07% European5 0.04% Romanian4 0.03% Eastern European
Geographical mobility in White Oak Same house 1 year ago 1,779 89.8% White (Caucasian)7,306 76.0% Black or African American341 88.8% American Indian / Alaska Native837 70.6% Asian1,054 78.3% Other race722 77.2% Two or more races1,284 91.5% White alone, not Hispanic / Latino2,125 81.7% Hispanic or LatinoMoved within same county 120 6.1% White / Caucasian1,060 11.0% Black or African American39 10.1% American Indian / Alaska Native162 13.7% Asian161 12.0% Other race99 10.6% Two or more races32 2.3% White alone, not Hispanic / Latino325 12.5% Hispanic or LatinoMoved within same state 36 1.8% White / Caucasian542 5.6% Black or African American42 3.6% Asian125 9.3% Other race35 3.7% Two or more races39 2.8% White alone, not Hispanic / Latino133 5.1% Hispanic or LatinoMoved from different state 43 2.2% White / Caucasian158 1.6% Black or African American87 7.3% Asian3 0.2% Other race18 1.9% Two or more races46 3.2% White alone, not Hispanic / Latino2 0.1% Hispanic or LatinoMoved from abroad 324 3.4% Black or African American
Children Nativity (place of birth) in White Oak
Children under 6 years - Living with two parents Both parents native 91 100.0% NativeBoth parents foreign-born 903 93.3% Native65 6.7% Foreign-bornOne native, one foreign-born parent 88 100.0% NativeChildren under 6 years - Living with one parent Native parent 201 100.0% NativeForeign-born parent 164 89.0% Native20 11.0% Foreign-bornChildren 6 to 17 years - Living with two parents Both parents native 127 99.5% Native1 0.5% Foreign-bornBoth parents foreign-born 611 65.6% Native320 34.4% Foreign-bornOne native, one foreign-born parent 118 100.0% NativeChildren 6 to 17 years - Living with one parent Native parent 525 100.0% NativeForeign-born parent 439 54.0% Native374 46.0% Foreign-born
Grandparents responsible for own grandchildren in White Oak
Grandparents (30 to 59 years) Black or African American 20 40.9% Responsible for grandchildren30 59.1% Not responsible for grandchildren
Grandparents (60 years and over) Black or African American 10 100.0% Not responsible for grandchildren