Races in Upper Yellowstone Valley, Montana (MT) Detailed Stats
Ancestries, Foreign-born residents, place of birth
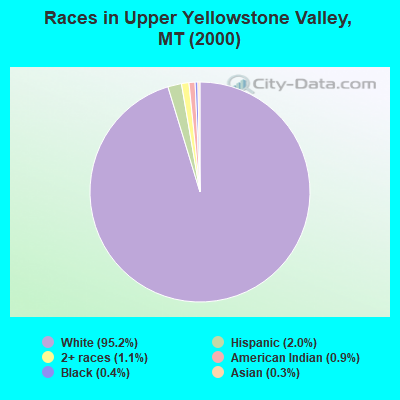
Race distribution in Upper Yellowstone Valley
- 11,43695.2%White alone
- 2412.0%Hispanic
- 1311.1%Two or more races
- 1060.9%American Indian alone
- 520.4%Black alone
- 380.3%Asian alone
- 70.06%Other race alone
- 50.04%Native Hawaiian and Other
Pacific Islander alone
2000
2022
- 807,82389.5%White alone
- 54,4266.0%American Indian alone
- 18,0812.0%Hispanic
- 13,7681.5%Two or more races
- 4,5690.5%Asian alone
- 2,5340.3%Black alone
- 5690.06%Other race alone
- 4250.05%Native Hawaiian and Other
Pacific Islander alone
- 937,36583.5%White alone
- 58,7485.2%American Indian alone
- 55,1724.9%Two or more races
- 49,8304.4%Hispanic
- 9,0120.8%Other race alone
- 7,7000.7%Asian alone
- 3,4280.3%Black alone
- 1,6120.1%Native Hawaiian and Other
Pacific Islander alone
Income and house value in Upper Yellowstone Valley
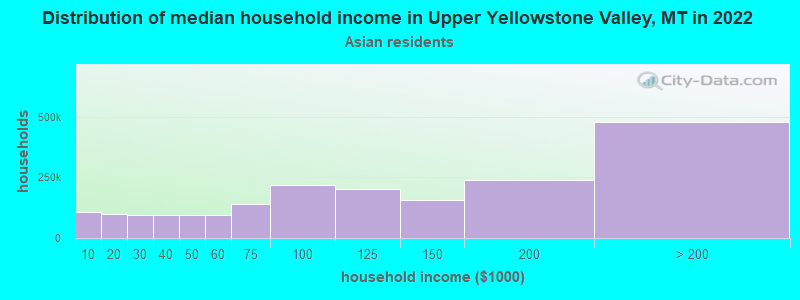
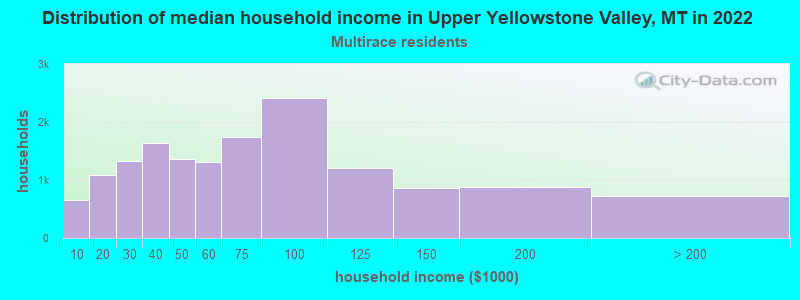
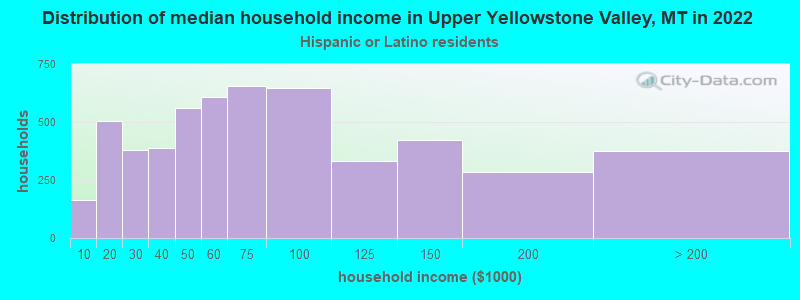
- Median household income in 2022
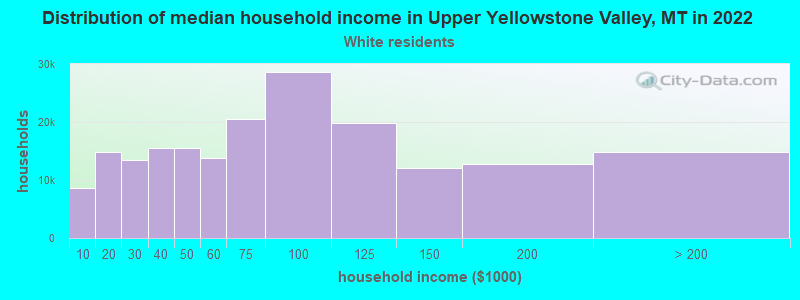
- $65,480White non-Hispanic householders
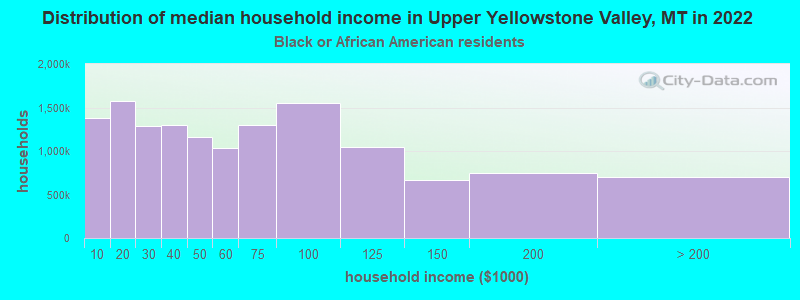
- $45,039Black householders
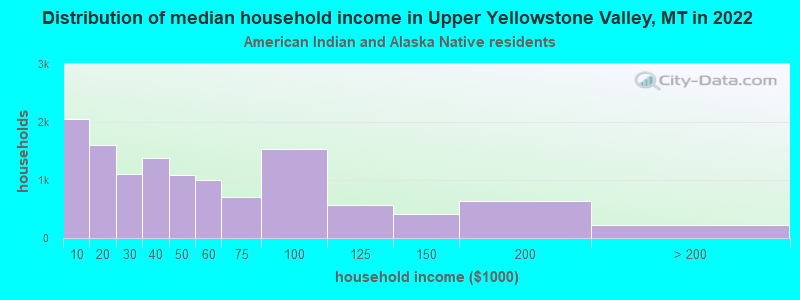
- $59,847American Indian and Alaska Native householders
- $34,265Asian householders
- $52,173Some other race householders
- $74,164Two or more races householders
- $45,311Hispanic or Latino race householders
- Median 2022 house value
- $462,876White Non-Hispanic householders
- $275,889American Indian or Alaska Native householders
- $459,011Asian householders
- $410,694Two or more races householders
- $273,957Hispanic or Latino householders
Household income for White non-Hispanic householders
![Distribution of median household income in Upper Yellowstone Valley, MT in 2022](http://pics4.city-data.com/sgraphs/income/household-income-distribution-white-Upper-Yellowstone-Valley-MT-small.png 600w,//pics4.city-data.com/sgraphs/income/household-income-distribution-white-Upper-Yellowstone-Valley-MT.png 800w)
Household income for Black householders
![Distribution of median household income in Upper Yellowstone Valley, MT in 2022](http://pics4.city-data.com/sgraphs/income/household-income-distribution-black-Upper-Yellowstone-Valley-MT-small.png 600w,//pics4.city-data.com/sgraphs/income/household-income-distribution-black-Upper-Yellowstone-Valley-MT.png 800w)
Household income for American Indian and Alaska Native householders
![Distribution of median household income in Upper Yellowstone Valley, MT in 2022](http://pics4.city-data.com/sgraphs/income/household-income-distribution-american-indian-Upper-Yellowstone-Valley-MT-small.png 600w,//pics4.city-data.com/sgraphs/income/household-income-distribution-american-indian-Upper-Yellowstone-Valley-MT.png 800w)
Household income for Asian householders
![Distribution of median household income in Upper Yellowstone Valley, MT in 2022](http://pics4.city-data.com/sgraphs/income/household-income-distribution-asian-Upper-Yellowstone-Valley-MT-small.png 600w,//pics4.city-data.com/sgraphs/income/household-income-distribution-asian-Upper-Yellowstone-Valley-MT.png 800w)
Household income for Two or more races householders
![Distribution of median household income in Upper Yellowstone Valley, MT in 2022](http://pics4.city-data.com/sgraphs/income/household-income-distribution-multirace-Upper-Yellowstone-Valley-MT-small.png 600w,//pics4.city-data.com/sgraphs/income/household-income-distribution-multirace-Upper-Yellowstone-Valley-MT.png 800w)
Household income for Hispanic or Latino race householders
![Distribution of median household income in Upper Yellowstone Valley, MT in 2022](http://pics4.city-data.com/sgraphs/income/household-income-distribution-hispanic-Upper-Yellowstone-Valley-MT-small.png 600w,//pics4.city-data.com/sgraphs/income/household-income-distribution-hispanic-Upper-Yellowstone-Valley-MT.png 800w)
Zip code: 59047