Races in Traverse City, Michigan (MI) Detailed Stats
Ancestries, Foreign-born residents, place of birth
Settings
X


Recent posts about races in Traverse City, Michigan on our local forum with over 2,400,000 registered users:
 | Moving to West Michigan - Traverse City or Grand Haven? (8 replies) |
| Best Areas of Traverse City? (2 replies) |
| Living in Traverse City with kids—sports, schools, etc. (6 replies) |
| Suggest me a summer vacation spot (12 replies) |
| For non-Michigan people: your stereotypes of Michigan people before meeting them (71 replies) |
| Forbes just named GR #1 place to invest in house (50 replies) |
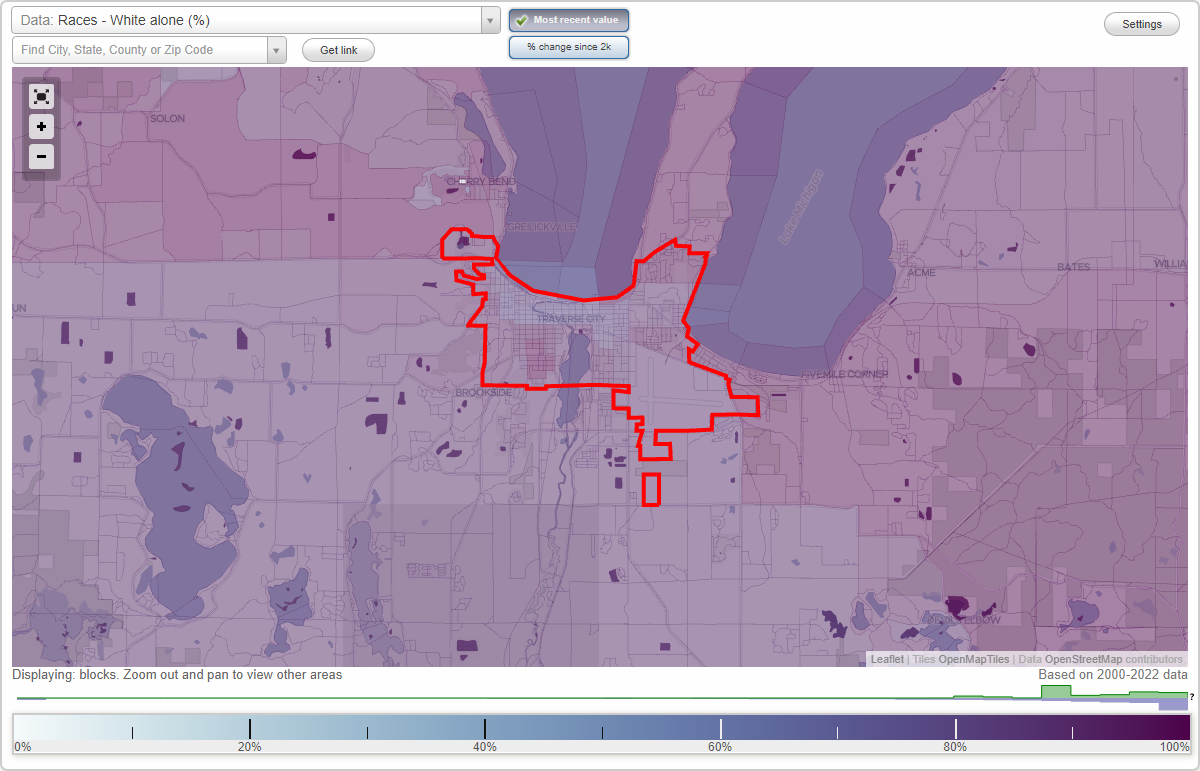
According to 2022 data, the most numerous races in Traverse City, MI are White alone (13,776 residents), Black alone (190 residents), and Hispanic (578 residents). 95.9% of Traverse City residents speak English at home. 3.3% of Traverse City, MI residents are foreign-born (1.4% born in Asia, 1.2% born in Europe, 0.4% born in Latin America), which is 81.7% less than the foreign-born rate of 6.0% across the entire state of Michigan.
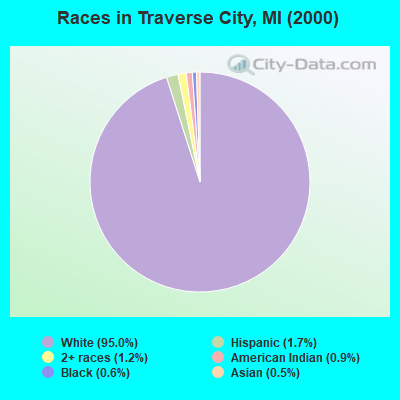
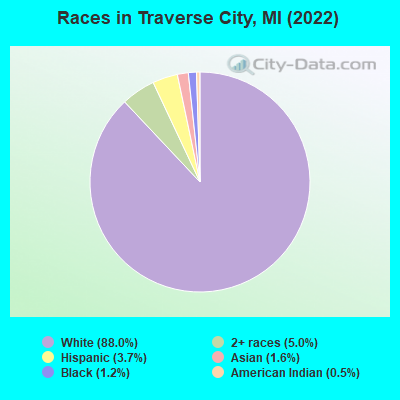
Race distribution in Traverse City
2000
2022

- 13,80395.0%White alone
- 2421.7%Hispanic
- 1791.2%Two or more races
- 1320.9%American Indian alone
- 910.6%Black alone
- 720.5%Asian alone
- 110.08%Other race alone
- 20.01%Native Hawaiian and Other
Pacific Islander alone
-
- 13,77688.0%White alone
- 7875.0%Two or more races
- 5783.7%Hispanic
- 2451.6%Asian alone
- 1901.2%Black alone
- 790.5%American Indian alone
2000
2022
-
- 7,806,69178.6%White alone
- 1,402,04714.1%Black alone
- 323,8773.3%Hispanic
- 175,3111.8%Asian alone
- 163,4871.6%Two or more races
- 53,4210.5%American Indian alone
- 11,4650.1%Other race alone
- 2,1450.02%Native Hawaiian and Other
Pacific Islander alone

-
- 7,289,05172.6%White alone
- 1,310,46413.1%Black alone
- 572,4055.7%Hispanic
- 450,0314.5%Two or more races
- 335,7323.3%Asian alone
- 45,2170.5%Other race alone
- 29,0110.3%American Indian alone
- 2,2070.02%Native Hawaiian and Other
Pacific Islander alone

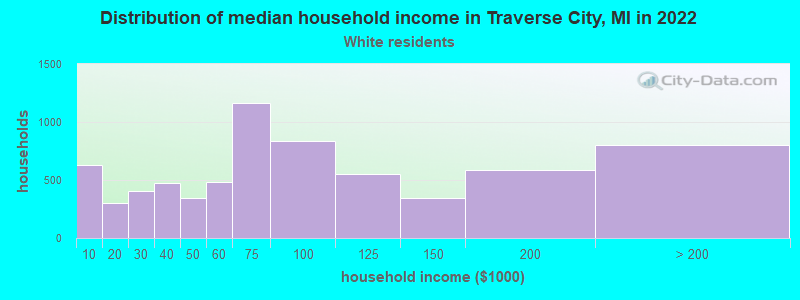
Income and house value in Traverse City
- Median household income in 2022
- $70,088White non-Hispanic householders
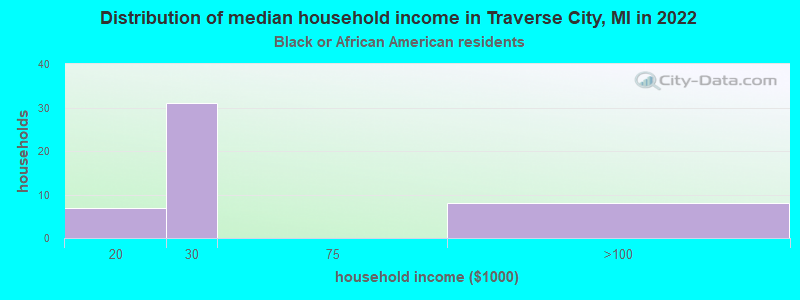
- $27,976Black householders
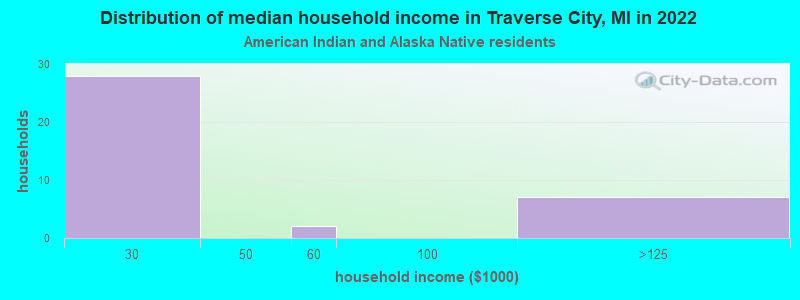
- $29,767American Indian and Alaska Native householders
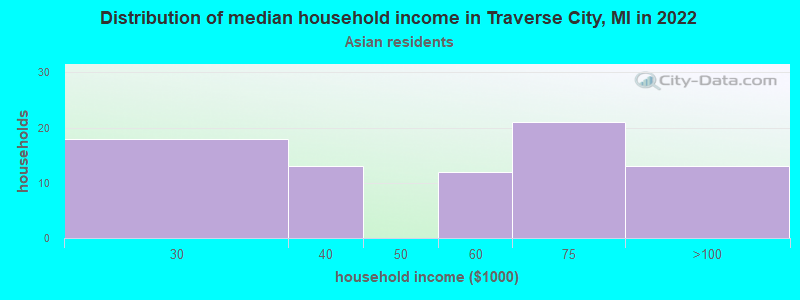
- $55,475Asian householders
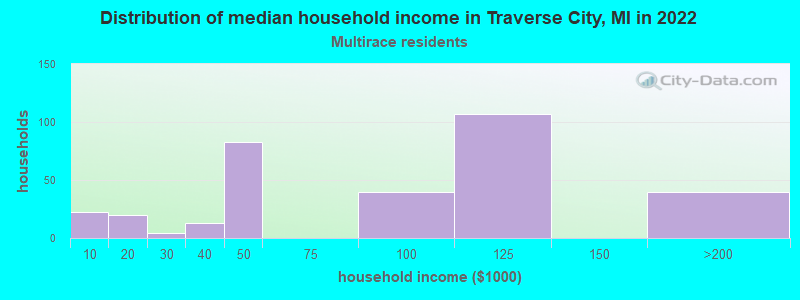
- $84,524Two or more races householders
- $62,002Hispanic or Latino race householders
- Median 2022 house value
- $416,743White Non-Hispanic householders
- $627,121Black or African American householders
- $257,538American Indian or Alaska Native householders
- $253,190Some other race householders
- $262,889Hispanic or Latino householders
Household income for White non-Hispanic householders
Household income for Black householders
Household income for American Indian and Alaska Native householders
Household income for Asian householders
Household income for Two or more races householders
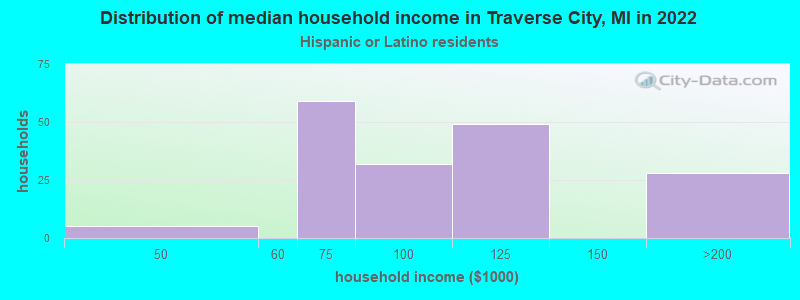
Household income for Hispanic or Latino race householders
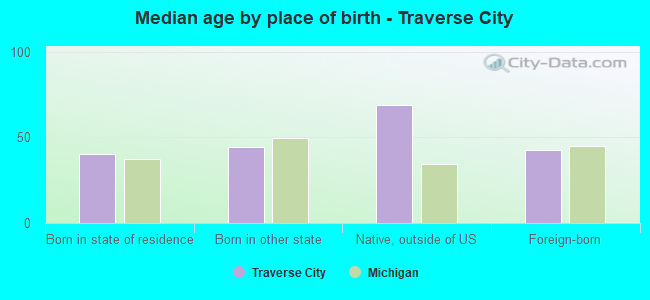
Median age by race in Traverse City
- 44.4Median age for White residents
- 41.1Males
- 46.3Females
- 28.9Median age for Black or African American residents
- 29.0Males
- 25.1Females
- 51.3Median age for American Indian / Alaska Native residents
- 50.6Males
- 67.0Females
- 42.7Median age for Asian residents
- 41.2Males
- 42.4Females
- -670,531,400.3Median age for Native Hawaiian / Pacific Islander residents
- -666,666,666.0Males
- -666,666,666.0Females
- -705,627,704.9Median age for Other race residents
- -713,178,293.9Males
- -696,109,357.9Females
- 31.7Median age for Two or more races residents
- 42.5Males
- 25.8Females
- 45.4Median age for White alone residents
- 42.0Males
- 46.7Females
- 29.7Median age for Hispanic or Latino residents
- 27.5Males
- 20.6Females
Owner/renter occupied households by race in Traverse City
- House owners and renters - White residents
- 4,31363.8%Owner occupied
- 2,44836.2%Renter occupied
- House owners and renters - Black or African American residents
- 816.8%Owner occupied
- 4083.2%Renter occupied
- House owners and renters - American Indian / Alaska Native residents
- 24.6%Owner occupied
- 4395.4%Renter occupied
- House owners and renters - Asian residents
- 2535.5%Owner occupied
- 4664.5%Renter occupied
- House owners and renters - Other race residents
- 50100.0%Owner occupied
- House owners and renters - Two or more races residents
- 16549.0%Owner occupied
- 17151.0%Renter occupied
- House owners and renters - White alone residents
- 4,31564.1%Owner occupied
- 2,41235.9%Renter occupied
- House owners and renters - Hispanic or Latino residents
- 4439.5%Owner occupied
- 6860.5%Renter occupied
Language usage in Traverse City
- English speakers - Total
- 95.9% of residents of Traverse City speak English at home.
- 1.9% of residents speak Spanish at home
- 22880.3%Speak English very well
- 5619.7%Speak English less than very well
- 1.9% of residents speak other language at home
- 20270.1%Speak English very well
- 8629.9%Speak English less than very well
- English speakers - Born in the United States
- 98.9% of residents of Traverse City speak English at home.
- 0.7% of residents speak Spanish at home
- 24100.0%Speak English very well
- English speakers - Native, born elsewhere
- 73.5% of residents of Traverse City speak English at home.
- 18.1% of residents speak Spanish at home
- 28100.0%Speak English very well
- 9.7% of residents speak other language at home
- 15100.0%Speak English very well
- English speakers - Foreign-born
- 42.9% of residents of Traverse City speak English at home.
- 11.4% of residents speak Spanish at home
- 711.9%Speak English very well
- 5288.1%Speak English less than very well
- 43.1% of residents speak other language at home
- 13761.4%Speak English very well
- 8638.6%Speak English less than very well
White (Caucasian) - Speak only English
| Native: | 98.9% (12,966) |
| Foreign-born: | 56.1% (145) |
White (Caucasian) - Speak another language
| Native: | 1.3% (169) |
| Foreign-born: | 44.0% (114) |
Black or African American - Speak only English
| Native: | 100.0% (198) |
| Foreign-born: | 93.1% (7) |
Asian - Speak only English
| Native: | 96.8% (10) |
| Foreign-born: | 33.2% (68) |
Two or more races - Speak another language
| Native: | 16.5% (119) |
| Foreign-born: | 100.0% (34) |
White alone - Speak only English
| Native: | 98.8% (12,827) |
| Foreign-born: | 59.0% (142) |
White alone - Speak another language
| Native: | 1.2% (156) |
| Foreign-born: | 38.0% (91) |
Hispanic or Latino - Speak only English
| Native: | 68.8% (287) |
| Foreign-born: | 7.6% (5) |
Hispanic or Latino - Speak another language
| Native: | 31.1% (130) |
| Foreign-born: | 92.4% (59) |
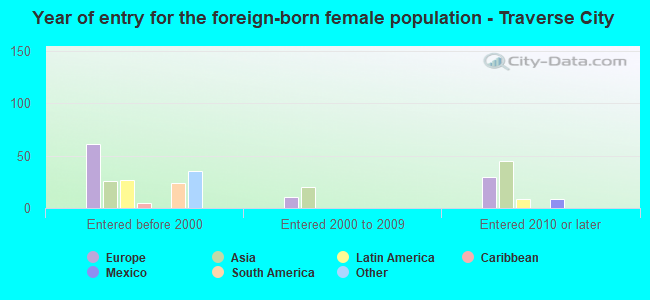
Foreign-born residents in Traverse City
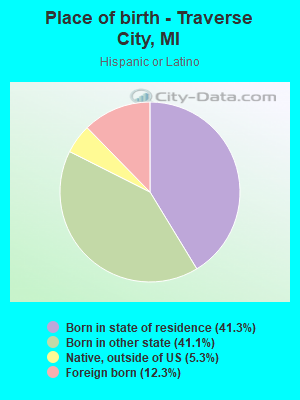
517 residents are foreign born (1.4% Asia, 1.2% Europe, 0.4% Latin America).
| This city: | 3.3% |
| Michigan: | 6.9% |

Marital status for residents in Traverse City
Marital status - White (Caucasian) population 15 years and over
- Males
- 40.4%Never married
- 44.1%Now married
- 0.5%Separated
- 2.6%Widowed
- 12.4%Divorced
- Females
- 29.9%Never married
- 38.9%Now married
- 0.4%Separated
- 11.7%Widowed
- 19.1%Divorced
Women who gave birth in the past 12 months
| Now married: | 59.4% (37) |
| Unmarried: | 40.6% (25) |
Women who did not give birth in the past 12 months
| Now married: | 35.9% (996) |
| Unmarried: | 64.1% (1,777) |
Marital status - Black or African American population 15 years and over
- Males
- 90.3%Never married
- 0.0%Now married
- 5.5%Separated
- 4.1%Widowed
- 0.0%Divorced
- Females
- 100.0%Never married
- 0.0%Now married
- 0.0%Separated
- 0.0%Widowed
- 0.0%Divorced
Women who did not give birth in the past 12 months
| Now married: | 0.0% (0) |
| Unmarried: | 100.0% (37) |
Marital status - American Indian / Alaska Native population 15 years and over
- Males
- 76.6%Never married
- 4.3%Now married
- 0.0%Separated
- 0.0%Widowed
- 19.1%Divorced
- Females
- 28.6%Never married
- 0.0%Now married
- 0.0%Separated
- 0.0%Widowed
- 71.4%Divorced
Women who did not give birth in the past 12 months
| Now married: | 0.0% (0) |
| Unmarried: | 100.0% (14) |
Marital status - Asian population 15 years and over
- Males
- 38.3%Never married
- 61.7%Now married
- 0.0%Separated
- 0.0%Widowed
- 0.0%Divorced
- Females
- 43.3%Never married
- 56.7%Now married
- 0.0%Separated
- 0.0%Widowed
- 0.0%Divorced
Women who did not give birth in the past 12 months
| Now married: | 44.7% (22) |
| Unmarried: | 55.3% (27) |
Marital status - Two or more races population 15 years and over
- Males
- 45.2%Never married
- 46.2%Now married
- 0.0%Separated
- 0.0%Widowed
- 8.6%Divorced
- Females
- 55.6%Never married
- 37.6%Now married
- 0.0%Separated
- 0.8%Widowed
- 6.0%Divorced
Women who did not give birth in the past 12 months
| Now married: | 23.4% (57) |
| Unmarried: | 76.6% (188) |
Marital status - White alone, not Hispanic / Latino population 15 years and over
- Males
- 40.5%Never married
- 43.7%Now married
- 0.5%Separated
- 2.7%Widowed
- 12.6%Divorced
- Females
- 29.4%Never married
- 39.0%Now married
- 0.4%Separated
- 11.9%Widowed
- 19.3%Divorced
Women who gave birth in the past 12 months
| Now married: | 49.0% (24) |
| Unmarried: | 51.0% (25) |
Women who did not give birth in the past 12 months
| Now married: | 36.5% (999) |
| Unmarried: | 63.5% (1,739) |
Marital status - Hispanic or Latino population 15 years and over
- Males
- 41.1%Never married
- 58.9%Now married
- 0.0%Separated
- 0.0%Widowed
- 0.0%Divorced
- Females
- 39.8%Never married
- 48.1%Now married
- 8.3%Separated
- 1.0%Widowed
- 2.9%Divorced
Women who gave birth in the past 12 months
| Now married: | 100.0% (14) |
| Unmarried: | 0.0% (0) |
Women who did not give birth in the past 12 months
| Now married: | 48.5% (82) |
| Unmarried: | 51.5% (88) |
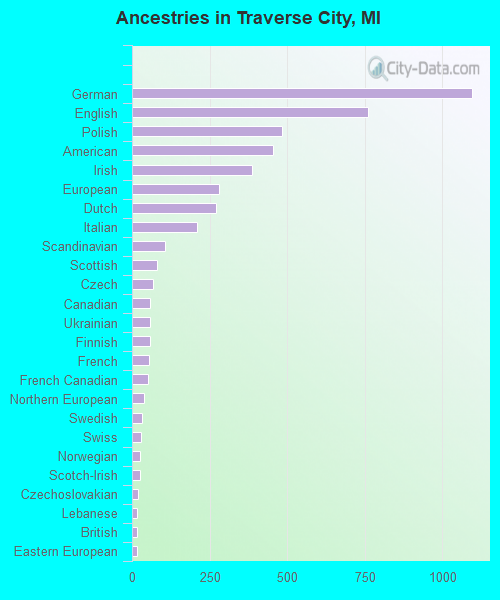
Ancestries in Traverse City

- 1,09619.0%German
- 76213.2%English
- 4838.4%Polish
- 4547.9%American
- 3866.7%Irish
- 2804.9%European
- 2714.7%Dutch
- 2093.6%Italian
- 1051.8%Scandinavian
- 821.4%Scottish
- 671.2%Czech
- 581.0%Canadian
- 581.0%Ukrainian
- 571.0%Finnish
- 561.0%French
- 530.9%French Canadian
- 400.7%Northern European
- 330.6%Swedish
- 290.5%Swiss
- 270.5%Norwegian
- 260.5%Scotch-Irish
- 180.3%Czechoslovakian
- 170.3%Lebanese
- 150.3%British
- 150.3%Eastern European
- 140.2%Turkish
- 130.2%Hungarian
- 110.2%Belgian
- 110.2%Slavic
- 100.2%Nigerian
- 40.07%Romanian
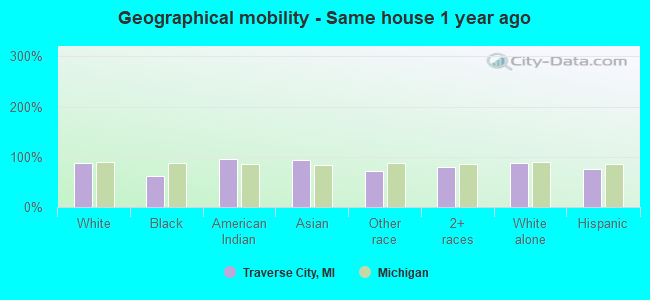
Geographical mobility in Traverse City

- Same house 1 year ago
- 12,16687.4%White (Caucasian)
- 13461.9%Black or African American
- 9295.0%American Indian / Alaska Native
- 20493.7%Asian
- 4971.0%Other race
- 82679.8%Two or more races
- 12,00987.5%White alone, not Hispanic / Latino
- 43075.9%Hispanic or Latino
-
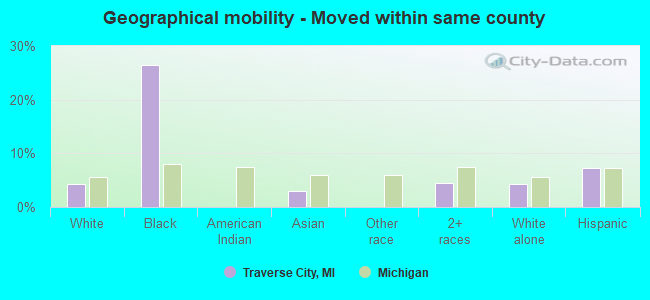
- Moved within same county
- 6084.4%White / Caucasian
- 5726.4%Black or African American
- 73.0%Asian
- 474.5%Two or more races
- 5874.3%White alone, not Hispanic / Latino
- 417.2%Hispanic or Latino
-
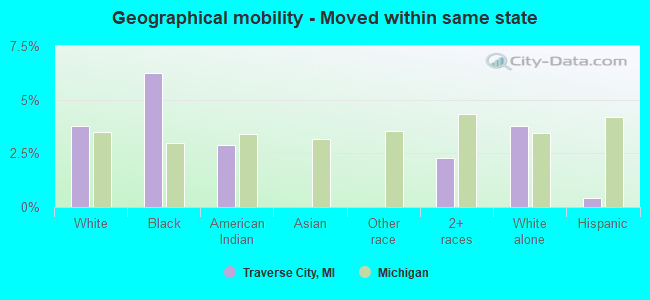
- Moved within same state
- 5233.8%White / Caucasian
- 146.2%Black or African American
- 32.9%American Indian / Alaska Native
- 242.3%Two or more races
- 5163.8%White alone, not Hispanic / Latino
- 20.4%Hispanic or Latino
-
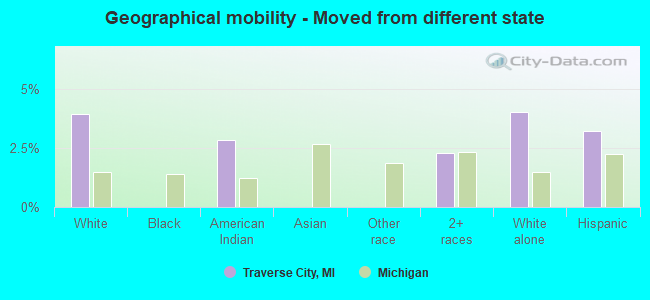
- Moved from different state
- 5483.9%White / Caucasian
- 32.8%American Indian / Alaska Native
- 242.3%Two or more races
- 5484.0%White alone, not Hispanic / Latino
- 183.2%Hispanic or Latino
-
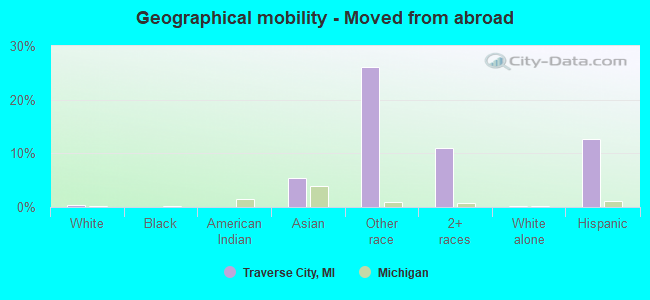
- Moved from abroad
- 430.3%White
- 125.4%Asian
- 1826.1%Other race
- 11411.0%Two or more races
- 370.3%White alone, not Hispanic / Latino
- 7212.7%Hispanic or Latino
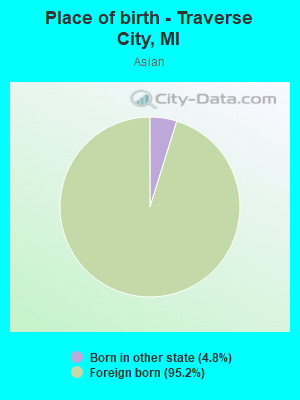
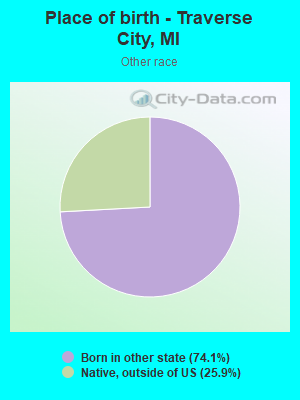
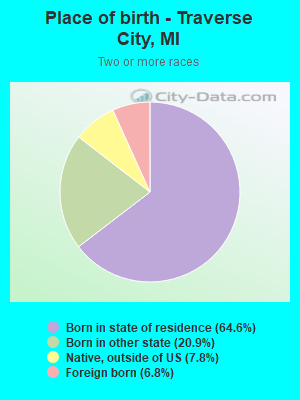
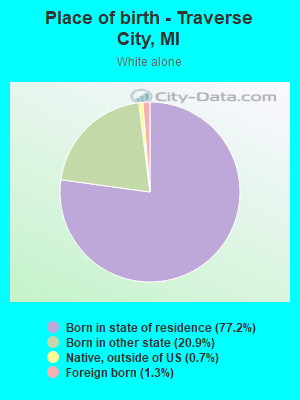
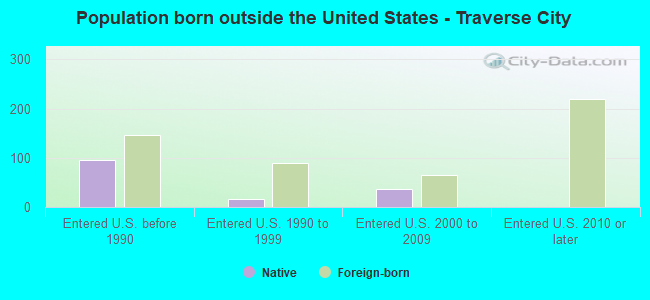
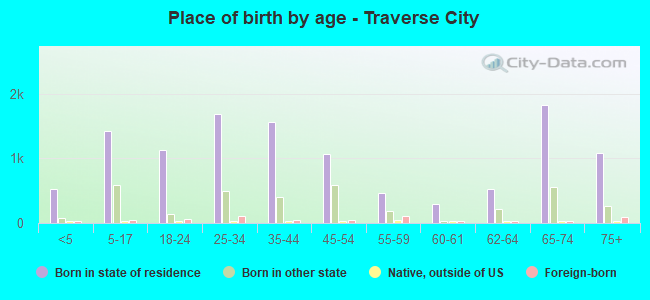
Children Nativity (place of birth) in Traverse City
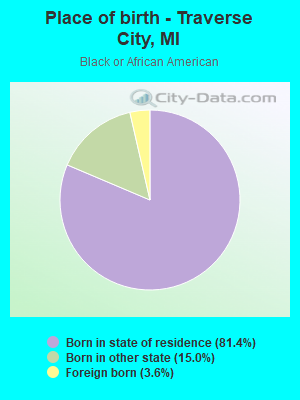
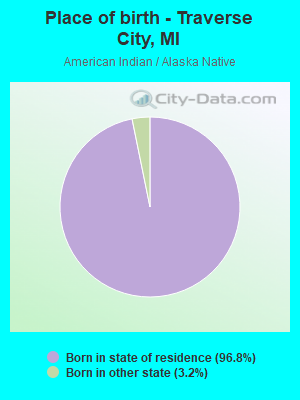
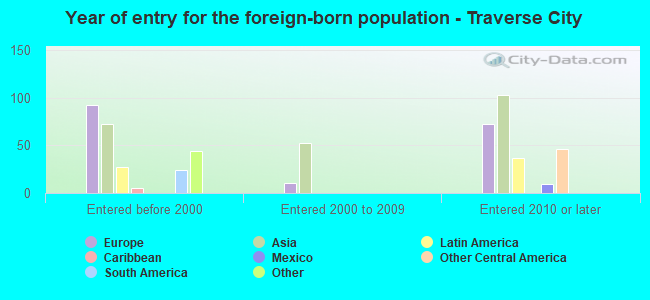
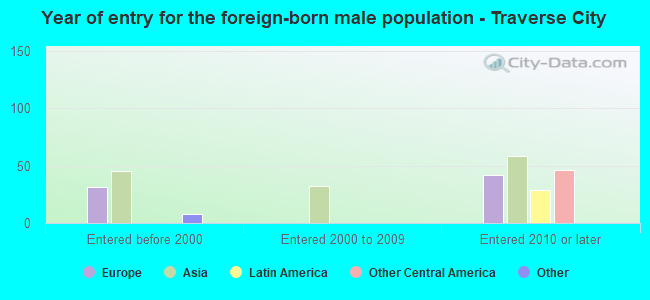
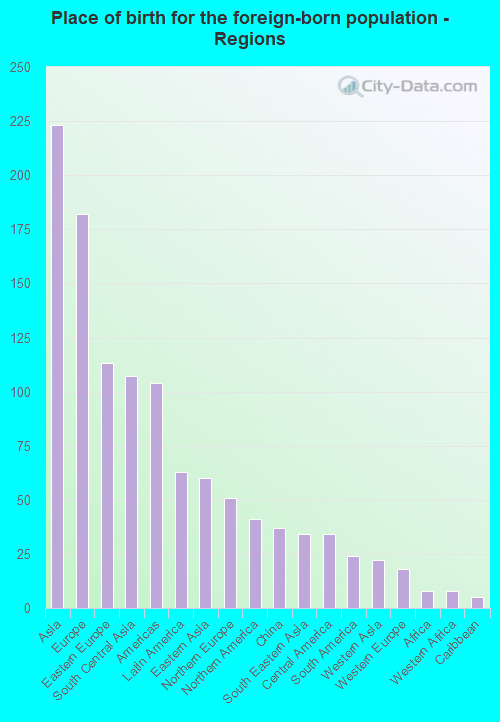
Place of birth for residents in Traverse City
![Place of birth for the foreign-born population - Regions]()
- 223Asia
- 182Europe
- 113Eastern Europe
- 107South Central Asia
- 104Americas
- 63Latin America
- 60Eastern Asia
- 51Northern Europe
- 41Northern America
- 37China
- 34South Eastern Asia
- 34Central America
- 24South America
- 22Western Asia
- 18Western Europe
- 8Africa
- 8Western Africa
- 5Caribbean
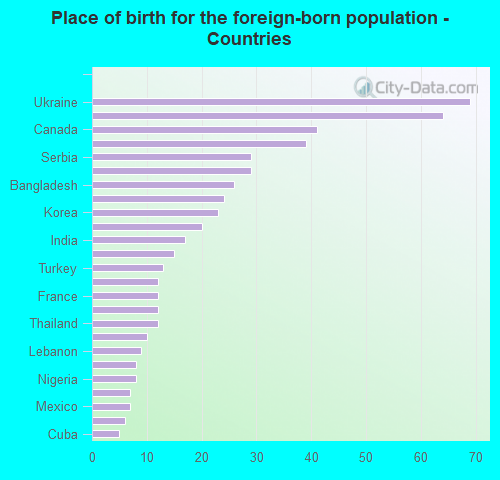
![Place of birth for the foreign-born population - Countries]()
- 69Ukraine
- 64Sri Lanka
- 41Canada
- 39United Kingdom
- 29Serbia
- 29Hong Kong
- 26Bangladesh
- 24Colombia
- 23Korea
- 20El Salvador
- 17India
- 15Romania
- 13Turkey
- 12England
- 12France
- 12Philippines
- 12Thailand
- 10Indonesia
- 9Lebanon
- 8China
- 8Nigeria
- 7Costa Rica
- 7Mexico
- 6Germany
- 5Cuba
Grandparents responsible for own grandchildren in Traverse City
Zip codes: 49686.