Races in Tell City, Indiana (IN) Detailed Stats
Data:
Races - White alone (%)
Races - White alone (% change since 2000)
Races - Black alone (%)
Races - Black alone (% change since 2000)
Races - American Indian alone (%)
Races - American Indian alone (% change since 2000)
Races - Asian alone (%)
Races - Asian alone (% change since 2000)
Races - Hispanic (%)
Races - Hispanic (% change since 2000)
Races - Native Hawaiian and Other Pacific Islander alone (%)
Races - Native Hawaiian and Other Pacific Islander alone (% change since 2000)
Races - Two or more races(%)
Races - Two or more races(% change since 2000)
Races - Other race alone (%)
Races - Other race alone (% change since 2000)
Racial diversity
Place of birth - Born in state of residence (%)
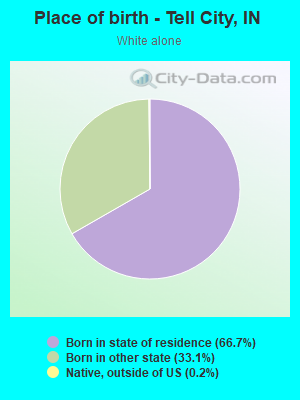
Place of birth - Born in state of residence (%) - White
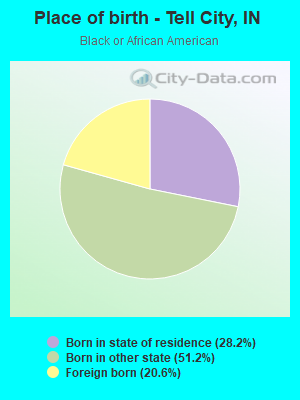
Place of birth - Born in state of residence (%) - Black or African American
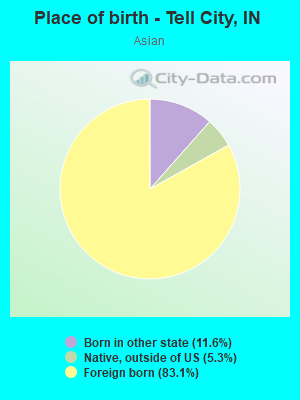
Place of birth - Born in state of residence (%) - Asian
Place of birth - Born in state of residence (%) - Hispanic or Latino
Place of birth - Born in state of residence (%) - American Indian and Alaska Native
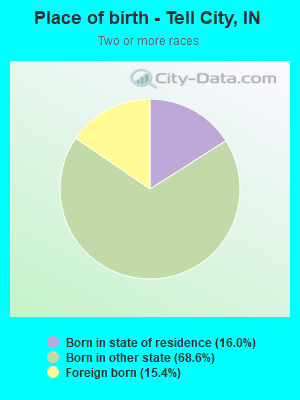
Place of birth - Born in state of residence (%) - Multirace
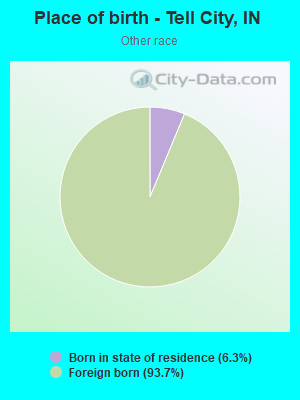
Place of birth - Born in state of residence (%) - Other Race
Place of birth - Born in other state (%)
Place of birth - Born in other state (%) - White
Place of birth - Born in other state (%) - Black or African American
Place of birth - Born in other state (%) - Asian
Place of birth - Born in other state (%) - Hispanic or Latino
Place of birth - Born in other state (%) - American Indian and Alaska Native
Place of birth - Born in other state (%) - Multirace
Place of birth - Born in other state (%) - Other Race
Place of birth - Native, outside of US (%)
Place of birth - Native, outside of US (%) - White
Place of birth - Native, outside of US (%) - Black or African American
Place of birth - Native, outside of US (%) - Asian
Place of birth - Native, outside of US (%) - Hispanic or Latino
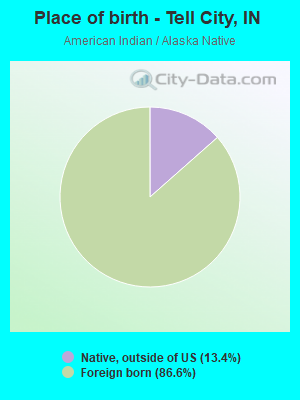
Place of birth - Native, outside of US (%) - American Indian and Alaska Native
Place of birth - Native, outside of US (%) - Multirace
Place of birth - Native, outside of US (%) - Other Race
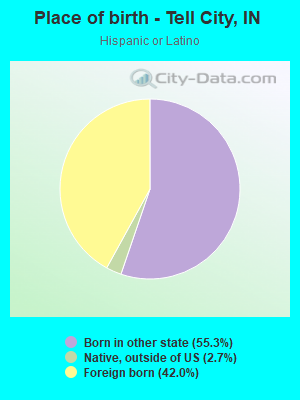
Place of birth - Foreign born (%)
Place of birth - Foreign born (%) - White
Place of birth - Foreign born (%) - Black or African American
Place of birth - Foreign born (%) - Asian
Place of birth - Foreign born (%) - Hispanic or Latino
Place of birth - Foreign born (%) - American Indian and Alaska Native
Place of birth - Foreign born (%) - Multirace
Place of birth - Foreign born (%) - Other Race
Residents speaking English at home (%)
Residents speaking English at home - Born in the United States (%)
Residents speaking English at home - Native, born elsewhere (%)
Residents speaking English at home - Foreign born (%)
Residents speaking Spanish at home (%)
Residents speaking Spanish at home - Born in the United States (%)
Residents speaking Spanish at home - Native, born elsewhere (%)
Residents speaking Spanish at home - Foreign born (%)
Residents speaking other language at home (%)
Residents speaking other language at home - Born in the United States (%)
Residents speaking other language at home - Native, born elsewhere (%)
Residents speaking other language at home - Foreign born (%)
Marital status - Never married (%)
Marital status - Now married (%)
Marital status - Separated (%)
Marital status - Widowed (%)
Marital status - Divorced (%)
Ancestries Reported - Arab (%)
Ancestries Reported - Czech (%)
Ancestries Reported - Danish (%)
Ancestries Reported - Dutch (%)
Ancestries Reported - English (%)
Ancestries Reported - French (%)
Ancestries Reported - French Canadian (%)
Ancestries Reported - German (%)
Ancestries Reported - Greek (%)
Ancestries Reported - Hungarian (%)
Ancestries Reported - Irish (%)
Ancestries Reported - Italian (%)
Ancestries Reported - Lithuanian (%)
Ancestries Reported - Norwegian (%)
Ancestries Reported - Polish (%)
Ancestries Reported - Portuguese (%)
Ancestries Reported - Russian (%)
Ancestries Reported - Scotch-Irish (%)
Ancestries Reported - Scottish (%)
Ancestries Reported - Slovak (%)
Ancestries Reported - Subsaharan African (%)
Ancestries Reported - Swedish (%)
Ancestries Reported - Swiss (%)
Ancestries Reported - Ukrainian (%)
Ancestries Reported - United States (%)
Ancestries Reported - Welsh (%)
Ancestries Reported - West Indian (%)
Ancestries Reported - Other (%)
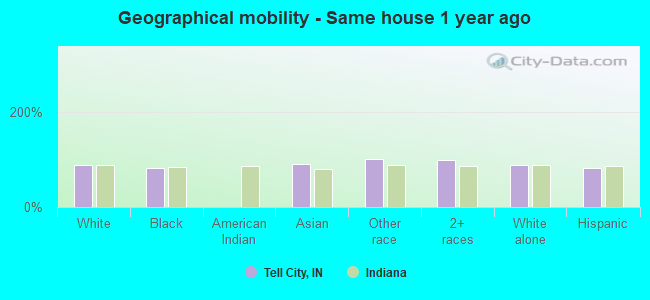
Geographical mobility - Same house 1 year ago (%)
Geographical mobility - Same house 1 year ago (%) - White
Geographical mobility - Same house 1 year ago (%) - Black or African American
Geographical mobility - Same house 1 year ago (%) - Asian
Geographical mobility - Same house 1 year ago (%) - Hispanic or Latino
Geographical mobility - Same house 1 year ago (%) - American Indian and Alaska Native
Geographical mobility - Same house 1 year ago (%) - Multirace
Geographical mobility - Same house 1 year ago (%) - Other Race
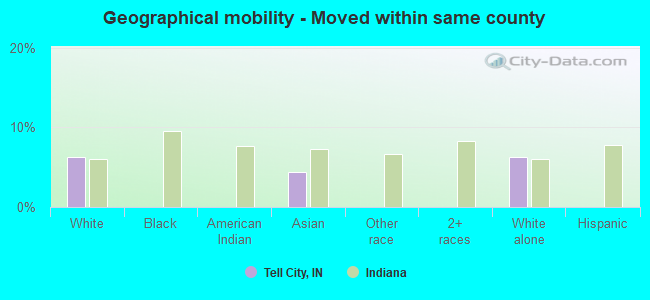
Geographical mobility - Moved within same county (%)
Geographical mobility - Moved within same county (%) - White
Geographical mobility - Moved within same county (%) - Black or African American
Geographical mobility - Moved within same county (%) - Asian
Geographical mobility - Moved within same county (%) - Hispanic or Latino
Geographical mobility - Moved within same county (%) - American Indian and Alaska Native
Geographical mobility - Moved within same county (%) - Multirace
Geographical mobility - Moved within same county (%) - Other Race
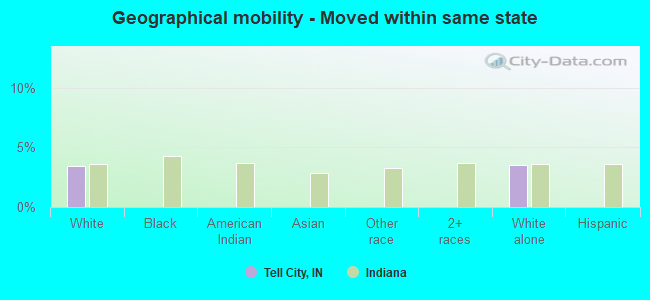
Geographical mobility - Moved from different county within same state (%)
Geographical mobility - Moved from different county within same state (%) - White
Geographical mobility - Moved from different county within same state (%) - Black or African American
Geographical mobility - Moved from different county within same state (%) - Asian
Geographical mobility - Moved from different county within same state (%) - Hispanic or Latino
Geographical mobility - Moved from different county within same state (%) - American Indian and Alaska Native
Geographical mobility - Moved from different county within same state (%) - Multirace
Geographical mobility - Moved from different county within same state (%) - Other Race
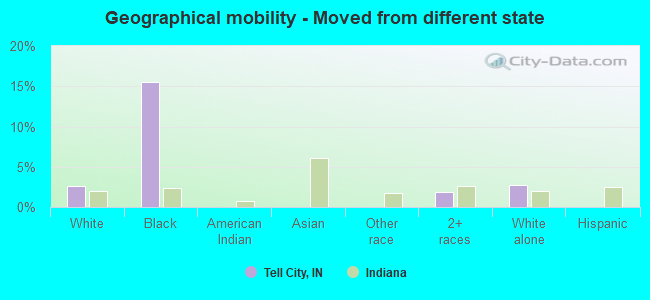
Geographical mobility - Moved from different state (%)
Geographical mobility - Moved from different state (%) - White
Geographical mobility - Moved from different state (%) - Black or African American
Geographical mobility - Moved from different state (%) - Asian
Geographical mobility - Moved from different state (%) - Hispanic or Latino
Geographical mobility - Moved from different state (%) - American Indian and Alaska Native
Geographical mobility - Moved from different state (%) - Multirace
Geographical mobility - Moved from different state (%) - Other Race
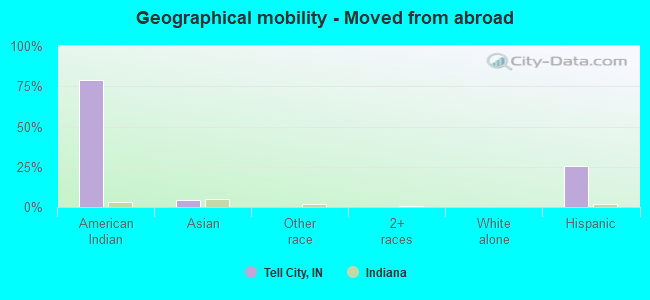
Geographical mobility - Moved from abroad (%)
Geographical mobility - Moved from abroad (%) - White
Geographical mobility - Moved from abroad (%) - Black or African American
Geographical mobility - Moved from abroad (%) - Asian
Geographical mobility - Moved from abroad (%) - Hispanic or Latino
Geographical mobility - Moved from abroad (%) - American Indian and Alaska Native
Geographical mobility - Moved from abroad (%) - Multirace
Geographical mobility - Moved from abroad (%) - Other Race
Place of birth for the foreign-born population - Ireland (%)
Place of birth for the foreign-born population - Denmark (%)
Place of birth for the foreign-born population - Norway (%)
Place of birth for the foreign-born population - Sweden (%)
Place of birth for the foreign-born population - United Kingdom (%)
Place of birth for the foreign-born population - England (%)
Place of birth for the foreign-born population - Scotland (%)
Place of birth for the foreign-born population - Other Northern Europe (%)
Place of birth for the foreign-born population - Austria (%)
Place of birth for the foreign-born population - Belgium (%)
Place of birth for the foreign-born population - France (%)
Place of birth for the foreign-born population - Germany (%)
Place of birth for the foreign-born population - Netherlands (%)
Place of birth for the foreign-born population - Switzerland (%)
Place of birth for the foreign-born population - Other Western Europe (%)
Place of birth for the foreign-born population - Greece (%)
Place of birth for the foreign-born population - Italy (%)
Place of birth for the foreign-born population - Portugal (%)
Place of birth for the foreign-born population - Spain (%)
Place of birth for the foreign-born population - Other Southern Europe (%)
Place of birth for the foreign-born population - Albania (%)
Place of birth for the foreign-born population - Belarus (%)
Place of birth for the foreign-born population - Bosnia and Herzegovina (%)
Place of birth for the foreign-born population - Bulgaria (%)
Place of birth for the foreign-born population - Croatia (%)
Place of birth for the foreign-born population - Czechoslovakia (%)
Place of birth for the foreign-born population - Hungary (%)
Place of birth for the foreign-born population - Latvia (%)
Place of birth for the foreign-born population - Lithuania (%)
Place of birth for the foreign-born population - North Macedonia (Macedonia) (%)
Place of birth for the foreign-born population - Moldova (%)
Place of birth for the foreign-born population - Poland (%)
Place of birth for the foreign-born population - Romania (%)
Place of birth for the foreign-born population - Russia (%)
Place of birth for the foreign-born population - Serbia (%)
Place of birth for the foreign-born population - Ukraine (%)
Place of birth for the foreign-born population - Other Eastern Europe (%)
Place of birth for the foreign-born population - China (%)
Place of birth for the foreign-born population - Hong Kong (%)
Place of birth for the foreign-born population - Taiwan (%)
Place of birth for the foreign-born population - Japan (%)
Place of birth for the foreign-born population - Korea (%)
Place of birth for the foreign-born population - Other Eastern Asia (%)
Place of birth for the foreign-born population - Afghanistan (%)
Place of birth for the foreign-born population - Bangladesh (%)
Place of birth for the foreign-born population - India (%)
Place of birth for the foreign-born population - Iran (%)
Place of birth for the foreign-born population - Kazakhstan (%)
Place of birth for the foreign-born population - Nepal (%)
Place of birth for the foreign-born population - Pakistan (%)
Place of birth for the foreign-born population - Sri Lanka (%)
Place of birth for the foreign-born population - Uzbekistan (%)
Place of birth for the foreign-born population - Other South Central Asia (%)
Place of birth for the foreign-born population - Burma (%)
Place of birth for the foreign-born population - Cambodia (%)
Place of birth for the foreign-born population - Indonesia (%)
Place of birth for the foreign-born population - Laos (%)
Place of birth for the foreign-born population - Malaysia (%)
Place of birth for the foreign-born population - Philippines (%)
Place of birth for the foreign-born population - Singapore (%)
Place of birth for the foreign-born population - Thailand (%)
Place of birth for the foreign-born population - Vietnam (%)
Place of birth for the foreign-born population - Other South Eastern Asia (%)
Place of birth for the foreign-born population - Armenia (%)
Place of birth for the foreign-born population - Iraq (%)
Place of birth for the foreign-born population - Israel (%)
Place of birth for the foreign-born population - Jordan (%)
Place of birth for the foreign-born population - Kuwait (%)
Place of birth for the foreign-born population - Lebanon (%)
Place of birth for the foreign-born population - Saudi Arabia (%)
Place of birth for the foreign-born population - Syria (%)
Place of birth for the foreign-born population - Turkey (%)
Place of birth for the foreign-born population - Yemen (%)
Place of birth for the foreign-born population - Other Western Asia (%)
Place of birth for the foreign-born population - Eritrea (%)
Place of birth for the foreign-born population - Ethiopia (%)
Place of birth for the foreign-born population - Kenya (%)
Place of birth for the foreign-born population - Somalia (%)
Place of birth for the foreign-born population - Uganda (%)
Place of birth for the foreign-born population - Zimbabwe (%)
Place of birth for the foreign-born population - Other Eastern Africa (%)
Place of birth for the foreign-born population - Cameroon (%)
Place of birth for the foreign-born population - Congo (%)
Place of birth for the foreign-born population - Democratic Republic of Congo (Zaire) (%)
Place of birth for the foreign-born population - Other Middle Africa (%)
Place of birth for the foreign-born population - Egypt (%)
Place of birth for the foreign-born population - Morocco (%)
Place of birth for the foreign-born population - Sudan (%)
Place of birth for the foreign-born population - Other Northern Africa (%)
Place of birth for the foreign-born population - South Africa (%)
Place of birth for the foreign-born population - Other Southern Africa (%)
Place of birth for the foreign-born population - Cabo Verde (%)
Place of birth for the foreign-born population - Ghana (%)
Place of birth for the foreign-born population - Liberia (%)
Place of birth for the foreign-born population - Nigeria (%)
Place of birth for the foreign-born population - Senegal (%)
Place of birth for the foreign-born population - Sierra Leone (%)
Place of birth for the foreign-born population - Other Western Africa (%)
Place of birth for the foreign-born population - Australia (%)
Place of birth for the foreign-born population - New Zealand (%)
Place of birth for the foreign-born population - Fiji (%)
Place of birth for the foreign-born population - Micronesia (%)
Place of birth for the foreign-born population - Bahamas (%)
Place of birth for the foreign-born population - Barbados (%)
Place of birth for the foreign-born population - Cuba (%)
Place of birth for the foreign-born population - Dominica (%)
Place of birth for the foreign-born population - Dominican Republic (%)
Place of birth for the foreign-born population - Grenada (%)
Place of birth for the foreign-born population - Haiti (%)
Place of birth for the foreign-born population - Jamaica (%)
Place of birth for the foreign-born population - St. Vincent and the Grenadines (%)
Place of birth for the foreign-born population - Trinidad and Tobago (%)
Place of birth for the foreign-born population - West Indies (%)
Place of birth for the foreign-born population - Other Caribbean (%)
Place of birth for the foreign-born population - Belize (%)
Place of birth for the foreign-born population - Costa Rica (%)
Place of birth for the foreign-born population - El Salvador (%)
Place of birth for the foreign-born population - Guatemala (%)
Place of birth for the foreign-born population - Honduras (%)
Place of birth for the foreign-born population - Mexico (%)
Place of birth for the foreign-born population - Nicaragua (%)
Place of birth for the foreign-born population - Panama (%)
Place of birth for the foreign-born population - Other Central America (%)
Place of birth for the foreign-born population - Argentina (%)
Place of birth for the foreign-born population - Bolivia (%)
Place of birth for the foreign-born population - Brazil (%)
Place of birth for the foreign-born population - Chile (%)
Place of birth for the foreign-born population - Colombia (%)
Place of birth for the foreign-born population - Ecuador (%)
Place of birth for the foreign-born population - Guyana (%)
Place of birth for the foreign-born population - Peru (%)
Place of birth for the foreign-born population - Uruguay (%)
Place of birth for the foreign-born population - Venezuela (%)
Place of birth for the foreign-born population - Other South America (%)
Place of birth for the foreign-born population - Canada (%)
Place of birth for the foreign-born population - Other Northern America (%)
Place of birth for the foreign-born population - Other (%)
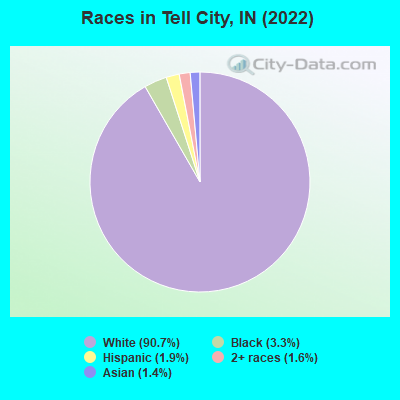
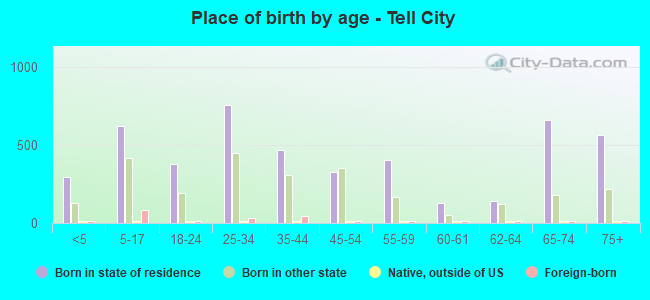
According to 2022 data, the most numerous races in Tell City, IN are White alone (6,825 residents), Black alone (248 residents), and Hispanic (146 residents). 96.7% of Tell City residents speak English at home. 2.6% of Tell City, IN residents are foreign-born (1.2% born in Asia, 0.8% born in Latin America, 0.5% born in Africa), which is 128.0% less than the foreign-born rate of 6.0% across the entire state of Indiana.
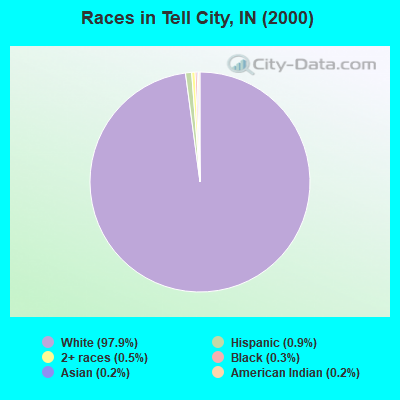
Race distribution in Tell City
2000 2022
5,219,373 85.8% White alone 505,462 8.3% Black alone 214,536 3.5% Hispanic 61,115 1.0% Two or more races 58,424 1.0% Asian alone 13,654 0.2% American Indian alone 6,348 0.1% Other race alone 1,573 0.03% Native Hawaiian and Other
5,192,455 76.0% White alone 628,054 9.2% Black alone 534,528 7.8% Hispanic 263,242 3.9% Two or more races 172,880 2.5% Asian alone 33,467 0.5% Other race alone 5,866 0.09% American Indian alone 2,545 0.04% Native Hawaiian and Other
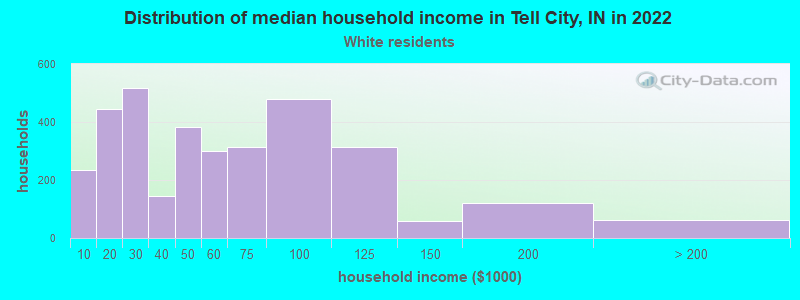
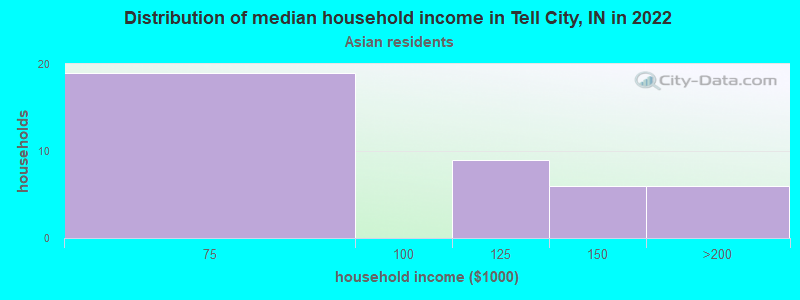
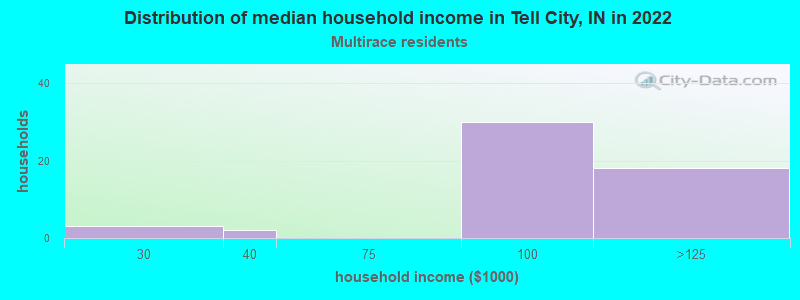
Income and house value in Tell City Median household income in 2022 $49,305 White non-Hispanic householders$100,470 Asian householders$84,420 Two or more races householdersMedian 2022 house value $132,969 White Non-Hispanic householders$123,648 Hispanic or Latino householders
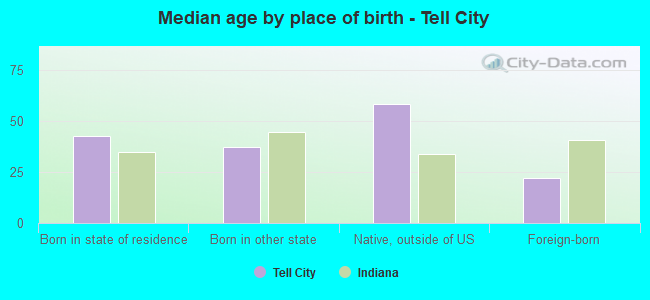
Median age by race in Tell City
40.6 Median age for White residents36.9 48.2 30.3 Median age for Black or African American residents47.8 26.0 18.4 Median age for American Indian / Alaska Native residents-654,255,318.5 20.3 34.7 Median age for Asian residents41.8 33.4 -664,335,663.7 Median age for Native Hawaiian / Pacific Islander residents-644,025,156.6 -664,437,011.6 13.5 Median age for Other race residents-691,695,107.4 -726,190,475.5 26.6 Median age for Two or more races residents31.5 27.2 40.4 Median age for White alone residents36.7 47.9 23.6 Median age for Hispanic or Latino residents20.8 24.6
Owner/renter occupied households by race in Tell City
House owners and renters - White residents 2,160 64.4% Owner occupied1,195 35.6% Renter occupiedHouse owners and renters - Black or African American residents 23 100.0% Renter occupiedHouse owners and renters - American Indian / Alaska Native residents 6 100.0% Renter occupiedHouse owners and renters - Asian residents 11 28.1% Owner occupied27 71.9% Renter occupiedHouse owners and renters - Other race residents 6 100.0% Renter occupiedHouse owners and renters - Two or more races residents 48 94.4% Owner occupied3 5.6% Renter occupiedHouse owners and renters - White alone residents 2,178 64.1% Owner occupied1,217 35.9% Renter occupiedHouse owners and renters - Hispanic or Latino residents 9 100.0% Renter occupied
Language usage in Tell City
English speakers - Total 96.7% of residents of Tell City speak English at home.
1.5% of residents speak Spanish at home 76 72.4% Speak English very well29 27.6% Speak English less than very well1.1% of residents speak other language at home 21 27.6% Speak English very well55 72.4% Speak English less than very well
English speakers - Born in the United States 97.0% of residents of Tell City speak English at home.
2.4% of residents speak Spanish at home 59 100.0% Speak English very well0.1% of residents speak other language at home 3 100.0% Speak English very well
English speakers - Native, born elsewhere 81.0% of residents of Tell City speak English at home.
19.0% of residents speak Spanish at home 4 100.0% Speak English less than very well
English speakers - Foreign-born 32.6% of residents of Tell City speak English at home.
24.3% of residents speak Spanish at home 19 43.2% Speak English very well25 56.8% Speak English less than very well40.9% of residents speak other language at home 18 24.3% Speak English very well56 75.7% Speak English less than very well
Black or African American - Speak only English Native:
99.5% (204)Foreign-born:
68.2% (37)
American Indian / Alaska Native - Speak another language Native:
100.0% (7)Foreign-born:
100.0% (35)
Asian - Speak only English Native:
75.8% (13)Foreign-born:
5.8% (4)
Asian - Speak another language Native:
21.0% (4)Foreign-born:
94.0% (66)
Other race - Speak only English Native:
100.0% (1)Foreign-born:
100.0% (18)
Two or more races - Speak only English Native:
65.3% (113)Foreign-born:
9.8% (3)
Two or more races - Speak another language Native:
37.8% (66)Foreign-born:
90.0% (32)
Hispanic or Latino - Speak only English Native:
20.5% (12)Foreign-born:
27.4% (17)
Hispanic or Latino - Speak another language Native:
81.6% (48)Foreign-born:
73.3% (46)
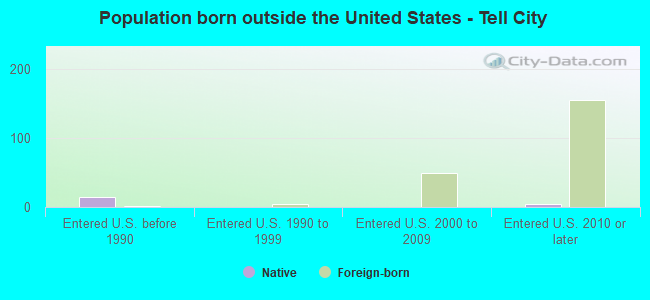
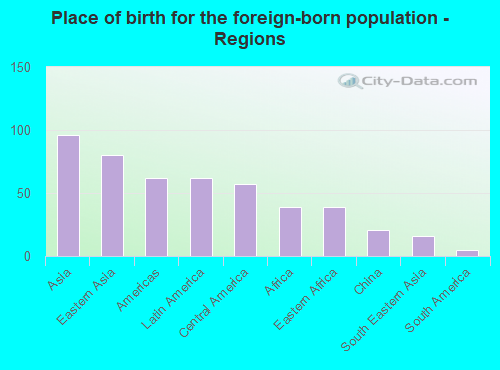
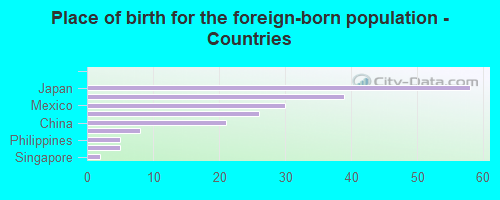
Foreign-born residents in Tell City 198 residents are foreign born (1.2% Asia , 0.8% Latin America , 0.5% Africa ).
This city:
2.6%Indiana:
5.6%
Marital status for residents in Tell City Marital status - White (Caucasian) population 15 years and over
Males 37.1% Never married44.8% Now married1.1% Separated2.4% Widowed14.6% DivorcedFemales 19.6% Never married37.6% Now married1.0% Separated17.7% Widowed24.1% DivorcedWomen who gave birth in the past 12 months Now married:
36.1% (38)Unmarried:
63.9% (67)
Women who did not give birth in the past 12 months Now married:
43.0% (512)Unmarried:
57.0% (678)
Marital status - Black or African American population 15 years and over
Males 73.3% Never married23.3% Now married0.0% Separated0.0% Widowed3.4% DivorcedFemales 61.0% Never married0.0% Now married39.0% Separated0.0% Widowed0.0% DivorcedWomen who did not give birth in the past 12 months Now married:
0.0% (0)Unmarried:
100.0% (36)
Marital status - American Indian / Alaska Native population 15 years and over
Males 100.0% Never married0.0% Now married0.0% Separated0.0% Widowed0.0% DivorcedFemales 100.0% Never married0.0% Now married0.0% Separated0.0% Widowed0.0% DivorcedWomen who did not give birth in the past 12 months Now married:
0.0% (0)Unmarried:
100.0% (28)
Marital status - Asian population 15 years and over
Males 18.9% Never married81.1% Now married0.0% Separated0.0% Widowed0.0% DivorcedFemales 29.6% Never married70.4% Now married0.0% Separated0.0% Widowed0.0% DivorcedWomen who did not give birth in the past 12 months Now married:
70.4% (20)Unmarried:
29.6% (8)
Marital status - Two or more races population 15 years and over
Males 12.5% Never married83.3% Now married0.0% Separated0.0% Widowed4.2% DivorcedFemales 48.8% Never married42.9% Now married0.0% Separated7.1% Widowed1.2% DivorcedWomen who did not give birth in the past 12 months Now married:
46.2% (49)Unmarried:
53.8% (57)
Marital status - White alone, not Hispanic / Latino population 15 years and over
Males 37.1% Never married44.8% Now married1.1% Separated2.4% Widowed14.6% DivorcedFemales 19.6% Never married37.5% Now married1.0% Separated17.7% Widowed24.1% DivorcedWomen who gave birth in the past 12 months Now married:
36.1% (38)Unmarried:
63.9% (68)
Women who did not give birth in the past 12 months Now married:
42.8% (516)Unmarried:
57.2% (690)
Marital status - Hispanic or Latino population 15 years and over
Males 41.2% Never married58.8% Now married0.0% Separated0.0% Widowed0.0% DivorcedFemales 92.1% Never married7.9% Now married0.0% Separated0.0% Widowed0.0% DivorcedWomen who did not give birth in the past 12 months Now married:
7.9% (5)Unmarried:
92.1% (62)
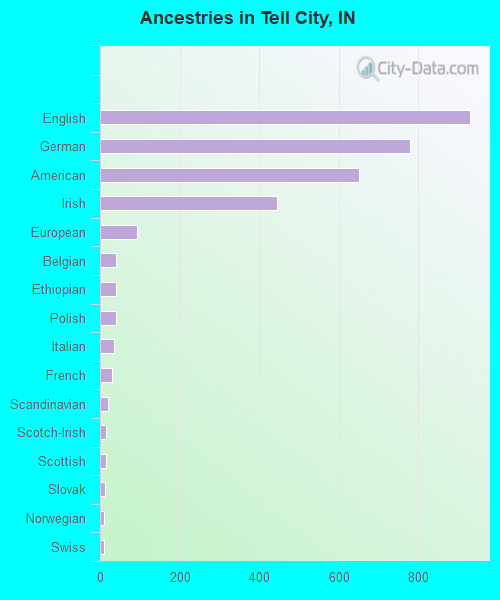
Ancestries in Tell City
931 24.8% English780 20.7% German651 17.3% American444 11.8% Irish93 2.5% European41 1.1% Belgian40 1.1% Ethiopian39 1.0% Polish36 1.0% Italian31 0.8% French20 0.5% Scandinavian15 0.4% Scotch-Irish14 0.4% Scottish12 0.3% Slovak9 0.2% Norwegian9 0.2% Swiss4 0.1% Moroccan
Children Nativity (place of birth) in Tell City
Children under 6 years - Living with two parents Both parents native 276 95.1% Native14 4.9% Foreign-bornBoth parents foreign-born 7 100.0% Foreign-bornOne native, one foreign-born parent 19 100.0% NativeChildren under 6 years - Living with one parent Native parent 142 100.0% NativeChildren 6 to 17 years - Living with two parents Both parents native 493 88.8% Native62 11.2% Foreign-bornBoth parents foreign-born 3 21.0% Native13 79.0% Foreign-bornChildren 6 to 17 years - Living with one parent Native parent 377 100.0% NativeForeign-born parent 1 52.0% Native1 48.0% Foreign-born
Grandparents responsible for own grandchildren in Tell City
Grandparents (30 to 59 years) White / Caucasian 12 35.4% Responsible for grandchildren22 64.6% Not responsible for grandchildrenWhite alone, not Hispanic / Latino 13 34.8% Responsible for grandchildren23 65.2% Not responsible for grandchildrenGrandparents (60 years and over) White / Caucasian 20 55.8% Responsible for grandchildren16 44.2% Not responsible for grandchildrenWhite alone, not Hispanic / Latino 20 55.7% Responsible for grandchildren16 44.3% Not responsible for grandchildren