Races in Savage, Maryland (MD) Detailed Stats
Data:
Races - White alone (%)
Races - White alone (% change since 2000)
Races - Black alone (%)
Races - Black alone (% change since 2000)
Races - American Indian alone (%)
Races - American Indian alone (% change since 2000)
Races - Asian alone (%)
Races - Asian alone (% change since 2000)
Races - Hispanic (%)
Races - Hispanic (% change since 2000)
Races - Native Hawaiian and Other Pacific Islander alone (%)
Races - Native Hawaiian and Other Pacific Islander alone (% change since 2000)
Races - Two or more races(%)
Races - Two or more races(% change since 2000)
Races - Other race alone (%)
Races - Other race alone (% change since 2000)
Racial diversity
Place of birth - Born in state of residence (%)
Place of birth - Born in state of residence (%) - White
Place of birth - Born in state of residence (%) - Black or African American
Place of birth - Born in state of residence (%) - Asian
Place of birth - Born in state of residence (%) - Hispanic or Latino
Place of birth - Born in state of residence (%) - American Indian and Alaska Native
Place of birth - Born in state of residence (%) - Multirace
Place of birth - Born in state of residence (%) - Other Race
Place of birth - Born in other state (%)
Place of birth - Born in other state (%) - White
Place of birth - Born in other state (%) - Black or African American
Place of birth - Born in other state (%) - Asian
Place of birth - Born in other state (%) - Hispanic or Latino
Place of birth - Born in other state (%) - American Indian and Alaska Native
Place of birth - Born in other state (%) - Multirace
Place of birth - Born in other state (%) - Other Race
Place of birth - Native, outside of US (%)
Place of birth - Native, outside of US (%) - White
Place of birth - Native, outside of US (%) - Black or African American
Place of birth - Native, outside of US (%) - Asian
Place of birth - Native, outside of US (%) - Hispanic or Latino
Place of birth - Native, outside of US (%) - American Indian and Alaska Native
Place of birth - Native, outside of US (%) - Multirace
Place of birth - Native, outside of US (%) - Other Race
Place of birth - Foreign born (%)
Place of birth - Foreign born (%) - White
Place of birth - Foreign born (%) - Black or African American
Place of birth - Foreign born (%) - Asian
Place of birth - Foreign born (%) - Hispanic or Latino
Place of birth - Foreign born (%) - American Indian and Alaska Native
Place of birth - Foreign born (%) - Multirace
Place of birth - Foreign born (%) - Other Race
Residents speaking English at home (%)
Residents speaking English at home - Born in the United States (%)
Residents speaking English at home - Native, born elsewhere (%)
Residents speaking English at home - Foreign born (%)
Residents speaking Spanish at home (%)
Residents speaking Spanish at home - Born in the United States (%)
Residents speaking Spanish at home - Native, born elsewhere (%)
Residents speaking Spanish at home - Foreign born (%)
Residents speaking other language at home (%)
Residents speaking other language at home - Born in the United States (%)
Residents speaking other language at home - Native, born elsewhere (%)
Residents speaking other language at home - Foreign born (%)
Marital status - Never married (%)
Marital status - Now married (%)
Marital status - Separated (%)
Marital status - Widowed (%)
Marital status - Divorced (%)
Ancestries Reported - Arab (%)
Ancestries Reported - Czech (%)
Ancestries Reported - Danish (%)
Ancestries Reported - Dutch (%)
Ancestries Reported - English (%)
Ancestries Reported - French (%)
Ancestries Reported - French Canadian (%)
Ancestries Reported - German (%)
Ancestries Reported - Greek (%)
Ancestries Reported - Hungarian (%)
Ancestries Reported - Irish (%)
Ancestries Reported - Italian (%)
Ancestries Reported - Lithuanian (%)
Ancestries Reported - Norwegian (%)
Ancestries Reported - Polish (%)
Ancestries Reported - Portuguese (%)
Ancestries Reported - Russian (%)
Ancestries Reported - Scotch-Irish (%)
Ancestries Reported - Scottish (%)
Ancestries Reported - Slovak (%)
Ancestries Reported - Subsaharan African (%)
Ancestries Reported - Swedish (%)
Ancestries Reported - Swiss (%)
Ancestries Reported - Ukrainian (%)
Ancestries Reported - United States (%)
Ancestries Reported - Welsh (%)
Ancestries Reported - West Indian (%)
Ancestries Reported - Other (%)
Geographical mobility - Same house 1 year ago (%)
Geographical mobility - Same house 1 year ago (%) - White
Geographical mobility - Same house 1 year ago (%) - Black or African American
Geographical mobility - Same house 1 year ago (%) - Asian
Geographical mobility - Same house 1 year ago (%) - Hispanic or Latino
Geographical mobility - Same house 1 year ago (%) - American Indian and Alaska Native
Geographical mobility - Same house 1 year ago (%) - Multirace
Geographical mobility - Same house 1 year ago (%) - Other Race
Geographical mobility - Moved within same county (%)
Geographical mobility - Moved within same county (%) - White
Geographical mobility - Moved within same county (%) - Black or African American
Geographical mobility - Moved within same county (%) - Asian
Geographical mobility - Moved within same county (%) - Hispanic or Latino
Geographical mobility - Moved within same county (%) - American Indian and Alaska Native
Geographical mobility - Moved within same county (%) - Multirace
Geographical mobility - Moved within same county (%) - Other Race
Geographical mobility - Moved from different county within same state (%)
Geographical mobility - Moved from different county within same state (%) - White
Geographical mobility - Moved from different county within same state (%) - Black or African American
Geographical mobility - Moved from different county within same state (%) - Asian
Geographical mobility - Moved from different county within same state (%) - Hispanic or Latino
Geographical mobility - Moved from different county within same state (%) - American Indian and Alaska Native
Geographical mobility - Moved from different county within same state (%) - Multirace
Geographical mobility - Moved from different county within same state (%) - Other Race
Geographical mobility - Moved from different state (%)
Geographical mobility - Moved from different state (%) - White
Geographical mobility - Moved from different state (%) - Black or African American
Geographical mobility - Moved from different state (%) - Asian
Geographical mobility - Moved from different state (%) - Hispanic or Latino
Geographical mobility - Moved from different state (%) - American Indian and Alaska Native
Geographical mobility - Moved from different state (%) - Multirace
Geographical mobility - Moved from different state (%) - Other Race
Geographical mobility - Moved from abroad (%)
Geographical mobility - Moved from abroad (%) - White
Geographical mobility - Moved from abroad (%) - Black or African American
Geographical mobility - Moved from abroad (%) - Asian
Geographical mobility - Moved from abroad (%) - Hispanic or Latino
Geographical mobility - Moved from abroad (%) - American Indian and Alaska Native
Geographical mobility - Moved from abroad (%) - Multirace
Geographical mobility - Moved from abroad (%) - Other Race
Place of birth for the foreign-born population - Ireland (%)
Place of birth for the foreign-born population - Denmark (%)
Place of birth for the foreign-born population - Norway (%)
Place of birth for the foreign-born population - Sweden (%)
Place of birth for the foreign-born population - United Kingdom (%)
Place of birth for the foreign-born population - England (%)
Place of birth for the foreign-born population - Scotland (%)
Place of birth for the foreign-born population - Other Northern Europe (%)
Place of birth for the foreign-born population - Austria (%)
Place of birth for the foreign-born population - Belgium (%)
Place of birth for the foreign-born population - France (%)
Place of birth for the foreign-born population - Germany (%)
Place of birth for the foreign-born population - Netherlands (%)
Place of birth for the foreign-born population - Switzerland (%)
Place of birth for the foreign-born population - Other Western Europe (%)
Place of birth for the foreign-born population - Greece (%)
Place of birth for the foreign-born population - Italy (%)
Place of birth for the foreign-born population - Portugal (%)
Place of birth for the foreign-born population - Spain (%)
Place of birth for the foreign-born population - Other Southern Europe (%)
Place of birth for the foreign-born population - Albania (%)
Place of birth for the foreign-born population - Belarus (%)
Place of birth for the foreign-born population - Bosnia and Herzegovina (%)
Place of birth for the foreign-born population - Bulgaria (%)
Place of birth for the foreign-born population - Croatia (%)
Place of birth for the foreign-born population - Czechoslovakia (%)
Place of birth for the foreign-born population - Hungary (%)
Place of birth for the foreign-born population - Latvia (%)
Place of birth for the foreign-born population - Lithuania (%)
Place of birth for the foreign-born population - North Macedonia (Macedonia) (%)
Place of birth for the foreign-born population - Moldova (%)
Place of birth for the foreign-born population - Poland (%)
Place of birth for the foreign-born population - Romania (%)
Place of birth for the foreign-born population - Russia (%)
Place of birth for the foreign-born population - Serbia (%)
Place of birth for the foreign-born population - Ukraine (%)
Place of birth for the foreign-born population - Other Eastern Europe (%)
Place of birth for the foreign-born population - China (%)
Place of birth for the foreign-born population - Hong Kong (%)
Place of birth for the foreign-born population - Taiwan (%)
Place of birth for the foreign-born population - Japan (%)
Place of birth for the foreign-born population - Korea (%)
Place of birth for the foreign-born population - Other Eastern Asia (%)
Place of birth for the foreign-born population - Afghanistan (%)
Place of birth for the foreign-born population - Bangladesh (%)
Place of birth for the foreign-born population - India (%)
Place of birth for the foreign-born population - Iran (%)
Place of birth for the foreign-born population - Kazakhstan (%)
Place of birth for the foreign-born population - Nepal (%)
Place of birth for the foreign-born population - Pakistan (%)
Place of birth for the foreign-born population - Sri Lanka (%)
Place of birth for the foreign-born population - Uzbekistan (%)
Place of birth for the foreign-born population - Other South Central Asia (%)
Place of birth for the foreign-born population - Burma (%)
Place of birth for the foreign-born population - Cambodia (%)
Place of birth for the foreign-born population - Indonesia (%)
Place of birth for the foreign-born population - Laos (%)
Place of birth for the foreign-born population - Malaysia (%)
Place of birth for the foreign-born population - Philippines (%)
Place of birth for the foreign-born population - Singapore (%)
Place of birth for the foreign-born population - Thailand (%)
Place of birth for the foreign-born population - Vietnam (%)
Place of birth for the foreign-born population - Other South Eastern Asia (%)
Place of birth for the foreign-born population - Armenia (%)
Place of birth for the foreign-born population - Iraq (%)
Place of birth for the foreign-born population - Israel (%)
Place of birth for the foreign-born population - Jordan (%)
Place of birth for the foreign-born population - Kuwait (%)
Place of birth for the foreign-born population - Lebanon (%)
Place of birth for the foreign-born population - Saudi Arabia (%)
Place of birth for the foreign-born population - Syria (%)
Place of birth for the foreign-born population - Turkey (%)
Place of birth for the foreign-born population - Yemen (%)
Place of birth for the foreign-born population - Other Western Asia (%)
Place of birth for the foreign-born population - Eritrea (%)
Place of birth for the foreign-born population - Ethiopia (%)
Place of birth for the foreign-born population - Kenya (%)
Place of birth for the foreign-born population - Somalia (%)
Place of birth for the foreign-born population - Uganda (%)
Place of birth for the foreign-born population - Zimbabwe (%)
Place of birth for the foreign-born population - Other Eastern Africa (%)
Place of birth for the foreign-born population - Cameroon (%)
Place of birth for the foreign-born population - Congo (%)
Place of birth for the foreign-born population - Democratic Republic of Congo (Zaire) (%)
Place of birth for the foreign-born population - Other Middle Africa (%)
Place of birth for the foreign-born population - Egypt (%)
Place of birth for the foreign-born population - Morocco (%)
Place of birth for the foreign-born population - Sudan (%)
Place of birth for the foreign-born population - Other Northern Africa (%)
Place of birth for the foreign-born population - South Africa (%)
Place of birth for the foreign-born population - Other Southern Africa (%)
Place of birth for the foreign-born population - Cabo Verde (%)
Place of birth for the foreign-born population - Ghana (%)
Place of birth for the foreign-born population - Liberia (%)
Place of birth for the foreign-born population - Nigeria (%)
Place of birth for the foreign-born population - Senegal (%)
Place of birth for the foreign-born population - Sierra Leone (%)
Place of birth for the foreign-born population - Other Western Africa (%)
Place of birth for the foreign-born population - Australia (%)
Place of birth for the foreign-born population - New Zealand (%)
Place of birth for the foreign-born population - Fiji (%)
Place of birth for the foreign-born population - Micronesia (%)
Place of birth for the foreign-born population - Bahamas (%)
Place of birth for the foreign-born population - Barbados (%)
Place of birth for the foreign-born population - Cuba (%)
Place of birth for the foreign-born population - Dominica (%)
Place of birth for the foreign-born population - Dominican Republic (%)
Place of birth for the foreign-born population - Grenada (%)
Place of birth for the foreign-born population - Haiti (%)
Place of birth for the foreign-born population - Jamaica (%)
Place of birth for the foreign-born population - St. Vincent and the Grenadines (%)
Place of birth for the foreign-born population - Trinidad and Tobago (%)
Place of birth for the foreign-born population - West Indies (%)
Place of birth for the foreign-born population - Other Caribbean (%)
Place of birth for the foreign-born population - Belize (%)
Place of birth for the foreign-born population - Costa Rica (%)
Place of birth for the foreign-born population - El Salvador (%)
Place of birth for the foreign-born population - Guatemala (%)
Place of birth for the foreign-born population - Honduras (%)
Place of birth for the foreign-born population - Mexico (%)
Place of birth for the foreign-born population - Nicaragua (%)
Place of birth for the foreign-born population - Panama (%)
Place of birth for the foreign-born population - Other Central America (%)
Place of birth for the foreign-born population - Argentina (%)
Place of birth for the foreign-born population - Bolivia (%)
Place of birth for the foreign-born population - Brazil (%)
Place of birth for the foreign-born population - Chile (%)
Place of birth for the foreign-born population - Colombia (%)
Place of birth for the foreign-born population - Ecuador (%)
Place of birth for the foreign-born population - Guyana (%)
Place of birth for the foreign-born population - Peru (%)
Place of birth for the foreign-born population - Uruguay (%)
Place of birth for the foreign-born population - Venezuela (%)
Place of birth for the foreign-born population - Other South America (%)
Place of birth for the foreign-born population - Canada (%)
Place of birth for the foreign-born population - Other Northern America (%)
Place of birth for the foreign-born population - Other (%)
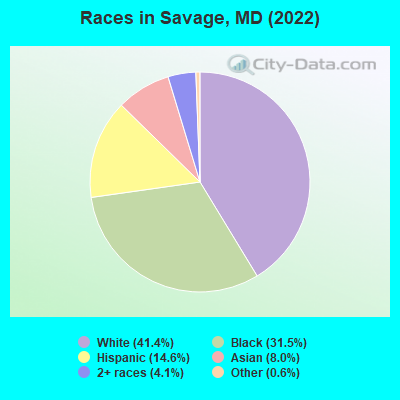
According to 2022 data, the most numerous races in Savage, MD are White alone (3,152 residents), Black alone (2,396 residents), and Hispanic (1,108 residents). 74.0% of Savage residents speak English at home.
Race distribution in Savage 3,152 41.4% White alone 2,396 31.5% Black alone 1,108 14.6% Hispanic 609 8.0% Asian alone 309 4.1% Two or more races 48 0.6% Other race alone
2000 2022
3,286,547 62.1% White alone 1,464,735 27.7% Black alone 227,916 4.3% Hispanic 209,738 4.0% Asian alone 82,946 1.6% Two or more races 13,312 0.3% American Indian alone 9,379 0.2% Other race alone 1,913 0.04% Native Hawaiian and Other
2,906,492 47.1% White alone 1,800,914 29.2% Black alone 705,842 11.4% Hispanic 401,818 6.5% Asian alone 291,317 4.7% Two or more races 46,930 0.8% Other race alone 8,930 0.1% American Indian alone 2,417 0.04% Native Hawaiian and Other
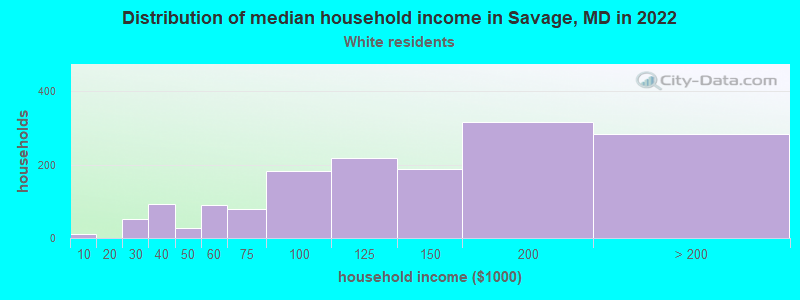
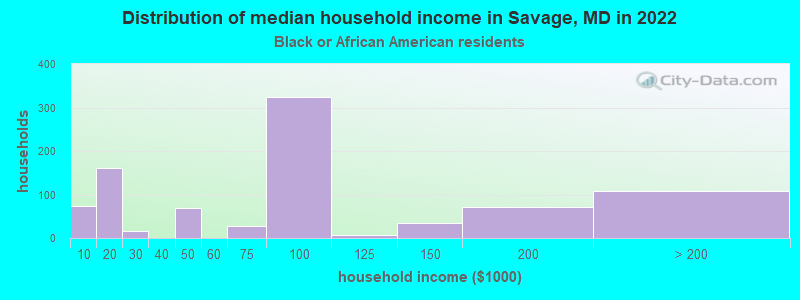
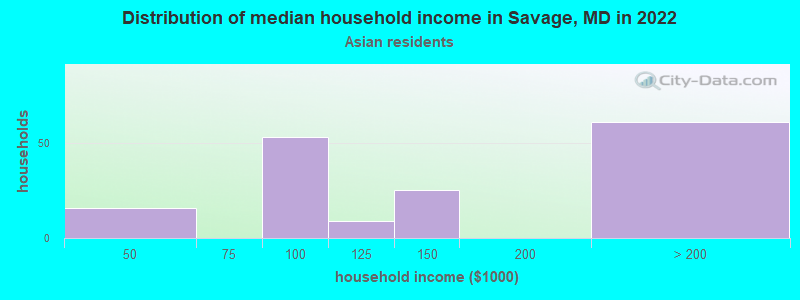
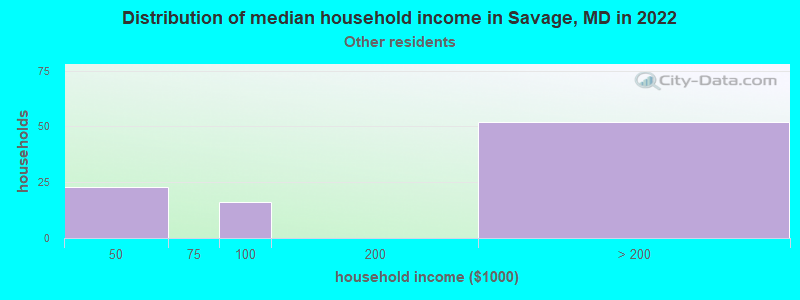
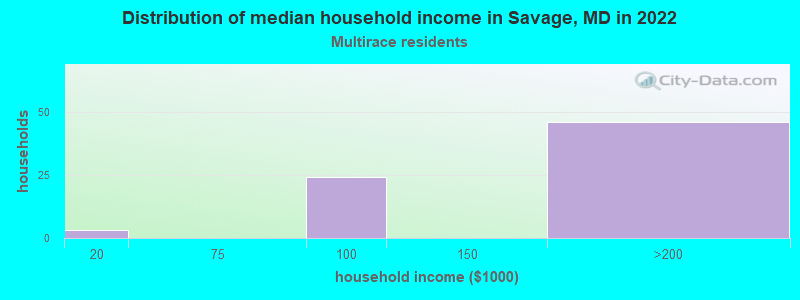
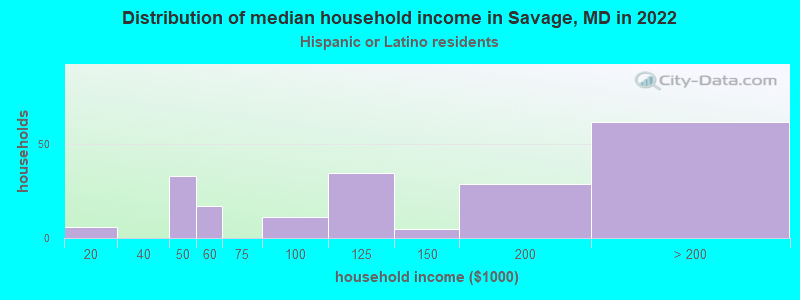
Income and house value in Savage Median household income in 2022 $127,797 White non-Hispanic householders$81,790 Black householders$143,795 Asian householdersover $200,000 Some other race householders$146,002 Two or more races householders$105,383 Hispanic or Latino race householders
Median age by race in Savage
41.6 Median age for White residents42.0 41.8 42.5 Median age for Black or African American residents42.0 55.6 -617,131,062.3 Median age for American Indian / Alaska Native residents-634,408,601.5 -953,703,702.8 34.1 Median age for Asian residents28.4 41.7 -763,333,332.6 Median age for Native Hawaiian / Pacific Islander residents-720,061,021.4 -760,942,760.2 15.6 Median age for Other race residents13.6 17.4 16.6 Median age for Two or more races residents13.0 33.2 41.8 Median age for White alone residents41.3 41.8 19.5 Median age for Hispanic or Latino residents14.1 22.5
Owner/renter occupied households by race in Savage
House owners and renters - White residents 1,202 76.0% Owner occupied380 24.0% Renter occupiedHouse owners and renters - Black or African American residents 223 25.4% Owner occupied655 74.6% Renter occupiedHouse owners and renters - Asian residents 120 70.8% Owner occupied50 29.2% Renter occupiedHouse owners and renters - Other race residents 104 100.0% Owner occupiedHouse owners and renters - Two or more races residents 63 88.5% Owner occupied8 11.5% Renter occupiedHouse owners and renters - White alone residents 1,146 74.1% Owner occupied400 25.9% Renter occupiedHouse owners and renters - Hispanic or Latino residents 168 95.8% Owner occupied7 4.2% Renter occupied
Language usage in Savage
English speakers - Total 74.0% of residents of Savage speak English at home.
11.1% of residents speak Spanish at home 499 60.8% Speak English very well322 39.2% Speak English less than very well14.8% of residents speak other language at home 870 79.7% Speak English very well222 20.3% Speak English less than very well
English speakers - Born in the United States 95.6% of residents of Savage speak English at home.
1.0% of residents speak Spanish at home 15 51.7% Speak English very well14 48.3% Speak English less than very well2.3% of residents speak other language at home 66 100.0% Speak English very well
English speakers - Native, born elsewhere 65.8% of residents of Savage speak English at home.
6.2% of residents speak Spanish at home 21 100.0% Speak English very well21.2% of residents speak other language at home 72 100.0% Speak English very well
English speakers - Foreign-born 10.5% of residents of Savage speak English at home.
35.9% of residents speak Spanish at home 108 26.0% Speak English very well308 74.0% Speak English less than very well51.7% of residents speak other language at home 407 67.9% Speak English very well192 32.1% Speak English less than very well
White (Caucasian) - Speak only English Native:
97.6% (3,062)Foreign-born:
6.2% (12)
White (Caucasian) - Speak another language Native:
2.3% (72)Foreign-born:
91.5% (183)
Black or African American - Speak only English Native:
87.2% (1,741)Foreign-born:
6.5% (21)
Black or African American - Speak another language Native:
11.8% (235)Foreign-born:
100.0% (317)
Asian - Speak only English Native:
25.7% (59)Foreign-born:
19.0% (73)
Asian - Speak another language Native:
67.2% (155)Foreign-born:
81.9% (315)
Other race - Speak only English Native:
4.2% (17)Foreign-born:
7.2% (24)
Other race - Speak another language Native:
100.0% (418)Foreign-born:
93.3% (309)
White alone - Speak only English Native:
97.5% (2,984)Foreign-born:
41.4% (13)
White alone - Speak another language Native:
2.2% (68)Foreign-born:
56.1% (17)
Hispanic or Latino - Speak only English Native:
32.7% (203)Foreign-born:
6.7% (30)
Hispanic or Latino - Speak another language Native:
71.4% (444)Foreign-born:
89.6% (397)
Foreign-born residents in Savage
Marital status for residents in Savage Marital status - White (Caucasian) population 15 years and over
Males 20.2% Never married71.9% Now married0.0% Separated2.9% Widowed5.0% DivorcedFemales 26.7% Never married56.9% Now married0.8% Separated4.7% Widowed10.9% DivorcedWomen who did not give birth in the past 12 months Now married:
57.0% (600)Unmarried:
43.0% (452)
Marital status - Black or African American population 15 years and over
Males 48.9% Never married39.6% Now married0.0% Separated0.0% Widowed11.5% DivorcedFemales 26.0% Never married30.8% Now married5.8% Separated3.0% Widowed34.4% DivorcedWomen who did not give birth in the past 12 months Now married:
37.7% (91)Unmarried:
62.3% (150)
Marital status - Asian population 15 years and over
Males 49.1% Never married50.9% Now married0.0% Separated0.0% Widowed0.0% DivorcedFemales 25.9% Never married53.1% Now married0.0% Separated21.0% Widowed0.0% DivorcedWomen who did not give birth in the past 12 months Now married:
63.5% (104)Unmarried:
36.5% (60)
Marital status - Other race population 15 years and over
Males 29.7% Never married70.3% Now married0.0% Separated0.0% Widowed0.0% DivorcedFemales 25.0% Never married62.1% Now married0.0% Separated0.0% Widowed12.9% DivorcedWomen who gave birth in the past 12 months Now married:
100.0% (22)Unmarried:
0.0% (0)
Women who did not give birth in the past 12 months Now married:
56.9% (90)Unmarried:
43.1% (68)
Marital status - Two or more races population 15 years and over
Males 60.2% Never married39.8% Now married0.0% Separated0.0% Widowed0.0% DivorcedFemales 7.4% Never married87.6% Now married0.0% Separated0.0% Widowed5.0% DivorcedWomen who gave birth in the past 12 months Now married:
100.0% (54)Unmarried:
0.0% (0)
Women who did not give birth in the past 12 months Now married:
86.8% (68)Unmarried:
13.2% (10)
Marital status - White alone, not Hispanic / Latino population 15 years and over
Males 21.3% Never married70.4% Now married0.0% Separated3.0% Widowed5.3% DivorcedFemales 24.0% Never married58.5% Now married0.0% Separated5.3% Widowed12.2% DivorcedWomen who did not give birth in the past 12 months Now married:
58.7% (552)Unmarried:
41.3% (388)
Marital status - Hispanic or Latino population 15 years and over
Males 32.5% Never married67.5% Now married0.0% Separated0.0% Widowed0.0% DivorcedFemales 32.3% Never married58.0% Now married3.9% Separated0.0% Widowed5.8% DivorcedWomen who gave birth in the past 12 months Now married:
100.0% (16)Unmarried:
0.0% (0)
Women who did not give birth in the past 12 months Now married:
57.3% (197)Unmarried:
42.7% (147)
Ancestries in Savage
302 8.9% Irish276 8.1% English244 7.2% German142 4.2% American103 3.0% Guyanese56 1.6% European24 0.7% Sierra Leonean21 0.6% Danish19 0.6% Polish18 0.5% Austrian16 0.5% Greek16 0.5% Turkish15 0.4% French13 0.4% African9 0.3% Dutch8 0.2% Eastern European
Children Nativity (place of birth) in Savage
Children under 6 years - Living with two parents Both parents native 271 100.0% NativeBoth parents foreign-born 50 100.0% NativeChildren under 6 years - Living with one parent Native parent 7 100.0% NativeForeign-born parent 9 100.0% NativeChildren 6 to 17 years - Living with two parents Both parents native 800 100.0% NativeBoth parents foreign-born 340 75.8% Native109 24.2% Foreign-bornOne native, one foreign-born parent 20 100.0% NativeChildren 6 to 17 years - Living with one parent Native parent 229 100.0% Native
Grandparents responsible for own grandchildren in Savage
Grandparents (30 to 59 years) Black or African American 56 100.0% Not responsible for grandchildren
Grandparents (60 years and over) Black or African American 44 100.0% Not responsible for grandchildren