Races in Salisbury, Maryland (MD) Detailed Stats
Data:
Races - White alone (%)
Races - White alone (% change since 2000)
Races - Black alone (%)
Races - Black alone (% change since 2000)
Races - American Indian alone (%)
Races - American Indian alone (% change since 2000)
Races - Asian alone (%)
Races - Asian alone (% change since 2000)
Races - Hispanic (%)
Races - Hispanic (% change since 2000)
Races - Native Hawaiian and Other Pacific Islander alone (%)
Races - Native Hawaiian and Other Pacific Islander alone (% change since 2000)
Races - Two or more races(%)
Races - Two or more races(% change since 2000)
Races - Other race alone (%)
Races - Other race alone (% change since 2000)
Racial diversity
Place of birth - Born in state of residence (%)
Place of birth - Born in state of residence (%) - White
Place of birth - Born in state of residence (%) - Black or African American
Place of birth - Born in state of residence (%) - Asian
Place of birth - Born in state of residence (%) - Hispanic or Latino
Place of birth - Born in state of residence (%) - American Indian and Alaska Native
Place of birth - Born in state of residence (%) - Multirace
Place of birth - Born in state of residence (%) - Other Race
Place of birth - Born in other state (%)
Place of birth - Born in other state (%) - White
Place of birth - Born in other state (%) - Black or African American
Place of birth - Born in other state (%) - Asian
Place of birth - Born in other state (%) - Hispanic or Latino
Place of birth - Born in other state (%) - American Indian and Alaska Native
Place of birth - Born in other state (%) - Multirace
Place of birth - Born in other state (%) - Other Race
Place of birth - Native, outside of US (%)
Place of birth - Native, outside of US (%) - White
Place of birth - Native, outside of US (%) - Black or African American
Place of birth - Native, outside of US (%) - Asian
Place of birth - Native, outside of US (%) - Hispanic or Latino
Place of birth - Native, outside of US (%) - American Indian and Alaska Native
Place of birth - Native, outside of US (%) - Multirace
Place of birth - Native, outside of US (%) - Other Race
Place of birth - Foreign born (%)
Place of birth - Foreign born (%) - White
Place of birth - Foreign born (%) - Black or African American
Place of birth - Foreign born (%) - Asian
Place of birth - Foreign born (%) - Hispanic or Latino
Place of birth - Foreign born (%) - American Indian and Alaska Native
Place of birth - Foreign born (%) - Multirace
Place of birth - Foreign born (%) - Other Race
Residents speaking English at home (%)
Residents speaking English at home - Born in the United States (%)
Residents speaking English at home - Native, born elsewhere (%)
Residents speaking English at home - Foreign born (%)
Residents speaking Spanish at home (%)
Residents speaking Spanish at home - Born in the United States (%)
Residents speaking Spanish at home - Native, born elsewhere (%)
Residents speaking Spanish at home - Foreign born (%)
Residents speaking other language at home (%)
Residents speaking other language at home - Born in the United States (%)
Residents speaking other language at home - Native, born elsewhere (%)
Residents speaking other language at home - Foreign born (%)
Marital status - Never married (%)
Marital status - Now married (%)
Marital status - Separated (%)
Marital status - Widowed (%)
Marital status - Divorced (%)
Ancestries Reported - Arab (%)
Ancestries Reported - Czech (%)
Ancestries Reported - Danish (%)
Ancestries Reported - Dutch (%)
Ancestries Reported - English (%)
Ancestries Reported - French (%)
Ancestries Reported - French Canadian (%)
Ancestries Reported - German (%)
Ancestries Reported - Greek (%)
Ancestries Reported - Hungarian (%)
Ancestries Reported - Irish (%)
Ancestries Reported - Italian (%)
Ancestries Reported - Lithuanian (%)
Ancestries Reported - Norwegian (%)
Ancestries Reported - Polish (%)
Ancestries Reported - Portuguese (%)
Ancestries Reported - Russian (%)
Ancestries Reported - Scotch-Irish (%)
Ancestries Reported - Scottish (%)
Ancestries Reported - Slovak (%)
Ancestries Reported - Subsaharan African (%)
Ancestries Reported - Swedish (%)
Ancestries Reported - Swiss (%)
Ancestries Reported - Ukrainian (%)
Ancestries Reported - United States (%)
Ancestries Reported - Welsh (%)
Ancestries Reported - West Indian (%)
Ancestries Reported - Other (%)
Geographical mobility - Same house 1 year ago (%)
Geographical mobility - Same house 1 year ago (%) - White
Geographical mobility - Same house 1 year ago (%) - Black or African American
Geographical mobility - Same house 1 year ago (%) - Asian
Geographical mobility - Same house 1 year ago (%) - Hispanic or Latino
Geographical mobility - Same house 1 year ago (%) - American Indian and Alaska Native
Geographical mobility - Same house 1 year ago (%) - Multirace
Geographical mobility - Same house 1 year ago (%) - Other Race
Geographical mobility - Moved within same county (%)
Geographical mobility - Moved within same county (%) - White
Geographical mobility - Moved within same county (%) - Black or African American
Geographical mobility - Moved within same county (%) - Asian
Geographical mobility - Moved within same county (%) - Hispanic or Latino
Geographical mobility - Moved within same county (%) - American Indian and Alaska Native
Geographical mobility - Moved within same county (%) - Multirace
Geographical mobility - Moved within same county (%) - Other Race
Geographical mobility - Moved from different county within same state (%)
Geographical mobility - Moved from different county within same state (%) - White
Geographical mobility - Moved from different county within same state (%) - Black or African American
Geographical mobility - Moved from different county within same state (%) - Asian
Geographical mobility - Moved from different county within same state (%) - Hispanic or Latino
Geographical mobility - Moved from different county within same state (%) - American Indian and Alaska Native
Geographical mobility - Moved from different county within same state (%) - Multirace
Geographical mobility - Moved from different county within same state (%) - Other Race
Geographical mobility - Moved from different state (%)
Geographical mobility - Moved from different state (%) - White
Geographical mobility - Moved from different state (%) - Black or African American
Geographical mobility - Moved from different state (%) - Asian
Geographical mobility - Moved from different state (%) - Hispanic or Latino
Geographical mobility - Moved from different state (%) - American Indian and Alaska Native
Geographical mobility - Moved from different state (%) - Multirace
Geographical mobility - Moved from different state (%) - Other Race
Geographical mobility - Moved from abroad (%)
Geographical mobility - Moved from abroad (%) - White
Geographical mobility - Moved from abroad (%) - Black or African American
Geographical mobility - Moved from abroad (%) - Asian
Geographical mobility - Moved from abroad (%) - Hispanic or Latino
Geographical mobility - Moved from abroad (%) - American Indian and Alaska Native
Geographical mobility - Moved from abroad (%) - Multirace
Geographical mobility - Moved from abroad (%) - Other Race
Place of birth for the foreign-born population - Ireland (%)
Place of birth for the foreign-born population - Denmark (%)
Place of birth for the foreign-born population - Norway (%)
Place of birth for the foreign-born population - Sweden (%)
Place of birth for the foreign-born population - United Kingdom (%)
Place of birth for the foreign-born population - England (%)
Place of birth for the foreign-born population - Scotland (%)
Place of birth for the foreign-born population - Other Northern Europe (%)
Place of birth for the foreign-born population - Austria (%)
Place of birth for the foreign-born population - Belgium (%)
Place of birth for the foreign-born population - France (%)
Place of birth for the foreign-born population - Germany (%)
Place of birth for the foreign-born population - Netherlands (%)
Place of birth for the foreign-born population - Switzerland (%)
Place of birth for the foreign-born population - Other Western Europe (%)
Place of birth for the foreign-born population - Greece (%)
Place of birth for the foreign-born population - Italy (%)
Place of birth for the foreign-born population - Portugal (%)
Place of birth for the foreign-born population - Spain (%)
Place of birth for the foreign-born population - Other Southern Europe (%)
Place of birth for the foreign-born population - Albania (%)
Place of birth for the foreign-born population - Belarus (%)
Place of birth for the foreign-born population - Bosnia and Herzegovina (%)
Place of birth for the foreign-born population - Bulgaria (%)
Place of birth for the foreign-born population - Croatia (%)
Place of birth for the foreign-born population - Czechoslovakia (%)
Place of birth for the foreign-born population - Hungary (%)
Place of birth for the foreign-born population - Latvia (%)
Place of birth for the foreign-born population - Lithuania (%)
Place of birth for the foreign-born population - North Macedonia (Macedonia) (%)
Place of birth for the foreign-born population - Moldova (%)
Place of birth for the foreign-born population - Poland (%)
Place of birth for the foreign-born population - Romania (%)
Place of birth for the foreign-born population - Russia (%)
Place of birth for the foreign-born population - Serbia (%)
Place of birth for the foreign-born population - Ukraine (%)
Place of birth for the foreign-born population - Other Eastern Europe (%)
Place of birth for the foreign-born population - China (%)
Place of birth for the foreign-born population - Hong Kong (%)
Place of birth for the foreign-born population - Taiwan (%)
Place of birth for the foreign-born population - Japan (%)
Place of birth for the foreign-born population - Korea (%)
Place of birth for the foreign-born population - Other Eastern Asia (%)
Place of birth for the foreign-born population - Afghanistan (%)
Place of birth for the foreign-born population - Bangladesh (%)
Place of birth for the foreign-born population - India (%)
Place of birth for the foreign-born population - Iran (%)
Place of birth for the foreign-born population - Kazakhstan (%)
Place of birth for the foreign-born population - Nepal (%)
Place of birth for the foreign-born population - Pakistan (%)
Place of birth for the foreign-born population - Sri Lanka (%)
Place of birth for the foreign-born population - Uzbekistan (%)
Place of birth for the foreign-born population - Other South Central Asia (%)
Place of birth for the foreign-born population - Burma (%)
Place of birth for the foreign-born population - Cambodia (%)
Place of birth for the foreign-born population - Indonesia (%)
Place of birth for the foreign-born population - Laos (%)
Place of birth for the foreign-born population - Malaysia (%)
Place of birth for the foreign-born population - Philippines (%)
Place of birth for the foreign-born population - Singapore (%)
Place of birth for the foreign-born population - Thailand (%)
Place of birth for the foreign-born population - Vietnam (%)
Place of birth for the foreign-born population - Other South Eastern Asia (%)
Place of birth for the foreign-born population - Armenia (%)
Place of birth for the foreign-born population - Iraq (%)
Place of birth for the foreign-born population - Israel (%)
Place of birth for the foreign-born population - Jordan (%)
Place of birth for the foreign-born population - Kuwait (%)
Place of birth for the foreign-born population - Lebanon (%)
Place of birth for the foreign-born population - Saudi Arabia (%)
Place of birth for the foreign-born population - Syria (%)
Place of birth for the foreign-born population - Turkey (%)
Place of birth for the foreign-born population - Yemen (%)
Place of birth for the foreign-born population - Other Western Asia (%)
Place of birth for the foreign-born population - Eritrea (%)
Place of birth for the foreign-born population - Ethiopia (%)
Place of birth for the foreign-born population - Kenya (%)
Place of birth for the foreign-born population - Somalia (%)
Place of birth for the foreign-born population - Uganda (%)
Place of birth for the foreign-born population - Zimbabwe (%)
Place of birth for the foreign-born population - Other Eastern Africa (%)
Place of birth for the foreign-born population - Cameroon (%)
Place of birth for the foreign-born population - Congo (%)
Place of birth for the foreign-born population - Democratic Republic of Congo (Zaire) (%)
Place of birth for the foreign-born population - Other Middle Africa (%)
Place of birth for the foreign-born population - Egypt (%)
Place of birth for the foreign-born population - Morocco (%)
Place of birth for the foreign-born population - Sudan (%)
Place of birth for the foreign-born population - Other Northern Africa (%)
Place of birth for the foreign-born population - South Africa (%)
Place of birth for the foreign-born population - Other Southern Africa (%)
Place of birth for the foreign-born population - Cabo Verde (%)
Place of birth for the foreign-born population - Ghana (%)
Place of birth for the foreign-born population - Liberia (%)
Place of birth for the foreign-born population - Nigeria (%)
Place of birth for the foreign-born population - Senegal (%)
Place of birth for the foreign-born population - Sierra Leone (%)
Place of birth for the foreign-born population - Other Western Africa (%)
Place of birth for the foreign-born population - Australia (%)
Place of birth for the foreign-born population - New Zealand (%)
Place of birth for the foreign-born population - Fiji (%)
Place of birth for the foreign-born population - Micronesia (%)
Place of birth for the foreign-born population - Bahamas (%)
Place of birth for the foreign-born population - Barbados (%)
Place of birth for the foreign-born population - Cuba (%)
Place of birth for the foreign-born population - Dominica (%)
Place of birth for the foreign-born population - Dominican Republic (%)
Place of birth for the foreign-born population - Grenada (%)
Place of birth for the foreign-born population - Haiti (%)
Place of birth for the foreign-born population - Jamaica (%)
Place of birth for the foreign-born population - St. Vincent and the Grenadines (%)
Place of birth for the foreign-born population - Trinidad and Tobago (%)
Place of birth for the foreign-born population - West Indies (%)
Place of birth for the foreign-born population - Other Caribbean (%)
Place of birth for the foreign-born population - Belize (%)
Place of birth for the foreign-born population - Costa Rica (%)
Place of birth for the foreign-born population - El Salvador (%)
Place of birth for the foreign-born population - Guatemala (%)
Place of birth for the foreign-born population - Honduras (%)
Place of birth for the foreign-born population - Mexico (%)
Place of birth for the foreign-born population - Nicaragua (%)
Place of birth for the foreign-born population - Panama (%)
Place of birth for the foreign-born population - Other Central America (%)
Place of birth for the foreign-born population - Argentina (%)
Place of birth for the foreign-born population - Bolivia (%)
Place of birth for the foreign-born population - Brazil (%)
Place of birth for the foreign-born population - Chile (%)
Place of birth for the foreign-born population - Colombia (%)
Place of birth for the foreign-born population - Ecuador (%)
Place of birth for the foreign-born population - Guyana (%)
Place of birth for the foreign-born population - Peru (%)
Place of birth for the foreign-born population - Uruguay (%)
Place of birth for the foreign-born population - Venezuela (%)
Place of birth for the foreign-born population - Other South America (%)
Place of birth for the foreign-born population - Canada (%)
Place of birth for the foreign-born population - Other Northern America (%)
Place of birth for the foreign-born population - Other (%)
Latest news about races in Salisbury, MD collected exclusively by city-data.com from local newspapers, TV, and radio stations
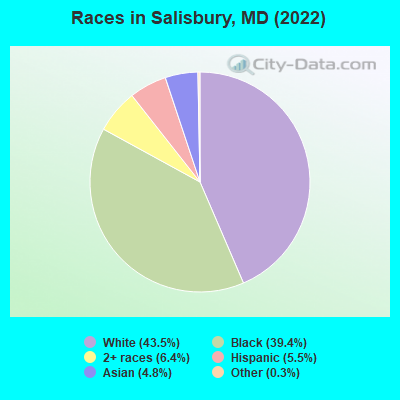
According to 2022 data, the most numerous races in Salisbury, MD are White alone (14,333 residents), Black alone (12,977 residents), and Hispanic (1,798 residents). 80.9% of Salisbury residents speak English at home. 14.6% of Salisbury, MD residents are foreign-born (7.9% born in Latin America, 4.9% born in Asia), which is 9.3% less than the foreign-born rate of 16.0% across the entire state of Maryland.
Race distribution in Salisbury
2000 2022
3,286,547 62.1% White alone 1,464,735 27.7% Black alone 227,916 4.3% Hispanic 209,738 4.0% Asian alone 82,946 1.6% Two or more races 13,312 0.3% American Indian alone 9,379 0.2% Other race alone 1,913 0.04% Native Hawaiian and Other
2,906,492 47.1% White alone 1,800,914 29.2% Black alone 705,842 11.4% Hispanic 401,818 6.5% Asian alone 291,317 4.7% Two or more races 46,930 0.8% Other race alone 8,930 0.1% American Indian alone 2,417 0.04% Native Hawaiian and Other
Income and house value in Salisbury Median household income in 2022 $51,562 White non-Hispanic householders$56,706 Black householders$66,160 Asian householders$86,723 Two or more races householders$62,941 Hispanic or Latino race householdersMedian 2022 house value $221,652 White Non-Hispanic householders$194,680 Black or African American householders$333,814 American Indian or Alaska Native householders $205,896 Asian householders$226,993 Some other race householders$433,958 Two or more races householders$235,005 Hispanic or Latino householders
Median age by race in Salisbury
31.0 Median age for White residents31.1 31.9 33.4 Median age for Black or African American residents33.2 34.8 17.1 Median age for American Indian / Alaska Native residents24.7 26.8 39.7 Median age for Asian residents31.7 40.0 -666,666,666.0 Median age for Native Hawaiian / Pacific Islander residents-666,666,666.0 -666,666,666.0 39.0 Median age for Other race residents36.8 47.5 20.5 Median age for Two or more races residents19.5 22.5 31.3 Median age for White alone residents31.0 31.6 24.4 Median age for Hispanic or Latino residents13.4 32.4
Owner/renter occupied households by race in Salisbury
House owners and renters - White residents 2,366 32.7% Owner occupied4,867 67.3% Renter occupiedHouse owners and renters - Black or African American residents 846 17.9% Owner occupied3,887 82.1% Renter occupiedHouse owners and renters - American Indian / Alaska Native residents 23 100.0% Owner occupiedHouse owners and renters - Asian residents 186 32.2% Owner occupied391 67.8% Renter occupiedHouse owners and renters - Other race residents 63 33.7% Owner occupied124 66.3% Renter occupiedHouse owners and renters - Two or more races residents 211 27.4% Owner occupied558 72.6% Renter occupiedHouse owners and renters - White alone residents 2,355 32.3% Owner occupied4,934 67.7% Renter occupiedHouse owners and renters - Hispanic or Latino residents 136 43.7% Owner occupied175 56.3% Renter occupied
Language usage in Salisbury
English speakers - Total 80.9% of residents of Salisbury speak English at home.
5.1% of residents speak Spanish at home 1,087 68.9% Speak English very well490 31.1% Speak English less than very well13.4% of residents speak other language at home 1,727 42.0% Speak English very well2,388 58.0% Speak English less than very well
English speakers - Born in the United States 91.7% of residents of Salisbury speak English at home.
4.5% of residents speak Spanish at home 438 100.0% Speak English very well5.9% of residents speak other language at home 556 96.2% Speak English very well22 3.8% Speak English less than very well
English speakers - Native, born elsewhere 62.0% of residents of Salisbury speak English at home.
8.2% of residents speak Spanish at home 22 50.0% Speak English very well22 50.0% Speak English less than very well48.6% of residents speak other language at home 227 86.6% Speak English very well35 13.4% Speak English less than very well
English speakers - Foreign-born 7.9% of residents of Salisbury speak English at home.
21.4% of residents speak Spanish at home 529 59.2% Speak English very well364 40.8% Speak English less than very well65.7% of residents speak other language at home 603 22.0% Speak English very well2,135 78.0% Speak English less than very well
White (Caucasian) - Speak only English Native:
96.6% (13,211)Foreign-born:
18.8% (98)
White (Caucasian) - Speak another language Native:
3.5% (485)Foreign-born:
100.0% (523)
Black or African American - Speak only English Native:
93.9% (9,297)Foreign-born:
2.8% (54)
Black or African American - Speak another language Native:
6.3% (622)Foreign-born:
98.9% (1,923)
American Indian / Alaska Native - Speak another language Native:
100.0% (135)Foreign-born:
100.0% (30)
Asian - Speak only English Native:
38.6% (104)Foreign-born:
17.2% (205)
Asian - Speak another language Native:
62.1% (168)Foreign-born:
83.1% (991)
Other race - Speak only English Native:
68.7% (70)Foreign-born:
10.6% (19)
Other race - Speak another language Native:
39.1% (40)Foreign-born:
98.2% (177)
Two or more races - Speak only English Native:
78.5% (1,636)Foreign-born:
3.0% (26)
Two or more races - Speak another language Native:
23.1% (481)Foreign-born:
94.8% (825)
White alone - Speak only English Native:
97.0% (13,093)Foreign-born:
18.1% (102)
White alone - Speak another language Native:
3.3% (449)Foreign-born:
100.0% (563)
Hispanic or Latino - Speak only English Native:
26.8% (243)Foreign-born:
2.8% (17)
Hispanic or Latino - Speak another language Native:
59.1% (537)Foreign-born:
100.0% (623)
Foreign-born residents in Salisbury 4,865 residents are foreign born (7.9% Latin America , 4.9% Asia ).
This city:
14.6%Maryland:
15.7%
Marital status for residents in Salisbury Marital status - White (Caucasian) population 15 years and over
Males 51.8% Never married36.3% Now married0.6% Separated2.9% Widowed8.4% DivorcedFemales 48.6% Never married26.3% Now married1.2% Separated9.6% Widowed14.3% DivorcedWomen who gave birth in the past 12 months Now married:
43.5% (20)Unmarried:
56.5% (26)
Women who did not give birth in the past 12 months Now married:
20.0% (921)Unmarried:
80.0% (3,693)
Marital status - Black or African American population 15 years and over
Males 50.1% Never married29.4% Now married4.4% Separated5.8% Widowed10.3% DivorcedFemales 44.9% Never married23.1% Now married2.2% Separated7.9% Widowed21.8% DivorcedWomen who gave birth in the past 12 months Now married:
29.1% (39)Unmarried:
70.9% (95)
Women who did not give birth in the past 12 months Now married:
22.5% (888)Unmarried:
77.5% (3,063)
Marital status - American Indian / Alaska Native population 15 years and over
Males 91.7% Never married0.0% Now married0.0% Separated0.0% Widowed8.3% DivorcedFemales 81.2% Never married18.8% Now married0.0% Separated0.0% Widowed0.0% DivorcedWomen who did not give birth in the past 12 months Now married:
0.0% (0)Unmarried:
100.0% (39)
Marital status - Asian population 15 years and over
Males 29.1% Never married70.9% Now married0.0% Separated0.0% Widowed0.0% DivorcedFemales 33.0% Never married49.5% Now married0.0% Separated3.7% Widowed13.8% DivorcedWomen who did not give birth in the past 12 months Now married:
54.5% (245)Unmarried:
45.5% (205)
Marital status - Other race population 15 years and over
Males 61.4% Never married18.1% Now married0.0% Separated0.0% Widowed20.5% DivorcedFemales 55.6% Never married19.4% Now married19.9% Separated5.1% Widowed0.0% DivorcedWomen who did not give birth in the past 12 months Now married:
30.2% (48)Unmarried:
69.8% (110)
Marital status - Two or more races population 15 years and over
Males 61.4% Never married31.4% Now married1.9% Separated0.8% Widowed4.5% DivorcedFemales 54.9% Never married37.0% Now married0.0% Separated2.3% Widowed5.9% DivorcedWomen who did not give birth in the past 12 months Now married:
21.0% (118)Unmarried:
79.0% (445)
Marital status - White alone, not Hispanic / Latino population 15 years and over
Males 50.0% Never married37.5% Now married0.6% Separated3.1% Widowed8.8% DivorcedFemales 48.6% Never married26.2% Now married1.2% Separated9.8% Widowed14.2% DivorcedWomen who gave birth in the past 12 months Now married:
43.5% (20)Unmarried:
56.5% (26)
Women who did not give birth in the past 12 months Now married:
19.8% (906)Unmarried:
80.2% (3,671)
Marital status - Hispanic or Latino population 15 years and over
Males 78.2% Never married16.4% Now married2.6% Separated0.0% Widowed2.8% DivorcedFemales 54.5% Never married33.1% Now married0.0% Separated2.0% Widowed10.4% DivorcedWomen who did not give birth in the past 12 months Now married:
24.7% (98)Unmarried:
75.3% (297)
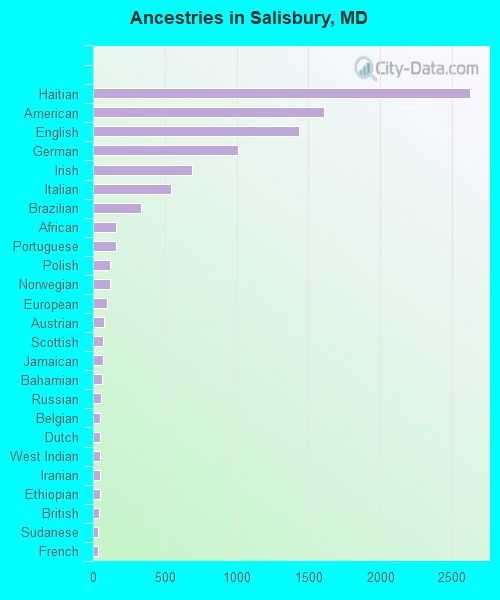
Ancestries in Salisbury
2,627 13.1% Haitian1,607 8.0% American1,437 7.2% English1,012 5.1% German693 3.5% Irish545 2.7% Italian336 1.7% Brazilian161 0.8% African159 0.8% Portuguese117 0.6% Polish116 0.6% Norwegian101 0.5% European78 0.4% Austrian71 0.4% Scottish67 0.3% Jamaican64 0.3% Bahamian57 0.3% Russian52 0.3% Belgian52 0.3% Dutch50 0.3% West Indian50 0.3% Iranian47 0.2% Ethiopian45 0.2% British35 0.2% Sudanese34 0.2% French29 0.1% Scotch-Irish26 0.1% Welsh24 0.1% Northern European24 0.1% Romanian20 0.1% Swedish19 0.10% Finnish17 0.09% Egyptian16 0.08% French Canadian16 0.08% Scandinavian16 0.08% Ghanaian14 0.07% Swiss13 0.07% Czech13 0.07% Celtic9 0.05% Canadian8 0.04% Eastern European5 0.03% Slovak4 0.02% Bermudan4 0.02% Pennsylvania German
Geographical mobility in Salisbury Same house 1 year ago 10,829 73.5% White (Caucasian)10,230 78.0% Black or African American151 83.1% American Indian / Alaska Native943 59.6% Asian372 93.3% Other race1,886 59.1% Two or more races10,770 73.7% White alone, not Hispanic / Latino1,342 77.0% Hispanic or LatinoMoved within same county 1,323 9.0% White / Caucasian1,038 7.9% Black or African American20 11.1% American Indian / Alaska Native461 29.1% Asian13 3.3% Other race184 5.8% Two or more races1,327 9.1% White alone, not Hispanic / Latino126 7.2% Hispanic or LatinoMoved within same state 1,746 11.8% White / Caucasian760 5.8% Black or African American12 6.6% American Indian / Alaska Native34 2.2% Asian181 5.7% Two or more races1,718 11.8% White alone, not Hispanic / Latino53 3.1% Hispanic or LatinoMoved from different state 1,114 7.6% White / Caucasian688 5.2% Black or African American110 6.9% Asian15 3.8% Other race452 14.2% Two or more races1,049 7.2% White alone, not Hispanic / Latino160 9.2% Hispanic or LatinoMoved from abroad 287 2.2% Black or African American305 9.6% Two or more races
Children Nativity (place of birth) in Salisbury
Children under 6 years - Living with two parents Both parents native 715 100.0% NativeBoth parents foreign-born 189 68.7% Native86 31.3% Foreign-bornOne native, one foreign-born parent 177 100.0% NativeChildren under 6 years - Living with one parent Native parent 932 100.0% NativeForeign-born parent 409 87.4% Native59 12.6% Foreign-bornChildren 6 to 17 years - Living with two parents Both parents native 1,760 100.0% NativeBoth parents foreign-born 179 34.9% Native333 65.1% Foreign-bornOne native, one foreign-born parent 63 100.0% NativeChildren 6 to 17 years - Living with one parent Native parent 1,766 100.0% NativeForeign-born parent 142 54.9% Native117 45.1% Foreign-born
Grandparents responsible for own grandchildren in Salisbury
Grandparents (30 to 59 years) White / Caucasian 7 16.8% Responsible for grandchildren34 83.2% Not responsible for grandchildrenBlack or African American 64 28.9% Responsible for grandchildren158 71.1% Not responsible for grandchildrenTwo or more races 13 100.0% Responsible for grandchildrenWhite alone, not Hispanic / Latino 7 15.9% Responsible for grandchildren37 84.1% Not responsible for grandchildrenGrandparents (60 years and over) White / Caucasian 85 47.2% Responsible for grandchildren95 52.8% Not responsible for grandchildrenBlack or African American 84 33.3% Responsible for grandchildren168 66.7% Not responsible for grandchildrenTwo or more races 23 100.0% Not responsible for grandchildrenWhite alone, not Hispanic / Latino 85 45.5% Responsible for grandchildren101 54.5% Not responsible for grandchildren