Races in Royal Kunia, Hawaii (HI) Detailed Stats
Data:
Races - White alone (%)
Races - White alone (% change since 2000)
Races - Black alone (%)
Races - Black alone (% change since 2000)
Races - American Indian alone (%)
Races - American Indian alone (% change since 2000)
Races - Asian alone (%)
Races - Asian alone (% change since 2000)
Races - Hispanic (%)
Races - Hispanic (% change since 2000)
Races - Native Hawaiian and Other Pacific Islander alone (%)
Races - Native Hawaiian and Other Pacific Islander alone (% change since 2000)
Races - Two or more races(%)
Races - Two or more races(% change since 2000)
Races - Other race alone (%)
Races - Other race alone (% change since 2000)
Racial diversity
Place of birth - Born in state of residence (%)
Place of birth - Born in state of residence (%) - White
Place of birth - Born in state of residence (%) - Black or African American
Place of birth - Born in state of residence (%) - Asian
Place of birth - Born in state of residence (%) - Hispanic or Latino
Place of birth - Born in state of residence (%) - American Indian and Alaska Native
Place of birth - Born in state of residence (%) - Multirace
Place of birth - Born in state of residence (%) - Other Race
Place of birth - Born in other state (%)
Place of birth - Born in other state (%) - White
Place of birth - Born in other state (%) - Black or African American
Place of birth - Born in other state (%) - Asian
Place of birth - Born in other state (%) - Hispanic or Latino
Place of birth - Born in other state (%) - American Indian and Alaska Native
Place of birth - Born in other state (%) - Multirace
Place of birth - Born in other state (%) - Other Race
Place of birth - Native, outside of US (%)
Place of birth - Native, outside of US (%) - White
Place of birth - Native, outside of US (%) - Black or African American
Place of birth - Native, outside of US (%) - Asian
Place of birth - Native, outside of US (%) - Hispanic or Latino
Place of birth - Native, outside of US (%) - American Indian and Alaska Native
Place of birth - Native, outside of US (%) - Multirace
Place of birth - Native, outside of US (%) - Other Race
Place of birth - Foreign born (%)
Place of birth - Foreign born (%) - White
Place of birth - Foreign born (%) - Black or African American
Place of birth - Foreign born (%) - Asian
Place of birth - Foreign born (%) - Hispanic or Latino
Place of birth - Foreign born (%) - American Indian and Alaska Native
Place of birth - Foreign born (%) - Multirace
Place of birth - Foreign born (%) - Other Race
Residents speaking English at home (%)
Residents speaking English at home - Born in the United States (%)
Residents speaking English at home - Native, born elsewhere (%)
Residents speaking English at home - Foreign born (%)
Residents speaking Spanish at home (%)
Residents speaking Spanish at home - Born in the United States (%)
Residents speaking Spanish at home - Native, born elsewhere (%)
Residents speaking Spanish at home - Foreign born (%)
Residents speaking other language at home (%)
Residents speaking other language at home - Born in the United States (%)
Residents speaking other language at home - Native, born elsewhere (%)
Residents speaking other language at home - Foreign born (%)
Marital status - Never married (%)
Marital status - Now married (%)
Marital status - Separated (%)
Marital status - Widowed (%)
Marital status - Divorced (%)
Ancestries Reported - Arab (%)
Ancestries Reported - Czech (%)
Ancestries Reported - Danish (%)
Ancestries Reported - Dutch (%)
Ancestries Reported - English (%)
Ancestries Reported - French (%)
Ancestries Reported - French Canadian (%)
Ancestries Reported - German (%)
Ancestries Reported - Greek (%)
Ancestries Reported - Hungarian (%)
Ancestries Reported - Irish (%)
Ancestries Reported - Italian (%)
Ancestries Reported - Lithuanian (%)
Ancestries Reported - Norwegian (%)
Ancestries Reported - Polish (%)
Ancestries Reported - Portuguese (%)
Ancestries Reported - Russian (%)
Ancestries Reported - Scotch-Irish (%)
Ancestries Reported - Scottish (%)
Ancestries Reported - Slovak (%)
Ancestries Reported - Subsaharan African (%)
Ancestries Reported - Swedish (%)
Ancestries Reported - Swiss (%)
Ancestries Reported - Ukrainian (%)
Ancestries Reported - United States (%)
Ancestries Reported - Welsh (%)
Ancestries Reported - West Indian (%)
Ancestries Reported - Other (%)
Geographical mobility - Same house 1 year ago (%)
Geographical mobility - Same house 1 year ago (%) - White
Geographical mobility - Same house 1 year ago (%) - Black or African American
Geographical mobility - Same house 1 year ago (%) - Asian
Geographical mobility - Same house 1 year ago (%) - Hispanic or Latino
Geographical mobility - Same house 1 year ago (%) - American Indian and Alaska Native
Geographical mobility - Same house 1 year ago (%) - Multirace
Geographical mobility - Same house 1 year ago (%) - Other Race
Geographical mobility - Moved within same county (%)
Geographical mobility - Moved within same county (%) - White
Geographical mobility - Moved within same county (%) - Black or African American
Geographical mobility - Moved within same county (%) - Asian
Geographical mobility - Moved within same county (%) - Hispanic or Latino
Geographical mobility - Moved within same county (%) - American Indian and Alaska Native
Geographical mobility - Moved within same county (%) - Multirace
Geographical mobility - Moved within same county (%) - Other Race
Geographical mobility - Moved from different county within same state (%)
Geographical mobility - Moved from different county within same state (%) - White
Geographical mobility - Moved from different county within same state (%) - Black or African American
Geographical mobility - Moved from different county within same state (%) - Asian
Geographical mobility - Moved from different county within same state (%) - Hispanic or Latino
Geographical mobility - Moved from different county within same state (%) - American Indian and Alaska Native
Geographical mobility - Moved from different county within same state (%) - Multirace
Geographical mobility - Moved from different county within same state (%) - Other Race
Geographical mobility - Moved from different state (%)
Geographical mobility - Moved from different state (%) - White
Geographical mobility - Moved from different state (%) - Black or African American
Geographical mobility - Moved from different state (%) - Asian
Geographical mobility - Moved from different state (%) - Hispanic or Latino
Geographical mobility - Moved from different state (%) - American Indian and Alaska Native
Geographical mobility - Moved from different state (%) - Multirace
Geographical mobility - Moved from different state (%) - Other Race
Geographical mobility - Moved from abroad (%)
Geographical mobility - Moved from abroad (%) - White
Geographical mobility - Moved from abroad (%) - Black or African American
Geographical mobility - Moved from abroad (%) - Asian
Geographical mobility - Moved from abroad (%) - Hispanic or Latino
Geographical mobility - Moved from abroad (%) - American Indian and Alaska Native
Geographical mobility - Moved from abroad (%) - Multirace
Geographical mobility - Moved from abroad (%) - Other Race
Place of birth for the foreign-born population - Ireland (%)
Place of birth for the foreign-born population - Denmark (%)
Place of birth for the foreign-born population - Norway (%)
Place of birth for the foreign-born population - Sweden (%)
Place of birth for the foreign-born population - United Kingdom (%)
Place of birth for the foreign-born population - England (%)
Place of birth for the foreign-born population - Scotland (%)
Place of birth for the foreign-born population - Other Northern Europe (%)
Place of birth for the foreign-born population - Austria (%)
Place of birth for the foreign-born population - Belgium (%)
Place of birth for the foreign-born population - France (%)
Place of birth for the foreign-born population - Germany (%)
Place of birth for the foreign-born population - Netherlands (%)
Place of birth for the foreign-born population - Switzerland (%)
Place of birth for the foreign-born population - Other Western Europe (%)
Place of birth for the foreign-born population - Greece (%)
Place of birth for the foreign-born population - Italy (%)
Place of birth for the foreign-born population - Portugal (%)
Place of birth for the foreign-born population - Spain (%)
Place of birth for the foreign-born population - Other Southern Europe (%)
Place of birth for the foreign-born population - Albania (%)
Place of birth for the foreign-born population - Belarus (%)
Place of birth for the foreign-born population - Bosnia and Herzegovina (%)
Place of birth for the foreign-born population - Bulgaria (%)
Place of birth for the foreign-born population - Croatia (%)
Place of birth for the foreign-born population - Czechoslovakia (%)
Place of birth for the foreign-born population - Hungary (%)
Place of birth for the foreign-born population - Latvia (%)
Place of birth for the foreign-born population - Lithuania (%)
Place of birth for the foreign-born population - North Macedonia (Macedonia) (%)
Place of birth for the foreign-born population - Moldova (%)
Place of birth for the foreign-born population - Poland (%)
Place of birth for the foreign-born population - Romania (%)
Place of birth for the foreign-born population - Russia (%)
Place of birth for the foreign-born population - Serbia (%)
Place of birth for the foreign-born population - Ukraine (%)
Place of birth for the foreign-born population - Other Eastern Europe (%)
Place of birth for the foreign-born population - China (%)
Place of birth for the foreign-born population - Hong Kong (%)
Place of birth for the foreign-born population - Taiwan (%)
Place of birth for the foreign-born population - Japan (%)
Place of birth for the foreign-born population - Korea (%)
Place of birth for the foreign-born population - Other Eastern Asia (%)
Place of birth for the foreign-born population - Afghanistan (%)
Place of birth for the foreign-born population - Bangladesh (%)
Place of birth for the foreign-born population - India (%)
Place of birth for the foreign-born population - Iran (%)
Place of birth for the foreign-born population - Kazakhstan (%)
Place of birth for the foreign-born population - Nepal (%)
Place of birth for the foreign-born population - Pakistan (%)
Place of birth for the foreign-born population - Sri Lanka (%)
Place of birth for the foreign-born population - Uzbekistan (%)
Place of birth for the foreign-born population - Other South Central Asia (%)
Place of birth for the foreign-born population - Burma (%)
Place of birth for the foreign-born population - Cambodia (%)
Place of birth for the foreign-born population - Indonesia (%)
Place of birth for the foreign-born population - Laos (%)
Place of birth for the foreign-born population - Malaysia (%)
Place of birth for the foreign-born population - Philippines (%)
Place of birth for the foreign-born population - Singapore (%)
Place of birth for the foreign-born population - Thailand (%)
Place of birth for the foreign-born population - Vietnam (%)
Place of birth for the foreign-born population - Other South Eastern Asia (%)
Place of birth for the foreign-born population - Armenia (%)
Place of birth for the foreign-born population - Iraq (%)
Place of birth for the foreign-born population - Israel (%)
Place of birth for the foreign-born population - Jordan (%)
Place of birth for the foreign-born population - Kuwait (%)
Place of birth for the foreign-born population - Lebanon (%)
Place of birth for the foreign-born population - Saudi Arabia (%)
Place of birth for the foreign-born population - Syria (%)
Place of birth for the foreign-born population - Turkey (%)
Place of birth for the foreign-born population - Yemen (%)
Place of birth for the foreign-born population - Other Western Asia (%)
Place of birth for the foreign-born population - Eritrea (%)
Place of birth for the foreign-born population - Ethiopia (%)
Place of birth for the foreign-born population - Kenya (%)
Place of birth for the foreign-born population - Somalia (%)
Place of birth for the foreign-born population - Uganda (%)
Place of birth for the foreign-born population - Zimbabwe (%)
Place of birth for the foreign-born population - Other Eastern Africa (%)
Place of birth for the foreign-born population - Cameroon (%)
Place of birth for the foreign-born population - Congo (%)
Place of birth for the foreign-born population - Democratic Republic of Congo (Zaire) (%)
Place of birth for the foreign-born population - Other Middle Africa (%)
Place of birth for the foreign-born population - Egypt (%)
Place of birth for the foreign-born population - Morocco (%)
Place of birth for the foreign-born population - Sudan (%)
Place of birth for the foreign-born population - Other Northern Africa (%)
Place of birth for the foreign-born population - South Africa (%)
Place of birth for the foreign-born population - Other Southern Africa (%)
Place of birth for the foreign-born population - Cabo Verde (%)
Place of birth for the foreign-born population - Ghana (%)
Place of birth for the foreign-born population - Liberia (%)
Place of birth for the foreign-born population - Nigeria (%)
Place of birth for the foreign-born population - Senegal (%)
Place of birth for the foreign-born population - Sierra Leone (%)
Place of birth for the foreign-born population - Other Western Africa (%)
Place of birth for the foreign-born population - Australia (%)
Place of birth for the foreign-born population - New Zealand (%)
Place of birth for the foreign-born population - Fiji (%)
Place of birth for the foreign-born population - Micronesia (%)
Place of birth for the foreign-born population - Bahamas (%)
Place of birth for the foreign-born population - Barbados (%)
Place of birth for the foreign-born population - Cuba (%)
Place of birth for the foreign-born population - Dominica (%)
Place of birth for the foreign-born population - Dominican Republic (%)
Place of birth for the foreign-born population - Grenada (%)
Place of birth for the foreign-born population - Haiti (%)
Place of birth for the foreign-born population - Jamaica (%)
Place of birth for the foreign-born population - St. Vincent and the Grenadines (%)
Place of birth for the foreign-born population - Trinidad and Tobago (%)
Place of birth for the foreign-born population - West Indies (%)
Place of birth for the foreign-born population - Other Caribbean (%)
Place of birth for the foreign-born population - Belize (%)
Place of birth for the foreign-born population - Costa Rica (%)
Place of birth for the foreign-born population - El Salvador (%)
Place of birth for the foreign-born population - Guatemala (%)
Place of birth for the foreign-born population - Honduras (%)
Place of birth for the foreign-born population - Mexico (%)
Place of birth for the foreign-born population - Nicaragua (%)
Place of birth for the foreign-born population - Panama (%)
Place of birth for the foreign-born population - Other Central America (%)
Place of birth for the foreign-born population - Argentina (%)
Place of birth for the foreign-born population - Bolivia (%)
Place of birth for the foreign-born population - Brazil (%)
Place of birth for the foreign-born population - Chile (%)
Place of birth for the foreign-born population - Colombia (%)
Place of birth for the foreign-born population - Ecuador (%)
Place of birth for the foreign-born population - Guyana (%)
Place of birth for the foreign-born population - Peru (%)
Place of birth for the foreign-born population - Uruguay (%)
Place of birth for the foreign-born population - Venezuela (%)
Place of birth for the foreign-born population - Other South America (%)
Place of birth for the foreign-born population - Canada (%)
Place of birth for the foreign-born population - Other Northern America (%)
Place of birth for the foreign-born population - Other (%)
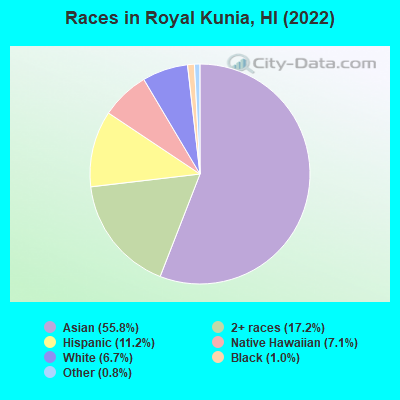
According to 2022 data, the most numerous races in Royal Kunia, HI are Asian alone (7,649 residents), Two or more races (2,357 residents), and White alone (913 residents). 69.1% of Royal Kunia residents speak English at home.
Race distribution in Royal Kunia 7,649 55.8% Asian alone 2,357 17.2% Two or more races 1,538 11.2% Hispanic 975 7.1% Native Hawaiian and Other 913 6.7% White alone 144 1.0% Black alone 104 0.8% Other race alone
2000 2022
494,149 40.8% Asian alone 277,091 22.9% White alone 218,700 18.1% Two or more races 108,441 9.0% Native Hawaiian and Other 87,699 7.2% Hispanic 20,829 1.7% Black alone 2,089 0.2% Other race alone 2,539 0.2% American Indian alone
498,125 34.6% Asian alone 318,574 22.1% Two or more races 297,937 20.7% White alone 160,103 11.1% Hispanic 134,567 9.3% Native Hawaiian and Other 23,682 1.6% Black alone 5,378 0.4% Other race alone 1,830 0.1% American Indian alone
Income and house value in Royal Kunia Median household income in 2022 $132,387 White non-Hispanic householders$122,566 Asian householders$128,322 Native Hawaiian and other Pacific Islander householders$133,140 Two or more races householders$87,850 Hispanic or Latino race householders
Median age by race in Royal Kunia
41.2 Median age for White residents41.6 36.1 24.8 Median age for Black or African American residents25.6 -709,604,519.1 -693,430,656.2 Median age for American Indian / Alaska Native residents-715,953,306.7 -629,508,196.1 48.1 Median age for Asian residents46.2 51.0 41.4 Median age for Native Hawaiian / Pacific Islander residents46.4 29.9 30.9 Median age for Other race residents31.2 70.6 25.7 Median age for Two or more races residents24.2 26.5 43.5 Median age for White alone residents48.8 40.6 27.8 Median age for Hispanic or Latino residents34.5 27.5
Owner/renter occupied households by race in Royal Kunia
House owners and renters - White residents 361 68.5% Owner occupied166 31.5% Renter occupiedHouse owners and renters - Black or African American residents 30 27.4% Owner occupied81 72.6% Renter occupiedHouse owners and renters - Asian residents 2,188 88.9% Owner occupied272 11.1% Renter occupiedHouse owners and renters - Native Hawaiian / Pacific Islander residents 292 83.6% Owner occupied57 16.4% Renter occupiedHouse owners and renters - Other race residents 88 100.0% Owner occupiedHouse owners and renters - Two or more races residents 544 75.0% Owner occupied182 25.0% Renter occupiedHouse owners and renters - White alone residents 299 68.5% Owner occupied137 31.5% Renter occupiedHouse owners and renters - Hispanic or Latino residents 310 76.9% Owner occupied93 23.1% Renter occupied
Language usage in Royal Kunia
English speakers - Total 69.1% of residents of Royal Kunia speak English at home.
1.4% of residents speak Spanish at home 190 100.0% Speak English very well29.0% of residents speak other language at home 2,124 55.4% Speak English very well1,708 44.6% Speak English less than very well
English speakers - Born in the United States 90.7% of residents of Royal Kunia speak English at home.
4.5% of residents speak Spanish at home 76 100.0% Speak English very well4.6% of residents speak other language at home 69 88.5% Speak English very well9 11.5% Speak English less than very well
English speakers - Native, born elsewhere 67.8% of residents of Royal Kunia speak English at home.
11.2% of residents speak Spanish at home 62 100.0% Speak English very well21.7% of residents speak other language at home 83 69.2% Speak English very well37 30.8% Speak English less than very well
English speakers - Foreign-born 8.5% of residents of Royal Kunia speak English at home.
0.4% of residents speak Spanish at home 14 100.0% Speak English very well90.5% of residents speak other language at home 1,528 49.6% Speak English very well1,553 50.4% Speak English less than very well
White (Caucasian) - Speak another language Native:
4.8% (50)Foreign-born:
92.2% (13)
Asian - Speak only English Native:
86.1% (3,776)Foreign-born:
8.5% (265)
Asian - Speak another language Native:
13.8% (607)Foreign-born:
91.6% (2,873)
Native Hawaiian / Pacific Islander - Speak another language Native:
1.3% (13)Foreign-born:
100.0% (159)
Two or more races - Speak only English Native:
90.9% (2,631)Foreign-born:
25.5% (18)
Two or more races - Speak another language Native:
9.1% (262)Foreign-born:
74.4% (54)
Hispanic or Latino - Speak another language Native:
10.0% (150)Foreign-born:
95.6% (6)
Foreign-born residents in Royal Kunia
Marital status for residents in Royal Kunia Marital status - White (Caucasian) population 15 years and over
Males 24.3% Never married56.8% Now married0.0% Separated5.1% Widowed13.8% DivorcedFemales 37.1% Never married44.0% Now married2.4% Separated7.8% Widowed8.7% DivorcedWomen who did not give birth in the past 12 months Now married:
42.8% (123)Unmarried:
57.2% (164)
Marital status - Black or African American population 15 years and over
Males 28.2% Never married71.8% Now married0.0% Separated0.0% Widowed0.0% DivorcedFemales 100.0% Never married0.0% Now married0.0% Separated0.0% Widowed0.0% DivorcedWomen who did not give birth in the past 12 months Now married:
0.0% (0)Unmarried:
100.0% (50)
Marital status - Asian population 15 years and over
Males 37.3% Never married56.5% Now married0.3% Separated1.1% Widowed4.8% DivorcedFemales 27.3% Never married60.0% Now married1.7% Separated8.4% Widowed2.7% DivorcedWomen who gave birth in the past 12 months Now married:
36.8% (30)Unmarried:
63.2% (52)
Women who did not give birth in the past 12 months Now married:
47.2% (694)Unmarried:
52.8% (778)
Marital status - Native Hawaiian / Pacific Islander population 15 years and over
Males 24.5% Never married64.9% Now married0.0% Separated9.0% Widowed1.6% DivorcedFemales 50.7% Never married47.8% Now married0.0% Separated1.5% Widowed0.0% DivorcedWomen who did not give birth in the past 12 months Now married:
33.2% (99)Unmarried:
66.8% (199)
Marital status - Other race population 15 years and over
Males 19.2% Never married80.8% Now married0.0% Separated0.0% Widowed0.0% DivorcedFemales 0.0% Never married100.0% Now married0.0% Separated0.0% Widowed0.0% DivorcedWomen who did not give birth in the past 12 months Now married:
100.0% (32)Unmarried:
0.0% (0)
Marital status - Two or more races population 15 years and over
Males 51.3% Never married47.3% Now married0.0% Separated0.6% Widowed0.9% DivorcedFemales 46.2% Never married37.5% Now married0.0% Separated3.9% Widowed12.3% DivorcedWomen who gave birth in the past 12 months Now married:
42.2% (29)Unmarried:
57.8% (39)
Women who did not give birth in the past 12 months Now married:
20.3% (135)Unmarried:
79.7% (531)
Marital status - White alone, not Hispanic / Latino population 15 years and over
Males 17.9% Never married60.1% Now married0.0% Separated6.0% Widowed16.1% DivorcedFemales 24.8% Never married50.7% Now married3.2% Separated10.1% Widowed11.2% DivorcedWomen who did not give birth in the past 12 months Now married:
53.7% (105)Unmarried:
46.3% (91)
Marital status - Hispanic or Latino population 15 years and over
Males 46.1% Never married53.9% Now married0.0% Separated0.0% Widowed0.0% DivorcedFemales 59.8% Never married34.9% Now married0.0% Separated1.1% Widowed4.2% DivorcedWomen who did not give birth in the past 12 months Now married:
21.6% (93)Unmarried:
78.4% (339)
Ancestries in Royal Kunia
153 2.1% American76 1.0% German76 1.0% Irish54 0.7% English35 0.5% Scotch-Irish27 0.4% European25 0.3% Portuguese23 0.3% Serbian14 0.2% Northern European11 0.2% Dutch11 0.2% Norwegian8 0.1% Belgian8 0.1% Guyanese8 0.1% Italian
Children Nativity (place of birth) in Royal Kunia
Children under 6 years - Living with two parents Both parents native 166 100.0% NativeBoth parents foreign-born 102 100.0% NativeChildren under 6 years - Living with one parent Native parent 316 100.0% NativeChildren 6 to 17 years - Living with two parents Both parents native 634 99.6% Native3 0.4% Foreign-bornBoth parents foreign-born 221 83.7% Native43 16.3% Foreign-bornOne native, one foreign-born parent 313 94.3% Native19 5.7% Foreign-bornChildren 6 to 17 years - Living with one parent Native parent 581 97.2% Native17 2.8% Foreign-bornForeign-born parent 40 100.0% Native
Grandparents responsible for own grandchildren in Royal Kunia
Grandparents (30 to 59 years) White / Caucasian 9 100.0% Not responsible for grandchildrenAsian 18 56.8% Responsible for grandchildren14 43.2% Not responsible for grandchildrenTwo or more races 13 50.2% Responsible for grandchildren13 49.8% Not responsible for grandchildrenWhite alone, not Hispanic / Latino 10 100.0% Not responsible for grandchildrenHispanic or Latino 8 100.0% Responsible for grandchildrenGrandparents (60 years and over) White / Caucasian 26 100.0% Not responsible for grandchildrenAsian 56 12.9% Responsible for grandchildren378 87.1% Not responsible for grandchildrenTwo or more races 18 100.0% Not responsible for grandchildrenWhite alone, not Hispanic / Latino 25 100.0% Not responsible for grandchildrenHispanic or Latino 7 100.0% Not responsible for grandchildren