Races in Ridgeland, Mississippi (MS) Detailed Stats
Data:
Races - White alone (%)
Races - White alone (% change since 2000)
Races - Black alone (%)
Races - Black alone (% change since 2000)
Races - American Indian alone (%)
Races - American Indian alone (% change since 2000)
Races - Asian alone (%)
Races - Asian alone (% change since 2000)
Races - Hispanic (%)
Races - Hispanic (% change since 2000)
Races - Native Hawaiian and Other Pacific Islander alone (%)
Races - Native Hawaiian and Other Pacific Islander alone (% change since 2000)
Races - Two or more races(%)
Races - Two or more races(% change since 2000)
Races - Other race alone (%)
Races - Other race alone (% change since 2000)
Racial diversity
Place of birth - Born in state of residence (%)
Place of birth - Born in state of residence (%) - White
Place of birth - Born in state of residence (%) - Black or African American
Place of birth - Born in state of residence (%) - Asian
Place of birth - Born in state of residence (%) - Hispanic or Latino
Place of birth - Born in state of residence (%) - American Indian and Alaska Native
Place of birth - Born in state of residence (%) - Multirace
Place of birth - Born in state of residence (%) - Other Race
Place of birth - Born in other state (%)
Place of birth - Born in other state (%) - White
Place of birth - Born in other state (%) - Black or African American
Place of birth - Born in other state (%) - Asian
Place of birth - Born in other state (%) - Hispanic or Latino
Place of birth - Born in other state (%) - American Indian and Alaska Native
Place of birth - Born in other state (%) - Multirace
Place of birth - Born in other state (%) - Other Race
Place of birth - Native, outside of US (%)
Place of birth - Native, outside of US (%) - White
Place of birth - Native, outside of US (%) - Black or African American
Place of birth - Native, outside of US (%) - Asian
Place of birth - Native, outside of US (%) - Hispanic or Latino
Place of birth - Native, outside of US (%) - American Indian and Alaska Native
Place of birth - Native, outside of US (%) - Multirace
Place of birth - Native, outside of US (%) - Other Race
Place of birth - Foreign born (%)
Place of birth - Foreign born (%) - White
Place of birth - Foreign born (%) - Black or African American
Place of birth - Foreign born (%) - Asian
Place of birth - Foreign born (%) - Hispanic or Latino
Place of birth - Foreign born (%) - American Indian and Alaska Native
Place of birth - Foreign born (%) - Multirace
Place of birth - Foreign born (%) - Other Race
Residents speaking English at home (%)
Residents speaking English at home - Born in the United States (%)
Residents speaking English at home - Native, born elsewhere (%)
Residents speaking English at home - Foreign born (%)
Residents speaking Spanish at home (%)
Residents speaking Spanish at home - Born in the United States (%)
Residents speaking Spanish at home - Native, born elsewhere (%)
Residents speaking Spanish at home - Foreign born (%)
Residents speaking other language at home (%)
Residents speaking other language at home - Born in the United States (%)
Residents speaking other language at home - Native, born elsewhere (%)
Residents speaking other language at home - Foreign born (%)
Marital status - Never married (%)
Marital status - Now married (%)
Marital status - Separated (%)
Marital status - Widowed (%)
Marital status - Divorced (%)
Ancestries Reported - Arab (%)
Ancestries Reported - Czech (%)
Ancestries Reported - Danish (%)
Ancestries Reported - Dutch (%)
Ancestries Reported - English (%)
Ancestries Reported - French (%)
Ancestries Reported - French Canadian (%)
Ancestries Reported - German (%)
Ancestries Reported - Greek (%)
Ancestries Reported - Hungarian (%)
Ancestries Reported - Irish (%)
Ancestries Reported - Italian (%)
Ancestries Reported - Lithuanian (%)
Ancestries Reported - Norwegian (%)
Ancestries Reported - Polish (%)
Ancestries Reported - Portuguese (%)
Ancestries Reported - Russian (%)
Ancestries Reported - Scotch-Irish (%)
Ancestries Reported - Scottish (%)
Ancestries Reported - Slovak (%)
Ancestries Reported - Subsaharan African (%)
Ancestries Reported - Swedish (%)
Ancestries Reported - Swiss (%)
Ancestries Reported - Ukrainian (%)
Ancestries Reported - United States (%)
Ancestries Reported - Welsh (%)
Ancestries Reported - West Indian (%)
Ancestries Reported - Other (%)
Geographical mobility - Same house 1 year ago (%)
Geographical mobility - Same house 1 year ago (%) - White
Geographical mobility - Same house 1 year ago (%) - Black or African American
Geographical mobility - Same house 1 year ago (%) - Asian
Geographical mobility - Same house 1 year ago (%) - Hispanic or Latino
Geographical mobility - Same house 1 year ago (%) - American Indian and Alaska Native
Geographical mobility - Same house 1 year ago (%) - Multirace
Geographical mobility - Same house 1 year ago (%) - Other Race
Geographical mobility - Moved within same county (%)
Geographical mobility - Moved within same county (%) - White
Geographical mobility - Moved within same county (%) - Black or African American
Geographical mobility - Moved within same county (%) - Asian
Geographical mobility - Moved within same county (%) - Hispanic or Latino
Geographical mobility - Moved within same county (%) - American Indian and Alaska Native
Geographical mobility - Moved within same county (%) - Multirace
Geographical mobility - Moved within same county (%) - Other Race
Geographical mobility - Moved from different county within same state (%)
Geographical mobility - Moved from different county within same state (%) - White
Geographical mobility - Moved from different county within same state (%) - Black or African American
Geographical mobility - Moved from different county within same state (%) - Asian
Geographical mobility - Moved from different county within same state (%) - Hispanic or Latino
Geographical mobility - Moved from different county within same state (%) - American Indian and Alaska Native
Geographical mobility - Moved from different county within same state (%) - Multirace
Geographical mobility - Moved from different county within same state (%) - Other Race
Geographical mobility - Moved from different state (%)
Geographical mobility - Moved from different state (%) - White
Geographical mobility - Moved from different state (%) - Black or African American
Geographical mobility - Moved from different state (%) - Asian
Geographical mobility - Moved from different state (%) - Hispanic or Latino
Geographical mobility - Moved from different state (%) - American Indian and Alaska Native
Geographical mobility - Moved from different state (%) - Multirace
Geographical mobility - Moved from different state (%) - Other Race
Geographical mobility - Moved from abroad (%)
Geographical mobility - Moved from abroad (%) - White
Geographical mobility - Moved from abroad (%) - Black or African American
Geographical mobility - Moved from abroad (%) - Asian
Geographical mobility - Moved from abroad (%) - Hispanic or Latino
Geographical mobility - Moved from abroad (%) - American Indian and Alaska Native
Geographical mobility - Moved from abroad (%) - Multirace
Geographical mobility - Moved from abroad (%) - Other Race
Place of birth for the foreign-born population - Ireland (%)
Place of birth for the foreign-born population - Denmark (%)
Place of birth for the foreign-born population - Norway (%)
Place of birth for the foreign-born population - Sweden (%)
Place of birth for the foreign-born population - United Kingdom (%)
Place of birth for the foreign-born population - England (%)
Place of birth for the foreign-born population - Scotland (%)
Place of birth for the foreign-born population - Other Northern Europe (%)
Place of birth for the foreign-born population - Austria (%)
Place of birth for the foreign-born population - Belgium (%)
Place of birth for the foreign-born population - France (%)
Place of birth for the foreign-born population - Germany (%)
Place of birth for the foreign-born population - Netherlands (%)
Place of birth for the foreign-born population - Switzerland (%)
Place of birth for the foreign-born population - Other Western Europe (%)
Place of birth for the foreign-born population - Greece (%)
Place of birth for the foreign-born population - Italy (%)
Place of birth for the foreign-born population - Portugal (%)
Place of birth for the foreign-born population - Spain (%)
Place of birth for the foreign-born population - Other Southern Europe (%)
Place of birth for the foreign-born population - Albania (%)
Place of birth for the foreign-born population - Belarus (%)
Place of birth for the foreign-born population - Bosnia and Herzegovina (%)
Place of birth for the foreign-born population - Bulgaria (%)
Place of birth for the foreign-born population - Croatia (%)
Place of birth for the foreign-born population - Czechoslovakia (%)
Place of birth for the foreign-born population - Hungary (%)
Place of birth for the foreign-born population - Latvia (%)
Place of birth for the foreign-born population - Lithuania (%)
Place of birth for the foreign-born population - North Macedonia (Macedonia) (%)
Place of birth for the foreign-born population - Moldova (%)
Place of birth for the foreign-born population - Poland (%)
Place of birth for the foreign-born population - Romania (%)
Place of birth for the foreign-born population - Russia (%)
Place of birth for the foreign-born population - Serbia (%)
Place of birth for the foreign-born population - Ukraine (%)
Place of birth for the foreign-born population - Other Eastern Europe (%)
Place of birth for the foreign-born population - China (%)
Place of birth for the foreign-born population - Hong Kong (%)
Place of birth for the foreign-born population - Taiwan (%)
Place of birth for the foreign-born population - Japan (%)
Place of birth for the foreign-born population - Korea (%)
Place of birth for the foreign-born population - Other Eastern Asia (%)
Place of birth for the foreign-born population - Afghanistan (%)
Place of birth for the foreign-born population - Bangladesh (%)
Place of birth for the foreign-born population - India (%)
Place of birth for the foreign-born population - Iran (%)
Place of birth for the foreign-born population - Kazakhstan (%)
Place of birth for the foreign-born population - Nepal (%)
Place of birth for the foreign-born population - Pakistan (%)
Place of birth for the foreign-born population - Sri Lanka (%)
Place of birth for the foreign-born population - Uzbekistan (%)
Place of birth for the foreign-born population - Other South Central Asia (%)
Place of birth for the foreign-born population - Burma (%)
Place of birth for the foreign-born population - Cambodia (%)
Place of birth for the foreign-born population - Indonesia (%)
Place of birth for the foreign-born population - Laos (%)
Place of birth for the foreign-born population - Malaysia (%)
Place of birth for the foreign-born population - Philippines (%)
Place of birth for the foreign-born population - Singapore (%)
Place of birth for the foreign-born population - Thailand (%)
Place of birth for the foreign-born population - Vietnam (%)
Place of birth for the foreign-born population - Other South Eastern Asia (%)
Place of birth for the foreign-born population - Armenia (%)
Place of birth for the foreign-born population - Iraq (%)
Place of birth for the foreign-born population - Israel (%)
Place of birth for the foreign-born population - Jordan (%)
Place of birth for the foreign-born population - Kuwait (%)
Place of birth for the foreign-born population - Lebanon (%)
Place of birth for the foreign-born population - Saudi Arabia (%)
Place of birth for the foreign-born population - Syria (%)
Place of birth for the foreign-born population - Turkey (%)
Place of birth for the foreign-born population - Yemen (%)
Place of birth for the foreign-born population - Other Western Asia (%)
Place of birth for the foreign-born population - Eritrea (%)
Place of birth for the foreign-born population - Ethiopia (%)
Place of birth for the foreign-born population - Kenya (%)
Place of birth for the foreign-born population - Somalia (%)
Place of birth for the foreign-born population - Uganda (%)
Place of birth for the foreign-born population - Zimbabwe (%)
Place of birth for the foreign-born population - Other Eastern Africa (%)
Place of birth for the foreign-born population - Cameroon (%)
Place of birth for the foreign-born population - Congo (%)
Place of birth for the foreign-born population - Democratic Republic of Congo (Zaire) (%)
Place of birth for the foreign-born population - Other Middle Africa (%)
Place of birth for the foreign-born population - Egypt (%)
Place of birth for the foreign-born population - Morocco (%)
Place of birth for the foreign-born population - Sudan (%)
Place of birth for the foreign-born population - Other Northern Africa (%)
Place of birth for the foreign-born population - South Africa (%)
Place of birth for the foreign-born population - Other Southern Africa (%)
Place of birth for the foreign-born population - Cabo Verde (%)
Place of birth for the foreign-born population - Ghana (%)
Place of birth for the foreign-born population - Liberia (%)
Place of birth for the foreign-born population - Nigeria (%)
Place of birth for the foreign-born population - Senegal (%)
Place of birth for the foreign-born population - Sierra Leone (%)
Place of birth for the foreign-born population - Other Western Africa (%)
Place of birth for the foreign-born population - Australia (%)
Place of birth for the foreign-born population - New Zealand (%)
Place of birth for the foreign-born population - Fiji (%)
Place of birth for the foreign-born population - Micronesia (%)
Place of birth for the foreign-born population - Bahamas (%)
Place of birth for the foreign-born population - Barbados (%)
Place of birth for the foreign-born population - Cuba (%)
Place of birth for the foreign-born population - Dominica (%)
Place of birth for the foreign-born population - Dominican Republic (%)
Place of birth for the foreign-born population - Grenada (%)
Place of birth for the foreign-born population - Haiti (%)
Place of birth for the foreign-born population - Jamaica (%)
Place of birth for the foreign-born population - St. Vincent and the Grenadines (%)
Place of birth for the foreign-born population - Trinidad and Tobago (%)
Place of birth for the foreign-born population - West Indies (%)
Place of birth for the foreign-born population - Other Caribbean (%)
Place of birth for the foreign-born population - Belize (%)
Place of birth for the foreign-born population - Costa Rica (%)
Place of birth for the foreign-born population - El Salvador (%)
Place of birth for the foreign-born population - Guatemala (%)
Place of birth for the foreign-born population - Honduras (%)
Place of birth for the foreign-born population - Mexico (%)
Place of birth for the foreign-born population - Nicaragua (%)
Place of birth for the foreign-born population - Panama (%)
Place of birth for the foreign-born population - Other Central America (%)
Place of birth for the foreign-born population - Argentina (%)
Place of birth for the foreign-born population - Bolivia (%)
Place of birth for the foreign-born population - Brazil (%)
Place of birth for the foreign-born population - Chile (%)
Place of birth for the foreign-born population - Colombia (%)
Place of birth for the foreign-born population - Ecuador (%)
Place of birth for the foreign-born population - Guyana (%)
Place of birth for the foreign-born population - Peru (%)
Place of birth for the foreign-born population - Uruguay (%)
Place of birth for the foreign-born population - Venezuela (%)
Place of birth for the foreign-born population - Other South America (%)
Place of birth for the foreign-born population - Canada (%)
Place of birth for the foreign-born population - Other Northern America (%)
Place of birth for the foreign-born population - Other (%)
Latest news about races in Ridgeland, MS collected exclusively by city-data.com from local newspapers, TV, and radio stations
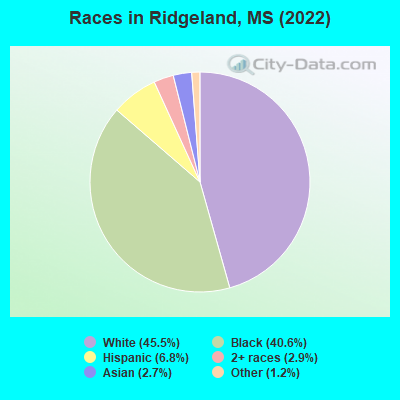
According to 2022 data, the most numerous races in Ridgeland, MS are White alone (11,122 residents), Black alone (9,931 residents), and Hispanic (1,666 residents). 88.1% of Ridgeland residents speak English at home. 7.3% of Ridgeland, MS residents are foreign-born (3.1% born in Asia, 3.1% born in Latin America), which is 72.7% greater than the foreign-born rate of 2.0% across the entire state of Mississippi.
Race distribution in Ridgeland
2000 2022
1,727,908 60.7% White alone 1,028,473 36.2% Black alone 39,569 1.4% Hispanic 17,272 0.6% Two or more races 18,349 0.6% Asian alone 11,224 0.4% American Indian alone 1,294 0.05% Other race alone 569 0.02% Native Hawaiian and Other
1,625,979 55.3% White alone 1,072,962 36.5% Black alone 97,177 3.3% Hispanic 96,367 3.3% Two or more races 25,217 0.9% Asian alone 12,457 0.4% American Indian alone 9,501 0.3% Other race alone 397 0.01% Native Hawaiian and Other
Income and house value in Ridgeland Median household income in 2022 $80,390 White non-Hispanic householders$51,913 Black householders$100,728 Asian householders$86,307 Some other race householders$65,987 Two or more races householders$77,678 Hispanic or Latino race householdersMedian 2022 house value $270,774 White Non-Hispanic householders$208,763 Black or African American householders$303,435 American Indian or Alaska Native householders $262,168 Asian householders$242,748 Two or more races householders$606,870 Hispanic or Latino householders
Median age by race in Ridgeland
44.9 Median age for White residents45.7 42.2 31.4 Median age for Black or African American residents28.9 33.4 -703,818,368.7 Median age for American Indian / Alaska Native residents-666,666,666.0 -666,666,666.0 51.8 Median age for Asian residents54.8 45.5 -666,666,666.0 Median age for Native Hawaiian / Pacific Islander residents-666,666,666.0 -666,666,666.0 20.7 Median age for Other race residents14.1 53.1 20.7 Median age for Two or more races residents28.0 20.5 46.5 Median age for White alone residents49.0 44.3 24.1 Median age for Hispanic or Latino residents24.6 16.6
Owner/renter occupied households by race in Ridgeland
House owners and renters - White residents 3,378 63.8% Owner occupied1,917 36.2% Renter occupiedHouse owners and renters - Black or African American residents 1,439 30.3% Owner occupied3,315 69.7% Renter occupiedHouse owners and renters - Asian residents 169 70.5% Owner occupied71 29.5% Renter occupiedHouse owners and renters - Other race residents 81 55.4% Owner occupied65 44.6% Renter occupiedHouse owners and renters - Two or more races residents 87 28.7% Owner occupied217 71.3% Renter occupiedHouse owners and renters - White alone residents 3,411 65.2% Owner occupied1,818 34.8% Renter occupiedHouse owners and renters - Hispanic or Latino residents 78 26.4% Owner occupied218 73.6% Renter occupied
Language usage in Ridgeland
English speakers - Total 88.1% of residents of Ridgeland speak English at home.
6.5% of residents speak Spanish at home 647 41.9% Speak English very well897 58.1% Speak English less than very well6.1% of residents speak other language at home 770 53.0% Speak English very well683 47.0% Speak English less than very well
English speakers - Born in the United States 94.2% of residents of Ridgeland speak English at home.
2.5% of residents speak Spanish at home 112 100.0% Speak English very well2.9% of residents speak other language at home 98 74.2% Speak English very well34 25.8% Speak English less than very well
English speakers - Native, born elsewhere 94.8% of residents of Ridgeland speak English at home.
16.7% of residents speak Spanish at home 16 100.0% Speak English less than very well43.8% of residents speak other language at home 42 100.0% Speak English very well
English speakers - Foreign-born 14.5% of residents of Ridgeland speak English at home.
42.9% of residents speak Spanish at home 318 32.7% Speak English very well655 67.3% Speak English less than very well45.0% of residents speak other language at home 367 35.9% Speak English very well654 64.1% Speak English less than very well
White (Caucasian) - Speak only English Native:
97.3% (10,467)Foreign-born:
18.1% (71)
White (Caucasian) - Speak another language Native:
2.3% (246)Foreign-born:
72.8% (287)
Black or African American - Speak only English Native:
98.5% (9,133)Foreign-born:
57.2% (109)
Black or African American - Speak another language Native:
1.5% (142)Foreign-born:
40.5% (77)
Asian - Speak only English Native:
55.7% (48)Foreign-born:
16.9% (129)
Asian - Speak another language Native:
41.2% (35)Foreign-born:
68.4% (524)
Other race - Speak another language Native:
73.3% (437)Foreign-born:
100.0% (274)
Two or more races - Speak only English Native:
92.2% (567)Foreign-born:
4.2% (8)
Two or more races - Speak another language Native:
7.1% (44)Foreign-born:
99.0% (180)
White alone - Speak only English Native:
98.7% (10,412)Foreign-born:
13.7% (34)
White alone - Speak another language Native:
1.3% (139)Foreign-born:
91.1% (225)
Hispanic or Latino - Speak only English Native:
19.7% (90)Foreign-born:
4.8% (45)
Hispanic or Latino - Speak another language Native:
77.8% (354)Foreign-born:
100.0% (945)
Foreign-born residents in Ridgeland 1,831 residents are foreign born (3.1% Asia , 3.1% Latin America ).
This city:
7.3%Mississippi:
2.3%
Marital status for residents in Ridgeland Marital status - White (Caucasian) population 15 years and over
Males 31.7% Never married52.7% Now married0.2% Separated2.0% Widowed13.4% DivorcedFemales 29.9% Never married41.5% Now married2.0% Separated11.0% Widowed15.6% DivorcedWomen who gave birth in the past 12 months Now married:
60.8% (44)Unmarried:
39.2% (28)
Women who did not give birth in the past 12 months Now married:
33.7% (975)Unmarried:
66.3% (1,914)
Marital status - Black or African American population 15 years and over
Males 55.1% Never married34.5% Now married1.0% Separated0.1% Widowed9.3% DivorcedFemales 51.7% Never married24.7% Now married4.7% Separated6.6% Widowed12.4% DivorcedWomen who gave birth in the past 12 months Now married:
33.7% (35)Unmarried:
66.3% (68)
Women who did not give birth in the past 12 months Now married:
22.6% (893)Unmarried:
77.4% (3,050)
Marital status - Asian population 15 years and over
Males 4.4% Never married70.8% Now married9.6% Separated15.1% Widowed0.0% DivorcedFemales 8.0% Never married87.7% Now married0.0% Separated4.3% Widowed0.0% DivorcedWomen who did not give birth in the past 12 months Now married:
89.1% (152)Unmarried:
10.9% (19)
Marital status - Other race population 15 years and over
Males 5.9% Never married88.2% Now married0.0% Separated0.0% Widowed5.9% DivorcedFemales 31.3% Never married54.2% Now married0.0% Separated0.0% Widowed14.5% DivorcedWomen who did not give birth in the past 12 months Now married:
56.9% (183)Unmarried:
43.1% (139)
Marital status - Two or more races population 15 years and over
Males 56.1% Never married23.4% Now married13.6% Separated0.0% Widowed7.0% DivorcedFemales 65.1% Never married19.4% Now married0.0% Separated14.5% Widowed1.1% DivorcedWomen who gave birth in the past 12 months Now married:
52.9% (15)Unmarried:
47.1% (14)
Women who did not give birth in the past 12 months Now married:
18.1% (42)Unmarried:
81.9% (191)
Marital status - White alone, not Hispanic / Latino population 15 years and over
Males 30.8% Never married53.5% Now married0.2% Separated2.1% Widowed13.3% DivorcedFemales 28.7% Never married42.2% Now married2.1% Separated10.7% Widowed16.4% DivorcedWomen who gave birth in the past 12 months Now married:
57.4% (39)Unmarried:
42.6% (29)
Women who did not give birth in the past 12 months Now married:
34.0% (935)Unmarried:
66.0% (1,818)
Marital status - Hispanic or Latino population 15 years and over
Males 29.8% Never married62.3% Now married0.0% Separated0.0% Widowed7.9% DivorcedFemales 46.6% Never married43.6% Now married0.0% Separated9.6% Widowed0.2% DivorcedWomen who gave birth in the past 12 months Now married:
65.2% (16)Unmarried:
34.8% (9)
Women who did not give birth in the past 12 months Now married:
47.3% (216)Unmarried:
52.7% (241)
Ancestries in Ridgeland
2,017 12.0% English943 5.6% European784 4.7% American735 4.4% Irish276 1.6% Scotch-Irish274 1.6% Italian232 1.4% African231 1.4% German191 1.1% Scottish133 0.8% French76 0.5% French Canadian48 0.3% Norwegian41 0.2% Haitian39 0.2% Welsh37 0.2% Hungarian37 0.2% Ghanaian33 0.2% Nigerian32 0.2% British32 0.2% Eastern European32 0.2% Russian27 0.2% Polish23 0.1% Finnish21 0.1% Belgian17 0.1% Jamaican15 0.09% Cajun14 0.08% Slovene14 0.08% Swedish11 0.07% Lebanese9 0.05% Iranian7 0.04% Dutch7 0.04% Serbian5 0.03% Greek5 0.03% Northern European2 0.01% Kenyan1 0.01% Scandinavian
Geographical mobility in Ridgeland Same house 1 year ago 9,616 80.8% White (Caucasian)8,248 79.5% Black or African American4 99.4% American Indian / Alaska Native515 76.7% Asian23 100.0% Native Hawaiian / Pacific Islander1,061 100.0% Other race658 70.8% Two or more races9,162 80.4% White alone, not Hispanic / Latino1,498 93.0% Hispanic or LatinoMoved within same county 1,035 8.7% White / Caucasian1,866 18.0% Black or African American37 5.6% Asian54 5.8% Two or more races992 8.7% White alone, not Hispanic / Latino26 1.6% Hispanic or LatinoMoved within same state 882 7.4% White / Caucasian372 3.6% Black or African American42 6.2% Asian203 21.9% Two or more races867 7.6% White alone, not Hispanic / Latino51 3.2% Hispanic or LatinoMoved from different state 258 2.2% White / Caucasian181 1.7% Black or African American50 7.5% Asian4 0.4% Other race256 2.2% White alone, not Hispanic / Latino16 1.0% Hispanic or LatinoMoved from abroad 16 0.1% White16 0.1% White alone, not Hispanic / Latino
Children Nativity (place of birth) in Ridgeland
Children under 6 years - Living with two parents Both parents native 577 100.0% NativeBoth parents foreign-born 176 81.4% Native40 18.6% Foreign-bornOne native, one foreign-born parent 121 100.0% NativeChildren under 6 years - Living with one parent Native parent 427 100.0% NativeForeign-born parent 159 100.0% NativeChildren 6 to 17 years - Living with two parents Both parents native 1,456 99.9% Native2 0.1% Foreign-bornBoth parents foreign-born 158 86.3% Native25 13.7% Foreign-bornOne native, one foreign-born parent 183 100.0% NativeChildren 6 to 17 years - Living with one parent Native parent 1,338 100.0% NativeForeign-born parent 55 55.0% Native45 45.0% Foreign-born
Grandparents responsible for own grandchildren in Ridgeland
Grandparents (30 to 59 years) White / Caucasian 35 37.7% Responsible for grandchildren57 62.3% Not responsible for grandchildrenBlack or African American 57 60.9% Responsible for grandchildren36 39.1% Not responsible for grandchildrenWhite alone, not Hispanic / Latino 35 64.4% Responsible for grandchildren19 35.6% Not responsible for grandchildrenHispanic or Latino 53 100.0% Not responsible for grandchildrenGrandparents (60 years and over) White / Caucasian 1 10.6% Responsible for grandchildren7 89.4% Not responsible for grandchildrenBlack or African American 25 57.0% Responsible for grandchildren19 43.0% Not responsible for grandchildrenWhite alone, not Hispanic / Latino 7 100.0% Not responsible for grandchildrenHispanic or Latino 1 100.0% Responsible for grandchildren