Races in Powder Springs, Georgia (GA) Detailed Stats
Data:
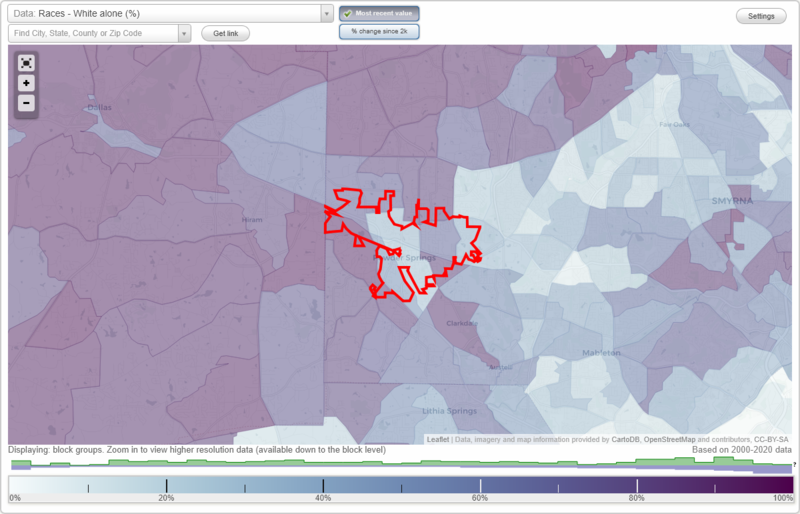
Races - White alone (%)
Races - White alone (% change since 2000)
Races - Black alone (%)
Races - Black alone (% change since 2000)
Races - American Indian alone (%)
Races - American Indian alone (% change since 2000)
Races - Asian alone (%)
Races - Asian alone (% change since 2000)
Races - Hispanic (%)
Races - Hispanic (% change since 2000)
Races - Native Hawaiian and Other Pacific Islander alone (%)
Races - Native Hawaiian and Other Pacific Islander alone (% change since 2000)
Races - Two or more races(%)
Races - Two or more races(% change since 2000)
Races - Other race alone (%)
Races - Other race alone (% change since 2000)
Racial diversity
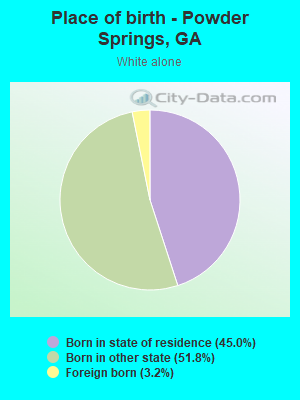
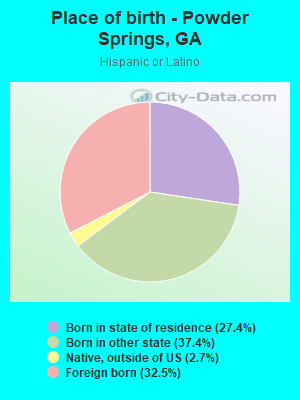
Place of birth - Born in state of residence (%)
Place of birth - Born in state of residence (%) - White
Place of birth - Born in state of residence (%) - Black or African American
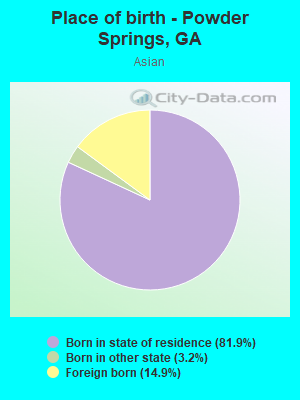
Place of birth - Born in state of residence (%) - Asian
Place of birth - Born in state of residence (%) - Hispanic or Latino
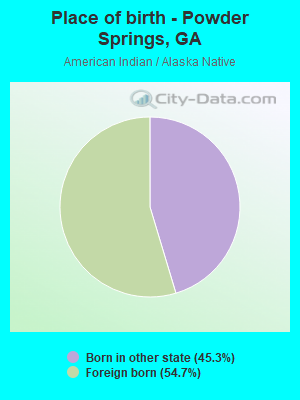
Place of birth - Born in state of residence (%) - American Indian and Alaska Native
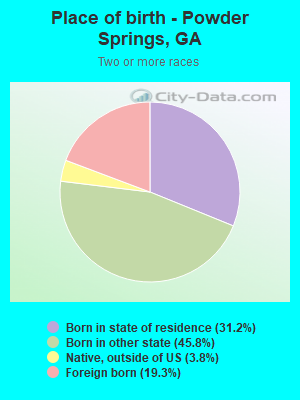
Place of birth - Born in state of residence (%) - Multirace
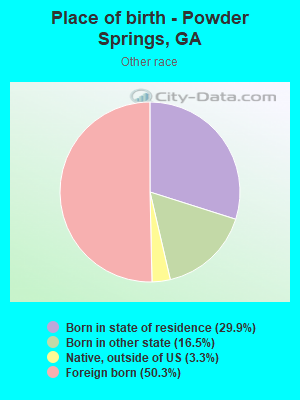
Place of birth - Born in state of residence (%) - Other Race
Place of birth - Born in other state (%)
Place of birth - Born in other state (%) - White
Place of birth - Born in other state (%) - Black or African American
Place of birth - Born in other state (%) - Asian
Place of birth - Born in other state (%) - Hispanic or Latino
Place of birth - Born in other state (%) - American Indian and Alaska Native
Place of birth - Born in other state (%) - Multirace
Place of birth - Born in other state (%) - Other Race
Place of birth - Native, outside of US (%)
Place of birth - Native, outside of US (%) - White
Place of birth - Native, outside of US (%) - Black or African American
Place of birth - Native, outside of US (%) - Asian
Place of birth - Native, outside of US (%) - Hispanic or Latino
Place of birth - Native, outside of US (%) - American Indian and Alaska Native
Place of birth - Native, outside of US (%) - Multirace
Place of birth - Native, outside of US (%) - Other Race
Place of birth - Foreign born (%)
Place of birth - Foreign born (%) - White
Place of birth - Foreign born (%) - Black or African American
Place of birth - Foreign born (%) - Asian
Place of birth - Foreign born (%) - Hispanic or Latino
Place of birth - Foreign born (%) - American Indian and Alaska Native
Place of birth - Foreign born (%) - Multirace
Place of birth - Foreign born (%) - Other Race
Residents speaking English at home (%)
Residents speaking English at home - Born in the United States (%)
Residents speaking English at home - Native, born elsewhere (%)
Residents speaking English at home - Foreign born (%)
Residents speaking Spanish at home (%)
Residents speaking Spanish at home - Born in the United States (%)
Residents speaking Spanish at home - Native, born elsewhere (%)
Residents speaking Spanish at home - Foreign born (%)
Residents speaking other language at home (%)
Residents speaking other language at home - Born in the United States (%)
Residents speaking other language at home - Native, born elsewhere (%)
Residents speaking other language at home - Foreign born (%)
Marital status - Never married (%)
Marital status - Now married (%)
Marital status - Separated (%)
Marital status - Widowed (%)
Marital status - Divorced (%)
Ancestries Reported - Arab (%)
Ancestries Reported - Czech (%)
Ancestries Reported - Danish (%)
Ancestries Reported - Dutch (%)
Ancestries Reported - English (%)
Ancestries Reported - French (%)
Ancestries Reported - French Canadian (%)
Ancestries Reported - German (%)
Ancestries Reported - Greek (%)
Ancestries Reported - Hungarian (%)
Ancestries Reported - Irish (%)
Ancestries Reported - Italian (%)
Ancestries Reported - Lithuanian (%)
Ancestries Reported - Norwegian (%)
Ancestries Reported - Polish (%)
Ancestries Reported - Portuguese (%)
Ancestries Reported - Russian (%)
Ancestries Reported - Scotch-Irish (%)
Ancestries Reported - Scottish (%)
Ancestries Reported - Slovak (%)
Ancestries Reported - Subsaharan African (%)
Ancestries Reported - Swedish (%)
Ancestries Reported - Swiss (%)
Ancestries Reported - Ukrainian (%)
Ancestries Reported - United States (%)
Ancestries Reported - Welsh (%)
Ancestries Reported - West Indian (%)
Ancestries Reported - Other (%)
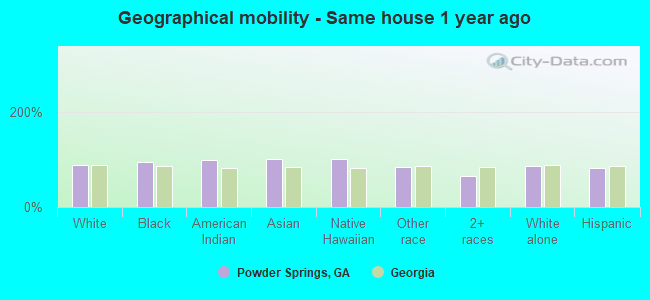
Geographical mobility - Same house 1 year ago (%)
Geographical mobility - Same house 1 year ago (%) - White
Geographical mobility - Same house 1 year ago (%) - Black or African American
Geographical mobility - Same house 1 year ago (%) - Asian
Geographical mobility - Same house 1 year ago (%) - Hispanic or Latino
Geographical mobility - Same house 1 year ago (%) - American Indian and Alaska Native
Geographical mobility - Same house 1 year ago (%) - Multirace
Geographical mobility - Same house 1 year ago (%) - Other Race
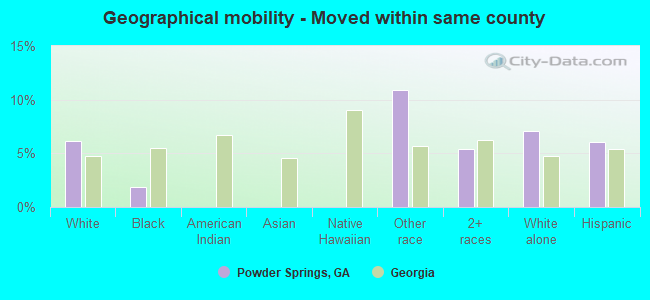
Geographical mobility - Moved within same county (%)
Geographical mobility - Moved within same county (%) - White
Geographical mobility - Moved within same county (%) - Black or African American
Geographical mobility - Moved within same county (%) - Asian
Geographical mobility - Moved within same county (%) - Hispanic or Latino
Geographical mobility - Moved within same county (%) - American Indian and Alaska Native
Geographical mobility - Moved within same county (%) - Multirace
Geographical mobility - Moved within same county (%) - Other Race
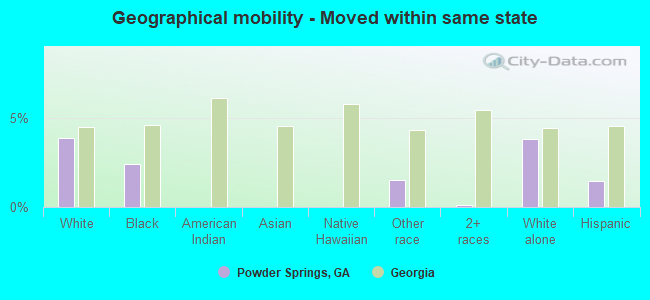
Geographical mobility - Moved from different county within same state (%)
Geographical mobility - Moved from different county within same state (%) - White
Geographical mobility - Moved from different county within same state (%) - Black or African American
Geographical mobility - Moved from different county within same state (%) - Asian
Geographical mobility - Moved from different county within same state (%) - Hispanic or Latino
Geographical mobility - Moved from different county within same state (%) - American Indian and Alaska Native
Geographical mobility - Moved from different county within same state (%) - Multirace
Geographical mobility - Moved from different county within same state (%) - Other Race
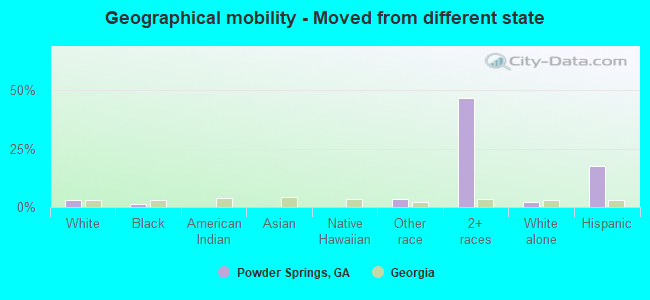
Geographical mobility - Moved from different state (%)
Geographical mobility - Moved from different state (%) - White
Geographical mobility - Moved from different state (%) - Black or African American
Geographical mobility - Moved from different state (%) - Asian
Geographical mobility - Moved from different state (%) - Hispanic or Latino
Geographical mobility - Moved from different state (%) - American Indian and Alaska Native
Geographical mobility - Moved from different state (%) - Multirace
Geographical mobility - Moved from different state (%) - Other Race
Geographical mobility - Moved from abroad (%)
Geographical mobility - Moved from abroad (%) - White
Geographical mobility - Moved from abroad (%) - Black or African American
Geographical mobility - Moved from abroad (%) - Asian
Geographical mobility - Moved from abroad (%) - Hispanic or Latino
Geographical mobility - Moved from abroad (%) - American Indian and Alaska Native
Geographical mobility - Moved from abroad (%) - Multirace
Geographical mobility - Moved from abroad (%) - Other Race
Place of birth for the foreign-born population - Ireland (%)
Place of birth for the foreign-born population - Denmark (%)
Place of birth for the foreign-born population - Norway (%)
Place of birth for the foreign-born population - Sweden (%)
Place of birth for the foreign-born population - United Kingdom (%)
Place of birth for the foreign-born population - England (%)
Place of birth for the foreign-born population - Scotland (%)
Place of birth for the foreign-born population - Other Northern Europe (%)
Place of birth for the foreign-born population - Austria (%)
Place of birth for the foreign-born population - Belgium (%)
Place of birth for the foreign-born population - France (%)
Place of birth for the foreign-born population - Germany (%)
Place of birth for the foreign-born population - Netherlands (%)
Place of birth for the foreign-born population - Switzerland (%)
Place of birth for the foreign-born population - Other Western Europe (%)
Place of birth for the foreign-born population - Greece (%)
Place of birth for the foreign-born population - Italy (%)
Place of birth for the foreign-born population - Portugal (%)
Place of birth for the foreign-born population - Spain (%)
Place of birth for the foreign-born population - Other Southern Europe (%)
Place of birth for the foreign-born population - Albania (%)
Place of birth for the foreign-born population - Belarus (%)
Place of birth for the foreign-born population - Bosnia and Herzegovina (%)
Place of birth for the foreign-born population - Bulgaria (%)
Place of birth for the foreign-born population - Croatia (%)
Place of birth for the foreign-born population - Czechoslovakia (%)
Place of birth for the foreign-born population - Hungary (%)
Place of birth for the foreign-born population - Latvia (%)
Place of birth for the foreign-born population - Lithuania (%)
Place of birth for the foreign-born population - North Macedonia (Macedonia) (%)
Place of birth for the foreign-born population - Moldova (%)
Place of birth for the foreign-born population - Poland (%)
Place of birth for the foreign-born population - Romania (%)
Place of birth for the foreign-born population - Russia (%)
Place of birth for the foreign-born population - Serbia (%)
Place of birth for the foreign-born population - Ukraine (%)
Place of birth for the foreign-born population - Other Eastern Europe (%)
Place of birth for the foreign-born population - China (%)
Place of birth for the foreign-born population - Hong Kong (%)
Place of birth for the foreign-born population - Taiwan (%)
Place of birth for the foreign-born population - Japan (%)
Place of birth for the foreign-born population - Korea (%)
Place of birth for the foreign-born population - Other Eastern Asia (%)
Place of birth for the foreign-born population - Afghanistan (%)
Place of birth for the foreign-born population - Bangladesh (%)
Place of birth for the foreign-born population - India (%)
Place of birth for the foreign-born population - Iran (%)
Place of birth for the foreign-born population - Kazakhstan (%)
Place of birth for the foreign-born population - Nepal (%)
Place of birth for the foreign-born population - Pakistan (%)
Place of birth for the foreign-born population - Sri Lanka (%)
Place of birth for the foreign-born population - Uzbekistan (%)
Place of birth for the foreign-born population - Other South Central Asia (%)
Place of birth for the foreign-born population - Burma (%)
Place of birth for the foreign-born population - Cambodia (%)
Place of birth for the foreign-born population - Indonesia (%)
Place of birth for the foreign-born population - Laos (%)
Place of birth for the foreign-born population - Malaysia (%)
Place of birth for the foreign-born population - Philippines (%)
Place of birth for the foreign-born population - Singapore (%)
Place of birth for the foreign-born population - Thailand (%)
Place of birth for the foreign-born population - Vietnam (%)
Place of birth for the foreign-born population - Other South Eastern Asia (%)
Place of birth for the foreign-born population - Armenia (%)
Place of birth for the foreign-born population - Iraq (%)
Place of birth for the foreign-born population - Israel (%)
Place of birth for the foreign-born population - Jordan (%)
Place of birth for the foreign-born population - Kuwait (%)
Place of birth for the foreign-born population - Lebanon (%)
Place of birth for the foreign-born population - Saudi Arabia (%)
Place of birth for the foreign-born population - Syria (%)
Place of birth for the foreign-born population - Turkey (%)
Place of birth for the foreign-born population - Yemen (%)
Place of birth for the foreign-born population - Other Western Asia (%)
Place of birth for the foreign-born population - Eritrea (%)
Place of birth for the foreign-born population - Ethiopia (%)
Place of birth for the foreign-born population - Kenya (%)
Place of birth for the foreign-born population - Somalia (%)
Place of birth for the foreign-born population - Uganda (%)
Place of birth for the foreign-born population - Zimbabwe (%)
Place of birth for the foreign-born population - Other Eastern Africa (%)
Place of birth for the foreign-born population - Cameroon (%)
Place of birth for the foreign-born population - Congo (%)
Place of birth for the foreign-born population - Democratic Republic of Congo (Zaire) (%)
Place of birth for the foreign-born population - Other Middle Africa (%)
Place of birth for the foreign-born population - Egypt (%)
Place of birth for the foreign-born population - Morocco (%)
Place of birth for the foreign-born population - Sudan (%)
Place of birth for the foreign-born population - Other Northern Africa (%)
Place of birth for the foreign-born population - South Africa (%)
Place of birth for the foreign-born population - Other Southern Africa (%)
Place of birth for the foreign-born population - Cabo Verde (%)
Place of birth for the foreign-born population - Ghana (%)
Place of birth for the foreign-born population - Liberia (%)
Place of birth for the foreign-born population - Nigeria (%)
Place of birth for the foreign-born population - Senegal (%)
Place of birth for the foreign-born population - Sierra Leone (%)
Place of birth for the foreign-born population - Other Western Africa (%)
Place of birth for the foreign-born population - Australia (%)
Place of birth for the foreign-born population - New Zealand (%)
Place of birth for the foreign-born population - Fiji (%)
Place of birth for the foreign-born population - Micronesia (%)
Place of birth for the foreign-born population - Bahamas (%)
Place of birth for the foreign-born population - Barbados (%)
Place of birth for the foreign-born population - Cuba (%)
Place of birth for the foreign-born population - Dominica (%)
Place of birth for the foreign-born population - Dominican Republic (%)
Place of birth for the foreign-born population - Grenada (%)
Place of birth for the foreign-born population - Haiti (%)
Place of birth for the foreign-born population - Jamaica (%)
Place of birth for the foreign-born population - St. Vincent and the Grenadines (%)
Place of birth for the foreign-born population - Trinidad and Tobago (%)
Place of birth for the foreign-born population - West Indies (%)
Place of birth for the foreign-born population - Other Caribbean (%)
Place of birth for the foreign-born population - Belize (%)
Place of birth for the foreign-born population - Costa Rica (%)
Place of birth for the foreign-born population - El Salvador (%)
Place of birth for the foreign-born population - Guatemala (%)
Place of birth for the foreign-born population - Honduras (%)
Place of birth for the foreign-born population - Mexico (%)
Place of birth for the foreign-born population - Nicaragua (%)
Place of birth for the foreign-born population - Panama (%)
Place of birth for the foreign-born population - Other Central America (%)
Place of birth for the foreign-born population - Argentina (%)
Place of birth for the foreign-born population - Bolivia (%)
Place of birth for the foreign-born population - Brazil (%)
Place of birth for the foreign-born population - Chile (%)
Place of birth for the foreign-born population - Colombia (%)
Place of birth for the foreign-born population - Ecuador (%)
Place of birth for the foreign-born population - Guyana (%)
Place of birth for the foreign-born population - Peru (%)
Place of birth for the foreign-born population - Uruguay (%)
Place of birth for the foreign-born population - Venezuela (%)
Place of birth for the foreign-born population - Other South America (%)
Place of birth for the foreign-born population - Canada (%)
Place of birth for the foreign-born population - Other Northern America (%)
Place of birth for the foreign-born population - Other (%)
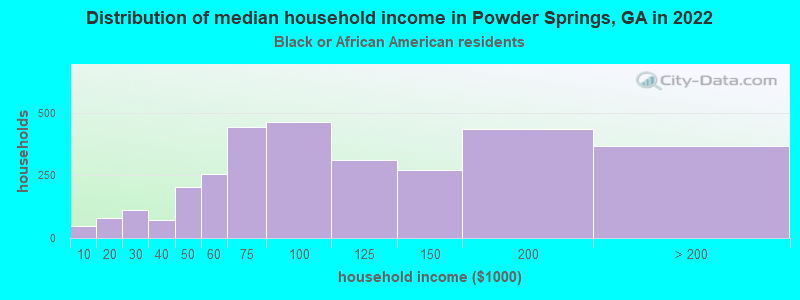
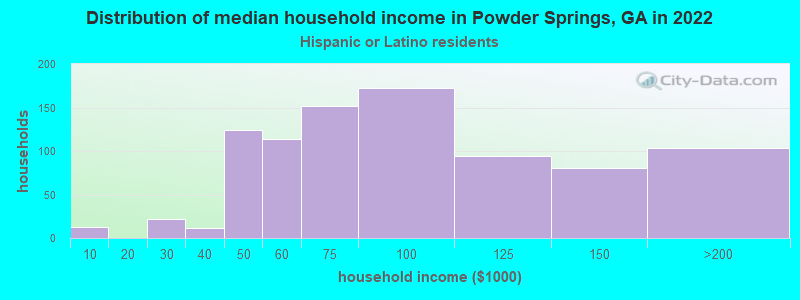
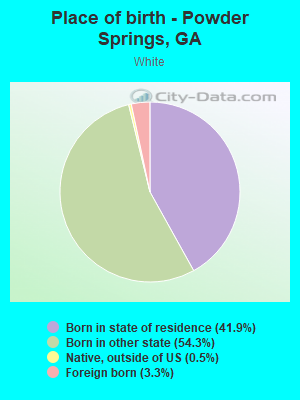
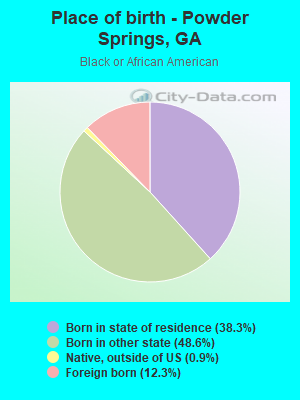
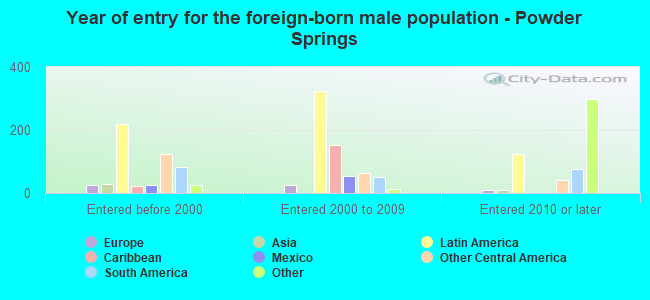
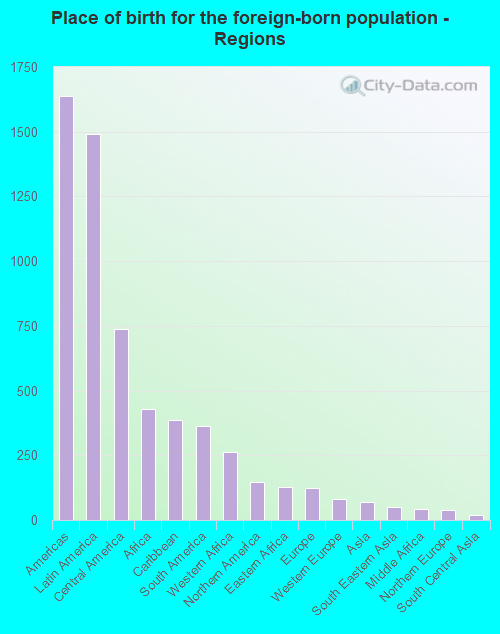
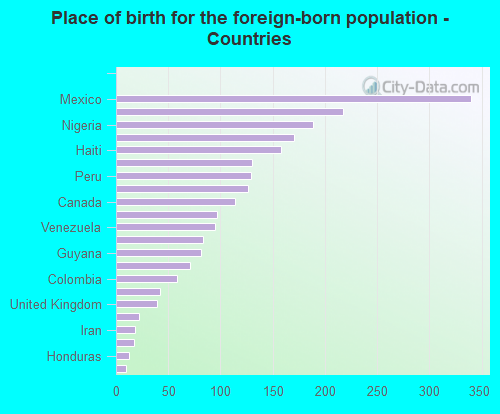
According to 2022 data, the most numerous races in Powder Springs, GA are White alone (4,445 residents), Black alone (8,548 residents), and Hispanic (3,349 residents). 80.0% of Powder Springs residents speak English at home. 13.3% of Powder Springs, GA residents are foreign-born (8.4% born in Latin America, 2.4% born in Africa), which is 24.6% greater than the foreign-born rate of 10.0% across the entire state of Georgia.
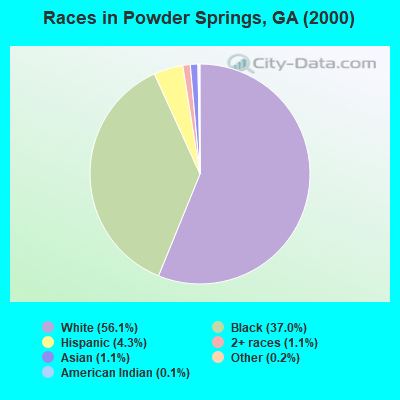
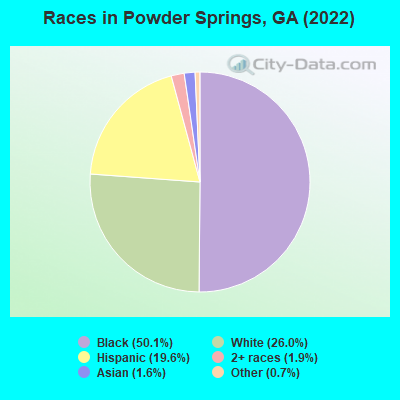
Race distribution in Powder Springs
2000 2022
5,128,661 62.6% White alone 2,331,465 28.5% Black alone 435,227 5.3% Hispanic 171,513 2.1% Asian alone 87,364 1.1% Two or more races 17,670 0.2% American Indian alone 11,275 0.1% Other race alone 3,278 0.04% Native Hawaiian and Other
5,415,657 49.6% White alone 3,349,240 30.7% Black alone 1,132,604 10.4% Hispanic 479,156 4.4% Asian alone 462,923 4.2% Two or more races 54,416 0.5% Other race alone 11,923 0.1% American Indian alone 6,957 0.06% Native Hawaiian and Other
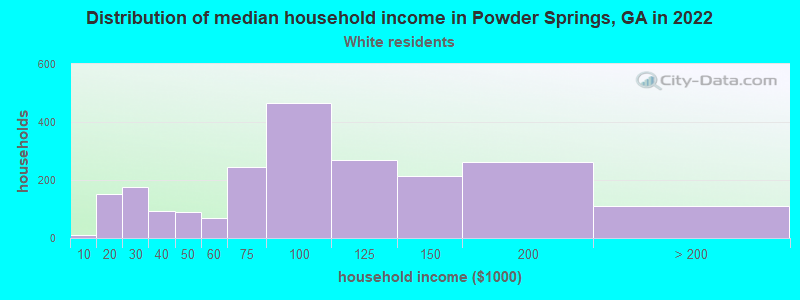
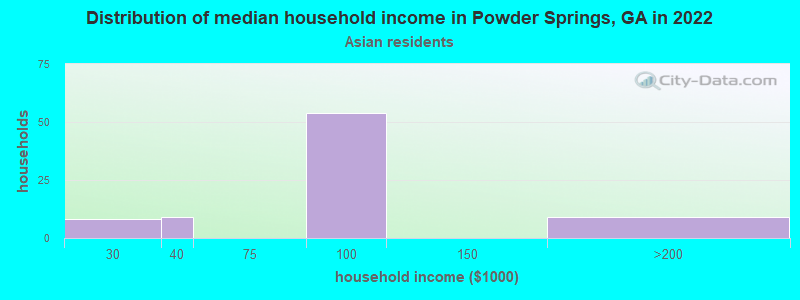
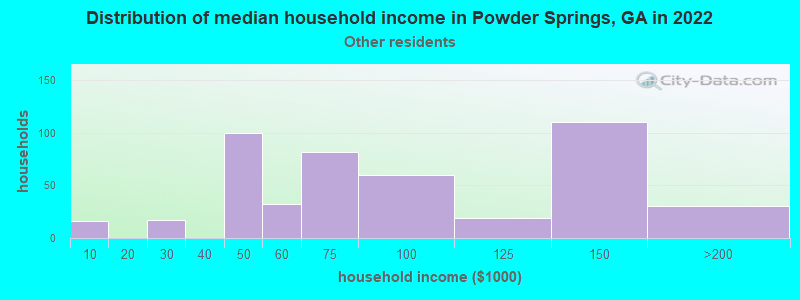
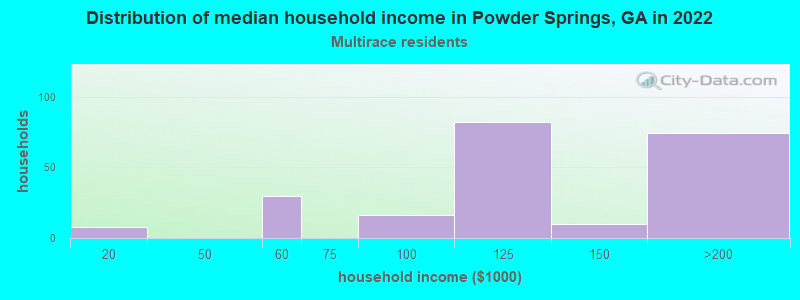
Income and house value in Powder Springs Median household income in 2022 $89,420 White non-Hispanic householders$87,854 Black householders$94,683 Asian householders$81,674 Some other race householders$112,185 Two or more races householders$76,416 Hispanic or Latino race householdersMedian 2022 house value $291,314 White Non-Hispanic householders$265,940 Black or African American householders $362,557 Asian householders$274,480 Native Hawaiian and other Pacific Islander householders$215,924 Some other race householders$274,480 Two or more races householders$247,398 Hispanic or Latino householders
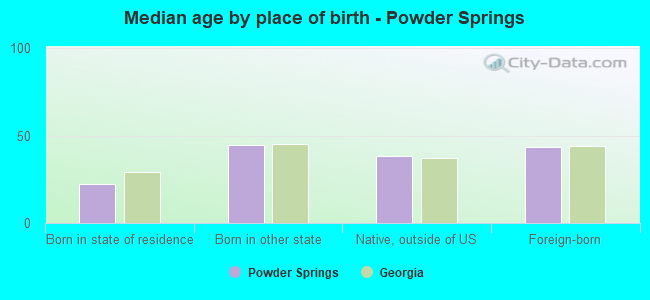
Median age by race in Powder Springs
52.1 Median age for White residents46.0 57.2 36.3 Median age for Black or African American residents38.6 35.6 22.1 Median age for American Indian / Alaska Native residents22.1 -675,716,439.7 17.7 Median age for Asian residents4.1 32.6 -657,243,815.6 Median age for Native Hawaiian / Pacific Islander residents-693,227,090.9 -776,776,776.0 31.8 Median age for Other race residents27.3 36.0 18.6 Median age for Two or more races residents9.9 32.1 55.0 Median age for White alone residents44.6 58.1 30.0 Median age for Hispanic or Latino residents28.8 30.2
Owner/renter occupied households by race in Powder Springs
House owners and renters - White residents 1,804 82.1% Owner occupied392 17.9% Renter occupiedHouse owners and renters - Black or African American residents 2,471 79.0% Owner occupied656 21.0% Renter occupiedHouse owners and renters - American Indian / Alaska Native residents 122 100.0% Owner occupiedHouse owners and renters - Asian residents 88 100.0% Owner occupiedHouse owners and renters - Other race residents 259 59.5% Owner occupied176 40.5% Renter occupiedHouse owners and renters - Two or more races residents 220 75.7% Owner occupied71 24.3% Renter occupiedHouse owners and renters - White alone residents 1,776 85.5% Owner occupied302 14.5% Renter occupiedHouse owners and renters - Hispanic or Latino residents 585 66.1% Owner occupied300 33.9% Renter occupied
Language usage in Powder Springs
English speakers - Total 80.0% of residents of Powder Springs speak English at home.
12.3% of residents speak Spanish at home 1,305 66.3% Speak English very well662 33.7% Speak English less than very well7.3% of residents speak other language at home 966 82.2% Speak English very well209 17.8% Speak English less than very well
English speakers - Born in the United States 92.7% of residents of Powder Springs speak English at home.
6.2% of residents speak Spanish at home 457 93.8% Speak English very well30 6.2% Speak English less than very well0.5% of residents speak other language at home 41 100.0% Speak English very well
English speakers - Native, born elsewhere 54.9% of residents of Powder Springs speak English at home.
44.1% of residents speak Spanish at home 39 43.3% Speak English very well51 56.7% Speak English less than very well
English speakers - Foreign-born 26.8% of residents of Powder Springs speak English at home.
38.2% of residents speak Spanish at home 336 38.0% Speak English very well549 62.0% Speak English less than very well34.4% of residents speak other language at home 591 74.2% Speak English very well206 25.8% Speak English less than very well
White (Caucasian) - Speak only English Native:
95.6% (4,460)Foreign-born:
13.8% (22)
White (Caucasian) - Speak another language Native:
3.9% (183)Foreign-born:
80.7% (131)
Black or African American - Speak only English Native:
96.9% (6,796)Foreign-born:
30.1% (325)
Black or African American - Speak another language Native:
3.0% (213)Foreign-born:
70.8% (765)
American Indian / Alaska Native - Speak another language Native:
55.6% (183)Foreign-born:
100.0% (205)
Asian - Speak another language Native:
56.4% (70)Foreign-born:
98.5% (46)
Other race - Speak only English Native:
26.3% (192)Foreign-born:
17.4% (134)
Other race - Speak another language Native:
72.2% (527)Foreign-born:
78.6% (606)
Two or more races - Speak only English Native:
66.0% (552)Foreign-born:
58.1% (138)
Two or more races - Speak another language Native:
35.3% (295)Foreign-born:
53.4% (127)
White alone - Speak only English Native:
97.6% (4,161)Foreign-born:
16.9% (24)
White alone - Speak another language Native:
2.4% (101)Foreign-born:
79.5% (113)
Hispanic or Latino - Speak only English Native:
47.0% (943)Foreign-born:
16.5% (180)
Hispanic or Latino - Speak another language Native:
53.0% (1,064)Foreign-born:
83.6% (913)
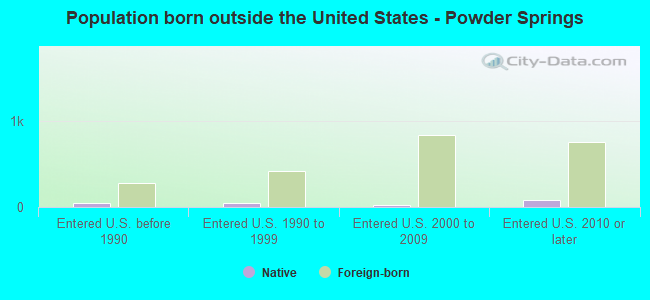
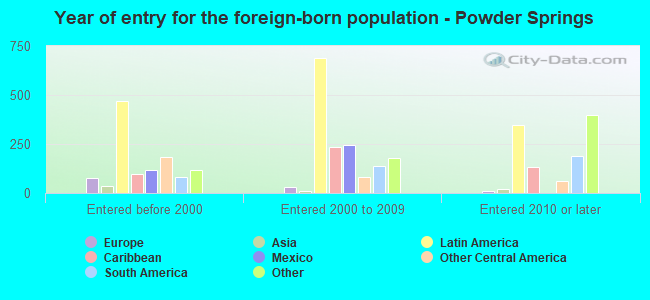
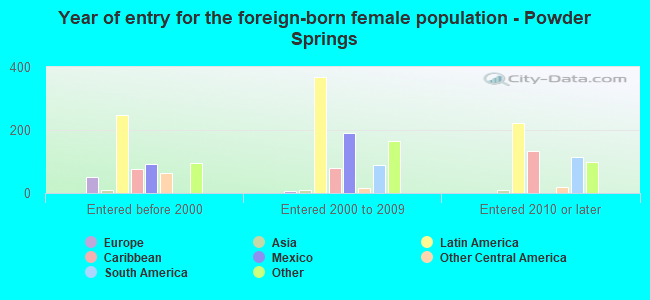
Foreign-born residents in Powder Springs 2,263 residents are foreign born (8.4% Latin America , 2.4% Africa ).
This city:
13.3%Georgia:
10.4%
Marital status for residents in Powder Springs Marital status - White (Caucasian) population 15 years and over
Males 27.5% Never married52.8% Now married1.0% Separated9.9% Widowed8.7% DivorcedFemales 16.9% Never married46.5% Now married0.8% Separated20.8% Widowed15.0% DivorcedWomen who gave birth in the past 12 months Now married:
100.0% (7)Unmarried:
0.0% (0)
Women who did not give birth in the past 12 months Now married:
48.9% (414)Unmarried:
51.1% (432)
Marital status - Black or African American population 15 years and over
Males 32.4% Never married56.0% Now married3.6% Separated1.5% Widowed6.5% DivorcedFemales 46.8% Never married37.4% Now married1.4% Separated3.1% Widowed11.2% DivorcedWomen who gave birth in the past 12 months Now married:
69.3% (85)Unmarried:
30.7% (38)
Women who did not give birth in the past 12 months Now married:
30.5% (778)Unmarried:
69.5% (1,777)
Marital status - American Indian / Alaska Native population 15 years and over
Males 58.5% Never married41.5% Now married0.0% Separated0.0% Widowed0.0% DivorcedFemales 49.5% Never married50.5% Now married0.0% Separated0.0% Widowed0.0% DivorcedWomen who did not give birth in the past 12 months Now married:
50.5% (73)Unmarried:
49.5% (71)
Marital status - Asian population 15 years and over
Males 10.8% Never married89.2% Now married0.0% Separated0.0% Widowed0.0% DivorcedFemales 36.8% Never married49.1% Now married0.0% Separated0.0% Widowed14.0% DivorcedWomen who did not give birth in the past 12 months Now married:
38.3% (18)Unmarried:
61.7% (28)
Marital status - Other race population 15 years and over
Males 38.6% Never married51.6% Now married9.8% Separated0.0% Widowed0.0% DivorcedFemales 33.9% Never married33.9% Now married3.6% Separated6.5% Widowed22.1% DivorcedWomen who did not give birth in the past 12 months Now married:
37.5% (258)Unmarried:
62.5% (431)
Marital status - Two or more races population 15 years and over
Males 23.7% Never married52.0% Now married0.0% Separated0.0% Widowed24.2% DivorcedFemales 37.6% Never married31.4% Now married0.0% Separated5.0% Widowed26.0% DivorcedWomen who did not give birth in the past 12 months Now married:
38.8% (95)Unmarried:
61.2% (150)
Marital status - White alone, not Hispanic / Latino population 15 years and over
Males 30.0% Never married55.3% Now married1.1% Separated5.3% Widowed8.3% DivorcedFemales 13.8% Never married46.1% Now married0.9% Separated23.1% Widowed16.1% DivorcedWomen who gave birth in the past 12 months Now married:
100.0% (7)Unmarried:
0.0% (0)
Women who did not give birth in the past 12 months Now married:
49.6% (342)Unmarried:
50.4% (347)
Marital status - Hispanic or Latino population 15 years and over
Males 32.5% Never married45.2% Now married4.1% Separated10.2% Widowed7.9% DivorcedFemales 34.5% Never married38.6% Now married2.4% Separated5.4% Widowed19.1% DivorcedWomen who did not give birth in the past 12 months Now married:
41.6% (418)Unmarried:
58.4% (587)
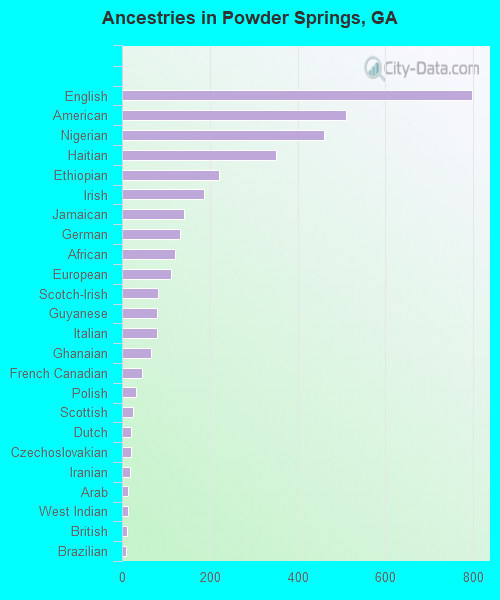
Ancestries in Powder Springs
796 8.0% English511 5.1% American459 4.6% Nigerian350 3.5% Haitian222 2.2% Ethiopian186 1.9% Irish142 1.4% Jamaican133 1.3% German121 1.2% African111 1.1% European82 0.8% Scotch-Irish80 0.8% Guyanese80 0.8% Italian67 0.7% Ghanaian46 0.5% French Canadian31 0.3% Polish26 0.3% Scottish21 0.2% Dutch20 0.2% Czechoslovakian18 0.2% Iranian14 0.1% Arab13 0.1% West Indian11 0.1% British10 0.1% Brazilian6 0.06% French5 0.05% Slavic
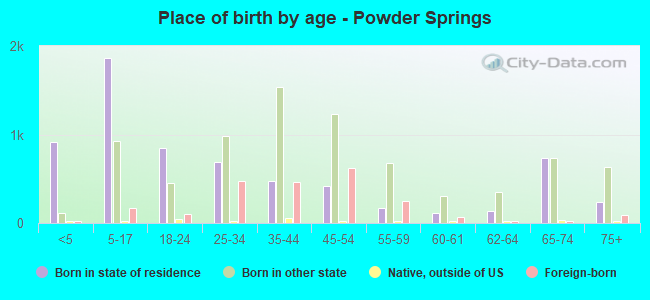
Children Nativity (place of birth) in Powder Springs
Children under 6 years - Living with two parents Both parents native 204 100.0% NativeBoth parents foreign-born 373 100.0% NativeOne native, one foreign-born parent 154 100.0% NativeChildren under 6 years - Living with one parent Native parent 269 100.0% NativeChildren 6 to 17 years - Living with two parents Both parents native 1,088 100.0% NativeBoth parents foreign-born 137 75.9% Native44 24.1% Foreign-bornOne native, one foreign-born parent 456 100.0% NativeChildren 6 to 17 years - Living with one parent Native parent 640 100.0% NativeForeign-born parent 230 54.7% Native191 45.3% Foreign-born
Grandparents responsible for own grandchildren in Powder Springs
Grandparents (30 to 59 years) White / Caucasian 78 100.0% Responsible for grandchildrenBlack or African American 42 27.6% Responsible for grandchildren109 72.4% Not responsible for grandchildrenAsian 5 100.0% Not responsible for grandchildrenTwo or more races 9 100.0% Responsible for grandchildrenWhite alone, not Hispanic / Latino 52 100.0% Responsible for grandchildrenGrandparents (60 years and over) White / Caucasian 65 34.6% Responsible for grandchildren123 65.4% Not responsible for grandchildrenBlack or African American 16 63.8% Responsible for grandchildren9 36.2% Not responsible for grandchildrenAsian 10 100.0% Not responsible for grandchildrenTwo or more races 85 100.0% Not responsible for grandchildrenWhite alone, not Hispanic / Latino 66 77.2% Responsible for grandchildren19 22.8% Not responsible for grandchildren