Races in Oregon City, Oregon (OR) Detailed Stats
Data:
Races - White alone (%)
Races - White alone (% change since 2000)
Races - Black alone (%)
Races - Black alone (% change since 2000)
Races - American Indian alone (%)
Races - American Indian alone (% change since 2000)
Races - Asian alone (%)
Races - Asian alone (% change since 2000)
Races - Hispanic (%)
Races - Hispanic (% change since 2000)
Races - Native Hawaiian and Other Pacific Islander alone (%)
Races - Native Hawaiian and Other Pacific Islander alone (% change since 2000)
Races - Two or more races(%)
Races - Two or more races(% change since 2000)
Races - Other race alone (%)
Races - Other race alone (% change since 2000)
Racial diversity
Place of birth - Born in state of residence (%)
Place of birth - Born in state of residence (%) - White
Place of birth - Born in state of residence (%) - Black or African American
Place of birth - Born in state of residence (%) - Asian
Place of birth - Born in state of residence (%) - Hispanic or Latino
Place of birth - Born in state of residence (%) - American Indian and Alaska Native
Place of birth - Born in state of residence (%) - Multirace
Place of birth - Born in state of residence (%) - Other Race
Place of birth - Born in other state (%)
Place of birth - Born in other state (%) - White
Place of birth - Born in other state (%) - Black or African American
Place of birth - Born in other state (%) - Asian
Place of birth - Born in other state (%) - Hispanic or Latino
Place of birth - Born in other state (%) - American Indian and Alaska Native
Place of birth - Born in other state (%) - Multirace
Place of birth - Born in other state (%) - Other Race
Place of birth - Native, outside of US (%)
Place of birth - Native, outside of US (%) - White
Place of birth - Native, outside of US (%) - Black or African American
Place of birth - Native, outside of US (%) - Asian
Place of birth - Native, outside of US (%) - Hispanic or Latino
Place of birth - Native, outside of US (%) - American Indian and Alaska Native
Place of birth - Native, outside of US (%) - Multirace
Place of birth - Native, outside of US (%) - Other Race
Place of birth - Foreign born (%)
Place of birth - Foreign born (%) - White
Place of birth - Foreign born (%) - Black or African American
Place of birth - Foreign born (%) - Asian
Place of birth - Foreign born (%) - Hispanic or Latino
Place of birth - Foreign born (%) - American Indian and Alaska Native
Place of birth - Foreign born (%) - Multirace
Place of birth - Foreign born (%) - Other Race
Residents speaking English at home (%)
Residents speaking English at home - Born in the United States (%)
Residents speaking English at home - Native, born elsewhere (%)
Residents speaking English at home - Foreign born (%)
Residents speaking Spanish at home (%)
Residents speaking Spanish at home - Born in the United States (%)
Residents speaking Spanish at home - Native, born elsewhere (%)
Residents speaking Spanish at home - Foreign born (%)
Residents speaking other language at home (%)
Residents speaking other language at home - Born in the United States (%)
Residents speaking other language at home - Native, born elsewhere (%)
Residents speaking other language at home - Foreign born (%)
Marital status - Never married (%)
Marital status - Now married (%)
Marital status - Separated (%)
Marital status - Widowed (%)
Marital status - Divorced (%)
Ancestries Reported - Arab (%)
Ancestries Reported - Czech (%)
Ancestries Reported - Danish (%)
Ancestries Reported - Dutch (%)
Ancestries Reported - English (%)
Ancestries Reported - French (%)
Ancestries Reported - French Canadian (%)
Ancestries Reported - German (%)
Ancestries Reported - Greek (%)
Ancestries Reported - Hungarian (%)
Ancestries Reported - Irish (%)
Ancestries Reported - Italian (%)
Ancestries Reported - Lithuanian (%)
Ancestries Reported - Norwegian (%)
Ancestries Reported - Polish (%)
Ancestries Reported - Portuguese (%)
Ancestries Reported - Russian (%)
Ancestries Reported - Scotch-Irish (%)
Ancestries Reported - Scottish (%)
Ancestries Reported - Slovak (%)
Ancestries Reported - Subsaharan African (%)
Ancestries Reported - Swedish (%)
Ancestries Reported - Swiss (%)
Ancestries Reported - Ukrainian (%)
Ancestries Reported - United States (%)
Ancestries Reported - Welsh (%)
Ancestries Reported - West Indian (%)
Ancestries Reported - Other (%)
Geographical mobility - Same house 1 year ago (%)
Geographical mobility - Same house 1 year ago (%) - White
Geographical mobility - Same house 1 year ago (%) - Black or African American
Geographical mobility - Same house 1 year ago (%) - Asian
Geographical mobility - Same house 1 year ago (%) - Hispanic or Latino
Geographical mobility - Same house 1 year ago (%) - American Indian and Alaska Native
Geographical mobility - Same house 1 year ago (%) - Multirace
Geographical mobility - Same house 1 year ago (%) - Other Race
Geographical mobility - Moved within same county (%)
Geographical mobility - Moved within same county (%) - White
Geographical mobility - Moved within same county (%) - Black or African American
Geographical mobility - Moved within same county (%) - Asian
Geographical mobility - Moved within same county (%) - Hispanic or Latino
Geographical mobility - Moved within same county (%) - American Indian and Alaska Native
Geographical mobility - Moved within same county (%) - Multirace
Geographical mobility - Moved within same county (%) - Other Race
Geographical mobility - Moved from different county within same state (%)
Geographical mobility - Moved from different county within same state (%) - White
Geographical mobility - Moved from different county within same state (%) - Black or African American
Geographical mobility - Moved from different county within same state (%) - Asian
Geographical mobility - Moved from different county within same state (%) - Hispanic or Latino
Geographical mobility - Moved from different county within same state (%) - American Indian and Alaska Native
Geographical mobility - Moved from different county within same state (%) - Multirace
Geographical mobility - Moved from different county within same state (%) - Other Race
Geographical mobility - Moved from different state (%)
Geographical mobility - Moved from different state (%) - White
Geographical mobility - Moved from different state (%) - Black or African American
Geographical mobility - Moved from different state (%) - Asian
Geographical mobility - Moved from different state (%) - Hispanic or Latino
Geographical mobility - Moved from different state (%) - American Indian and Alaska Native
Geographical mobility - Moved from different state (%) - Multirace
Geographical mobility - Moved from different state (%) - Other Race
Geographical mobility - Moved from abroad (%)
Geographical mobility - Moved from abroad (%) - White
Geographical mobility - Moved from abroad (%) - Black or African American
Geographical mobility - Moved from abroad (%) - Asian
Geographical mobility - Moved from abroad (%) - Hispanic or Latino
Geographical mobility - Moved from abroad (%) - American Indian and Alaska Native
Geographical mobility - Moved from abroad (%) - Multirace
Geographical mobility - Moved from abroad (%) - Other Race
Place of birth for the foreign-born population - Ireland (%)
Place of birth for the foreign-born population - Denmark (%)
Place of birth for the foreign-born population - Norway (%)
Place of birth for the foreign-born population - Sweden (%)
Place of birth for the foreign-born population - United Kingdom (%)
Place of birth for the foreign-born population - England (%)
Place of birth for the foreign-born population - Scotland (%)
Place of birth for the foreign-born population - Other Northern Europe (%)
Place of birth for the foreign-born population - Austria (%)
Place of birth for the foreign-born population - Belgium (%)
Place of birth for the foreign-born population - France (%)
Place of birth for the foreign-born population - Germany (%)
Place of birth for the foreign-born population - Netherlands (%)
Place of birth for the foreign-born population - Switzerland (%)
Place of birth for the foreign-born population - Other Western Europe (%)
Place of birth for the foreign-born population - Greece (%)
Place of birth for the foreign-born population - Italy (%)
Place of birth for the foreign-born population - Portugal (%)
Place of birth for the foreign-born population - Spain (%)
Place of birth for the foreign-born population - Other Southern Europe (%)
Place of birth for the foreign-born population - Albania (%)
Place of birth for the foreign-born population - Belarus (%)
Place of birth for the foreign-born population - Bosnia and Herzegovina (%)
Place of birth for the foreign-born population - Bulgaria (%)
Place of birth for the foreign-born population - Croatia (%)
Place of birth for the foreign-born population - Czechoslovakia (%)
Place of birth for the foreign-born population - Hungary (%)
Place of birth for the foreign-born population - Latvia (%)
Place of birth for the foreign-born population - Lithuania (%)
Place of birth for the foreign-born population - North Macedonia (Macedonia) (%)
Place of birth for the foreign-born population - Moldova (%)
Place of birth for the foreign-born population - Poland (%)
Place of birth for the foreign-born population - Romania (%)
Place of birth for the foreign-born population - Russia (%)
Place of birth for the foreign-born population - Serbia (%)
Place of birth for the foreign-born population - Ukraine (%)
Place of birth for the foreign-born population - Other Eastern Europe (%)
Place of birth for the foreign-born population - China (%)
Place of birth for the foreign-born population - Hong Kong (%)
Place of birth for the foreign-born population - Taiwan (%)
Place of birth for the foreign-born population - Japan (%)
Place of birth for the foreign-born population - Korea (%)
Place of birth for the foreign-born population - Other Eastern Asia (%)
Place of birth for the foreign-born population - Afghanistan (%)
Place of birth for the foreign-born population - Bangladesh (%)
Place of birth for the foreign-born population - India (%)
Place of birth for the foreign-born population - Iran (%)
Place of birth for the foreign-born population - Kazakhstan (%)
Place of birth for the foreign-born population - Nepal (%)
Place of birth for the foreign-born population - Pakistan (%)
Place of birth for the foreign-born population - Sri Lanka (%)
Place of birth for the foreign-born population - Uzbekistan (%)
Place of birth for the foreign-born population - Other South Central Asia (%)
Place of birth for the foreign-born population - Burma (%)
Place of birth for the foreign-born population - Cambodia (%)
Place of birth for the foreign-born population - Indonesia (%)
Place of birth for the foreign-born population - Laos (%)
Place of birth for the foreign-born population - Malaysia (%)
Place of birth for the foreign-born population - Philippines (%)
Place of birth for the foreign-born population - Singapore (%)
Place of birth for the foreign-born population - Thailand (%)
Place of birth for the foreign-born population - Vietnam (%)
Place of birth for the foreign-born population - Other South Eastern Asia (%)
Place of birth for the foreign-born population - Armenia (%)
Place of birth for the foreign-born population - Iraq (%)
Place of birth for the foreign-born population - Israel (%)
Place of birth for the foreign-born population - Jordan (%)
Place of birth for the foreign-born population - Kuwait (%)
Place of birth for the foreign-born population - Lebanon (%)
Place of birth for the foreign-born population - Saudi Arabia (%)
Place of birth for the foreign-born population - Syria (%)
Place of birth for the foreign-born population - Turkey (%)
Place of birth for the foreign-born population - Yemen (%)
Place of birth for the foreign-born population - Other Western Asia (%)
Place of birth for the foreign-born population - Eritrea (%)
Place of birth for the foreign-born population - Ethiopia (%)
Place of birth for the foreign-born population - Kenya (%)
Place of birth for the foreign-born population - Somalia (%)
Place of birth for the foreign-born population - Uganda (%)
Place of birth for the foreign-born population - Zimbabwe (%)
Place of birth for the foreign-born population - Other Eastern Africa (%)
Place of birth for the foreign-born population - Cameroon (%)
Place of birth for the foreign-born population - Congo (%)
Place of birth for the foreign-born population - Democratic Republic of Congo (Zaire) (%)
Place of birth for the foreign-born population - Other Middle Africa (%)
Place of birth for the foreign-born population - Egypt (%)
Place of birth for the foreign-born population - Morocco (%)
Place of birth for the foreign-born population - Sudan (%)
Place of birth for the foreign-born population - Other Northern Africa (%)
Place of birth for the foreign-born population - South Africa (%)
Place of birth for the foreign-born population - Other Southern Africa (%)
Place of birth for the foreign-born population - Cabo Verde (%)
Place of birth for the foreign-born population - Ghana (%)
Place of birth for the foreign-born population - Liberia (%)
Place of birth for the foreign-born population - Nigeria (%)
Place of birth for the foreign-born population - Senegal (%)
Place of birth for the foreign-born population - Sierra Leone (%)
Place of birth for the foreign-born population - Other Western Africa (%)
Place of birth for the foreign-born population - Australia (%)
Place of birth for the foreign-born population - New Zealand (%)
Place of birth for the foreign-born population - Fiji (%)
Place of birth for the foreign-born population - Micronesia (%)
Place of birth for the foreign-born population - Bahamas (%)
Place of birth for the foreign-born population - Barbados (%)
Place of birth for the foreign-born population - Cuba (%)
Place of birth for the foreign-born population - Dominica (%)
Place of birth for the foreign-born population - Dominican Republic (%)
Place of birth for the foreign-born population - Grenada (%)
Place of birth for the foreign-born population - Haiti (%)
Place of birth for the foreign-born population - Jamaica (%)
Place of birth for the foreign-born population - St. Vincent and the Grenadines (%)
Place of birth for the foreign-born population - Trinidad and Tobago (%)
Place of birth for the foreign-born population - West Indies (%)
Place of birth for the foreign-born population - Other Caribbean (%)
Place of birth for the foreign-born population - Belize (%)
Place of birth for the foreign-born population - Costa Rica (%)
Place of birth for the foreign-born population - El Salvador (%)
Place of birth for the foreign-born population - Guatemala (%)
Place of birth for the foreign-born population - Honduras (%)
Place of birth for the foreign-born population - Mexico (%)
Place of birth for the foreign-born population - Nicaragua (%)
Place of birth for the foreign-born population - Panama (%)
Place of birth for the foreign-born population - Other Central America (%)
Place of birth for the foreign-born population - Argentina (%)
Place of birth for the foreign-born population - Bolivia (%)
Place of birth for the foreign-born population - Brazil (%)
Place of birth for the foreign-born population - Chile (%)
Place of birth for the foreign-born population - Colombia (%)
Place of birth for the foreign-born population - Ecuador (%)
Place of birth for the foreign-born population - Guyana (%)
Place of birth for the foreign-born population - Peru (%)
Place of birth for the foreign-born population - Uruguay (%)
Place of birth for the foreign-born population - Venezuela (%)
Place of birth for the foreign-born population - Other South America (%)
Place of birth for the foreign-born population - Canada (%)
Place of birth for the foreign-born population - Other Northern America (%)
Place of birth for the foreign-born population - Other (%)
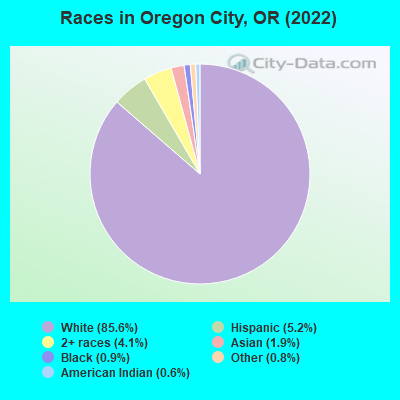
According to 2022 data, the most numerous races in Oregon City, OR are White alone (32,211 residents), Hispanic (1,952 residents), and Two or more races (1,542 residents). 92.8% of Oregon City residents speak English at home. 5.3% of Oregon City, OR residents are foreign-born (2.9% born in Europe, 1.1% born in Asia, 0.8% born in Latin America), which is 71.3% less than the foreign-born rate of 9.0% across the entire state of Oregon.
Race distribution in Oregon City
2000 2022
2,857,616 83.5% White alone 275,314 8.0% Hispanic 100,333 2.9% Asian alone 82,733 2.4% Two or more races 53,325 1.6% Black alone 40,130 1.2% American Indian alone 7,398 0.2% Native Hawaiian and Other 4,550 0.1% Other race alone
3,037,571 71.6% White alone 609,538 14.4% Hispanic 252,744 6.0% Two or more races 191,283 4.5% Asian alone 78,228 1.8% Black alone 29,399 0.7% American Indian alone 25,731 0.6% Other race alone 15,643 0.4% Native Hawaiian and Other
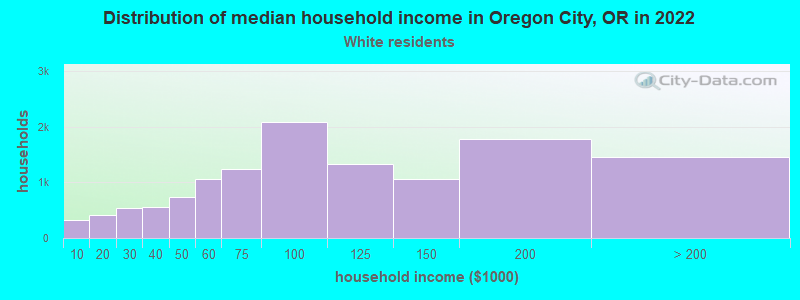
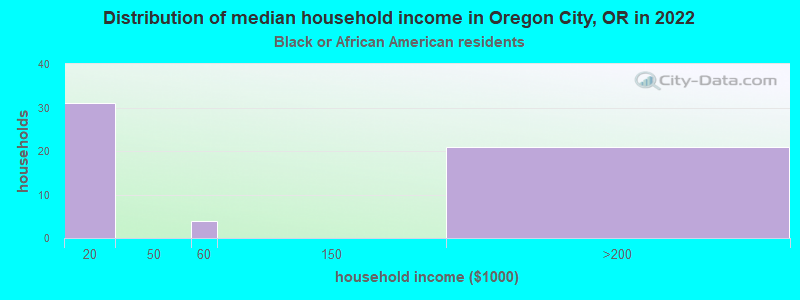
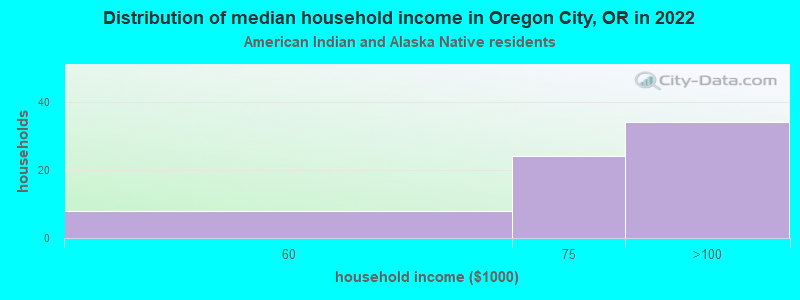
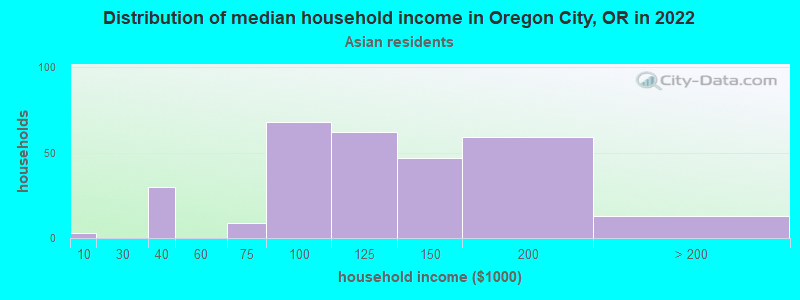
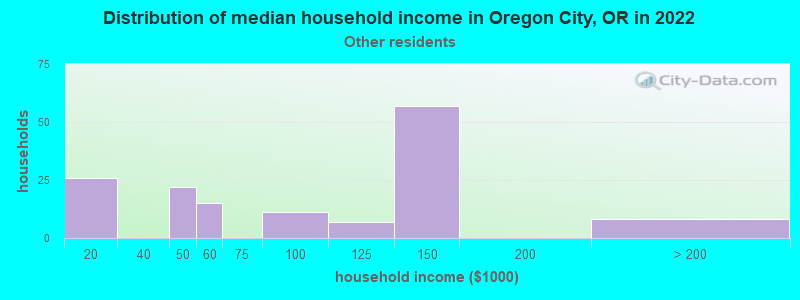
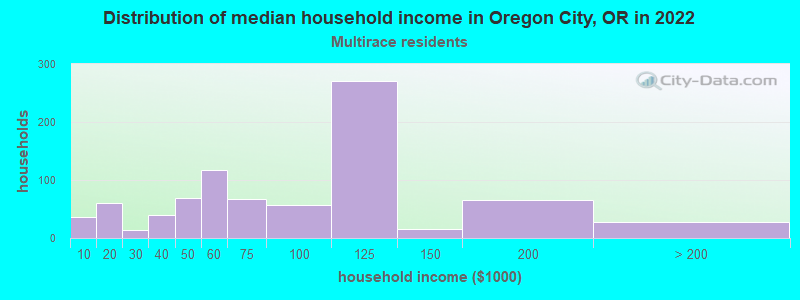
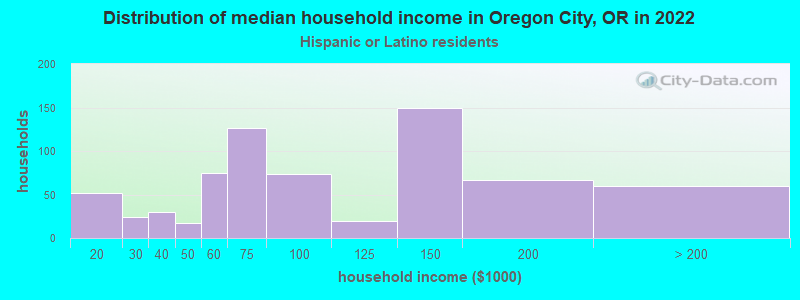
Income and house value in Oregon City Median household income in 2022 $91,039 White non-Hispanic householders$88,829 American Indian and Alaska Native householders$103,160 Asian householders$77,981 Two or more races householders$96,816 Hispanic or Latino race householdersMedian 2022 house value $554,145 White Non-Hispanic householders$407,677 Black or African American householders$500,148 American Indian or Alaska Native householders $554,482 Asian householders$548,407 Native Hawaiian and other Pacific Islander householders$590,593 Some other race householders$619,954 Two or more races householders$571,694 Hispanic or Latino householders
Median age by race in Oregon City
38.4 Median age for White residents38.0 39.0 35.0 Median age for Black or African American residents54.1 14.8 33.2 Median age for American Indian / Alaska Native residents16.7 59.9 37.3 Median age for Asian residents33.6 45.8 -764,705,881.6 Median age for Native Hawaiian / Pacific Islander residents-764,119,600.6 -774,891,774.1 41.8 Median age for Other race residents50.6 35.9 33.2 Median age for Two or more races residents32.1 36.3 38.8 Median age for White alone residents38.0 39.5 34.2 Median age for Hispanic or Latino residents35.2 34.0
Owner/renter occupied households by race in Oregon City
House owners and renters - White residents 8,216 65.6% Owner occupied4,307 34.4% Renter occupiedHouse owners and renters - Black or African American residents 21 25.3% Owner occupied61 74.7% Renter occupiedHouse owners and renters - American Indian / Alaska Native residents 52 48.2% Owner occupied56 51.8% Renter occupiedHouse owners and renters - Asian residents 232 78.8% Owner occupied62 21.2% Renter occupiedHouse owners and renters - Other race residents 61 40.5% Owner occupied90 59.5% Renter occupiedHouse owners and renters - Two or more races residents 547 75.2% Owner occupied180 24.8% Renter occupiedHouse owners and renters - White alone residents 8,093 65.8% Owner occupied4,211 34.2% Renter occupiedHouse owners and renters - Hispanic or Latino residents 367 60.7% Owner occupied238 39.3% Renter occupied
Language usage in Oregon City
English speakers - Total 92.8% of residents of Oregon City speak English at home.
1.8% of residents speak Spanish at home 374 58.4% Speak English very well266 41.6% Speak English less than very well5.9% of residents speak other language at home 1,765 84.2% Speak English very well330 15.8% Speak English less than very well
English speakers - Born in the United States 95.5% of residents of Oregon City speak English at home.
1.7% of residents speak Spanish at home 183 82.1% Speak English very well40 17.9% Speak English less than very well2.6% of residents speak other language at home 314 94.0% Speak English very well20 6.0% Speak English less than very well
English speakers - Native, born elsewhere 80.3% of residents of Oregon City speak English at home.
5.7% of residents speak Spanish at home 15 100.0% Speak English very well9.5% of residents speak other language at home 25 100.0% Speak English very well
English speakers - Foreign-born 34.5% of residents of Oregon City speak English at home.
10.9% of residents speak Spanish at home 21 10.6% Speak English very well177 89.4% Speak English less than very well54.3% of residents speak other language at home 677 68.5% Speak English very well312 31.5% Speak English less than very well
White (Caucasian) - Speak only English Native:
97.1% (29,094)Foreign-born:
45.0% (476)
White (Caucasian) - Speak another language Native:
2.9% (875)Foreign-born:
54.9% (580)
Black or African American - Speak only English Native:
99.5% (187)Foreign-born:
45.0% (17)
American Indian / Alaska Native - Speak only English Native:
100.0% (174)Foreign-born:
86.0% (18)
Asian - Speak only English Native:
69.7% (312)Foreign-born:
13.3% (47)
Asian - Speak another language Native:
29.6% (132)Foreign-born:
87.2% (310)
Other race - Speak only English Native:
82.2% (321)Foreign-born:
21.6% (13)
Other race - Speak another language Native:
22.0% (86)Foreign-born:
79.1% (48)
Two or more races - Speak another language Native:
15.5% (339)Foreign-born:
87.1% (43)
White alone - Speak only English Native:
96.9% (28,469)Foreign-born:
38.6% (443)
White alone - Speak another language Native:
3.1% (896)Foreign-born:
60.8% (697)
Hispanic or Latino - Speak only English Native:
81.7% (1,255)Foreign-born:
44.8% (123)
Hispanic or Latino - Speak another language Native:
21.5% (330)Foreign-born:
65.3% (178)
Foreign-born residents in Oregon City 1,977 residents are foreign born (2.9% Europe , 1.1% Asia , 0.8% Latin America ).
This city:
5.3%Oregon:
9.8%
Marital status for residents in Oregon City Marital status - White (Caucasian) population 15 years and over
Males 36.7% Never married49.9% Now married0.9% Separated2.8% Widowed9.8% DivorcedFemales 24.6% Never married52.4% Now married0.7% Separated8.9% Widowed13.3% DivorcedWomen who gave birth in the past 12 months Now married:
82.8% (485)Unmarried:
17.2% (101)
Women who did not give birth in the past 12 months Now married:
48.3% (3,288)Unmarried:
51.7% (3,515)
Marital status - Black or African American population 15 years and over
Males 44.2% Never married29.5% Now married16.8% Separated0.0% Widowed9.5% DivorcedFemales 84.5% Never married0.0% Now married15.5% Separated0.0% Widowed0.0% DivorcedWomen who did not give birth in the past 12 months Now married:
0.0% (0)Unmarried:
100.0% (74)
Marital status - American Indian / Alaska Native population 15 years and over
Males 100.0% Never married0.0% Now married0.0% Separated0.0% Widowed0.0% DivorcedFemales 0.0% Never married0.0% Now married0.0% Separated0.0% Widowed100.0% DivorcedWomen who did not give birth in the past 12 months Now married:
0.0% (0)Unmarried:
100.0% (17)
Marital status - Asian population 15 years and over
Males 47.2% Never married52.8% Now married0.0% Separated0.0% Widowed0.0% DivorcedFemales 33.3% Never married51.2% Now married0.0% Separated2.7% Widowed12.9% DivorcedWomen who did not give birth in the past 12 months Now married:
32.3% (75)Unmarried:
67.7% (157)
Marital status - Other race population 15 years and over
Males 43.1% Never married43.5% Now married0.0% Separated0.0% Widowed13.4% DivorcedFemales 44.3% Never married33.6% Now married15.0% Separated7.1% Widowed0.0% DivorcedWomen who did not give birth in the past 12 months Now married:
32.6% (41)Unmarried:
67.4% (85)
Marital status - Two or more races population 15 years and over
Males 52.0% Never married39.9% Now married0.0% Separated0.0% Widowed8.1% DivorcedFemales 42.6% Never married39.0% Now married0.0% Separated2.8% Widowed15.6% DivorcedWomen who gave birth in the past 12 months Now married:
0.0% (0)Unmarried:
100.0% (28)
Women who did not give birth in the past 12 months Now married:
43.6% (323)Unmarried:
56.4% (418)
Marital status - White alone, not Hispanic / Latino population 15 years and over
Males 36.9% Never married50.1% Now married0.9% Separated2.9% Widowed9.3% DivorcedFemales 24.2% Never married52.3% Now married0.8% Separated9.1% Widowed13.5% DivorcedWomen who gave birth in the past 12 months Now married:
82.1% (467)Unmarried:
17.9% (102)
Women who did not give birth in the past 12 months Now married:
48.3% (3,208)Unmarried:
51.7% (3,437)
Marital status - Hispanic or Latino population 15 years and over
Males 35.5% Never married46.8% Now married0.0% Separated0.0% Widowed17.7% DivorcedFemales 28.9% Never married58.9% Now married0.0% Separated5.9% Widowed6.3% DivorcedWomen who gave birth in the past 12 months Now married:
100.0% (27)Unmarried:
0.0% (0)
Women who did not give birth in the past 12 months Now married:
62.4% (305)Unmarried:
37.6% (184)
Ancestries in Oregon City
2,948 17.6% German1,823 10.9% English1,748 10.4% American1,092 6.5% Ukrainian1,049 6.3% European851 5.1% Irish573 3.4% Norwegian304 1.8% Romanian301 1.8% Scottish245 1.5% Swedish226 1.3% Italian211 1.3% Scandinavian189 1.1% Nigerian180 1.1% Polish175 1.0% German Russian163 1.0% French143 0.9% Scotch-Irish122 0.7% Hungarian111 0.7% Eastern European90 0.5% Dutch83 0.5% Portuguese83 0.5% Northern European78 0.5% Greek71 0.4% British66 0.4% Finnish42 0.3% Lithuanian37 0.2% Canadian28 0.2% Swiss26 0.2% Welsh22 0.1% Iranian21 0.1% Lebanese21 0.1% Czechoslovakian20 0.1% French Canadian16 0.10% Belgian16 0.10% Bahamian15 0.09% Bulgarian15 0.09% Maltese11 0.07% Austrian11 0.07% Czech11 0.07% Somali10 0.06% Danish10 0.06% Russian6 0.04% Croatian4 0.02% African1 0.01% New Zealander
Geographical mobility in Oregon City Same house 1 year ago 28,154 86.5% White (Caucasian)209 94.4% Black or African American178 89.7% American Indian / Alaska Native697 89.4% Asian433 90.6% Other race2,288 92.4% Two or more races27,569 86.2% White alone, not Hispanic / Latino1,820 94.2% Hispanic or LatinoMoved within same county 1,732 5.3% White / Caucasian36 4.6% Asian6 82.0% Native Hawaiian / Pacific Islander29 6.1% Other race55 2.2% Two or more races1,682 5.3% White alone, not Hispanic / Latino76 4.0% Hispanic or LatinoMoved within same state 1,712 5.3% White / Caucasian7 2.9% Black or African American14 7.3% American Indian / Alaska Native20 2.6% Asian17 3.5% Other race66 2.7% Two or more races1,779 5.6% White alone, not Hispanic / Latino31 1.6% Hispanic or LatinoMoved from different state 617 1.9% White / Caucasian15 6.9% Black or African American31 4.0% Asian64 2.6% Two or more races613 1.9% White alone, not Hispanic / Latino23 1.2% Hispanic or LatinoMoved from abroad 64 0.2% White19 9.4% American Indian / Alaska Native4 0.1% Two or more races26 0.1% White alone, not Hispanic / Latino18 0.9% Hispanic or Latino
Children Nativity (place of birth) in Oregon City
Children under 6 years - Living with two parents Both parents native 1,779 100.0% NativeBoth parents foreign-born 225 100.0% NativeOne native, one foreign-born parent 104 100.0% NativeChildren under 6 years - Living with one parent Native parent 478 100.0% NativeForeign-born parent 25 100.0% NativeChildren 6 to 17 years - Living with two parents Both parents native 3,546 100.0% NativeBoth parents foreign-born 344 95.4% Native17 4.6% Foreign-bornOne native, one foreign-born parent 107 100.0% NativeChildren 6 to 17 years - Living with one parent Native parent 993 100.0% NativeForeign-born parent 23 47.4% Native25 52.6% Foreign-born
Grandparents responsible for own grandchildren in Oregon City
Grandparents (30 to 59 years) White / Caucasian 69 38.8% Responsible for grandchildren109 61.2% Not responsible for grandchildrenTwo or more races 10 100.0% Responsible for grandchildrenWhite alone, not Hispanic / Latino 69 53.6% Responsible for grandchildren60 46.4% Not responsible for grandchildrenGrandparents (60 years and over) White / Caucasian 131 49.0% Responsible for grandchildren137 51.0% Not responsible for grandchildrenTwo or more races 141 100.0% Responsible for grandchildrenWhite alone, not Hispanic / Latino 131 47.5% Responsible for grandchildren145 52.5% Not responsible for grandchildren