Races in North Adams, Massachusetts (MA) Detailed Stats
Data:
Races - White alone (%)
Races - White alone (% change since 2000)
Races - Black alone (%)
Races - Black alone (% change since 2000)
Races - American Indian alone (%)
Races - American Indian alone (% change since 2000)
Races - Asian alone (%)
Races - Asian alone (% change since 2000)
Races - Hispanic (%)
Races - Hispanic (% change since 2000)
Races - Native Hawaiian and Other Pacific Islander alone (%)
Races - Native Hawaiian and Other Pacific Islander alone (% change since 2000)
Races - Two or more races(%)
Races - Two or more races(% change since 2000)
Races - Other race alone (%)
Races - Other race alone (% change since 2000)
Racial diversity
Place of birth - Born in state of residence (%)
Place of birth - Born in state of residence (%) - White
Place of birth - Born in state of residence (%) - Black or African American
Place of birth - Born in state of residence (%) - Asian
Place of birth - Born in state of residence (%) - Hispanic or Latino
Place of birth - Born in state of residence (%) - American Indian and Alaska Native
Place of birth - Born in state of residence (%) - Multirace
Place of birth - Born in state of residence (%) - Other Race
Place of birth - Born in other state (%)
Place of birth - Born in other state (%) - White
Place of birth - Born in other state (%) - Black or African American
Place of birth - Born in other state (%) - Asian
Place of birth - Born in other state (%) - Hispanic or Latino
Place of birth - Born in other state (%) - American Indian and Alaska Native
Place of birth - Born in other state (%) - Multirace
Place of birth - Born in other state (%) - Other Race
Place of birth - Native, outside of US (%)
Place of birth - Native, outside of US (%) - White
Place of birth - Native, outside of US (%) - Black or African American
Place of birth - Native, outside of US (%) - Asian
Place of birth - Native, outside of US (%) - Hispanic or Latino
Place of birth - Native, outside of US (%) - American Indian and Alaska Native
Place of birth - Native, outside of US (%) - Multirace
Place of birth - Native, outside of US (%) - Other Race
Place of birth - Foreign born (%)
Place of birth - Foreign born (%) - White
Place of birth - Foreign born (%) - Black or African American
Place of birth - Foreign born (%) - Asian
Place of birth - Foreign born (%) - Hispanic or Latino
Place of birth - Foreign born (%) - American Indian and Alaska Native
Place of birth - Foreign born (%) - Multirace
Place of birth - Foreign born (%) - Other Race
Residents speaking English at home (%)
Residents speaking English at home - Born in the United States (%)
Residents speaking English at home - Native, born elsewhere (%)
Residents speaking English at home - Foreign born (%)
Residents speaking Spanish at home (%)
Residents speaking Spanish at home - Born in the United States (%)
Residents speaking Spanish at home - Native, born elsewhere (%)
Residents speaking Spanish at home - Foreign born (%)
Residents speaking other language at home (%)
Residents speaking other language at home - Born in the United States (%)
Residents speaking other language at home - Native, born elsewhere (%)
Residents speaking other language at home - Foreign born (%)
Marital status - Never married (%)
Marital status - Now married (%)
Marital status - Separated (%)
Marital status - Widowed (%)
Marital status - Divorced (%)
Ancestries Reported - Arab (%)
Ancestries Reported - Czech (%)
Ancestries Reported - Danish (%)
Ancestries Reported - Dutch (%)
Ancestries Reported - English (%)
Ancestries Reported - French (%)
Ancestries Reported - French Canadian (%)
Ancestries Reported - German (%)
Ancestries Reported - Greek (%)
Ancestries Reported - Hungarian (%)
Ancestries Reported - Irish (%)
Ancestries Reported - Italian (%)
Ancestries Reported - Lithuanian (%)
Ancestries Reported - Norwegian (%)
Ancestries Reported - Polish (%)
Ancestries Reported - Portuguese (%)
Ancestries Reported - Russian (%)
Ancestries Reported - Scotch-Irish (%)
Ancestries Reported - Scottish (%)
Ancestries Reported - Slovak (%)
Ancestries Reported - Subsaharan African (%)
Ancestries Reported - Swedish (%)
Ancestries Reported - Swiss (%)
Ancestries Reported - Ukrainian (%)
Ancestries Reported - United States (%)
Ancestries Reported - Welsh (%)
Ancestries Reported - West Indian (%)
Ancestries Reported - Other (%)
Geographical mobility - Same house 1 year ago (%)
Geographical mobility - Same house 1 year ago (%) - White
Geographical mobility - Same house 1 year ago (%) - Black or African American
Geographical mobility - Same house 1 year ago (%) - Asian
Geographical mobility - Same house 1 year ago (%) - Hispanic or Latino
Geographical mobility - Same house 1 year ago (%) - American Indian and Alaska Native
Geographical mobility - Same house 1 year ago (%) - Multirace
Geographical mobility - Same house 1 year ago (%) - Other Race
Geographical mobility - Moved within same county (%)
Geographical mobility - Moved within same county (%) - White
Geographical mobility - Moved within same county (%) - Black or African American
Geographical mobility - Moved within same county (%) - Asian
Geographical mobility - Moved within same county (%) - Hispanic or Latino
Geographical mobility - Moved within same county (%) - American Indian and Alaska Native
Geographical mobility - Moved within same county (%) - Multirace
Geographical mobility - Moved within same county (%) - Other Race
Geographical mobility - Moved from different county within same state (%)
Geographical mobility - Moved from different county within same state (%) - White
Geographical mobility - Moved from different county within same state (%) - Black or African American
Geographical mobility - Moved from different county within same state (%) - Asian
Geographical mobility - Moved from different county within same state (%) - Hispanic or Latino
Geographical mobility - Moved from different county within same state (%) - American Indian and Alaska Native
Geographical mobility - Moved from different county within same state (%) - Multirace
Geographical mobility - Moved from different county within same state (%) - Other Race
Geographical mobility - Moved from different state (%)
Geographical mobility - Moved from different state (%) - White
Geographical mobility - Moved from different state (%) - Black or African American
Geographical mobility - Moved from different state (%) - Asian
Geographical mobility - Moved from different state (%) - Hispanic or Latino
Geographical mobility - Moved from different state (%) - American Indian and Alaska Native
Geographical mobility - Moved from different state (%) - Multirace
Geographical mobility - Moved from different state (%) - Other Race
Geographical mobility - Moved from abroad (%)
Geographical mobility - Moved from abroad (%) - White
Geographical mobility - Moved from abroad (%) - Black or African American
Geographical mobility - Moved from abroad (%) - Asian
Geographical mobility - Moved from abroad (%) - Hispanic or Latino
Geographical mobility - Moved from abroad (%) - American Indian and Alaska Native
Geographical mobility - Moved from abroad (%) - Multirace
Geographical mobility - Moved from abroad (%) - Other Race
Place of birth for the foreign-born population - Ireland (%)
Place of birth for the foreign-born population - Denmark (%)
Place of birth for the foreign-born population - Norway (%)
Place of birth for the foreign-born population - Sweden (%)
Place of birth for the foreign-born population - United Kingdom (%)
Place of birth for the foreign-born population - England (%)
Place of birth for the foreign-born population - Scotland (%)
Place of birth for the foreign-born population - Other Northern Europe (%)
Place of birth for the foreign-born population - Austria (%)
Place of birth for the foreign-born population - Belgium (%)
Place of birth for the foreign-born population - France (%)
Place of birth for the foreign-born population - Germany (%)
Place of birth for the foreign-born population - Netherlands (%)
Place of birth for the foreign-born population - Switzerland (%)
Place of birth for the foreign-born population - Other Western Europe (%)
Place of birth for the foreign-born population - Greece (%)
Place of birth for the foreign-born population - Italy (%)
Place of birth for the foreign-born population - Portugal (%)
Place of birth for the foreign-born population - Spain (%)
Place of birth for the foreign-born population - Other Southern Europe (%)
Place of birth for the foreign-born population - Albania (%)
Place of birth for the foreign-born population - Belarus (%)
Place of birth for the foreign-born population - Bosnia and Herzegovina (%)
Place of birth for the foreign-born population - Bulgaria (%)
Place of birth for the foreign-born population - Croatia (%)
Place of birth for the foreign-born population - Czechoslovakia (%)
Place of birth for the foreign-born population - Hungary (%)
Place of birth for the foreign-born population - Latvia (%)
Place of birth for the foreign-born population - Lithuania (%)
Place of birth for the foreign-born population - North Macedonia (Macedonia) (%)
Place of birth for the foreign-born population - Moldova (%)
Place of birth for the foreign-born population - Poland (%)
Place of birth for the foreign-born population - Romania (%)
Place of birth for the foreign-born population - Russia (%)
Place of birth for the foreign-born population - Serbia (%)
Place of birth for the foreign-born population - Ukraine (%)
Place of birth for the foreign-born population - Other Eastern Europe (%)
Place of birth for the foreign-born population - China (%)
Place of birth for the foreign-born population - Hong Kong (%)
Place of birth for the foreign-born population - Taiwan (%)
Place of birth for the foreign-born population - Japan (%)
Place of birth for the foreign-born population - Korea (%)
Place of birth for the foreign-born population - Other Eastern Asia (%)
Place of birth for the foreign-born population - Afghanistan (%)
Place of birth for the foreign-born population - Bangladesh (%)
Place of birth for the foreign-born population - India (%)
Place of birth for the foreign-born population - Iran (%)
Place of birth for the foreign-born population - Kazakhstan (%)
Place of birth for the foreign-born population - Nepal (%)
Place of birth for the foreign-born population - Pakistan (%)
Place of birth for the foreign-born population - Sri Lanka (%)
Place of birth for the foreign-born population - Uzbekistan (%)
Place of birth for the foreign-born population - Other South Central Asia (%)
Place of birth for the foreign-born population - Burma (%)
Place of birth for the foreign-born population - Cambodia (%)
Place of birth for the foreign-born population - Indonesia (%)
Place of birth for the foreign-born population - Laos (%)
Place of birth for the foreign-born population - Malaysia (%)
Place of birth for the foreign-born population - Philippines (%)
Place of birth for the foreign-born population - Singapore (%)
Place of birth for the foreign-born population - Thailand (%)
Place of birth for the foreign-born population - Vietnam (%)
Place of birth for the foreign-born population - Other South Eastern Asia (%)
Place of birth for the foreign-born population - Armenia (%)
Place of birth for the foreign-born population - Iraq (%)
Place of birth for the foreign-born population - Israel (%)
Place of birth for the foreign-born population - Jordan (%)
Place of birth for the foreign-born population - Kuwait (%)
Place of birth for the foreign-born population - Lebanon (%)
Place of birth for the foreign-born population - Saudi Arabia (%)
Place of birth for the foreign-born population - Syria (%)
Place of birth for the foreign-born population - Turkey (%)
Place of birth for the foreign-born population - Yemen (%)
Place of birth for the foreign-born population - Other Western Asia (%)
Place of birth for the foreign-born population - Eritrea (%)
Place of birth for the foreign-born population - Ethiopia (%)
Place of birth for the foreign-born population - Kenya (%)
Place of birth for the foreign-born population - Somalia (%)
Place of birth for the foreign-born population - Uganda (%)
Place of birth for the foreign-born population - Zimbabwe (%)
Place of birth for the foreign-born population - Other Eastern Africa (%)
Place of birth for the foreign-born population - Cameroon (%)
Place of birth for the foreign-born population - Congo (%)
Place of birth for the foreign-born population - Democratic Republic of Congo (Zaire) (%)
Place of birth for the foreign-born population - Other Middle Africa (%)
Place of birth for the foreign-born population - Egypt (%)
Place of birth for the foreign-born population - Morocco (%)
Place of birth for the foreign-born population - Sudan (%)
Place of birth for the foreign-born population - Other Northern Africa (%)
Place of birth for the foreign-born population - South Africa (%)
Place of birth for the foreign-born population - Other Southern Africa (%)
Place of birth for the foreign-born population - Cabo Verde (%)
Place of birth for the foreign-born population - Ghana (%)
Place of birth for the foreign-born population - Liberia (%)
Place of birth for the foreign-born population - Nigeria (%)
Place of birth for the foreign-born population - Senegal (%)
Place of birth for the foreign-born population - Sierra Leone (%)
Place of birth for the foreign-born population - Other Western Africa (%)
Place of birth for the foreign-born population - Australia (%)
Place of birth for the foreign-born population - New Zealand (%)
Place of birth for the foreign-born population - Fiji (%)
Place of birth for the foreign-born population - Micronesia (%)
Place of birth for the foreign-born population - Bahamas (%)
Place of birth for the foreign-born population - Barbados (%)
Place of birth for the foreign-born population - Cuba (%)
Place of birth for the foreign-born population - Dominica (%)
Place of birth for the foreign-born population - Dominican Republic (%)
Place of birth for the foreign-born population - Grenada (%)
Place of birth for the foreign-born population - Haiti (%)
Place of birth for the foreign-born population - Jamaica (%)
Place of birth for the foreign-born population - St. Vincent and the Grenadines (%)
Place of birth for the foreign-born population - Trinidad and Tobago (%)
Place of birth for the foreign-born population - West Indies (%)
Place of birth for the foreign-born population - Other Caribbean (%)
Place of birth for the foreign-born population - Belize (%)
Place of birth for the foreign-born population - Costa Rica (%)
Place of birth for the foreign-born population - El Salvador (%)
Place of birth for the foreign-born population - Guatemala (%)
Place of birth for the foreign-born population - Honduras (%)
Place of birth for the foreign-born population - Mexico (%)
Place of birth for the foreign-born population - Nicaragua (%)
Place of birth for the foreign-born population - Panama (%)
Place of birth for the foreign-born population - Other Central America (%)
Place of birth for the foreign-born population - Argentina (%)
Place of birth for the foreign-born population - Bolivia (%)
Place of birth for the foreign-born population - Brazil (%)
Place of birth for the foreign-born population - Chile (%)
Place of birth for the foreign-born population - Colombia (%)
Place of birth for the foreign-born population - Ecuador (%)
Place of birth for the foreign-born population - Guyana (%)
Place of birth for the foreign-born population - Peru (%)
Place of birth for the foreign-born population - Uruguay (%)
Place of birth for the foreign-born population - Venezuela (%)
Place of birth for the foreign-born population - Other South America (%)
Place of birth for the foreign-born population - Canada (%)
Place of birth for the foreign-born population - Other Northern America (%)
Place of birth for the foreign-born population - Other (%)
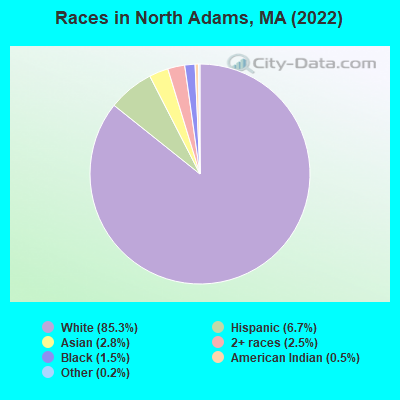
According to 2022 data, the most numerous races in North Adams, MA are White alone (10,955 residents), Hispanic (861 residents), and Asian alone (359 residents). 92.0% of North Adams residents speak English at home. 6.0% of North Adams, MA residents are foreign-born (3.7% born in Asia, 1.3% born in Latin America), which is 198.4% less than the foreign-born rate of 18.0% across the entire state of Massachusetts.
Race distribution in North Adams
2000 2022
5,198,359 81.9% White alone 428,729 6.8% Hispanic 318,329 5.0% Black alone 236,786 3.7% Asian alone 110,338 1.7% Two or more races 43,586 0.7% Other race alone 11,264 0.2% American Indian alone 1,706 0.03% Native Hawaiian and Other
4,676,627 67.0% White alone 911,038 13.0% Hispanic 501,463 7.2% Asian alone 459,740 6.6% Black alone 341,889 4.9% Two or more races 84,403 1.2% Other race alone 5,838 0.08% American Indian alone 976 0.01% Native Hawaiian and Other
Income and house value in North Adams Median household income in 2022 $53,758 White non-Hispanic householders$91,198 Some other race householders$45,217 Two or more races householders$69,559 Hispanic or Latino race householdersMedian 2022 house value $197,606 White Non-Hispanic householders$170,962 Black or African American householders$188,725 American Indian or Alaska Native householders $360,797 Asian householders$76,378 Some other race householders$84,371 Two or more races householders$162,747 Hispanic or Latino householders
Median age by race in North Adams
47.2 Median age for White residents47.4 47.5 26.4 Median age for Black or African American residents53.3 8.7 12.0 Median age for American Indian / Alaska Native residents12.2 -657,223,795.4 28.4 Median age for Asian residents28.7 55.1 -514,227,641.8 Median age for Native Hawaiian / Pacific Islander residents-666,666,666.0 -666,666,666.0 30.3 Median age for Other race residents30.8 17.3 28.7 Median age for Two or more races residents57.9 12.2 47.8 Median age for White alone residents48.7 48.2 27.4 Median age for Hispanic or Latino residents31.0 23.8
Owner/renter occupied households by race in North Adams
House owners and renters - White residents 3,222 57.0% Owner occupied2,430 43.0% Renter occupiedHouse owners and renters - Black or African American residents 17 100.0% Renter occupiedHouse owners and renters - American Indian / Alaska Native residents 8 60.6% Owner occupied6 39.4% Renter occupiedHouse owners and renters - Asian residents 31 25.4% Owner occupied92 74.6% Renter occupiedHouse owners and renters - Other race residents 26 26.7% Owner occupied71 73.3% Renter occupiedHouse owners and renters - Two or more races residents 51 55.2% Owner occupied42 44.8% Renter occupiedHouse owners and renters - White alone residents 3,214 57.6% Owner occupied2,364 42.4% Renter occupiedHouse owners and renters - Hispanic or Latino residents 27 11.3% Owner occupied210 88.7% Renter occupied
Language usage in North Adams
English speakers - Total 92.0% of residents of North Adams speak English at home.
4.2% of residents speak Spanish at home 234 44.8% Speak English very well288 55.2% Speak English less than very well4.0% of residents speak other language at home 347 71.1% Speak English very well141 28.9% Speak English less than very well
English speakers - Born in the United States 97.9% of residents of North Adams speak English at home.
0.8% of residents speak Spanish at home 5 19.2% Speak English very well21 80.8% Speak English less than very well0.6% of residents speak other language at home 18 100.0% Speak English very well
English speakers - Native, born elsewhere 20.2% of residents of North Adams speak English at home.
95.6% of residents speak Spanish at home 63 28.9% Speak English very well155 71.1% Speak English less than very well2.2% of residents speak other language at home 5 100.0% Speak English very well
English speakers - Foreign-born 29.9% of residents of North Adams speak English at home.
19.4% of residents speak Spanish at home 87 54.0% Speak English very well74 46.0% Speak English less than very well46.7% of residents speak other language at home 281 72.4% Speak English very well107 27.6% Speak English less than very well
White (Caucasian) - Speak only English Native:
99.1% (10,561)Foreign-born:
21.0% (28)
White (Caucasian) - Speak another language Native:
1.1% (118)Foreign-born:
81.6% (109)
Black or African American - Speak only English Native:
40.7% (59)Foreign-born:
63.1% (35)
Black or African American - Speak another language Native:
55.5% (80)Foreign-born:
40.0% (22)
Asian - Speak only English Native:
41.8% (3)Foreign-born:
23.5% (93)
Asian - Speak another language Native:
48.9% (4)Foreign-born:
72.1% (284)
Other race - Speak another language Native:
72.0% (146)Foreign-born:
99.0% (171)
White alone - Speak only English Native:
99.5% (10,438)Foreign-born:
22.5% (29)
White alone - Speak another language Native:
0.8% (79)Foreign-born:
81.6% (104)
Hispanic or Latino - Speak only English Native:
49.1% (263)Foreign-born:
9.1% (18)
Hispanic or Latino - Speak another language Native:
50.3% (269)Foreign-born:
88.7% (175)
Foreign-born residents in North Adams 775 residents are foreign born (3.7% Asia , 1.3% Latin America ).
This city:
6.0%Massachusetts:
17.6%
Marital status for residents in North Adams Marital status - White (Caucasian) population 15 years and over
Males 42.3% Never married37.5% Now married2.0% Separated5.8% Widowed12.4% DivorcedFemales 32.3% Never married39.0% Now married3.2% Separated9.6% Widowed15.9% DivorcedWomen who gave birth in the past 12 months Now married:
40.6% (74)Unmarried:
59.4% (108)
Women who did not give birth in the past 12 months Now married:
29.5% (663)Unmarried:
70.5% (1,581)
Marital status - Black or African American population 15 years and over
Males 89.2% Never married0.0% Now married0.0% Separated0.0% Widowed10.8% DivorcedFemales 100.0% Never married0.0% Now married0.0% Separated0.0% Widowed0.0% DivorcedWomen who did not give birth in the past 12 months Now married:
0.0% (0)Unmarried:
100.0% (36)
Marital status - Asian population 15 years and over
Males 85.0% Never married15.0% Now married0.0% Separated0.0% Widowed0.0% DivorcedFemales 41.6% Never married12.9% Now married0.0% Separated0.0% Widowed45.5% DivorcedWomen who did not give birth in the past 12 months Now married:
0.0% (0)Unmarried:
100.0% (181)
Marital status - Other race population 15 years and over
Males 66.5% Never married14.8% Now married0.0% Separated0.0% Widowed18.7% DivorcedFemales 50.6% Never married30.4% Now married0.0% Separated19.0% Widowed0.0% DivorcedWomen who gave birth in the past 12 months Now married:
0.0% (0)Unmarried:
100.0% (40)
Women who did not give birth in the past 12 months Now married:
77.4% (29)Unmarried:
22.6% (9)
Marital status - Two or more races population 15 years and over
Males 77.7% Never married17.3% Now married0.0% Separated0.0% Widowed5.1% DivorcedFemales 100.0% Never married0.0% Now married0.0% Separated0.0% Widowed0.0% DivorcedWomen who did not give birth in the past 12 months Now married:
0.0% (0)Unmarried:
100.0% (77)
Marital status - White alone, not Hispanic / Latino population 15 years and over
Males 41.5% Never married37.8% Now married2.0% Separated6.0% Widowed12.7% DivorcedFemales 32.0% Never married39.2% Now married3.2% Separated9.7% Widowed15.9% DivorcedWomen who gave birth in the past 12 months Now married:
40.6% (74)Unmarried:
59.4% (109)
Women who did not give birth in the past 12 months Now married:
29.8% (669)Unmarried:
70.2% (1,572)
Marital status - Hispanic or Latino population 15 years and over
Males 72.1% Never married16.2% Now married0.0% Separated0.0% Widowed11.7% DivorcedFemales 72.8% Never married15.2% Now married0.0% Separated9.5% Widowed2.5% DivorcedWomen who gave birth in the past 12 months Now married:
0.0% (0)Unmarried:
100.0% (34)
Women who did not give birth in the past 12 months Now married:
26.7% (25)Unmarried:
73.3% (68)
Ancestries in North Adams
748 13.4% Italian608 10.9% English577 10.3% French308 5.5% American303 5.4% Irish249 4.5% French Canadian241 4.3% German161 2.9% Polish132 2.4% European65 1.2% Canadian54 1.0% Norwegian35 0.6% Lebanese29 0.5% Dutch29 0.5% Scandinavian28 0.5% Eastern European25 0.4% Swiss24 0.4% Northern European22 0.4% British22 0.4% Romanian17 0.3% Danish14 0.3% Turkish13 0.2% Russian12 0.2% Scotch-Irish11 0.2% Haitian9 0.2% Greek8 0.1% Lithuanian7 0.1% Austrian6 0.1% Guyanese5 0.09% Portuguese4 0.07% Scottish3 0.05% Finnish
Children Nativity (place of birth) in North Adams
Children under 6 years - Living with two parents Both parents native 208 100.0% NativeChildren under 6 years - Living with one parent Native parent 319 100.0% NativeChildren 6 to 17 years - Living with two parents Both parents native 681 92.3% Native57 7.7% Foreign-bornBoth parents foreign-born 6 100.0% NativeOne native, one foreign-born parent 28 100.0% NativeChildren 6 to 17 years - Living with one parent Native parent 446 82.3% Native96 17.7% Foreign-bornForeign-born parent 94 100.0% Native
Grandparents responsible for own grandchildren in North Adams
Grandparents (30 to 59 years) White / Caucasian 23 39.9% Responsible for grandchildren34 60.1% Not responsible for grandchildrenWhite alone, not Hispanic / Latino 25 40.3% Responsible for grandchildren38 59.7% Not responsible for grandchildren
Grandparents (60 years and over) White / Caucasian 90 100.0% Responsible for grandchildrenWhite alone, not Hispanic / Latino 93 100.0% Responsible for grandchildren