Races in Myrtle Beach, South Carolina (SC) Detailed Stats
Data:
Races - White alone (%)
Races - White alone (% change since 2000)
Races - Black alone (%)
Races - Black alone (% change since 2000)
Races - American Indian alone (%)
Races - American Indian alone (% change since 2000)
Races - Asian alone (%)
Races - Asian alone (% change since 2000)
Races - Hispanic (%)
Races - Hispanic (% change since 2000)
Races - Native Hawaiian and Other Pacific Islander alone (%)
Races - Native Hawaiian and Other Pacific Islander alone (% change since 2000)
Races - Two or more races(%)
Races - Two or more races(% change since 2000)
Races - Other race alone (%)
Races - Other race alone (% change since 2000)
Racial diversity
Place of birth - Born in state of residence (%)
Place of birth - Born in state of residence (%) - White
Place of birth - Born in state of residence (%) - Black or African American
Place of birth - Born in state of residence (%) - Asian
Place of birth - Born in state of residence (%) - Hispanic or Latino
Place of birth - Born in state of residence (%) - American Indian and Alaska Native
Place of birth - Born in state of residence (%) - Multirace
Place of birth - Born in state of residence (%) - Other Race
Place of birth - Born in other state (%)
Place of birth - Born in other state (%) - White
Place of birth - Born in other state (%) - Black or African American
Place of birth - Born in other state (%) - Asian
Place of birth - Born in other state (%) - Hispanic or Latino
Place of birth - Born in other state (%) - American Indian and Alaska Native
Place of birth - Born in other state (%) - Multirace
Place of birth - Born in other state (%) - Other Race
Place of birth - Native, outside of US (%)
Place of birth - Native, outside of US (%) - White
Place of birth - Native, outside of US (%) - Black or African American
Place of birth - Native, outside of US (%) - Asian
Place of birth - Native, outside of US (%) - Hispanic or Latino
Place of birth - Native, outside of US (%) - American Indian and Alaska Native
Place of birth - Native, outside of US (%) - Multirace
Place of birth - Native, outside of US (%) - Other Race
Place of birth - Foreign born (%)
Place of birth - Foreign born (%) - White
Place of birth - Foreign born (%) - Black or African American
Place of birth - Foreign born (%) - Asian
Place of birth - Foreign born (%) - Hispanic or Latino
Place of birth - Foreign born (%) - American Indian and Alaska Native
Place of birth - Foreign born (%) - Multirace
Place of birth - Foreign born (%) - Other Race
Residents speaking English at home (%)
Residents speaking English at home - Born in the United States (%)
Residents speaking English at home - Native, born elsewhere (%)
Residents speaking English at home - Foreign born (%)
Residents speaking Spanish at home (%)
Residents speaking Spanish at home - Born in the United States (%)
Residents speaking Spanish at home - Native, born elsewhere (%)
Residents speaking Spanish at home - Foreign born (%)
Residents speaking other language at home (%)
Residents speaking other language at home - Born in the United States (%)
Residents speaking other language at home - Native, born elsewhere (%)
Residents speaking other language at home - Foreign born (%)
Marital status - Never married (%)
Marital status - Now married (%)
Marital status - Separated (%)
Marital status - Widowed (%)
Marital status - Divorced (%)
Ancestries Reported - Arab (%)
Ancestries Reported - Czech (%)
Ancestries Reported - Danish (%)
Ancestries Reported - Dutch (%)
Ancestries Reported - English (%)
Ancestries Reported - French (%)
Ancestries Reported - French Canadian (%)
Ancestries Reported - German (%)
Ancestries Reported - Greek (%)
Ancestries Reported - Hungarian (%)
Ancestries Reported - Irish (%)
Ancestries Reported - Italian (%)
Ancestries Reported - Lithuanian (%)
Ancestries Reported - Norwegian (%)
Ancestries Reported - Polish (%)
Ancestries Reported - Portuguese (%)
Ancestries Reported - Russian (%)
Ancestries Reported - Scotch-Irish (%)
Ancestries Reported - Scottish (%)
Ancestries Reported - Slovak (%)
Ancestries Reported - Subsaharan African (%)
Ancestries Reported - Swedish (%)
Ancestries Reported - Swiss (%)
Ancestries Reported - Ukrainian (%)
Ancestries Reported - United States (%)
Ancestries Reported - Welsh (%)
Ancestries Reported - West Indian (%)
Ancestries Reported - Other (%)
Geographical mobility - Same house 1 year ago (%)
Geographical mobility - Same house 1 year ago (%) - White
Geographical mobility - Same house 1 year ago (%) - Black or African American
Geographical mobility - Same house 1 year ago (%) - Asian
Geographical mobility - Same house 1 year ago (%) - Hispanic or Latino
Geographical mobility - Same house 1 year ago (%) - American Indian and Alaska Native
Geographical mobility - Same house 1 year ago (%) - Multirace
Geographical mobility - Same house 1 year ago (%) - Other Race
Geographical mobility - Moved within same county (%)
Geographical mobility - Moved within same county (%) - White
Geographical mobility - Moved within same county (%) - Black or African American
Geographical mobility - Moved within same county (%) - Asian
Geographical mobility - Moved within same county (%) - Hispanic or Latino
Geographical mobility - Moved within same county (%) - American Indian and Alaska Native
Geographical mobility - Moved within same county (%) - Multirace
Geographical mobility - Moved within same county (%) - Other Race
Geographical mobility - Moved from different county within same state (%)
Geographical mobility - Moved from different county within same state (%) - White
Geographical mobility - Moved from different county within same state (%) - Black or African American
Geographical mobility - Moved from different county within same state (%) - Asian
Geographical mobility - Moved from different county within same state (%) - Hispanic or Latino
Geographical mobility - Moved from different county within same state (%) - American Indian and Alaska Native
Geographical mobility - Moved from different county within same state (%) - Multirace
Geographical mobility - Moved from different county within same state (%) - Other Race
Geographical mobility - Moved from different state (%)
Geographical mobility - Moved from different state (%) - White
Geographical mobility - Moved from different state (%) - Black or African American
Geographical mobility - Moved from different state (%) - Asian
Geographical mobility - Moved from different state (%) - Hispanic or Latino
Geographical mobility - Moved from different state (%) - American Indian and Alaska Native
Geographical mobility - Moved from different state (%) - Multirace
Geographical mobility - Moved from different state (%) - Other Race
Geographical mobility - Moved from abroad (%)
Geographical mobility - Moved from abroad (%) - White
Geographical mobility - Moved from abroad (%) - Black or African American
Geographical mobility - Moved from abroad (%) - Asian
Geographical mobility - Moved from abroad (%) - Hispanic or Latino
Geographical mobility - Moved from abroad (%) - American Indian and Alaska Native
Geographical mobility - Moved from abroad (%) - Multirace
Geographical mobility - Moved from abroad (%) - Other Race
Place of birth for the foreign-born population - Ireland (%)
Place of birth for the foreign-born population - Denmark (%)
Place of birth for the foreign-born population - Norway (%)
Place of birth for the foreign-born population - Sweden (%)
Place of birth for the foreign-born population - United Kingdom (%)
Place of birth for the foreign-born population - England (%)
Place of birth for the foreign-born population - Scotland (%)
Place of birth for the foreign-born population - Other Northern Europe (%)
Place of birth for the foreign-born population - Austria (%)
Place of birth for the foreign-born population - Belgium (%)
Place of birth for the foreign-born population - France (%)
Place of birth for the foreign-born population - Germany (%)
Place of birth for the foreign-born population - Netherlands (%)
Place of birth for the foreign-born population - Switzerland (%)
Place of birth for the foreign-born population - Other Western Europe (%)
Place of birth for the foreign-born population - Greece (%)
Place of birth for the foreign-born population - Italy (%)
Place of birth for the foreign-born population - Portugal (%)
Place of birth for the foreign-born population - Spain (%)
Place of birth for the foreign-born population - Other Southern Europe (%)
Place of birth for the foreign-born population - Albania (%)
Place of birth for the foreign-born population - Belarus (%)
Place of birth for the foreign-born population - Bosnia and Herzegovina (%)
Place of birth for the foreign-born population - Bulgaria (%)
Place of birth for the foreign-born population - Croatia (%)
Place of birth for the foreign-born population - Czechoslovakia (%)
Place of birth for the foreign-born population - Hungary (%)
Place of birth for the foreign-born population - Latvia (%)
Place of birth for the foreign-born population - Lithuania (%)
Place of birth for the foreign-born population - North Macedonia (Macedonia) (%)
Place of birth for the foreign-born population - Moldova (%)
Place of birth for the foreign-born population - Poland (%)
Place of birth for the foreign-born population - Romania (%)
Place of birth for the foreign-born population - Russia (%)
Place of birth for the foreign-born population - Serbia (%)
Place of birth for the foreign-born population - Ukraine (%)
Place of birth for the foreign-born population - Other Eastern Europe (%)
Place of birth for the foreign-born population - China (%)
Place of birth for the foreign-born population - Hong Kong (%)
Place of birth for the foreign-born population - Taiwan (%)
Place of birth for the foreign-born population - Japan (%)
Place of birth for the foreign-born population - Korea (%)
Place of birth for the foreign-born population - Other Eastern Asia (%)
Place of birth for the foreign-born population - Afghanistan (%)
Place of birth for the foreign-born population - Bangladesh (%)
Place of birth for the foreign-born population - India (%)
Place of birth for the foreign-born population - Iran (%)
Place of birth for the foreign-born population - Kazakhstan (%)
Place of birth for the foreign-born population - Nepal (%)
Place of birth for the foreign-born population - Pakistan (%)
Place of birth for the foreign-born population - Sri Lanka (%)
Place of birth for the foreign-born population - Uzbekistan (%)
Place of birth for the foreign-born population - Other South Central Asia (%)
Place of birth for the foreign-born population - Burma (%)
Place of birth for the foreign-born population - Cambodia (%)
Place of birth for the foreign-born population - Indonesia (%)
Place of birth for the foreign-born population - Laos (%)
Place of birth for the foreign-born population - Malaysia (%)
Place of birth for the foreign-born population - Philippines (%)
Place of birth for the foreign-born population - Singapore (%)
Place of birth for the foreign-born population - Thailand (%)
Place of birth for the foreign-born population - Vietnam (%)
Place of birth for the foreign-born population - Other South Eastern Asia (%)
Place of birth for the foreign-born population - Armenia (%)
Place of birth for the foreign-born population - Iraq (%)
Place of birth for the foreign-born population - Israel (%)
Place of birth for the foreign-born population - Jordan (%)
Place of birth for the foreign-born population - Kuwait (%)
Place of birth for the foreign-born population - Lebanon (%)
Place of birth for the foreign-born population - Saudi Arabia (%)
Place of birth for the foreign-born population - Syria (%)
Place of birth for the foreign-born population - Turkey (%)
Place of birth for the foreign-born population - Yemen (%)
Place of birth for the foreign-born population - Other Western Asia (%)
Place of birth for the foreign-born population - Eritrea (%)
Place of birth for the foreign-born population - Ethiopia (%)
Place of birth for the foreign-born population - Kenya (%)
Place of birth for the foreign-born population - Somalia (%)
Place of birth for the foreign-born population - Uganda (%)
Place of birth for the foreign-born population - Zimbabwe (%)
Place of birth for the foreign-born population - Other Eastern Africa (%)
Place of birth for the foreign-born population - Cameroon (%)
Place of birth for the foreign-born population - Congo (%)
Place of birth for the foreign-born population - Democratic Republic of Congo (Zaire) (%)
Place of birth for the foreign-born population - Other Middle Africa (%)
Place of birth for the foreign-born population - Egypt (%)
Place of birth for the foreign-born population - Morocco (%)
Place of birth for the foreign-born population - Sudan (%)
Place of birth for the foreign-born population - Other Northern Africa (%)
Place of birth for the foreign-born population - South Africa (%)
Place of birth for the foreign-born population - Other Southern Africa (%)
Place of birth for the foreign-born population - Cabo Verde (%)
Place of birth for the foreign-born population - Ghana (%)
Place of birth for the foreign-born population - Liberia (%)
Place of birth for the foreign-born population - Nigeria (%)
Place of birth for the foreign-born population - Senegal (%)
Place of birth for the foreign-born population - Sierra Leone (%)
Place of birth for the foreign-born population - Other Western Africa (%)
Place of birth for the foreign-born population - Australia (%)
Place of birth for the foreign-born population - New Zealand (%)
Place of birth for the foreign-born population - Fiji (%)
Place of birth for the foreign-born population - Micronesia (%)
Place of birth for the foreign-born population - Bahamas (%)
Place of birth for the foreign-born population - Barbados (%)
Place of birth for the foreign-born population - Cuba (%)
Place of birth for the foreign-born population - Dominica (%)
Place of birth for the foreign-born population - Dominican Republic (%)
Place of birth for the foreign-born population - Grenada (%)
Place of birth for the foreign-born population - Haiti (%)
Place of birth for the foreign-born population - Jamaica (%)
Place of birth for the foreign-born population - St. Vincent and the Grenadines (%)
Place of birth for the foreign-born population - Trinidad and Tobago (%)
Place of birth for the foreign-born population - West Indies (%)
Place of birth for the foreign-born population - Other Caribbean (%)
Place of birth for the foreign-born population - Belize (%)
Place of birth for the foreign-born population - Costa Rica (%)
Place of birth for the foreign-born population - El Salvador (%)
Place of birth for the foreign-born population - Guatemala (%)
Place of birth for the foreign-born population - Honduras (%)
Place of birth for the foreign-born population - Mexico (%)
Place of birth for the foreign-born population - Nicaragua (%)
Place of birth for the foreign-born population - Panama (%)
Place of birth for the foreign-born population - Other Central America (%)
Place of birth for the foreign-born population - Argentina (%)
Place of birth for the foreign-born population - Bolivia (%)
Place of birth for the foreign-born population - Brazil (%)
Place of birth for the foreign-born population - Chile (%)
Place of birth for the foreign-born population - Colombia (%)
Place of birth for the foreign-born population - Ecuador (%)
Place of birth for the foreign-born population - Guyana (%)
Place of birth for the foreign-born population - Peru (%)
Place of birth for the foreign-born population - Uruguay (%)
Place of birth for the foreign-born population - Venezuela (%)
Place of birth for the foreign-born population - Other South America (%)
Place of birth for the foreign-born population - Canada (%)
Place of birth for the foreign-born population - Other Northern America (%)
Place of birth for the foreign-born population - Other (%)
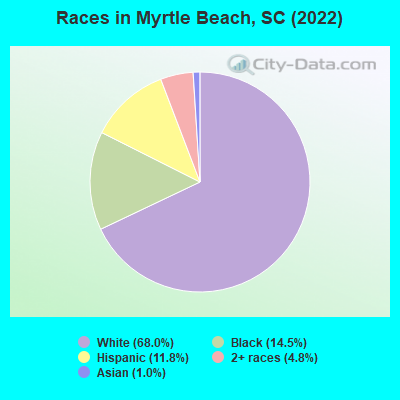
According to 2022 data, the most numerous races in Myrtle Beach, SC are White alone (26,342 residents), Black alone (5,624 residents), and Hispanic (4,578 residents). 86.6% of Myrtle Beach residents speak English at home. 10.5% of Myrtle Beach, SC residents are foreign-born (7.4% born in Latin America, 2.0% born in Europe, 1.2% born in Asia), which is 52.4% greater than the foreign-born rate of 5.0% across the entire state of South Carolina.
Race distribution in Myrtle Beach
2000 2022
2,652,291 66.1% White alone 1,178,486 29.4% Black alone 95,076 2.4% Hispanic 35,568 0.9% Asian alone 33,290 0.8% Two or more races 12,765 0.3% American Indian alone 3,266 0.08% Other race alone 1,270 0.03% Native Hawaiian and Other
3,301,739 62.5% White alone 1,313,290 24.9% Black alone 343,783 6.5% Hispanic 190,508 3.6% Two or more races 89,888 1.7% Asian alone 29,390 0.6% Other race alone 12,112 0.2% American Indian alone 1,924 0.04% Native Hawaiian and Other
Income and house value in Myrtle Beach Median household income in 2022 $58,364 White non-Hispanic householders$29,894 Black householders$57,466 Some other race householders$38,817 Two or more races householders$36,445 Hispanic or Latino race householdersMedian 2022 house value $481,478 White Non-Hispanic householders$248,320 Black or African American householders$252,700 American Indian or Alaska Native householders $915,449 Asian householders$151,620 Native Hawaiian and other Pacific Islander householders$252,700 Some other race householders$456,208 Two or more races householders$254,385 Hispanic or Latino householders
Median age by race in Myrtle Beach
56.3 Median age for White residents53.5 58.8 40.7 Median age for Black or African American residents38.1 41.1 53.1 Median age for American Indian / Alaska Native residents-583,333,332.8 -1,524,366,470.2 31.4 Median age for Asian residents34.0 32.4 -698,412,697.7 Median age for Native Hawaiian / Pacific Islander residents-666,666,666.0 -666,666,666.0 45.4 Median age for Other race residents38.5 45.0 35.1 Median age for Two or more races residents38.1 33.7 57.4 Median age for White alone residents55.3 59.1 26.8 Median age for Hispanic or Latino residents28.9 18.9
Owner/renter occupied households by race in Myrtle Beach
House owners and renters - White residents 9,570 69.1% Owner occupied4,286 30.9% Renter occupiedHouse owners and renters - Black or African American residents 607 27.2% Owner occupied1,623 72.8% Renter occupiedHouse owners and renters - Asian residents 112 92.2% Owner occupied9 7.8% Renter occupiedHouse owners and renters - Native Hawaiian / Pacific Islander residents 7 100.0% Owner occupiedHouse owners and renters - Other race residents 93 52.4% Owner occupied84 47.6% Renter occupiedHouse owners and renters - Two or more races residents 1,048 59.8% Owner occupied703 40.2% Renter occupiedHouse owners and renters - White alone residents 9,418 69.9% Owner occupied4,057 30.1% Renter occupiedHouse owners and renters - Hispanic or Latino residents 914 54.0% Owner occupied777 46.0% Renter occupied
Language usage in Myrtle Beach
English speakers - Total 86.6% of residents of Myrtle Beach speak English at home.
7.9% of residents speak Spanish at home 1,706 58.4% Speak English very well1,215 41.6% Speak English less than very well5.0% of residents speak other language at home 1,387 75.6% Speak English very well447 24.4% Speak English less than very well
English speakers - Born in the United States 96.8% of residents of Myrtle Beach speak English at home.
2.3% of residents speak Spanish at home 473 92.6% Speak English very well38 7.4% Speak English less than very well0.9% of residents speak other language at home 190 100.0% Speak English very well
English speakers - Native, born elsewhere 59.8% of residents of Myrtle Beach speak English at home.
30.1% of residents speak Spanish at home 121 67.6% Speak English very well58 32.4% Speak English less than very well12.3% of residents speak other language at home 73 100.0% Speak English very well
English speakers - Foreign-born 29.8% of residents of Myrtle Beach speak English at home.
36.4% of residents speak Spanish at home 687 41.3% Speak English very well976 58.7% Speak English less than very well31.2% of residents speak other language at home 1,060 74.4% Speak English very well364 25.6% Speak English less than very well
White (Caucasian) - Speak only English Native:
96.2% (23,595)Foreign-born:
44.6% (759)
White (Caucasian) - Speak another language Native:
3.2% (778)Foreign-born:
51.4% (874)
Black or African American - Speak only English Native:
98.8% (4,722)Foreign-born:
53.5% (273)
Black or African American - Speak another language Native:
1.2% (56)Foreign-born:
31.4% (160)
Asian - Speak only English Native:
26.4% (17)Foreign-born:
15.9% (45)
Asian - Speak another language Native:
88.9% (57)Foreign-born:
67.1% (189)
Other race - Speak only English Native:
17.7% (20)Foreign-born:
6.4% (15)
Other race - Speak another language Native:
69.8% (80)Foreign-born:
93.2% (218)
Two or more races - Speak only English Native:
77.1% (2,322)Foreign-born:
4.9% (102)
Two or more races - Speak another language Native:
22.0% (661)Foreign-born:
95.1% (1,971)
White alone - Speak only English Native:
98.0% (23,467)Foreign-born:
47.8% (768)
White alone - Speak another language Native:
1.8% (435)Foreign-born:
51.1% (821)
Hispanic or Latino - Speak only English Native:
50.8% (1,199)Foreign-born:
4.9% (78)
Hispanic or Latino - Speak another language Native:
47.1% (1,110)Foreign-born:
95.2% (1,521)
Foreign-born residents in Myrtle Beach 4,068 residents are foreign born (7.4% Latin America , 2.0% Europe , 1.2% Asia ).
This city:
10.5%South Carolina:
5.3%
Marital status for residents in Myrtle Beach Marital status - White (Caucasian) population 15 years and over
Males 26.4% Never married56.2% Now married1.4% Separated2.0% Widowed14.1% DivorcedFemales 21.3% Never married48.2% Now married2.0% Separated11.6% Widowed17.0% DivorcedWomen who gave birth in the past 12 months Now married:
100.0% (164)Unmarried:
0.0% (0)
Women who did not give birth in the past 12 months Now married:
36.7% (1,662)Unmarried:
63.3% (2,862)
Marital status - Black or African American population 15 years and over
Males 63.4% Never married32.0% Now married0.3% Separated0.0% Widowed4.3% DivorcedFemales 57.6% Never married25.2% Now married1.5% Separated7.7% Widowed8.1% DivorcedWomen who did not give birth in the past 12 months Now married:
25.5% (426)Unmarried:
74.5% (1,244)
Marital status - American Indian / Alaska Native population 15 years and over
Males 0.0% Never married100.0% Now married0.0% Separated0.0% Widowed0.0% DivorcedFemales 0.0% Never married100.0% Now married0.0% Separated0.0% Widowed0.0% DivorcedMarital status - Asian population 15 years and over
Males 11.2% Never married72.4% Now married0.0% Separated0.0% Widowed16.3% DivorcedFemales 25.4% Never married59.8% Now married0.0% Separated4.7% Widowed10.1% DivorcedWomen who did not give birth in the past 12 months Now married:
56.3% (84)Unmarried:
43.7% (65)
Marital status - Other race population 15 years and over
Males 30.2% Never married66.7% Now married0.0% Separated0.0% Widowed3.2% DivorcedFemales 58.8% Never married20.6% Now married11.8% Separated0.0% Widowed8.8% DivorcedWomen who did not give birth in the past 12 months Now married:
28.5% (47)Unmarried:
71.5% (119)
Marital status - Two or more races population 15 years and over
Males 53.5% Never married45.2% Now married0.0% Separated0.1% Widowed1.2% DivorcedFemales 53.5% Never married35.7% Now married1.0% Separated0.6% Widowed9.2% DivorcedWomen who did not give birth in the past 12 months Now married:
30.7% (287)Unmarried:
69.3% (649)
Marital status - White alone, not Hispanic / Latino population 15 years and over
Males 25.3% Never married57.6% Now married0.9% Separated2.1% Widowed14.1% DivorcedFemales 20.6% Never married48.6% Now married1.7% Separated12.0% Widowed17.1% DivorcedWomen who gave birth in the past 12 months Now married:
100.0% (167)Unmarried:
0.0% (0)
Women who did not give birth in the past 12 months Now married:
36.1% (1,567)Unmarried:
63.9% (2,776)
Marital status - Hispanic or Latino population 15 years and over
Males 47.3% Never married45.1% Now married3.2% Separated0.0% Widowed4.3% DivorcedFemales 45.0% Never married33.3% Now married6.0% Separated1.5% Widowed14.1% DivorcedWomen who gave birth in the past 12 months Now married:
100.0% (3)Unmarried:
0.0% (0)
Women who did not give birth in the past 12 months Now married:
39.4% (356)Unmarried:
60.6% (549)
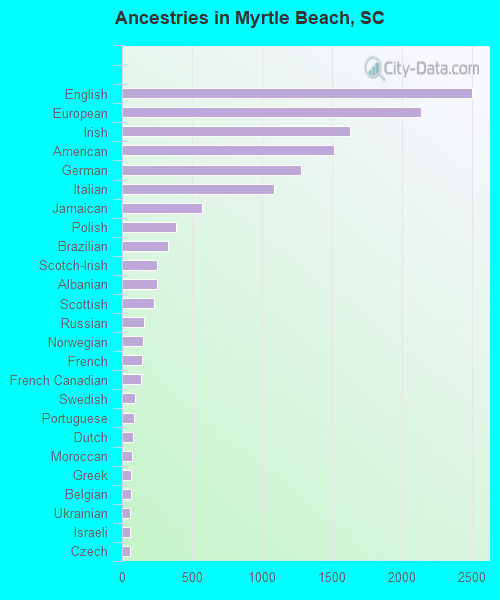
Ancestries in Myrtle Beach
2,500 11.5% English2,142 9.8% European1,630 7.5% Irish1,516 7.0% American1,279 5.9% German1,085 5.0% Italian570 2.6% Jamaican385 1.8% Polish328 1.5% Brazilian251 1.2% Scotch-Irish247 1.1% Albanian226 1.0% Scottish157 0.7% Russian150 0.7% Norwegian145 0.7% French137 0.6% French Canadian93 0.4% Swedish84 0.4% Portuguese77 0.4% Dutch70 0.3% Moroccan65 0.3% Greek62 0.3% Belgian58 0.3% Ukrainian55 0.3% Israeli54 0.2% Czech47 0.2% Eastern European47 0.2% British45 0.2% Slavic43 0.2% Scandinavian42 0.2% Canadian39 0.2% Armenian30 0.1% Bahamian28 0.1% Hungarian28 0.1% Afghan22 0.1% Welsh21 0.10% Danish21 0.10% African18 0.08% Northern European12 0.06% Pennsylvania German10 0.05% Austrian9 0.04% Czechoslovakian2 0.01% Egyptian
Geographical mobility in Myrtle Beach Same house 1 year ago 22,837 83.7% White (Caucasian)5,421 94.5% Black or African American16 50.3% American Indian / Alaska Native141 39.0% Asian6 100.0% Native Hawaiian / Pacific Islander364 92.5% Other race3,675 70.9% Two or more races21,787 83.1% White alone, not Hispanic / Latino3,938 86.5% Hispanic or LatinoMoved within same county 2,070 7.6% White / Caucasian197 3.4% Black or African American128 35.5% Asian25 6.3% Other race275 5.3% Two or more races2,075 7.9% White alone, not Hispanic / Latino29 0.6% Hispanic or LatinoMoved within same state 292 1.1% White / Caucasian43 0.7% Black or African American13 42.3% American Indian / Alaska Native33 0.6% Two or more races298 1.1% White alone, not Hispanic / Latino14 0.3% Hispanic or LatinoMoved from different state 2,035 7.5% White / Caucasian114 2.0% Black or African American81 22.3% Asian935 18.0% Two or more races2,014 7.7% White alone, not Hispanic / Latino395 8.7% Hispanic or LatinoMoved from abroad 51 0.2% White13 0.2% Black or African American1 0.3% Other race53 1.0% Two or more races53 0.2% White alone, not Hispanic / Latino5 0.1% Hispanic or Latino
Children Nativity (place of birth) in Myrtle Beach
Children under 6 years - Living with two parents Both parents native 1,136 100.0% NativeBoth parents foreign-born 182 85.1% Native32 14.9% Foreign-bornOne native, one foreign-born parent 12 100.0% NativeChildren under 6 years - Living with one parent Native parent 482 100.0% NativeForeign-born parent 93 100.0% NativeChildren 6 to 17 years - Living with two parents Both parents native 1,456 100.0% NativeBoth parents foreign-born 206 93.6% Native14 6.4% Foreign-bornOne native, one foreign-born parent 191 93.8% Native13 6.2% Foreign-bornChildren 6 to 17 years - Living with one parent Native parent 1,356 100.0% NativeForeign-born parent 430 51.1% Native412 48.9% Foreign-born
Grandparents responsible for own grandchildren in Myrtle Beach
Grandparents (30 to 59 years) White / Caucasian 13 100.0% Responsible for grandchildrenBlack or African American 23 87.5% Responsible for grandchildren3 12.5% Not responsible for grandchildrenWhite alone, not Hispanic / Latino 14 100.0% Responsible for grandchildrenGrandparents (60 years and over) White / Caucasian 7 3.9% Responsible for grandchildren185 96.1% Not responsible for grandchildrenBlack or African American 48 64.9% Responsible for grandchildren26 35.1% Not responsible for grandchildrenWhite alone, not Hispanic / Latino 8 3.8% Responsible for grandchildren191 96.2% Not responsible for grandchildren